 Brody Kutt1,2
 Rachel Burdorf2,3
 Travaughn Bain4
 Nicardo Cameron2Alexia Pearah2
 Ersoy Subasi5
 David J. Carroll2,6
 Lisa K. Moore2
 Munevver Mine Subasi4*
- 1School of Mathematical Sciences, Rochester Institute of Technology, Rochester, NY, United States
- 2Department of Biomedical and Chemical Engineering and Sciences, Florida Institute of Technology, Melbourne, FL, United States
- 3Biology Department, Colorado College, Colorado Springs, CO, United States
- 4Department of Mathematical Sciences, Florida Institute of Technology, Melbourne, FL, United States
- 5College of Aeronautics, Florida Institute of Technology, Melbourne, FL, United States
- 6Department of Biochemistry and Molecular Genetics, Midwestern University, Glendale, AZ, United States
Survival of patients with metastatic melanoma varies widely. Melanoma is a highly proliferative, chemo-resistant disease. With the recent availability of immunotherapies such as checkpoint inhibitors, durable response rates have improved but are often still limited to 2–3 years. Response rates to treatment range from 30 to 45% with combination therapy however no improvement in overall survival is frequently observed. Of the available therapies, many have targeted the BRAFV600E mutation that results in abnormal MAPK pathway activation which is important for regulating cell proliferation. Immune checkpoint inhibitors such as anti-PD-1 and anti-PD-L1 offer better success but response rates are still low. Identifying biomarkers to better target those who will respond and identify the right combination of treatment is the best approach. In this study, we utilize data from the Cancer Cell Line Encyclopedia (CCLE), including 62 samples, to examine features of gene expression (19K+) and copy number (20K+) in the melanoma cell lines. We perform a clustering analysis on the feature set to assess genetically similarity among the cell lines. We then discover which specific genes and combinations thereof maximize cluster density. We design a feature selection approach for high-dimensional datasets that integrates multiple disparate machine learning techniques into one cohesive pipeline. Our approach provides a small subset of genes that can accurately distinguish between the clusters of melanoma cell lines across multiple types of classifiers. In particular, we find only the 15 highest ranked genes among the original 19 K are necessary to achieve perfect or near-perfect test split classification performance. Of these 15 genes, some are known to be linked to melanoma or other cancer progressions, while others have not previously been linked to melanoma and are of interest for further examination.
1. Introduction
Melanoma can be a devastating disease, one in which incidence is on the rise, and treatment options are limited for the most aggressive forms of the disease. Several gene mutations are widely expressed in melanoma incidences. In particular, the BRAFV600E mutation occurs in ~60% of patients. This mutation results in constitutive activation of BRAF signaling in the ERK/MAP Kinase pathway with a result of increased cell proliferation and survival (Ascierto et al., 2012). Some of the most promising treatments have been developed as selective inhibitors of this or other pathways. However, not all patients exhibit mutations in these pathways and, of those that do, not all respond to these therapies. If they respond initially, they may also not be responsive upon disease recurrence. Malignant melanoma has shown poor durability overall in response to available treatments. This raises the question of what other factors drive treatment response, tumor aggressiveness, and the ability to metastasize from the original primary lesion site. By identifying subset populations of melanoma as distinguished by gene expression, we can gain a greater understanding of the genomic intravariability in melanoma as well as illuminate potential gene therapy targets enabling a patient-powered precision medicine approach to treatment.
One approach to address this question is to profile gene expression using CDNA microarray screening or transcriptome analyses from patient tumor libraries. These have the advantage of providing known information on tumor response to different therapies, tumor staging, prognosis, and survival data. The downside to this approach is limited access to tissues, tissue heterogeneity, and overall tissue availability (Ryu and et al., 2007). Other approaches include the evaluation of melanoma cell line data. Having increased availability of open-access databases with patient and cell line datasets makes this possible. Some related examples of analyses on this kind of data have been to use hierarchical clustering, similarity core analysis, and Elastic Net regression (Ryu and et al., 2007; Garnett and et al., 2012; Covell, 2015; Rambov and et al., 2015). These methods have had some success in the ability to identify potential genes that may be involved in the upregulation of cell proliferation, drug response, and propensity for metastasis to distant sites. Success has been limited due to the inability to have a good correlation of results from one approach to the next. It is clear that general classes of gene products are identifiable, those being effectors of the cell cycle, its checkpoints, apoptosis, cell adhesion, tumor suppressors, and DNA repair. The availability of data through publicly accessible large databases has provided the ability for tailored approaches to data mining and machine learning. Numerous different approaches are highlighted in the literature often as an effort to assess drug sensitivity data with pathway and gene expression clustering (Garnett and et al., 2012; Brubaker et al., 2014; Jang et al., 2014; Covell, 2015). The Cancer Cell Line Encyclopedia (CCLE) (Barretina et al., 2012; Cancer Cell Line Encyclopedia Consortium and Genomics of Drug, 2015) is one such database in which gene expression, copy number, and drug response data are available for over 1,000 cancer cell lines (http://www.broadinstitute.org/ccle/home). Having large datasets available can provide a powerful tool for identifying pathways and gene expressions that are critical in determining prognosis and overall sensitivity to treatments. In this study, we have selected the melanoma cell lines from the high-dimensional CCLE dataset and used various machine learning methods to identify genes of interest that distinguish these 62 cell lines into three discrete clusters. To date, the use of biomarker data from these databases has provided limited success and will require confirmation in biologic systems to determine true correlative benefits. The overall hope is that these analyses will lead to the development of molecular signatures for targeted therapies and the ability to individualize the treatments for the most durable response.
2. Clustering of Melanoma Cell Lines
We used gene expression and copy number features for 62 melanoma cell lines from the CCLE to systematically assess features of interest for distinguishing genomic clusters of melanoma cell lines. CCLE skin cancer data included expression for >19,000 genes, copy number for >20,000 genes and 24 drug sensitivity features. To identify the distinct clusters of the cell lines, we applied the k-means++ (Arthur and Vassilvitskii, 2007) method with feature sets consisting of gene expressions, copy number variations, and their combination. The k-means method is a widely-used clustering technique that seeks to minimize the average squared distance between points in the same cluster. Although it offers no accuracy guarantees, its simplicity and speed are very appealing in practice. The k-means++ method (Arthur and Vassilvitskii, 2007) introduces an algorithm that is O(logk)-competitive with the optimal clustering obtained by augmenting k-means with an improved initialization technique. Computational experiments showed that the augmentation improves both the speed and the accuracy of k-means, often quite dramatically. Likely due to the extreme scarcity and sparseness of our data, more complex clustering techniques did not prove useful.
When plotting a goodness-of-fit metric against the number of clusters specified for the k-means++ algorithm, we can search for a specific number of clusters, k, that corresponds to an abrupt shift in the slope of the error curve—called an elbow-point. The goodness-of-fit metric we use is the within-cluster sum of squares (WCSS) which reflects the sum of Euclidean distances of cluster members to cluster centers. An elbow-point with this metric suggests a natural k in the data such that the clustering explains a large percentage of variability in the data with a small k. Each data point corresponding to each candidate k reflects the results of ten randomized trials. The solution with the minimum error is selected.
As shown in Figure 1A, an elbow-point at approximately five clusters exists when considering the gene expression features alone. In Figure 1B, there was no clear suggestion for the optimal k when considering the copy number variation features alone indicated by a near-straight line in the graph. Combining the copy number variations with the gene expressions, shown in Figure 1C, did not affect the elbow-point seen in Figure 1A nor change the membership of the resulting cluster indices. This suggests that the copy number variation features are poor candidates for diversifying the cell lines. Principal component analysis (PCA) plots corresponding to all three 5-cluster analyses are presented in Figure 2.
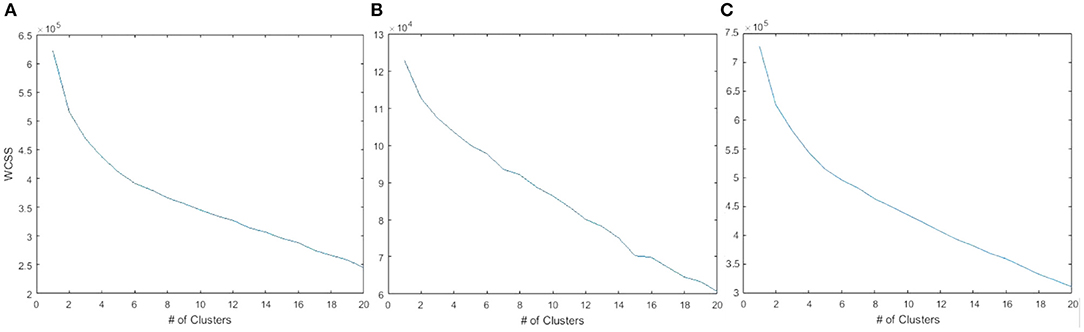
Figure 1. WCSS error plotted against the number of cell clusters. (A) 19 K gene expression features showing an elbow-point at approximately five clusters. (B) 20 K copy number variation features did not show a clear point of inflection. (C) The combined features of gene expression and copy number variation was similar to gene expression alone.
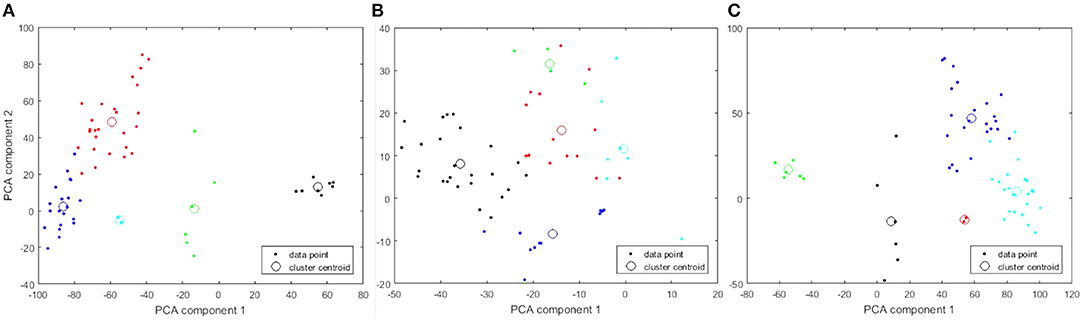
Figure 2. PCA plots of 5-cluster analysis to show how the individual cell lines cluster. Each cluster is identified in a different color. The centroid of each cluster is shown with a large open circle. (A) 19 K gene expression features. (B) 20 K copy number variation features. (C) Combined features.
Information from the American Type Culture Collection (ATCC) suggested the origin of the two cell lines exclusively clustered together in Figures 2A,C were from a single patient. A different cluster of cell lines originated from The Naval Biosciences Laboratory (NBL) collection. Some of those cell lines were removed from the ATCC and aren't fully characterized for morphology or purity. As a result, we removed these two clusters from further analysis. After removal, 49 cell lines remained. Moreover, considering the results across Figures 1, 2, we continued our investigations on the 49 cell lines with the 19 K gene expression features only. Figure 3 displays the WCSS error and PCA plot of the three clusters of 49 cell lines based on gene expression features.
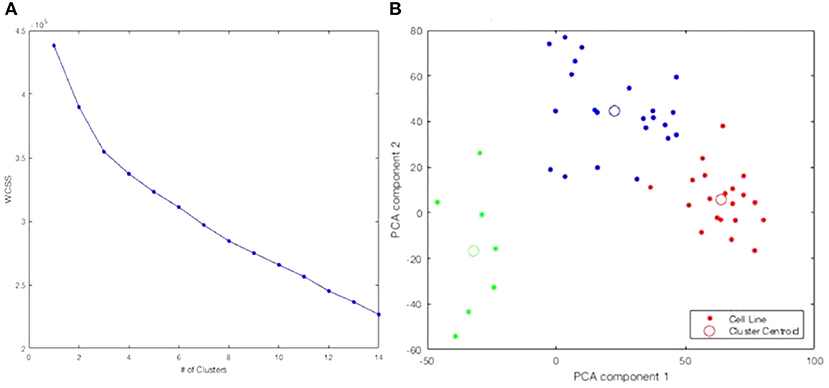
Figure 3. Re-analysis of the 49 cell lines identifies three clusters. (A) WCSS error. (B) PCA plot of 3-clusters of 49 cell lines with 19 K gene expression features: Cluster 1, Cluster 2, Cluster 3.
3. Feature Selection and Classification
To identify the patterns of gene expressions best separating the three clusters, we applied a pipeline of various feature selection and classification methods with cluster index used as the response variable. We tailored our methods to work with our high-dimensional dataset.
3.1. Identification of Most Significant Gene Expressions
Feature selection methods consist of three main groups: filter, wrapper, and embedded methods. Filter methods rank each feature according to some univariate metric with the response variable. Wrapper algorithms search for the best subset of features concerning the classification performance of an underlying model. The wrapper algorithm typically treats the classification algorithm as a black box, such that any classifier is suitable for the wrapper. One can use standard optimization techniques (hill-climbing, simulated annealing, or genetic algorithms) as the wrapper algorithm. Embedded methods search among different feature subsets, but unlike wrappers, the process is embedded into a classification model and takes place naturally as a part of learning the classifier. Decision Trees are a famous example of a classification algorithm with embedded feature selection properties. For more information on feature selection methods and their applications to genomic and proteomic data, refer to Dubitz (2007) and the references therein.
In part because of the high dimensionality and sparseness of the CCLE melanoma data, one is often led to finding entirely different results from applying feature selection on randomized trials or between different algorithms. The results depend entirely on algorithm details and not the structures within the data itself. Also, in part because of the power of various classification algorithms: using a large enough subset of features, even if they are simply randomly selected, can yield good classification accuracy. The classifier can learn patterns in the data that are circumstantial artifacts as opposed to biologically relevant information. We propose that the most general features which distinguish the data will score well across different kinds of feature selection algorithms and will also yield high classification performances across many different types of classifiers. To reach this end, we first employ a statistical univariate technique, called the Fisher Score (Aggarwal, 2014), and a multivariate SVM-based technique, called Support Vector Machine Recursive Feature Elimination Correlation Bias Reduction (Yan and Zhang, 2015), abbreviated as SVM-RFE+CBR, to reduce the feature set size. These reduce the feature set size to a manageable level for running 500 randomized trials of a search algorithm, called Sequential Floating Forward Search (Pudil et al., 1994), abbreviated as SFFS, wrapped around the k-nearest neighbors (KNN) algorithm. Specifically, the objective function of the search is the average test set classification performance of KNN when k is varied from three to nine. We randomize the training and test splits for each trial in the last step. Each random trial of the search algorithm returns a 20 feature subset of the 500 feature pool. We record the features which occur in the results the most often. This procedure consolidates the results from three highly varied algorithms.
Feature Selection Pipeline:
S0. Input Data: 49 melanoma cell lines with 19K gene expression features.
S1. Apply the Fisher Scoring method (univariate correlation-based method extended to multiple features) on Input Data and select the top 500 gene expressions with the highest scores.
S2. Perform the SVM-RFE+CBR method (Yan and Zhang, 2015) on Input Data and select the top 500 gene expressions based on the SVM-RFE+CBR ranking.
S3. Reduced Data: Combine the top 1,000 gene expressions obtained in (S1) and (S2). After eliminating duplicates, the resulting reduced data contains 49 cell lines with 928 gene expressions.
S4. Perform 500 randomized trials of SFFS wrapped around KNN on Reduced Data and record the genes that occur most often in the resulting optimal 20 feature subsets.
S5. Output Data: 49 cell lines with the top 15 genes obtained from the randomized sequential trials of k-Nearest Neighbors in (S4).
The Fisher Score has been used in several studies on genetic datasets due to its computational simplicity (Yang et al., 2016; Sun et al., 2018; Li and Xu, 2019). The Fisher Score of the ith feature is calculated as
where μij and σij are the mean and standard deviation of the ith feature in the jth class, respectively. nj is the number of instances in the jth class while μi is the mean of the ith feature (Aggarwal, 2014). This produces a rank among the features. However, being a function of single features, it does not capture any relationships between features. Support Vector Machine Recursive Feature Elimination (SVM-RFE), originally proposed by Guyon et al. (2002), is an embedded feature selection algorithm that uses criteria derived from the coefficients in SVM models to assess feature importance. The algorithm features a backward search that begins with the full feature set and recursively removes the features with the lowest importance. SVM-RFE+CBR is an extension to SVM-RFE that addresses the problem that the importance of highly correlated features is likely to be underestimated. SVM-RFE+CBR introduces a correlation bias reduction step to reintroduce a representative feature from a correlated group that has been possibly removed entirely due to correlation bias. This is important to capture as our full feature set has a large number of correlations. SFFS, first introduced in Pudil et al. (1994), is a forward search algorithm that begins with the empty set and incrementally adds features based on the objective function, in this case, the classification performance of k-nearest neighbors on the test set. The candidate feature set is floating in the sense that after each forward step, the algorithm performs conditional backward steps. It removes features starting with the one that increases the objective function the most if any such feature exists. The backward steps will continue as long as the objective function increases. The algorithm terminates when the floating subset of features reaches the desired size. This algorithm adds and removes features one at a time, so it is not practical to apply it to all 19 K features.
The features which occurred most often in our randomized trials of SFFS are the features we regard as the most compact and generalizable descriptors of our clusters. Multiple randomized trials help us avoid results emergent from artifacts present in any single run of the feature selection pipeline. The drop in frequency of occurrence among the most frequent genes is very steep as shown in Figure 4.
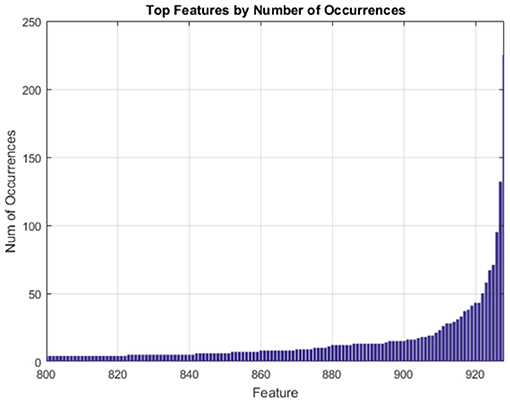
Figure 4. Gene expression features ranked by frequency of occurrence over 500 randomized trials of SFFS.
3.2. Top 15 Most Significant Genes
Our analyses showed that only the top 15 genes obtained from the SFFS algorithm in (S4) were sufficient for perfect or near-perfect classification performance across various classifiers. These genes are displayed in order of frequency (importance) in Table 1. The heatmap of 49 cell-lines with the expression levels of the top 15 genes is shown in Figure 5.
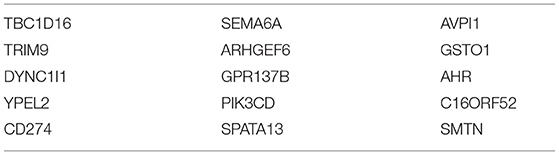
Table 1. Top 15 genes for CCLE skin cell line tumors.
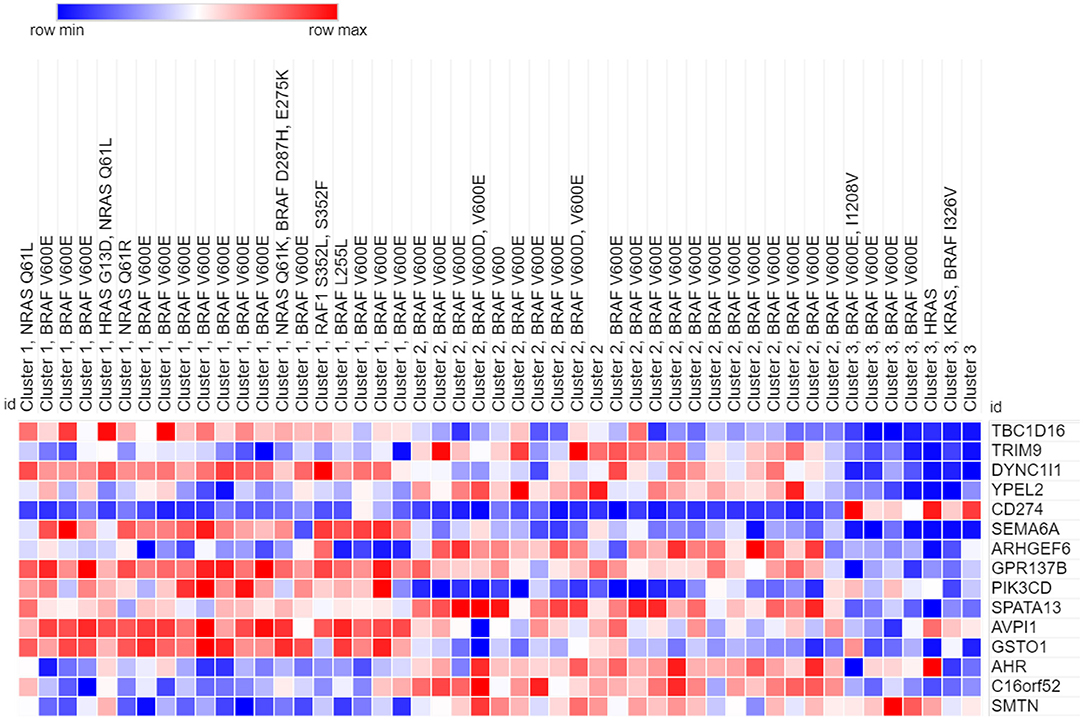
Figure 5. Heatmap of 49 melanoma cell lines with top 15 genes.
Of these 15 genes, some have links to melanoma prognosis. While other genes have links to other cancers, their relationship to melanoma was never previously shown. Here are brief descriptions of some of the genes which have recently been linked to various cancers and have the potential to serve as prognostic biomarkers:
• TBC1D16 a GTPase-activating protein for RAB family proteins is suggested to regulate EGFR in melanoma as a result of a hypomethylation event. This may confer poor survival but at the same time may increase BRAF and MEK response (Vizoso and et al., 2015). Recently it has been linked to epithelial ovarian cancer (EOC) as a positive predictive marker for favorable outcomes for EOC. Impact is thought to be conferred by effects on angiogenesis through vascular endothelial growth factor (VEGF) signaling (Yang et al., 2018). Rodger et al. (2019) have also reported epigenetic changes in DNA methylation in TBC1D16. Loss of methylation was noted in metastatic melanoma when compared to primary tumors. Similar changes in methylation between primary and metastatic tumors were noted in other cancers such as breast, prostate, and colorectal cancer, suggesting that TBC1D16 may be an epigenetic driver for tumor metastasis (Rodger et al., 2019).
• TRIM9 Tripartate motif containing 9 is part of the TRIM family of proteins, several of which are associated with oncogenesis. TRIM9 is expressed normally in brain neurons and recently has been linked to lung cancers. TRIM9 is an ubiquitin ligase and may regulate tumor proliferation through VEGFA and angiogenesis (Wang et al., 2016).
• DYNC1I1 Cytoplasmic Dynein 1 protein regulates intracellular transport and mitotic spindle localization. These activities may promote cell migration and cell cycle progression. Recently it has been reported to play a role in gastric cancer progression (Gong et al., 2019).
• CD274 Gene codes for Programmed death-ligand 1 (PD-L1) which is currently the target of several large trials showing substantial benefit with anti-PD-L1 for late-stage melanoma (Ascierto and Marincola, 2015). PD-L1 expression is associated with overall better response rate and survival when treated with the PD-1 checkpoint inhibitors. PD-L1 is the ligand for PD-1 receptors on T-cells and suppresses anti-tumor T-cell mediated immune responses. CD274/PD-L1 expression is reported in TP53-mutated melanoma, non-small cell lung cancer, colorectal cancer, and renal cell carcinoma (Huang et al., 2018; Thiem et al., 2019).
• PIK3CD The catalytic subunit of phosphoinositide 3-kinase (PI3K) is encoded by PIK3CD. PIK3CD has been reported to be overexpressed in colorectal cancer (CRC) and associated with poor survival and may be a prognostic biomarker for CRC but no relation to melanoma has been observed to date (Chen et al., 2019).
• GSTO1 Glutathione S-transferase omega-1 polymorphisms are associated with the increased risk of developing breast and liver cancer and have very recently been implicated in squamous cell, colorectal, and melanoma as a modulator of cell growth and immune response (Xu et al., 2020). Elevated expression levels of GSTO1 have been correlated with drug resistance.
• AHR The aryl hydrocarbon receptor initially was studied for its role in response to environmental pollution and toxicity. In recent studies it has been identified as playing a key role in malignant cell progression, tumor aggression, and poor prognosis (Wang et al., 2021).
3.3. Validation of the Top 15 Genes
We reran k-means++ clustering on the 49 CCLE skin cancer tumors with the top 15 genes only. We found the elbow-point at exactly three clusters was greatly accentuated as shown in Figure 6A compared to Figure 3A. Figure 6B presents the PCA plot of the three clusters using the top 15 genes. All cell lines clustered together in the same way as when considering all original 19 K genes as previously shown in Figure 3B.
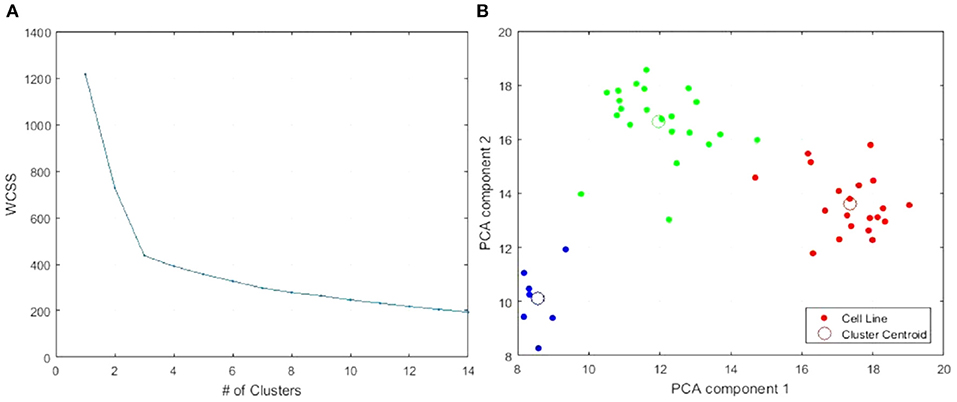
Figure 6. Clustering of the 49 CCLE skin cancer tumors using the top 15 genes only. (A) WCSS error. (B) PCA plot of 3-clusters using only the top 15 genes: Cluster 1, Cluster 2, Cluster 3. The colors are used to distinguish each Cluster. This color scheme is carried through on Table 2 and 5 to make it easy to distinguish each cluster.
Heatmap of the clustered cell lines with top 15 genes is presented in Figure 5. Cluster membership and genomic characterization of the reduced data is shown in Table 2.
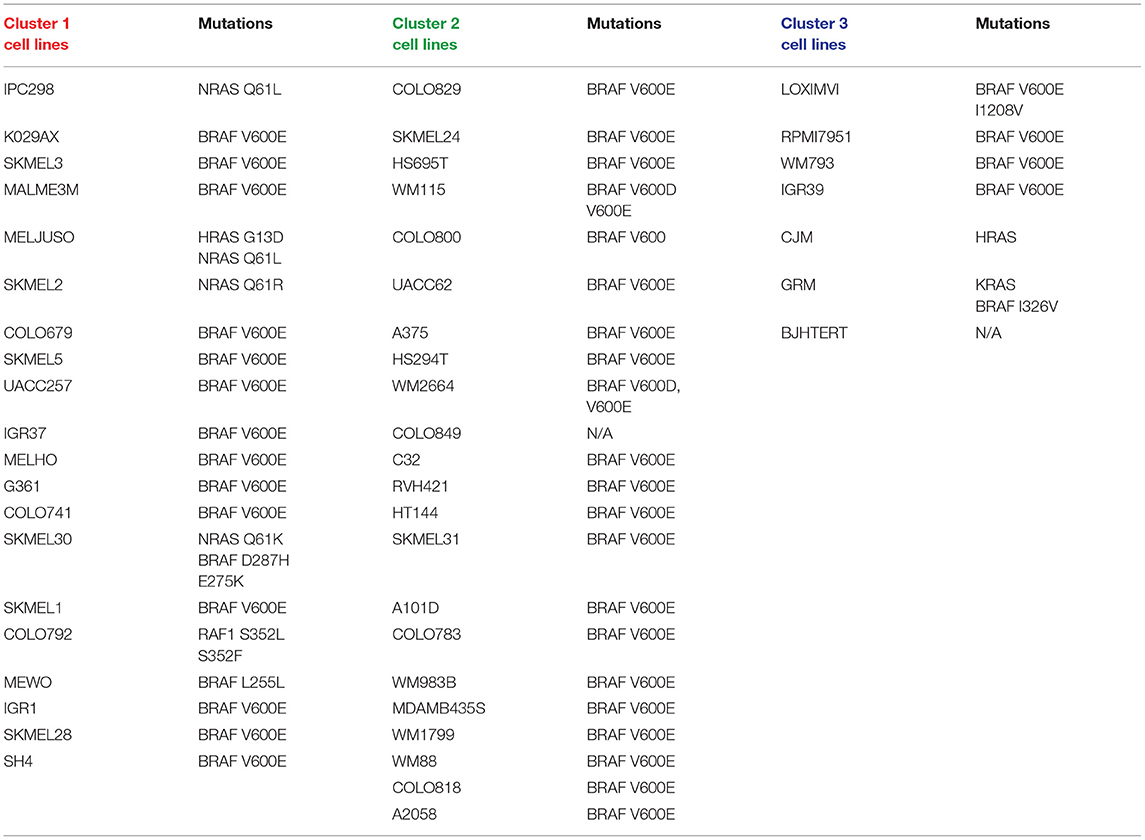
Table 2. Cluster membership and genomic characterization of cell lines.
In all 20 of the cells lines found in Cluster 1, there is an identified mutation in a gene that is characteristic of the canonical MAPK pathway. This includes genes such as NRAS, HRAS, BRAF, and RAF1. In fact, 14 out of 20 cell lines express the classic BRAF V600E mutation, which is a missense mutation found in many neoplasms. Furthermore, patients with BRAF V600E mutated melanomas respond to FDA-approved BRAF inhibitors, such as atezolizumab. A dependency on the essential SOX10 transcription factor in CRISPR and/or RNAi loss-of-function screens is shown in 13 out of 20 Cluster 1 cell lines.
In our identification of the top 15 genes that helped identify the three clusters, TBC1D16, DYNBC1l1, SEMA6A, GPR137B, PIK3CD, AVPl1, and GST01 are found to be high expressing genes (relative to the other clusters) for Cluster 1. TRIM9, ARHGEF6, C16orf52, and SMTN are also lower expressing genes for Cluster 1.
There are 22 cell lines that partitioned into Cluster 2. Of these, 21 are catalogued for mutations. All 21 are positive for the BRAF V600E mutation. We observe that none of these cell lines have mutations in any of the RAS genes, which stands out from the cells in Cluster 1.
Examples, of preferentially essential genes in some of the cell lines in Cluster 2, as determined by CRISPR and/or RNAi screens, included BRAF, MAPK1, SOX10, MDM2, and DUSP4.
Based on our analysis, TRIM9, YPEL2, ARHGEF6, SPATA13, AHR, C16orf52, and SMTN are high expressing genes present in the cell lines of Cluster 2. Of this group, RIM9, ARHGEF6, C16orf52, and SMTN are low expressing genes in cell lines of Cluster 1.
There are seven cells lines that partitioned into Cluster 3. One is a fibroblast cell line and is not represented in the Cancer Dependency Map portal from the Broad Institute (depmap.org/portal). Of the six represented cells lines, five had mutations in the BRAF gene: four with the typical BRAF V600E mutation and one with BRAF I326V, which has been found in other cancers (colorectal, breast, and lymphoid).
Only one of the six cell lines show preferentially dependent genes in the MAPK pathway. None of the other five out of six cell lines showed dependency on proteins from the MAPK pathway in Cluster 3.
Only CD274 is found to be high expressing in the cell lines in Cluster 3. However, Cluster 3 has the most representatives of the 15 genes as low expressing genes, including TBC1D16, DYNC1l1, YPEL2, SEMA6A, GPR137B, SPATA13, and AVPl1.
To validate the discriminating power of the top 15 genes among our three clusters we applied various classification techniques on 49 cell lines with the 15 genes. Table 3 shows the perfect or near-perfect accuracy of different classification algorithms implemented in the machine learning software WEKA (Hall and et al., 2009).
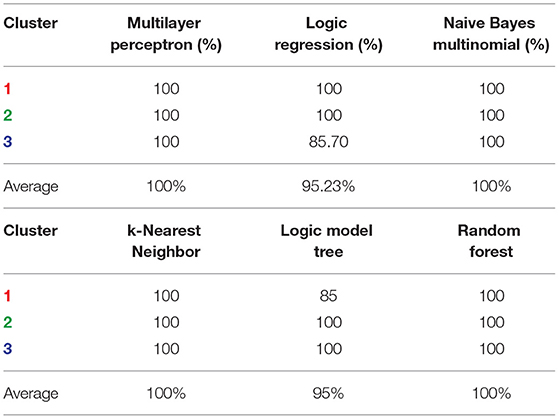
Table 3. Classification accuracy for top 15 genes using six different classification techniques.
3.4. Decision Tree Classification Model
We built a Decision Tree classification model on data consisting of the 49 cell lines with the top 15 genes to obtain combinatorial patterns of gene expression that led to the separation of the clusters. Decision Tree is a non-parametric supervised learning method used for classification and regression. The goal is to create a model that predicts the value of a target variable by learning simple decision rules inferred from the data features (Quinlan, 1993). The decision tree model shown in Table 4 consists of just one pattern for Cluster 1, one for Cluster 2, and two patterns for Cluster 3. The decision rules include only three genes: GSTO1, TBC1D16, and TRIM9.

Table 4. Tabular description of the decision tree classification model.
We evaluated the performance of the Decision Tree model through 10 times k-folding (10-folding in this case) cross-validation experiments: Randomly partition the data into k = 10 approximately equal parts. Designate one of these subsets as a test set. Build a model on the remaining k−1 = 9 subsets that form the training dataset. Then, evaluate classification performance on the test set. Finally, average performance while using each fold as the test set once. Table 5 displays the cross-validation accuracy of the Decision Tree.
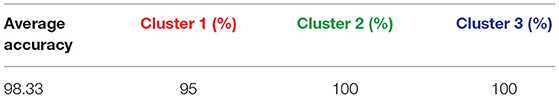
Table 5. Cross-validation accuracy of the decision tree classification model.
4. Drug Response Analysis
Analysis of the drug response data provided by the CCLE suggests that these 15 genes also play a role in predicting drug responses. The CCLE reports drug response in a subset of the cancer cell lines as ActArea—the area above the fitted dose-response curve—and includes responses across 24 different anti-cancer drugs. Of these 24 anti-cancer drugs, we focused on two MEK inhibitors. These are believed to be crucial in the treatment of melanoma. Upon analyzing the mean response of these two drugs across all three of our clusters separately, we found a decreasing response from cluster 1 to cluster 3 across both drugs as shown in Table 6. Given that our study illuminates what genes distinguish our clusters, one can reasonably hypothesize that these same genes are possibly responsible for this decreased response. However, further analysis is needed before making any conclusions in regards to this.
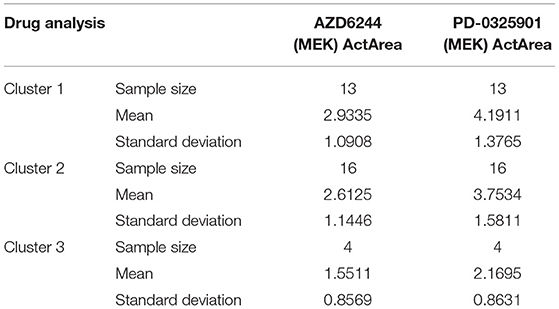
Table 6. Drug response analysis for the 49 melanoma cell lines.
5. Conclusion
Through a machine learning pipeline of clustering and feature selection, our study identifies 15 genes whose levels of expression categorize melanoma into three genomic clusters. A Decision Tree model needs only three genes—GSTO1, TBC1D16, and TRIM9—to reliably classify nearly all of the cell lines into their respective clusters. These results shed some light on the globally relevant genetic intravariability among melanoma cell lines. These results may indicate extra considerations in choosing a cancer therapy in addition to the treatment of the BRAF mutation that exists in 42/48 (one of the 49 cell lines used in this study lacks analysis) of the CCLE cell lines across all clusters (Ghandi et al., 2019). Further research may include applying our same feature selection pipeline with drug response as an outcome variable to discover key gene expression patterns for predicting drug response levels.
Data Availability Statement
Publicly available datasets were analyzed in this study. This data can be found at: https://portals.broadinstitute.org/ccle/.
Author Contributions
MS, LM, DC, and ES are senior co-authors who designed and supervised the entire project. BK, RB, and TB participated in the study design and performed all data analysis. BK, MS, and LM developed the manuscript. NC and AP were involved gene literature review. All authors contributed to the article and approved the submitted version.
Funding
BK, RB, NC, and AP were supported by National Science Foundation (NSF) Research Experience for Undergraduates (REU) Grant no. 1359341. Publication of this article was funded in part by the Open Access Subvention Fund and the John H. Evans Library.
Conflict of Interest
The authors declare that the research was conducted in the absence of any commercial or financial relationships that could be construed as a potential conflict of interest.
Publisher's Note
All claims expressed in this article are solely those of the authors and do not necessarily represent those of their affiliated organizations, or those of the publisher, the editors and the reviewers. Any product that may be evaluated in this article, or claim that may be made by its manufacturer, is not guaranteed or endorsed by the publisher.
References
Aggarwal, C. (2014). Data Classification: Algorithms and Applications, 1st Edn. Boca Raton, FL: Chapman & Hall; CRC Press.
Arthur, D., and Vassilvitskii, S. (2007). “k-means++: the advantages of careful seeding,” in Proceedings of the Eighteenth Annual ACM-SIAM Symposium on Discrete Algorithms (New Orleans, LA), 1027–1035.
Ascierto, P., Kirkwood, J. M., Grob, J. J., Simeone, E., Grimaldi, A. M., Maio, M., et al. (2012). The role of BRAF V600 mutation in melanoma. J. Transl. Med. 10:85. doi: 10.1186/1479-5876-10-85
Ascierto, P., and Marincola, F. (2015). The year of Anti-PD-1/PD-L1s against melanoma and beyond. EBIOMedicine 2, 92–93. doi: 10.1016/j.ebiom.2015.01.011
Barretina, J., Caponigro, G., Stransky, N., Venkatesan, K., Margolin, A. A., Kim, S., Wilson, C. J., et al. (2012). The cancer cell line encyclopedia enables predictive modelling of anticancer drug sensitivity. Nature 483, 603–607. doi: 10.1038/nature11003
Brubaker, D., Difeo, A., Chen, Y., Pearl, T., Zhai, K., Bebek, G., et al. (2014). Drug intervention response predictions with PARADIGM (DIRPP) identifies drug resistant cancer cell lines and pathway mechanisms of resistance. Biocomputing 2014, 125–135. doi: 10.1142/9789814583220_0013
Cancer Cell Line Encyclopedia Consortium and Genomics of Drug Sensitivity in Cancer Consortium and others (2015). Pharmacogenomic agreement between two cancer cell line data sets. Nature 528, 84–87.
Chen, J.-S., Huang, J.-Q., Luo, B., Dong, S.-H., Wang, R.-C., Jiang, Z.-K., et al. (2019). Pik 3 cd induces cell growth and invasion by activating akt/gsk-3β/β-catenin signaling in colorectal cancer. Cancer Sci. 110, 997–1011. doi: 10.1111/cas.13931
Covell, D. (2015). Data mining approaches for genomic biomarker development: applications using drug screening data from the cancer genome project and the cancer cell line encyclopedia. PLoS ONE 10:e0127433. doi: 10.1371/journal.pone.0127433
Dubitzky, W., Granzow, M., and Berrar, D. P. (2007). Fundamentals of Data Mining in Genomics and Proteomics. New York, NY: Springer.
Garnett, M., Edelman, E. J., and Benes, C. H. (2012). Systematic identification of genomic markers of drug sensitivity in cancer cells. Nature 483, 570–575. doi: 10.1038/nature11005
Ghandi, M., Huang, F. W., Jané-Valbuena, J., Kryukov, G. V., Lo, C. C., McDonald, E. R., et al. (2019). Next-generation characterization of the cancer cell line encyclopedia. Nature 569, 503–508. doi: 10.1038/s41586-019-1186-3
Gong, L.-B., Wen, T., Li, Z., Xin, X., Che, X.-F., Wang, J., et al. (2019). Dync1i1 promotes the proliferation and migration of gastric cancer by up-regulating il-6 expression. Front. Oncol. 9:491. doi: 10.3389/fonc.2019.00491
Guyon, I., Weston, J., Barnhill, S., and Vapnik, V. (2002). Gene selection for cancer classification using support vector machines. Mach. Learn. 46, 389–422. doi: 10.1023/A:1012487302797
Hall, M., Frank, E., Holmes, G., Pfahringer, B., and Reutemann, P. (2009). The WEKA data mining software: an update. SIGKDD Explor. 11, 10–18. doi: 10.1145/1656274.1656278
Huang, C.-Y., Chiang, S.-F., Ke, T.-W., Chen, T.-W., You, Y.-S., Chen, W. T.-L., et al. (2018). Clinical significance of programmed death 1 ligand-1 (cd274/pd-l1) and intra-tumoral cd8+ t-cell infiltration in stage ii-iii colorectal cancer. Sci. Rep. 8, 1–10. doi: 10.1038/s41598-018-33927-5
Jang, I., Neto, E. C., Guinney, J., Friend, S. H., and Margolin, A. A. (2014). Systematic assessment of analytical methods for drug sensitivity prediction from cancer cell line data. Biocomputing. 2014, 63–74. doi: 10.1142/9789814583220_0007
Li, C., and Xu, J. (2019). Feature selection with the fisher score followed by the maximal clique centrality algorithm can accurately identify the hub genes of hepatocellular carcinoma. Sci. Rep. 9:17283. doi: 10.1038/s41598-019-53471-0
Pudil, P., Novovičová, J., and Kittler, J. (1994). Floating search methods in feature selection. Pattern Recogn. Lett. 15, 1119–1125. doi: 10.1016/0167-8655(94)90127-9
Quinlan, J. (1993). C4.5: Programs for Machine Learning. San Francisco, CA: Morgan Kaufmann Publishers.
Rambov, F., Job, B., Petit, V., Gesbert, F., Delmas, V., Seberg, H., et al. (2015). New functional signatures for understanding melanoma biology from tumor cell lineage-specific analysis cell reports. Biocomputing 13, 840–853. doi: 10.1016/j.celrep.2015.09.037
Rodger, E. J., Chatterjee, A., Stockwell, P. A., and Eccles, M. R. (2019). Characterisation of dna methylation changes in ebf3 and tbc1d16 associated with tumour progression and metastasis in multiple cancer types. Clin. Epigenet. 11, 1–11. doi: 10.1186/s13148-019-0710-5
Ryu, B., Kim, D. S., Deluca, A. M., and Alani, R. M. (2007). Comprehensive expression profiling of tumor cell lines identifies molecular signatures of melanoma progression. PLoS ONE 2:e594. doi: 10.1371/journal.pone.0000594
Sun, L., Zhang, X.-Y., Qian, Y.-H., Xu, J.-C., Zhang, S.-G., and Tian, Y. (2018). Joint neighborhood entropy-based gene selection method with fisher score for tumor classification. Appl. Intell. 49, 1245–1259. doi: 10.1007/s10489-018-1320-1
Thiem, A., Hesbacher, S., Kneitz, H., di Primio, T., Heppt, M. V., Hermanns, H. M., et al. (2019). IFN-gamma-induced pd-l1 expression in melanoma depends on p53 expression. J. Exp. Clin. Cancer Res. 38, 1–15. doi: 10.1186/s13046-019-1403-9
Vizoso, M., Ferreira, H. J., Lopez-Serra, P., Carmona, F. J., Martínez-Cardús, A., Girotti, M. R., et al. (2015). Epigenetic activation of a cryptic tbc1d16 transcript enhances melanoma progression by targeting EGFR. Nat. Med. 21, 741–750. doi: 10.1038/nm.3863
Wang, X., Shu, Y., Shi, H., Lu, S., Wang, K., Sun, C., et al. (2016). TRIM9 is up-regulated in human lung cancer and involved in cell proliferation and apoptosis. Int. J. Clin. Exp. Med. 9, 10461–10469.
Wang, Z., Snyder, M., Kenison, J. E., Yang, K., Lara, B., Lydell, E., et al. (2021). How the AHR became important in cancer: the role of chronically active AHR in cancer aggression. Int. J. Mol. Sci. 22:387. doi: 10.3390/ijms22010387
Xu, Y., Bankhead, A., Tian, X., Tang, J., Ljungman, M., and Neamati, N. (2020). Deletion of glutathione s-transferase omega 1 activates type i interferon genes and downregulates tissue factor. Cancer Res. 80, 3692–3705. doi: 10.1158/0008-5472.CAN-20-0530
Yan, K., and Zhang, D. (2015). Feature selection and analysis on correlated gas sensor data with recursive feature elimination. Sensors Actuat. B Chem. 212, 353–363. doi: 10.1016/j.snb.2015.02.025
Yang, J., Liu, Y., Feng, C., and Zhu, G. (2016). Applying the fisher score to identify alzheimer's disease-related genes. Genet. Mol. Res. 15:gmr8798. doi: 10.4238/gmr.15028798
Keywords: melanoma, gene expression, classification, clustering, feature selection, machine learning
Citation: Kutt B, Burdorf R, Bain T, Cameron N, Pearah A, Subasi E, Carroll DJ, Moore LK and Subasi MM (2021) Identification of Prognostic Biomarker Candidates Associated With Melanoma Using High-Dimensional Genomic Data. Front. Genet. 12:707105. doi: 10.3389/fgene.2021.707105
Received: 08 May 2021; Accepted: 10 August 2021;
Published: 13 September 2021.
Edited by:
Anupama Yadav, Dana-Farber Cancer Institute, United StatesReviewed by:
Anupama Reddy, Independent Researcher, Morrisville, United StatesGabriela Alexe, Dana-Farber Cancer Institute, United States
Copyright © 2021 Kutt, Burdorf, Bain, Cameron, Pearah, Subasi, Carroll, Moore and Subasi. This is an open-access article distributed under the terms of the Creative Commons Attribution License (CC BY). The use, distribution or reproduction in other forums is permitted, provided the original author(s) and the copyright owner(s) are credited and that the original publication in this journal is cited, in accordance with accepted academic practice. No use, distribution or reproduction is permitted which does not comply with these terms.
*Correspondence: Munevver Mine Subasi, bXN1YmFzaUBmaXQuZWR1