- 1Department of Primary Industries and Regional Development Western Australia, South Perth, WA, Australia
- 2Western Crop Genetics Alliance, Murdoch University, Murdoch, WA, Australia
Selection for resistance against gray leaf spot (GLS) is a major objective in the lupin breeding programs. A segregation ratio of 1:1 (resistant:susceptible) in F8 recombinant inbred lines (RIL8) derived from a cross between a breeding line 83A:476 (resistant to GLS) and a wild accession P27255 (susceptible to GLS) indicated that GLS was controlled by a single major gene. To develop molecular markers linked to GLS, in the beginning, only 11 resistant lines and six susceptible lines from the 83A:476 and P27255 population were genotyped with MFLP markers, and three MFLP markers were identified to be co-segregated with GLS. This method was very efficient, but the markers were located outside of the gene, and could not be used in other germplasms. Then QTL analysis and fine mapping were conducted to identify the gene. Finally, the gene was narrowed down to a 241-kb region containing two disease resistance genes. To further identify the candidate gene, DNA variants between accessions Tanjil (resistant to GLS) and Unicrop (susceptible to GLS) were analyzed. The results indicated that only one SNP was detected in the 241 kb region. This SNP was located in the TMV resistance protein N-like gene region and also identified between 83A:476 and P27255. Genotyping the Tanjil/Unicrop RIL8 population showed that this SNP co-segregated with GLS resistance. The phylogenetic tree analysis of this gene among 18 lupin accessions indicates that Australian resistant breeding line/varieties were clustered into one group and carry two resistant alleles, while susceptible accessions were clustered into different groups.
Introduction
Molecular markers linked to genes of agronomic traits can be applied in plant breeding to hasten genetic improvement. Marker-assisted selection (MAS) requires that the markers should be cost effective, reliable, and be applicable in high-throughput systems for many samples. In addition, the marker genotypes must be consistent with the plant phenotypes across a diverse range of germplasm to enable wide application in breeding programs. Unfortunately, most molecular markers are developed from the outside of the gene region; in these cases, new recombination can happen between the gene and the marker in plant breeding programs. As a result, cultivars exhibiting the ideal marker genotypes may not necessarily carry the targeted genes, which produce “false positive” (Sharp et al., 2001; Boersma et al., 2009). Due to the occurrence of “false positives” or “false negatives” in MAS practices, breeders must validate markers to determine which markers suit which crosses in breeding populations (Eagles et al., 2001; Sharp et al., 2001). This marker validation step can slow down the pace of MAS implementation and increase the cost in breeding programs. A key limiting factor of MAS in plant molecular breeding is to develop diagnostic markers that are applicable for a wide range of germplasm (Brown-Guedira, 2005). The best solution to the plight of a false result in MAS is to develop “diagnostic markers,” which have their genotypes consistent with their phenotypes. Diagnostic markers can be applied for MAS in breeding programs without the need of a marker validation step (Ogbonnaya et al., 2001). For functional genes where gene sequences are available, diagnostic PCR markers can be designed based on polymorphic sites within gene sequences (Zhou et al., 2013). For agronomic traits without the knowledge of gene sequences, one of the methodologies for developing widely applicable molecular markers is to design several markers linked to the target genes, followed by a validation step to test the candidate markers and select the best one for MAS (Yang et al., 2008). Using this concept, diagnostic markers have been developed and applied for anthracnose disease resistance (You et al., 2005) and phomopsis stem blight disease resistance (Yang et al., 2013a) selection in Australian national lupin breeding programs. However, the development of several markers associated with the genes of interest by gel-based DNA fingerprinting methods is very tedious and time consuming. Recently, the rapid advancement and the reduction in the cost of the next-generation sequencing technology (NGS) have made it feasible for many molecular laboratories to embrace the genome sequencing wave. Whole-genome sequencing is the ultimate approach to generate genome-wide, maximum number of molecular markers in plant species. For instance, over 55 million SNPs (single-nucleotide polymorphisms) were detected by genome sequencing and re-sequencing in maize (Chia et al., 2012; Jiao et al., 2014). Therefore, the whole-genome sequencing approach offers tremendous potential for developing diagnostic markers and/or identifying genes in plant breeding.
Narrow-leafed lupin (Lupinus angustifolius L.) was fully domesticated as a grain legume crop during the 1960s in Australia. Pedigree records showed that 31 varieties were released from 1967 to 2016. Lupin is a grain legume crop and provides a source of protein for animals and humans. Gray leaf spot (GLS) is a serious disease in narrow-leafed lupin (Lupinus angustifolius L.), caused by the fungal pathogens Stemphylium botryosum spp. (Vaghefi et al., 2020). It causes leaf lesions and defoliation (Figure 1) as well as infecting stems and pods. Dark-brown circular lesions can often appear on leaves and then progress to ash-brown necrosis, and in severe cases, plants lose all their leaves, which can lead to significant yield loss (Thomas et al., 2011). Genetic studies on three separate breeding populations in North America revealed that the resistance to GLS was regulated by a single gene (Forbes et al., 1961). The first three commercial cultivars (Uniwhite, Uniharvest, and Unicrop) released in Australia before 1974 were susceptible to GLS. A collaborative breeding effort between USDA and the Department of Agriculture in Western Australia resulted in the introduction of the gray leaf spot-resistant gene into the Australian germplasm and the release of the first resistant variety in 1974. This resistant (R) gene had been integrated into all the subsequent commercial cultivars over the following 30 years (Thomas et al., 2011). The R gene gl is so effective against the disease that it has been effectively absent from Australian lupin crops for over 30 years; during that time, resistance screening for GLS was not carried out by the lupin breeding program. However, GLS re-emerged in Western Australia in 2006. Subsequent disease screening tests in 2008 and 2009 found that approximately 40% of the breeding lines in the Australian lupin breeding program were susceptible to GLS (Thomas et al., 2011). Since then, screening and selection for GLS has become an essential component of the program. The gel-based DNA fingerprinting method MFLP (microsatellite fragment length polymorphism) (Yang et al., 2001, 2002) has been applied in marker development for anthracnose and phomopsis resistance in lupin.
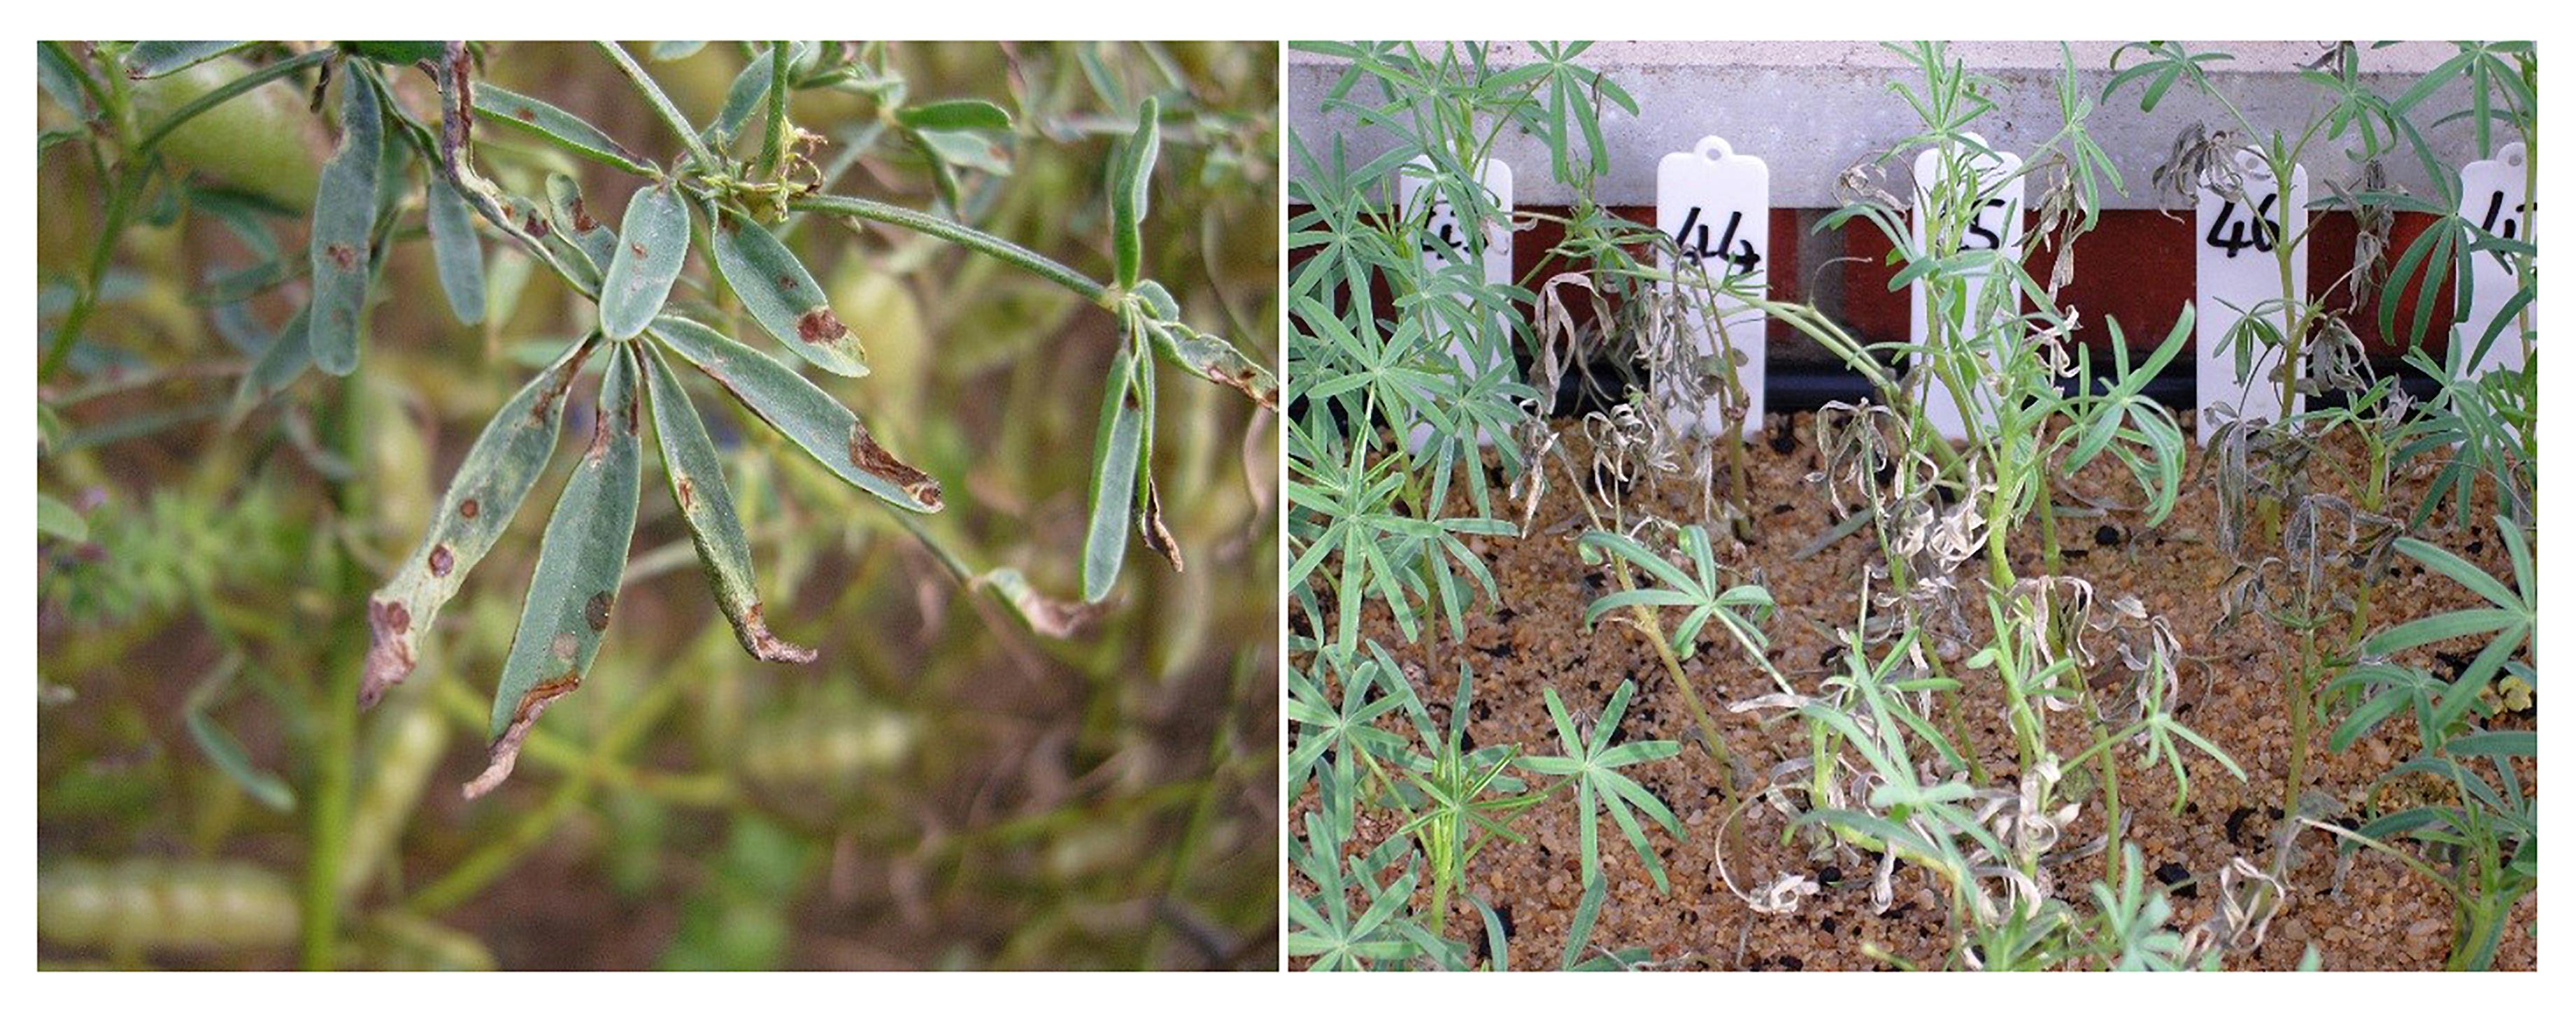
Figure 1. Gray spot leaf disease and phenotyping in glasshouse. Left: disease in adult plant; Right: disease assessment in glasshouse at the seeding stage.
In this study, first, we used an efficient method and identified molecular markers linked to GLS by genotyping only 17 RIL lines. Second, we fine mapped the QTL region and identified the candidate gene for GLS using RIL8 populations, and then an SNP diagnostic marker was developed within the gene region, and genotyping RIL population confirmed that 83A:476 and Tanjil shared the same QTL/locus. Finally, GLS alleles were investigated in 18 Australian varieties and European wild ecotypes, and a phylogenetic tree was constructed.
Materials and Methods
Plant Materials
Two populations of F8 recombinant inbred lines (RIL) were used in this study. They were developed using a single seed descent from their F2 generations. The population (109 RILs) derived from a cross between the Australian domesticated breeding line 83A:476 (resistant to GLS) and Morocco wild-type P27255 (susceptible to GLS) was used for genetic map construction and QTL mapping for GLS confirmation. Another 93 RIL8 population derived from the cross between two Australian cultivars Tanjil (resistant to GLS) and Unicrop (susceptible to GLS) was used to validate the QTL and the molecular markers in this study. Unicrop was one of the three susceptible varieties released prior to the introduction of GLS resistance, while Tanjil was released in 1998 as part of the lineage with the GLS resistance. A total of 18 historical and current commercial cultivars and breeding or wild ecotypes (Tanjil, Yorrel, Coromup, Mandelup, Merrit, 83A:476, Moonah, Unicrop, Kalya, Tallerack, P26167, P27255, Quillinock, 75A:258, P26603, Bo7212, P26668, and P27221) were used to analyze GLS alleles and the gene evolution. These germplasms are from Australian varieties and European wild ecotypes.
Phenotyping Gray Leaf Spot Resistance
Two isolates (S. beticola: WAC12986 and S. vesicarium: WAC13136) from the Western Australian Culture Collection (Thomas et al., 2011; Vaghefi et al., 2020) were used for phenotyping in this study. Isolates were grown on 20% V8 agar medium at 22°C with a 12:12 h light/dark cycle for 14 days (Everts and Armentrout, 2001). Then spores were harvested and suspended in sterile distilled water with 0.1% Tween-20. The final concentration of spores was adjusted to 1.5 × 10⁵ ml–1. Three replicate pots, each containing seven 14-day-old seedlings of each line were spray inoculated with the spore suspension. The pots were placed randomly. Inoculated plants were placed in an intermittent misting growth chamber with 90% of shade of natural daylight. Two days later, the plants were transferred to the greenhouse at 20°C. Disease scoring was conducted 14 days after inoculation. Disease resistance was scored on the first two fully expanded leaves on a 0–5 scale (0: no symptoms; 1: one to two lesions < 1 mm on each leaflet; 2: less than five small lesions on each leaflet; 3: 1- to 5-mm lesions, often coalescing with associated chlorosis; 4: some leaflets completely necrotic or fallen; 5: all leaflets completely necrotic or complete defoliation). Plants scoring 0 and 1 were considered resistant, while those scoring greater than 3 were considered susceptible (Thomas et al., 2011; Ahmad et al., 2016). Genotype effects on disease severity were analyzed by ANOVA with differences compared by LSD. The disease assessments of the two RIL populations were carried out in 2008, 2009, and 2013.
Identification of Markers Linked to Gray Leaf Spot Resistance by Microsatellite Fragment Length Polymorphism
Identification of MFLP markers linked to GLS resistance followed the same method as described by previous studies (Yang et al., 2002; Lin et al., 2009). MFLP method combines the concept of microsatellite-anchor primer and AFLP technique. Genomic DNA was digested by restriction enzyme MseI. One AFLP MseI adaptor was ligated onto the restriction fragments. PCR was performed using one MseI primer in combination with one microsatellite-anchor primer (Yang et al., 2001). Seventeen plants were used in the MFLP analysis. Eleven of these plants, including parental line 83A:476 and 10 RIL8, were resistant to GLS. The other six plants, including parental line P27255 and five RIL8, were susceptible to GLS. These plants were genotyped with MFLP markers. The genotypes of the markers close to GLS should be associated with the disease resistance.
Sequencing Microsatellite Fragment Length Polymorphism Amplicons
PCR bands from the MFLP markers linked to GLS were excised from MFLP gels and boiled for 1 min in TE buffer. The products were re-amplified by PCR, and electrophoresed in 1% agarose gel. DNA fragments were isolated with agarose gel and purified with a gel extraction kit (Qiagen), and then sequenced using the BigDye Terminator system (Applied Biosystems). Blastn searches were performed on the sequences in the lupin genome database (Wang et al., 2020). The chromosome and physical positions of MFLP markers were anchored.
Sequencing
The lupin parental lines (Unicrop, 83A:476, and P27255) were shotgun sequenced with 10 times coverage using the second-generation sequencing method, and the sequences were obtained from the China National GeneBank Database1 and were available under the project accession CNP0001034. The RIL8 population from the cross of 83A:476 and P27255 were genotyped using the RAD method (Yang et al., 2013b; Zhou et al., 2018). The protocol was described by Chutimanitsakun et al. (2011) with minor modifications that EcoRI was used. Sequencing libraries (100 bp) were constructed by using a unique multiplex identifier (MID) barcode (Baird et al., 2008). The RAD product sequencing was carried out on Solexa HiSeq2000. Sequencing raw data were divided into different lupin lines according to the MID barcodes (Baird et al., 2008), and then the MID barcodes were removed from the raw sequencing data. The 92-bp RAD reads with the same DNA sequences were clustered into one read tag. Tags containing over 100 reads were considered to be from repetitive regions, so they were removed to avoid the detection of SNP/indel variants (Catchen et al., 2011). Genome assembly of the two parental lines was conducted before alignment.
QTL Mapping and Fine Mapping
MapQTL5.0 was used to detect QTL for gray leaf spot disease. The genetic map of the population between 83A:476 and P27255 was obtained from our previous studies (Zhou et al., 2018). Formatted files including the genetic map, genotypic data, and phenotypes were imported into MapQTL5.0. The threshold of LOD value for QTL mapping was 3.0. First, interval mapping was performed, and then the marker with the highest LOD value was selected for MQM mapping analysis.
High-density markers across the QTL region were genotyped in the RIL population. The recombinant lines were selected to narrow down the QTL for gray leaf spot resistance. The left border and right border of the gene were determined by comparing the genotypes and phenotypes.
Variant Detection
The software CLC Genomic Workbench 21.0.3 was used to map the sequence data to the reference narrow-leafed lupin “Tanjil” genome. The 17 accessions excluding the reference cv. Tanjil were shotgun sequenced with 10 times coverage. All the sequencing read data were obtained from the China National GeneBank Database (see text footnote 1) and were available under the project accession CNP0001034. The parameters were as follows: match score 1, mismatch cost 2, linear gap cost, length fraction 0.5, similarity fraction 0.8, and non-specific match handling with map randomly. Tracks were created, and all the genome sequences used in this study were combined. The SNP and indel variants were detected and generated. For variant detection, fixed ploidy variant parameters were as follows: ploidy 2 and required variant probability 90%, ignore broken pairs, minimum coverage 10, minimum count 2, and minimum frequency 20%.
Phylogenetic Tree Construction
Gray leaf spot (GLS) alleles and gene evolution were investigated among 18 narrow-leafed lupin accessions. SNPs were identified by mapping their reads to the Tanjil reference genome. SNP variants were obtained from the variants detection. The SNP genotype data were imported into Geneious 8.0 for phylogenetic tree construction. Geneious Tree Builder function was used, and the parameters were as follows: genetic distance model of Jukes–Cantor with the build method of UPGMA.
Results
Single Gene Controls Gray Leaf Spot Resistance
For the gray leaf spot disease phenotypes, all the plants of parental line 83A:476 were resistant to GLS (scoring 0), while all the plants of P27255 were susceptible (scoring 4 or 5, mean 4.6). The parental phenotypes were significantly different (p < 0.05). Among the 109 tested F8 RILs, 51 RILs were susceptible to GLS, and the other 58 RILs were resistant (Figure 2). The segregation of susceptible:resistant in the F8 population fit the expected 1:1 ratio (χ2 = 0.33, χ20.05,1 = 3.84, (χ2 < χ20.05,1), indicating that a single gene controls GLS resistance in 83A:476.
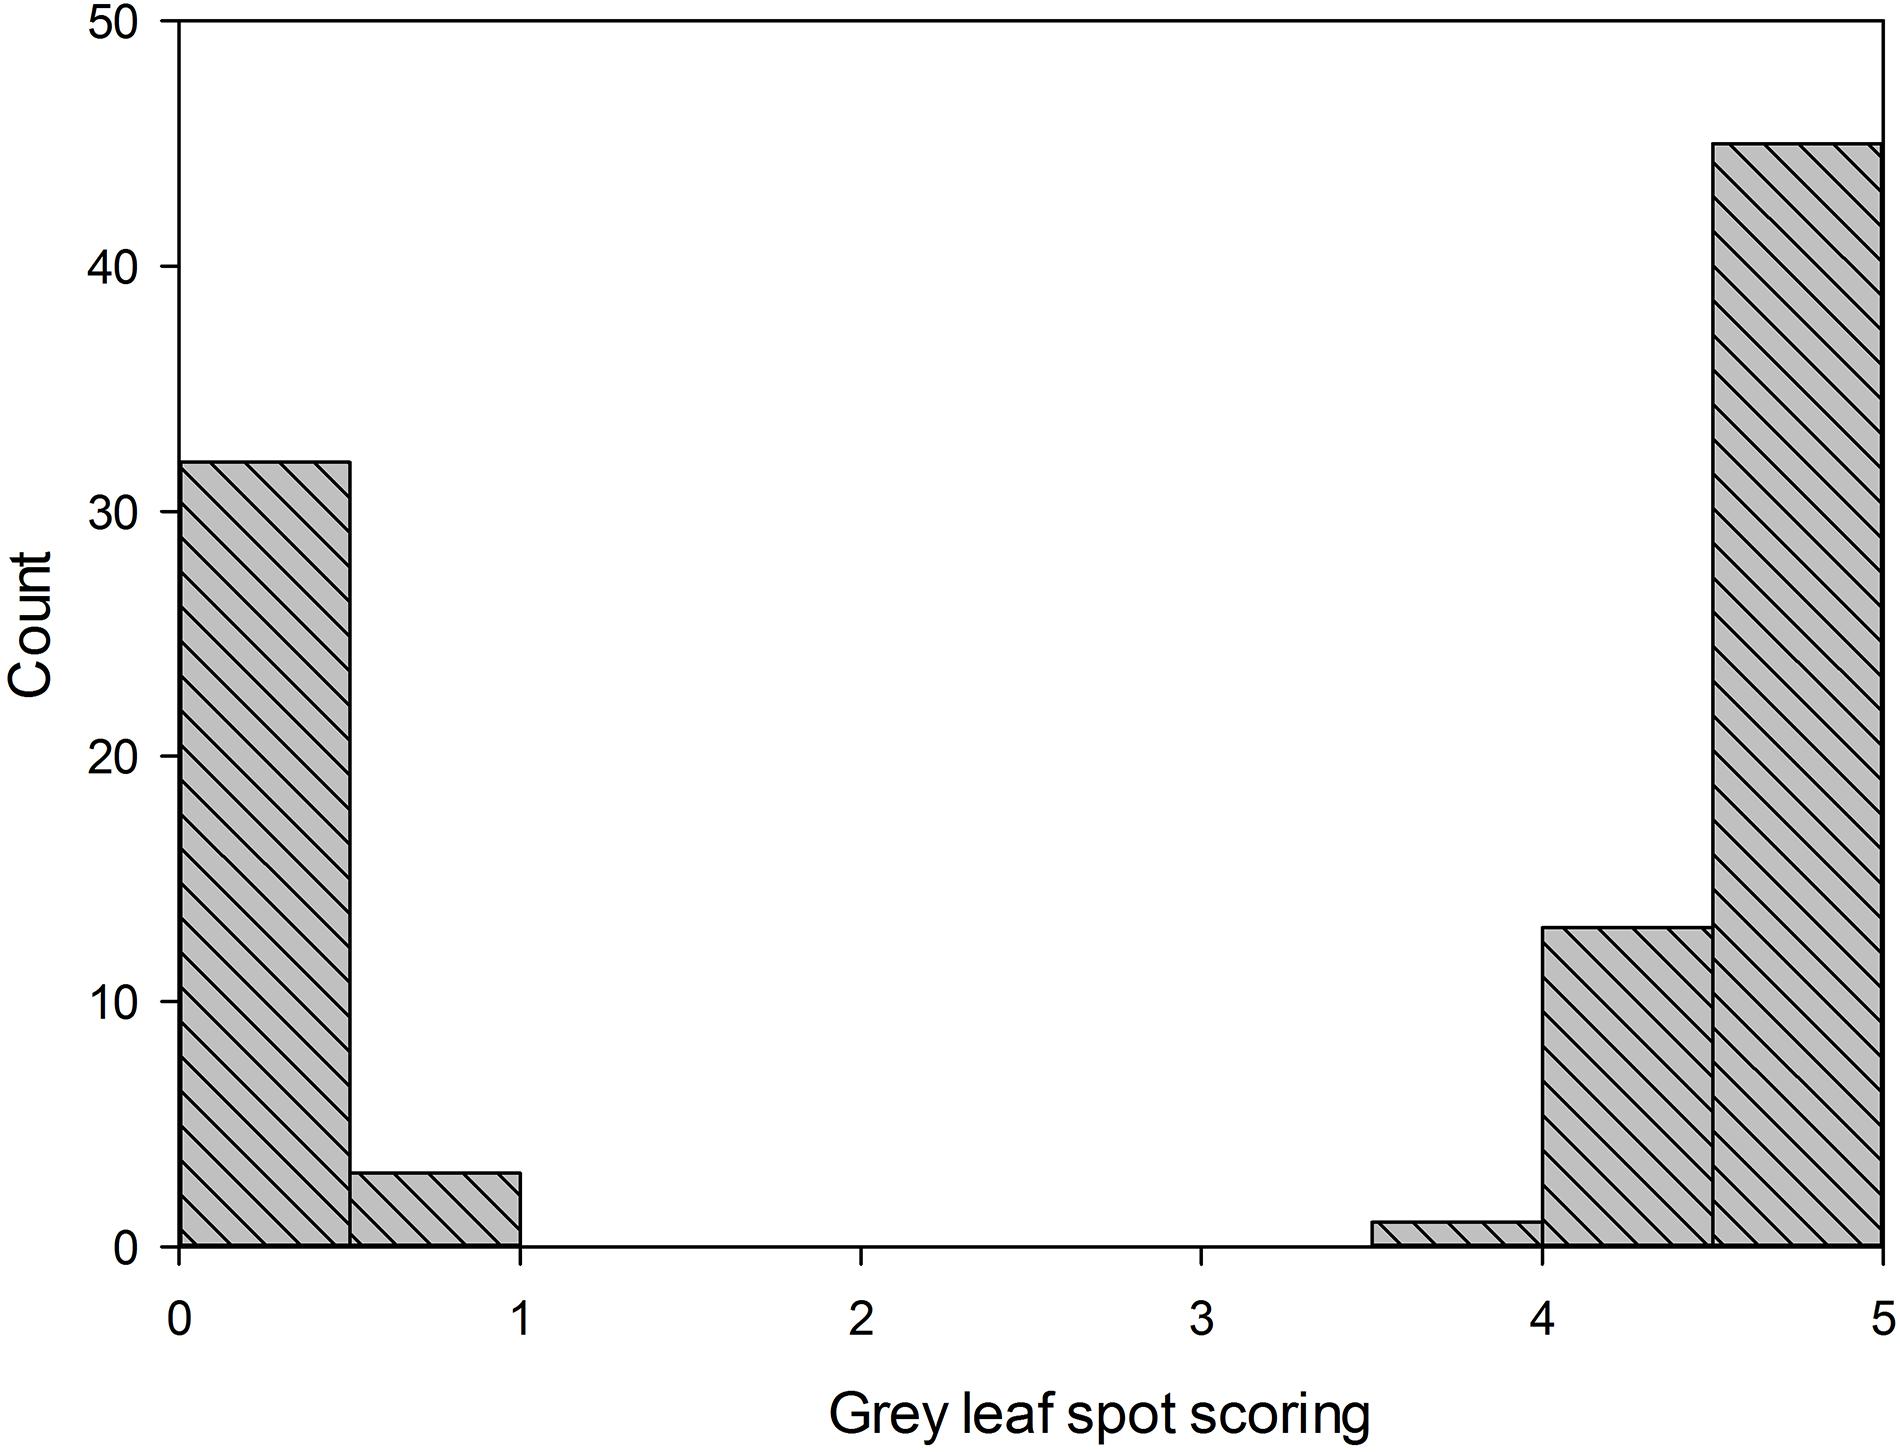
Figure 2. Distribution of gray leaf spot scoring in F8 recombinant inbred lines (RIL8) population. Line 83A:476 score was 0 (resistant), and wild-type P27255 was 4.65 (susceptible); n = 111.
Identification of Microsatellite Fragment Length Polymorphism Markers Linked to Gray Leaf Spot Resistance
In the beginning, we wanted to develop molecular markers linked to GLS and use immediately in breeding programs, so an efficient method was adopted to identify the locus. A total of 1,657 polymorphic MFLP markers were identified between parental lines 83A:476 and P27255. These markers were genotyped in 10 resistant RILs and 5 susceptible RILs as well. Among these markers, three markers (D145, D280, and D300) co-segregated with GLS resistance in these RILs (Table 1). All the resistant RIL8 exhibited the same genotype to 83A:476, and the susceptible RILS showed the same genotypes to P27255.
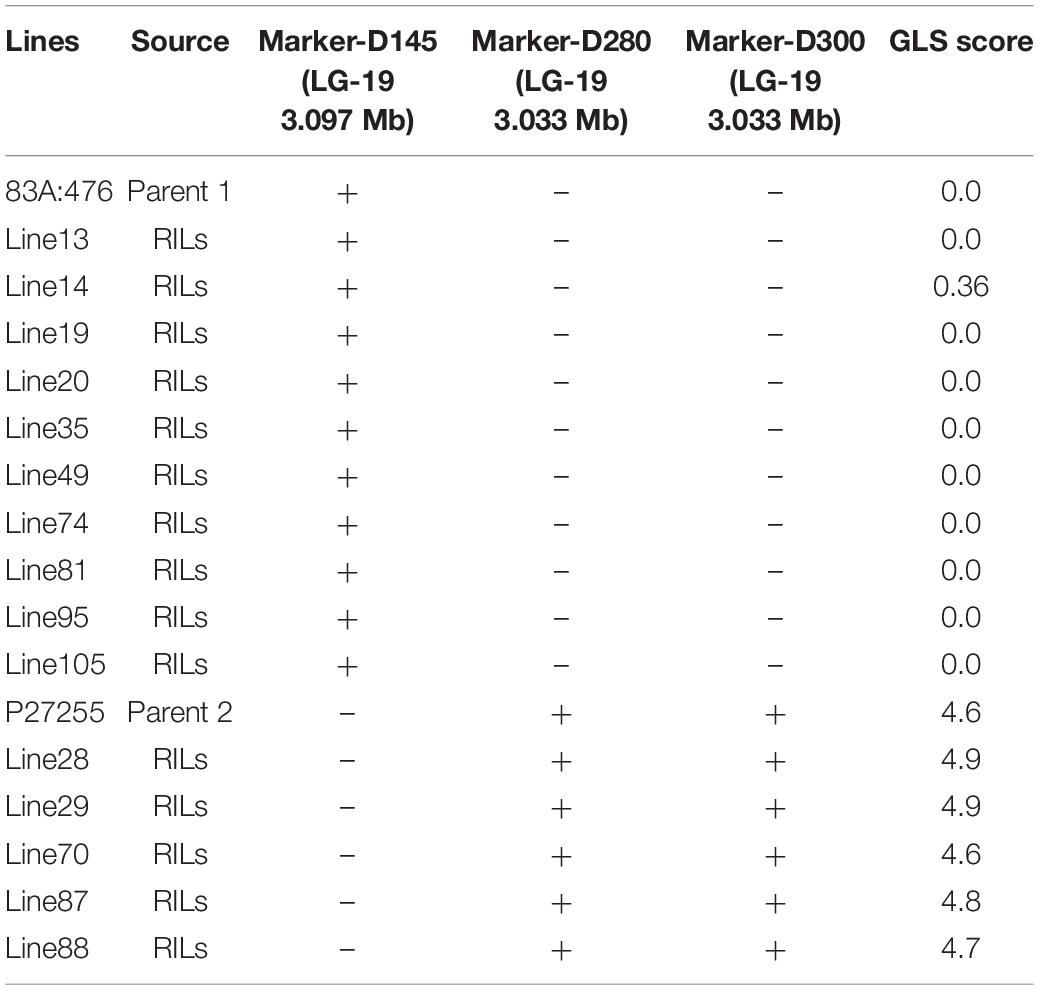
Table 1. Microsatellite fragment length polymorphism (MFLP) markers linked to gray leaf spot (GLS) resistance.
Sequencing of Linked Microsatellite Fragment Length Polymorphism Markers and Anchor to Physical Map
The PCR products from PAGE gel were amplified and sequenced. The amplicon sequences of the three markers are listed in Supplementary Table 1. The markers did not perform very well (data not shown) among the lupin germplasms maybe because these markers were located outside of the GLS gene, so we continued to identify the gene and develop diagnostic markers. Recently, the release of the lupin genome sequence enables us to anchor the MFLP markers to their physical positions and to mine the genes based on the lupin genome (Wang et al., 2020). The sequences excluding forward and reverse primers were used to conduct a blast in the lupin cv. Tanjil genome. All the three markers (D145, D280, and D300) were anchored to the lupin linkage group LG-19 with a physical position of 2.156–2.218 Mb region. D280 and D300 were anchored to the 2.156 Mb region, while D145 was mapped to the 2.218 Mb region.
QTL Mapping and Fine Mapping
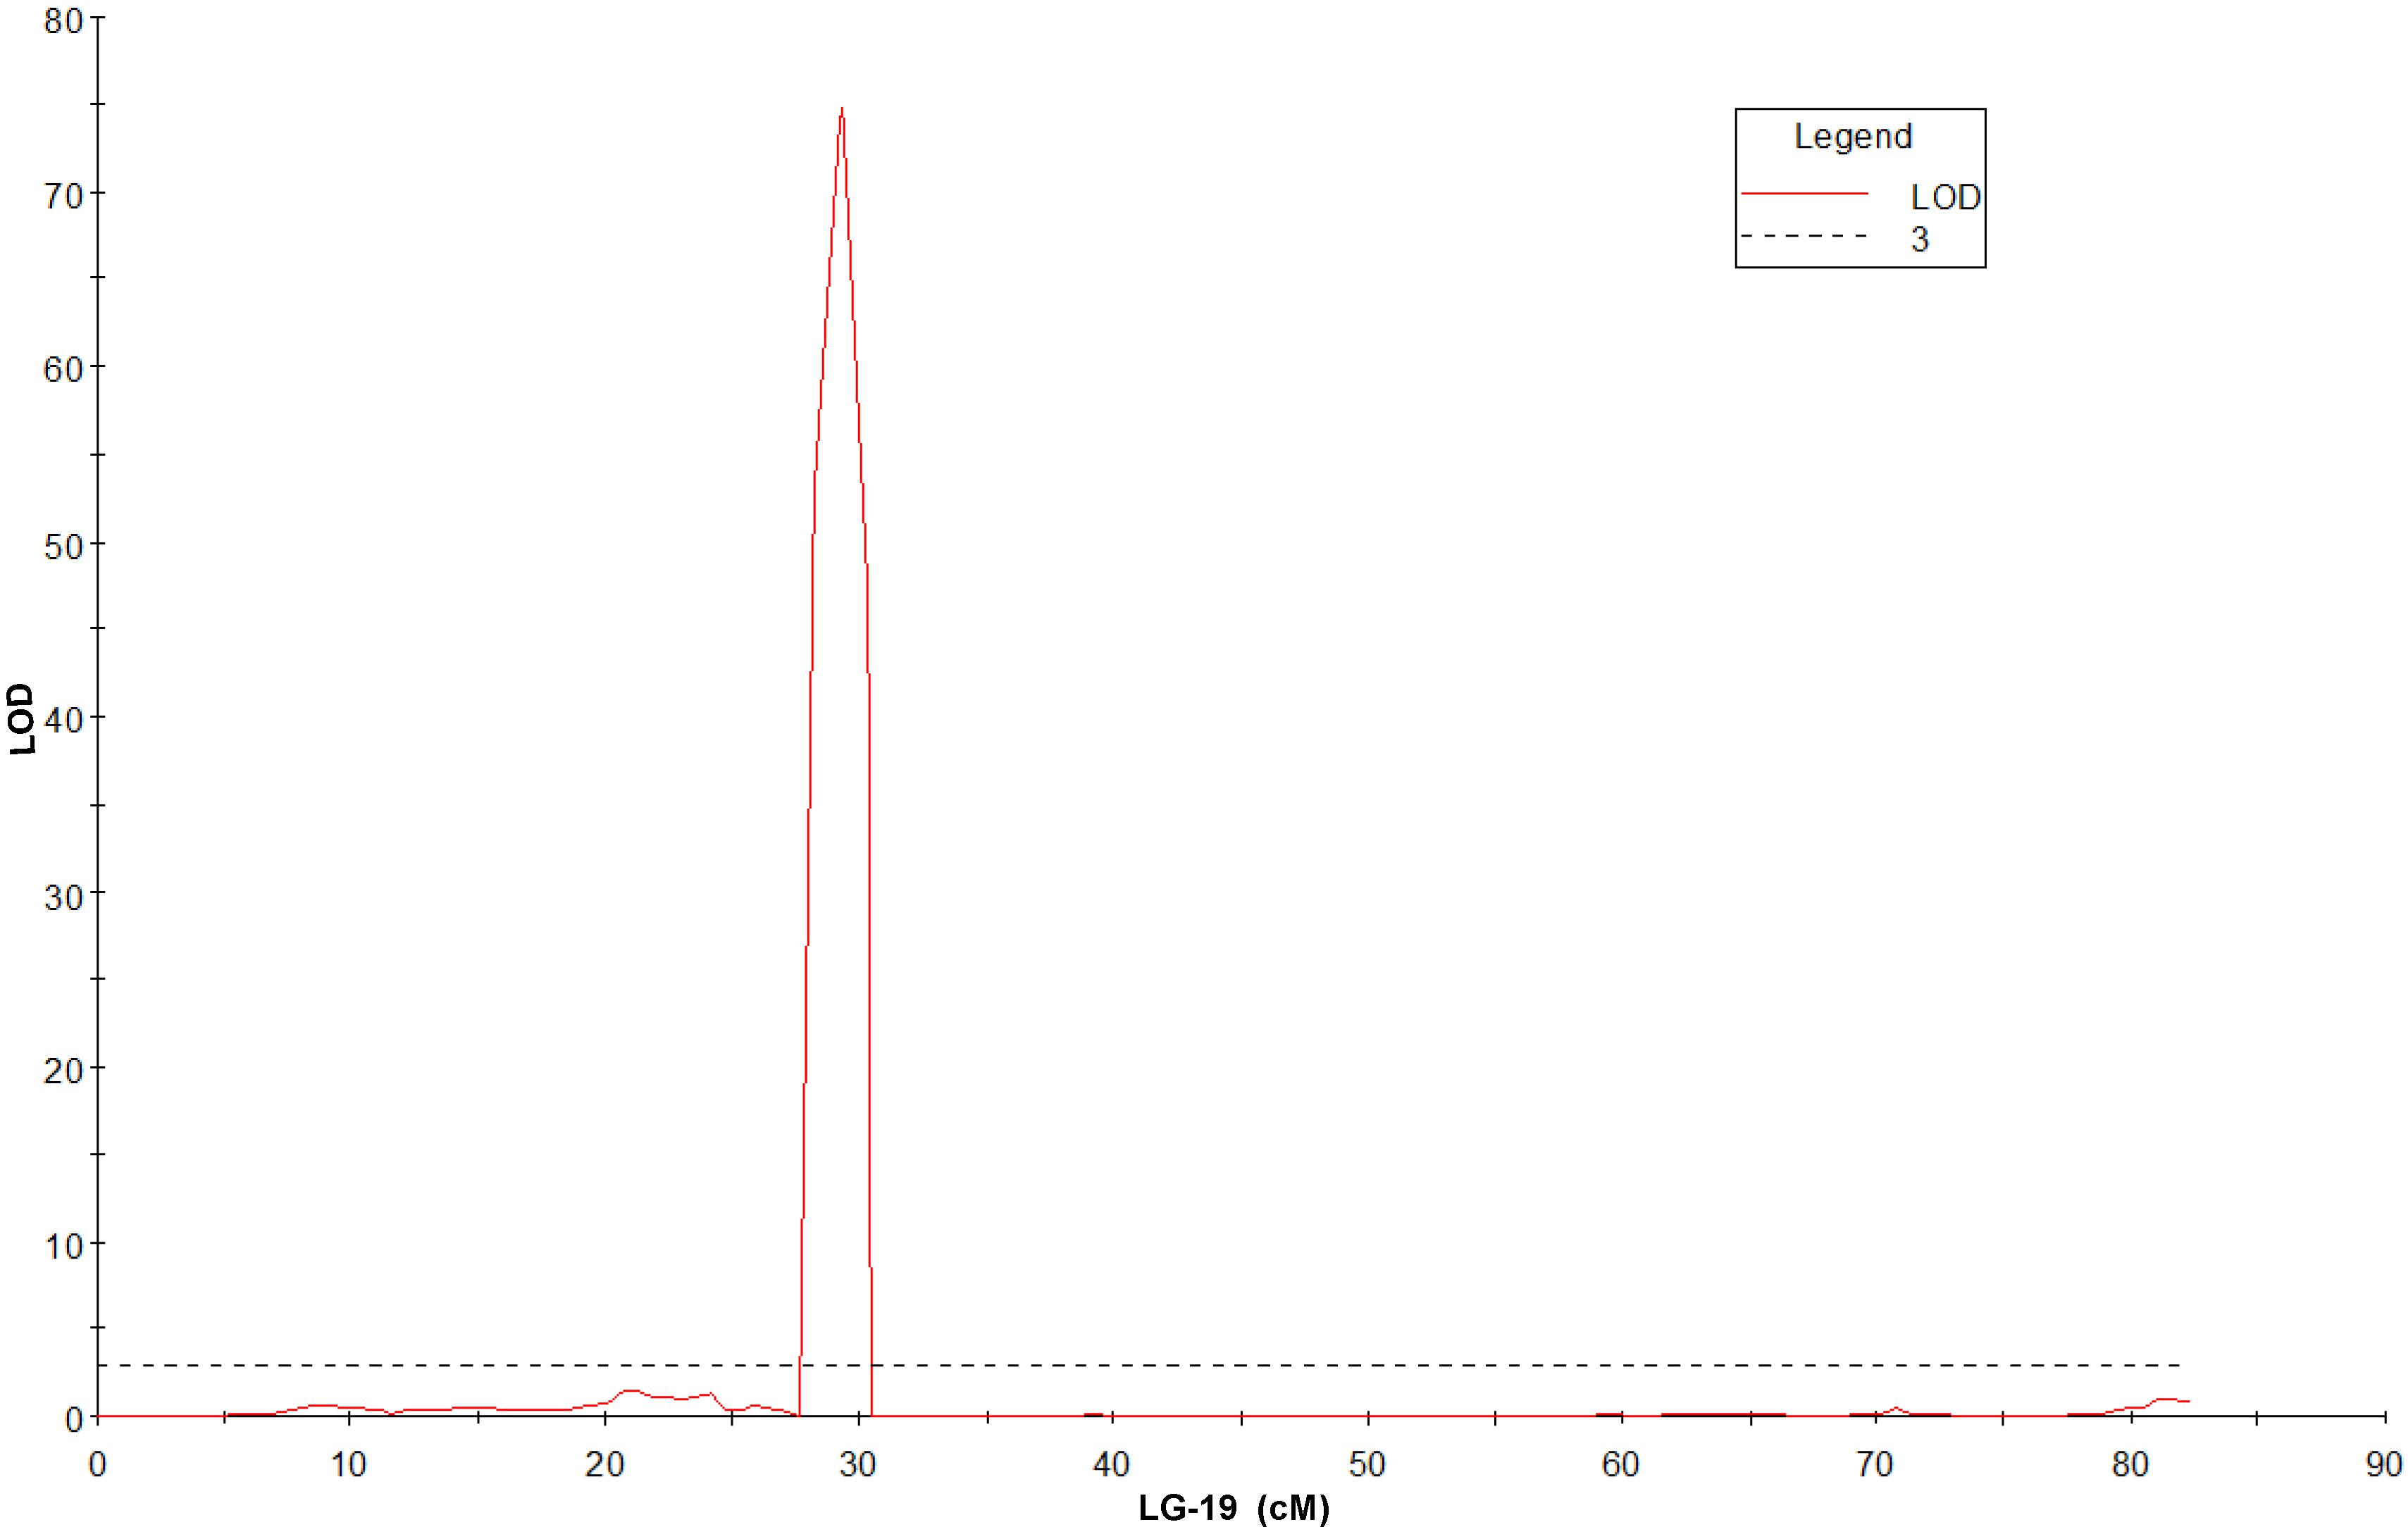
QTL mapping and fine mapping were used to validate the candidate gene. The genetic map from 83A:476 and P27255 population was constructed in our previous studies (Zhou et al., 2018). The genetic map contains 27,892 markers (Supplementary Data Sheet 1). A simplified map containing one marker for each locus was used for QTL mapping. QTL analysis was conducted in the RIL population. A single major QTL for gray leaf spot resistance was identified on chromosome 19. The closest marker DAFWAsnp_16977 (29.33 cM) can explain 97.9% phenotypic variations and with the LOD value of 74.83 (Figure 3 and Supplementary Figure 1).
The recombinant lines around the QTL region (23.58 to 32.78 cM) were investigated in the RIL8 population. A total of 16 recombinant lines were obtained based on the genotypes (Figure 4). Figure 4 showed that the genotypes of QTL marker DAFWAsnp_16977 were consistent with their gray leaf spot resistance in this population. From these recombinant lines, the gene was narrowed down by the lines W/D039 and W/D056. The recombination point of W/D039 was between the markers DAFWAsnp_20112 (R genotype) and DAFWAsnp_16977 (S genotype), while the GLS resistance of this line was susceptible, so the gene must be on the right side of the marker DAFWAsnp_20112. For the line W/D056, the recombination point was between the markers DAFWAsnp_19170 (S genotype) and DAFWAsnp_20338 (R genotype), and the GLS resistance was susceptible, so the gene should be on the left side of the marker DAFWAsnp_20338. In a word, the gene was narrowed down between the two markers DAFWAsnp_20112 and DAFWAsnp_20338. These markers were anchored to narrow-leafed lupin cv. Tanjil genome, and the physical positions of the markers were 2,157,779 and 2,399,114 bp, respectively. The QTL was finally fine-mapped to a 241-kb region. The three MFLP markers (D145, D280, and D300) overlapped with this fine mapping region.
Genes in the Region
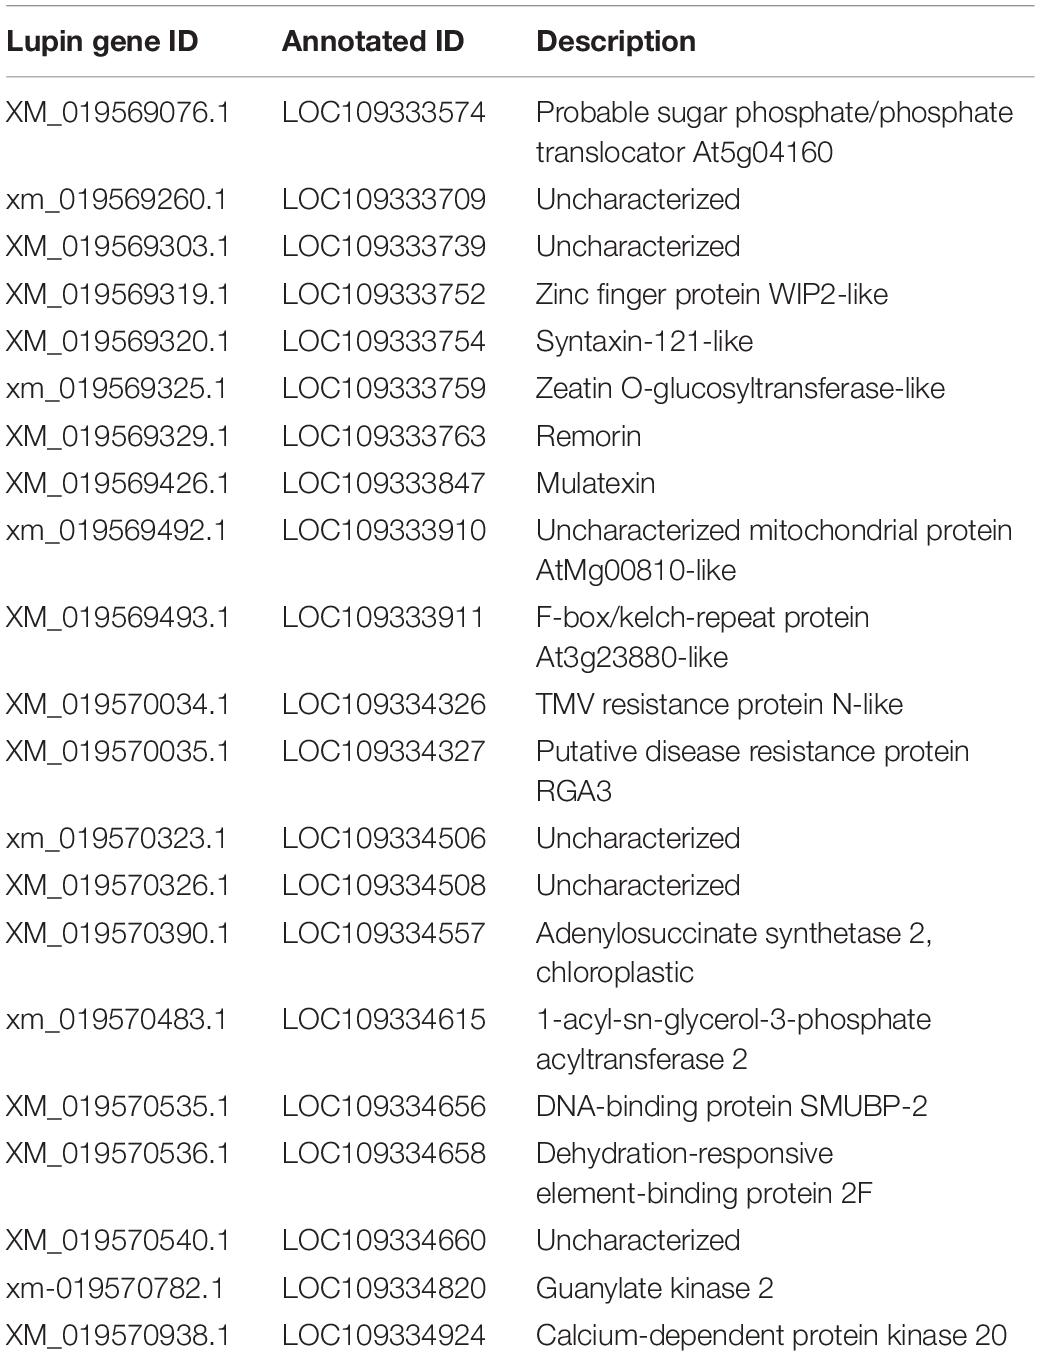
A total of 21 genes were annotated in the QTL mapping region (Table 2). Two genes, LOC109334326 and LOC109334327, were associated with disease resistance. LOC109334326 is a TMV resistance protein N-like, and LOC109334327 is a putative disease resistance protein RGA3 (Wang et al., 2020).
Candidate Gene Identification
Genomic sequence analysis revealed that there were six SNPs in the LOC109334326 region between 83A:476 and P27255 (Figure 5). Two SNPs were in the 5′-UTR regions, while the other four SNPs were in the coding region. Only one SNP (T/C) at 2,190,169 in the coding region induces amino acid substitution from leucine in 83A:476 (R) to proline in P27255 (S) (Figure 5).

Figure 5. Candidate gene LOC109334326 DNA structure. Introns and exons are represented with continuous lines and gray rectangular boxes. Start codon and stop codon are marked with red lines. 5’-UTR and 3’-UTR are shown in the figure. SNP variations are marked with blue lines and letters (83A:476 on the left, and P27255 on the right). One amino acid substitution is indicated in the figure.
To further investigate these two genes, we used two additional Australian cultivars Tanjil and Unicrop. Tanjil is resistant to gray leaf spot disease, while Unicrop is susceptible. Unicrop was re-sequenced and mapped to the Tanjil reference genome. The segregation of susceptible:resistant in the F8 population fit the expected 1:1 ratio (χ2 = 3.76, χ20.05,1 = 3.84), (χ2 < χ20.05,1). It indicated that a single gene controlled GLS resistance in the Tanjil and Unicrop population. Interestingly, the result indicated that there was only one SNP variation from T (Tanjil) to C (Unicrop) at 2,190,196 bp in the 241-kb fine-mapping region on chromosome 19, and this SNP variation from the gene LOC109334326 results in the same amino acid substitution from leucine in Tanjil (R) to proline in Unicrop (S). It indicates that this is the candidate gene for gray leaf spot resistance.
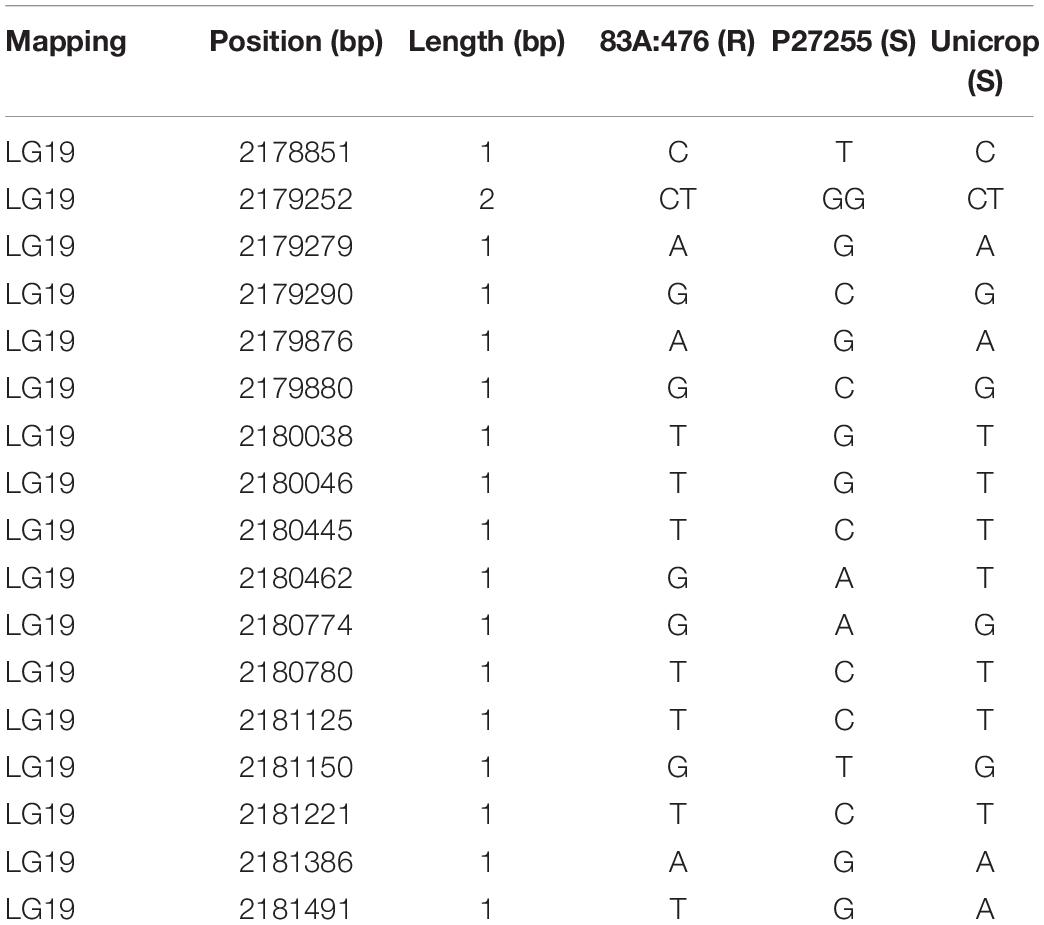
For another disease resistance RGA3 gene LOC109334327, 17 SNPs were detected between the parental lines 83A:476 and P27255 (Table 3), but no variations exist between Tanjil and Unicrop. Furthermore, no SNPs were identified between the tolerant line 83A:476 and the susceptible cultivar Unicrop. It indicates that this gene is not the candidate gene.
Single-Nucleotide Polymorphism Marker Development for Gray Leaf Spot Resistance
To confirm the Tanjil carrying the same GLS QTL/locus, which was mapped from 83A:476 and P27255 population, a dominant SNP resistant marker was developed for the GLS candidate gene (forward: TCTGATGGCGTACATGTGTAA, reverse: TACTCTGCCCTCACTGACCT). This marker was tested in 93 RIL8 derived from a cross between Tanjil and Unicrop. The genotypes co-segregated with their GLS resistance (Supplementary Table 2).
Phylogenetic Tree
The gene alleles were investigated among Australian and European lines. SNP variants of the gene (LOC109334326) were analyzed among 18 narrow-leafed lupin accessions consisting of Australian varieties, Australian breeding lines, and European wild lupin (Tanjil, Yorrel, Coromup, Mandelup, Merrit, 83A:476, Moonah, Unicrop, Kalya, Tallerack, P26167, P27255, Quillinock, 75A:258, P26603, Bo7212, P26668, and P27221). The genomic sequences of these accessions were obtained from the China National GeneBank Database (see text footnote 1) and were available under the project accession CNP0001034. The sequence reads were mapped to the reference genome Tanjil, and SNP variants were obtained (see Supplementary Data). The phylogenetic tree (Figure 6) showed that they were classified into two major groups. All the European wild lupin accessions, together with the Australian variety/breeding lines Quillinock and 75A:258, were in one group, while all the other Australian varieties/breeding lines were clustered into another group. Furthermore, all the resistant (Tanjil, Yorrel, Coromup, Mandelup, Merrit, and 83A:476) and susceptible varieties (Moonah, Unicrop, Kalya, and Tallerack) from the major group were divided into different sub-groups. For the resistant gene, two alleles were identified. Australian resistant cultivars Tanjil, Yorrel, Coromup, Mandelup, and Merrit carried the same allele, while the breeding line 83A:476 carried a different GLS allele. It indicated that new GLS-resistant allele from lupin germplasm was incorporated into the breeding line 83A:476 during the breeding program.
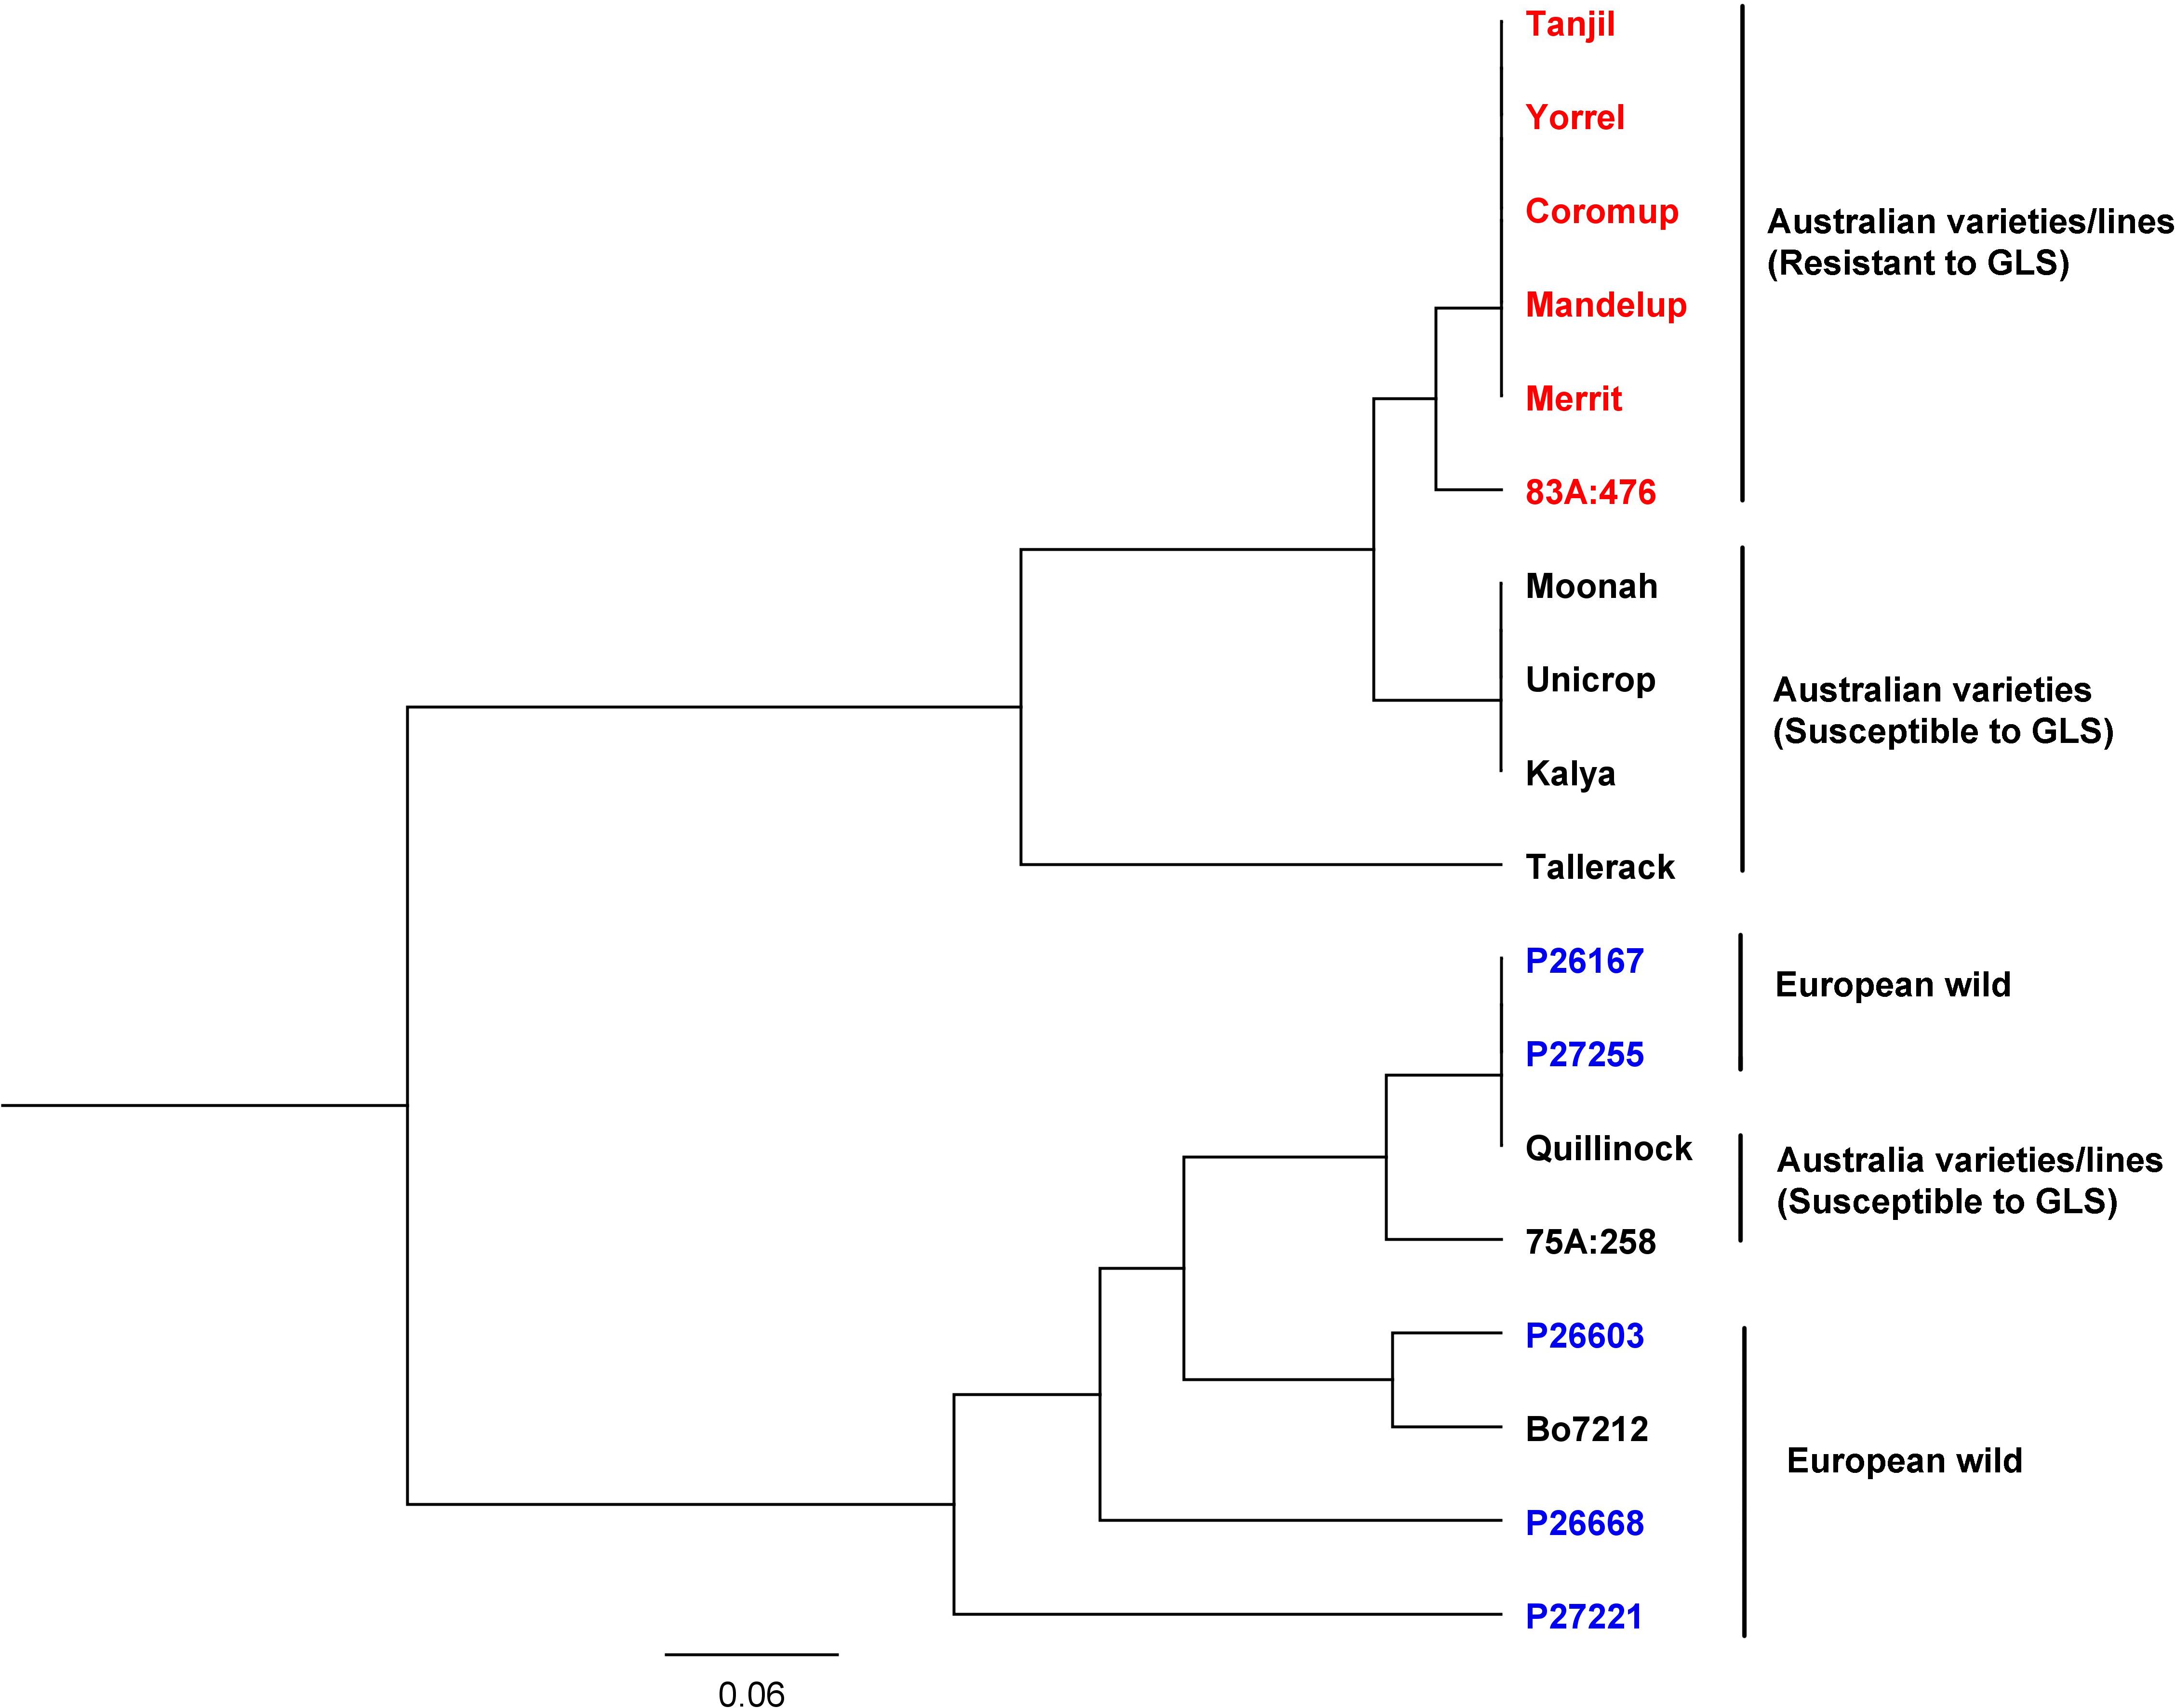
Figure 6. Phylogenetic tree of gray leaf spot candidate gene from 18 narrow-leafed lupin accessions.
Discussion
In the present study, the rapid mapping method was used to develop markers for the GLS resistance gene in lupin. Based on the GLS segregation ratio of 1:1 in 109 RILs, it was confirmed that only one major resistance locus existed in this population. At the first step, only 15 RILs from resistance and susceptible groups were selected for gene mapping. This method significantly reduced cost and saved time. Eleven resistant lines and six susceptible lines were genotyped with MFLP markers. A total of 1,657 polymorphic markers were identified in the RILs. Finally, three co-segregated MFLP markers (D145, D280, and D300) were identified.
The sequences of the three MFLP amplicons were obtained and anchored to the lupin linkage group LG19 with the physical position of 2.156 and 2.218 Mb by running blast against the lupin cv. Tanjil reference genome (Wang et al., 2020). It indicated that the three MFLP were in the same chromosome and the same region in lupin.
To compare the result with the QTL mapping result. The bio-parental lines were re-sequenced using a RAD method. A major advantage of RAD sequencing is that it can generate tens of thousands of SNPs and InDels (insertions and deletions), which can be used for MAS in plant-breeding programs. Furthermore, all the variants detected from RAD sequencing have had the DNA sequenced already. Therefore, conversion of variants into PCR-based markers does not need PCR amplification, ligation, transformation, and sequencing as required from traditional markers such as AFLP (Shan et al., 1999), RAPD (Paran and Michelmore, 1993), and MFLP (Yang et al., 2002). One single QTL was detected, and the closest marker DAFWAsnp_16977 was mapped to 2.167 Mb on chromosome LG19. This result is consistent with the positions of the MFLP markers (2.156–2.218 Mb). It indicated that rapid genotyping of a few lines can be an effective and efficient way to develop disease-linked markers if the trait is controlled by a single major gene, and phenotypes are very stable for quantitative traits.
A high-density genetic map and many population lines will facilitate us to narrow down the QTL region. In this study, the QTL was mapped to a 241-kb region. There were two genes (LOC109334326 and LOC109334327) associated with disease resistance. Even though there were 17 variations in LOC109334327 between 83A:476 and P27255 (Table 3), no variations were detected between Tanjil (R) and Unicrop (S) in the gene region including 5′-UTR and 3′-UTR. Furthermore, no variations were identified between the tolerant breeding line 83A:476 and the susceptible variety Unicrop. It indicated that this gene was not associated with gray leaf spot resistance. For the other gene LOC109334326, one SNP variation resulted in one amino acid substitution between 83A:476 (R) and P27255 (S), and this SNP was also the only variation between Tanjil (R) and Unicrop (S) in the 241-kb QTL region based on re-sequence mapping result. We assumed that Tanjil and 83A:476 shared the same gene or locus. After the candidate gene was identified, molecular markers should be used to validate that the gene marker co-segregated with the resistance in the Tanjil and Unicrop population.
A dominant SNP marker for GLS was developed based on the SNP variation in the candidate gene LOC109334326 and validated in the RIL population derived from the cross between Tanjil and Unicrop. The genotypes co-segregated with their phenotypes in the RIL population. It indicated that Tanjil and 83A:476 could have the same gene or locus. Currently, there are several methods for SNP marker development, such as McSNP (melting curve analysis of SNPs), KASP (kompetitive allele-specific PCR), and CAPS (cleaved amplified polymorphic sequences). This dominant marker can be converted to these kinds of markers depending on the laboratory instruments.
Phylogenetic tree results indicated that the resistance allele of GLS candidate gene was different from the alleles from the European wild ecotypes because the resistant allele was found from a United States wild ecotype of Lupinus angustifolius, which was later incorporated into the Australian varieties since the 1970s (Thomas et al., 2011). Two resistant alleles indicated that the breeding line 83A:476 incorporated a new allele from our lupin germplasm.
The results demonstrated that RAD sequencing is a rapid approach to identify molecular markers closely linked to the trait of interest for MAS in breeding programs. Whole-genome re-sequencing can facilitate us to identify the DNA variations and candidate genes. The transgenic complementation of the candidate gene and GLS resistance mechanism will be studied in the future.
Data Availability Statement
The datasets presented in this study can be found in online repositories. The names of the repository/repositories and accession number(s) can be found in the article/Supplementary Material.
Author Contributions
HY, DR, and GT performed the genotyping and phenotyping. GZ analyzed the data and wrote the manuscript. MZ analyzed the phylogenetic tree. HY and CL supervised this study. All authors have discussed and revised the manuscript.
Conflict of Interest
The authors declare that the research was conducted in the absence of any commercial or financial relationships that could be construed as a potential conflict of interest.
Publisher’s Note
All claims expressed in this article are solely those of the authors and do not necessarily represent those of their affiliated organizations, or those of the publisher, the editors and the reviewers. Any product that may be evaluated in this article, or claim that may be made by its manufacturer, is not guaranteed or endorsed by the publisher.
Acknowledgments
This work was conducted with support from the Western Australian State Agricultural Biotechnology Centre.
Supplementary Material
The Supplementary Material for this article can be found online at: https://www.frontiersin.org/articles/10.3389/fgene.2021.695791/full#supplementary-material
Supplementary Figure 1 | QTL for gray leaf spot disease resistance in narrow-leafed lupin (Threshold LOD = 3).
Supplementary Table 1 | MFLP marker amplicon sequence.
Supplementary Table 2 | SNP genotyping and GLS phenotyping in RIL population derived from Tanjil and Unicrop. ? represents unclear phenotype.
Supplementary Table 3 | SNPs of LOC109334327 in narrow-leafed lupin germplasm.
Supplementary Data Sheet 1 | Genotypes and GLS phenotypes in mapping population.
Footnotes
References
Ahmad, A., Thomas, G. J., Barker, S. J., and MacLeod, W. J. (2016). Genotype resistance, inoculum source and environment directly influence development of grey leaf spot (caused by Stemphylium spp.) and yield loss in narrow-leafed lupin (Lupinus angustifolius). Crop Pasture Sci. 67, 81–90. doi: 10.1071/cp15073
Baird, N. A., Etter, P. D., Atwood, T. S., Currey, M. C., Shiver, A. L., Lewis, Z. A., et al. (2008). Rapid SNP discovery and genetic mapping using sequenced RAD markers. PLoS One 3:e3376. doi: 10.1371/journal.pone.0003376
Boersma, J., Nelson, M., Sivasithamparam, K., and Yang, H. (2009). Development of sequence-specific PCR markers linked to the Tardus gene that reduces pod shattering in narrow-leafed lupin (Lupinus angustifolius L.). Mol. Breed. 23, 259–267. doi: 10.1007/s11032-008-9230-2
Brown-Guedira, G. (2005). Integrating MAS with conventional wheat breeding programs. Phytopathology 95:S139.
Catchen, J. M., Amores, A., Hohenlohe, P., Cresko, W., and Postlethwait, J. H. (2011). Stacks: building and genotyping loci de novo from short-read sequences. G3 Genes Genom. Genet. 1, 171–182. doi: 10.1534/g3.111.000240
Chia, J. M., Song, C., Bradbury, P. J., Costich, D., de Leon, N., Doebley, J., et al. (2012). Maize HapMap2 identifies extant variation from a genome in flux. Nat. Genet. 44, 803–U238.
Chutimanitsakun, Y., Nipper, R. W., Cuesta-Marcos, A., Cistue, L., Corey, A., Filichkina, T., et al. (2011). Construction and application for QTL analysis of a restriction site associated DNA (RAD) linkage map in barley. BMC Genom. 12:4. doi: 10.1186/1471-2164-12-4
Eagles, H. A., Bariana, H. S., Ogbonnaya, F. C., Rebetzke, G. J., Hollamby, G. J., Henry, R. J., et al. (2001). Implementation of markers in Australian wheat breeding. Aust. J. Agric. Res. 52, 1349–1356. doi: 10.1071/ar01067
Everts, K. L., and Armentrout, D. K. (2001). Report of leaf spot of spinach caused by Stemphylium botryosum in Maryland and Delaware. Plant Dis. 85:1209. doi: 10.1094/pdis.2001.85.11.1209b
Forbes, I., Wells, H. D., Edwards, D., and Ostazeski, S. (1961). Inheritance of resistance to gray leaf spot disease and of an antho-cyanin inhibitor in blue lupines. Crop Sci. 1, 1037–1038.
Jiao, Y. P., Zhao, H. N., Ren, L. H., Song, W. B., Zeng, B., Guo, J. J., et al. (2014). Genome-wide genetic changes during modern breeding of maize. Nat. Genet. 46, 1039–1040. doi: 10.1038/ng0914-1039
Lin, R. M., Renshaw, D., Luckett, D., Clements, J., Yan, G. J., Adhikari, K., et al. (2009). Development of a sequence-specific PCR marker linked to the gene “pauper” conferring low-alkaloids in white lupin (Lupinus albus L.) for marker assisted selection. Mol. Breed. 23, 153–161. doi: 10.1007/s11032-008-9222-2
Ogbonnaya, F. C., Subrahmanyam, N. C., Moullet, O., de Majnik, J., Eagles, H. A., Brown, J. S., et al. (2001). Diagnostic DNA markers for cereal cyst nematode resistance in bread wheat. Aust. J. Agric. Res. 52, 1367–1374. doi: 10.1071/ar01031
Paran, I., and Michelmore, R. W. (1993). Development of reliable PCR-based markers linked to downy mildew resistance genes in lettuce. Theor. Appl. Genet. 85, 985–993. doi: 10.1007/bf00215038
Shan, X., Blake, T. K., and Talbert, L. E. (1999). Conversion of AFLP markers to sequence-specific PCR markers in barley and wheat. Theor. Appl. Genet. 98, 1072–1078. doi: 10.1007/s001220051169
Sharp, P. J., Johnston, S., Brown, G., McIntosh, R. A., Pallotta, M., Carter, M., et al. (2001). Validation of molecular markers for wheat breeding. Aust. J. Agric. Res. 52, 1357–1366.
Thomas, G. J., Buirchell, B. J., and Adcock, K. G. (2011). Re-emergence of grey leaf spot caused by Stemphylium botryosum and its implications for Western Australian lupins. Austral. Plant Path. 40, 537–539. doi: 10.1007/s13313-011-0078-2
Vaghefi, N., Thompson, S. M., Kimber, R. B. E., Thomas, G. J., Kant, P., Barbetti, M. J., et al. (2020). Multi-locus phylogeny and pathogenicity of Stemphylium species associated with legumes in Australia. Mycol. Prog. 19, 381–396. doi: 10.1007/s11557-020-01566-8
Wang, P., Zhou, G., Jian, J., Yang, H., Renshaw, D., Aubert, M. K., et al. (2020). Whole-genome assembly and resequencing reveal genomic imprint and key genes of rapid domestication in narrow-leafed lupin. Plant J. 105, 1192–1210. doi: 10.1111/tpj.15100
Yang, H., Renshaw, D., Thomas, G., Buirchell, B., and Sweetingham, M. (2008). A strategy to develop molecular markers applicable to a wide range of crosses for marker assisted selection in plant breeding: a case study on anthracnose disease resistance in lupin (Lupinus angustifolius L.). Mol. Breed. 21, 473–483. doi: 10.1007/s11032-007-9146-2
Yang, H., Shankar, M., Buirchell, B. J., Sweetingham, M. W., Caminero, C., and Smith, P. M. C. (2002). Development of molecular markers using MFLP linked to a gene conferring resistance to Diaporthe toxica in narrow-leafed lupin (Lupinus angustifolius L.). Theor. Appl. Genet. 105, 265–270. doi: 10.1007/s00122-002-0925-1
Yang, H., Sweetingham, M. W., Cowling, W. A., and Smith, P. M. C. (2001). DNA fingerprinting based on microsatellite-anchored fragment length polymorphisms, and isolation of sequence-specific PCR markers in lupin (Lupinus angustifolius L.). Mol. Breed. 7, 203–209.
Yang, H. A., Tao, Y., Zheng, Z. Q., Shao, D., Li, Z. Z., Sweetingham, M. W., et al. (2013a). Rapid development of molecular markers by next-generation sequencing linked to a gene conferring phomopsis stem blight disease resistance for marker-assisted selection in lupin (Lupinus angustifolius L.) breeding. Theor. Appl. Genet. 126, 511–522. doi: 10.1007/s00122-012-1997-1
Yang, H. A., Tao, Y., Zheng, Z. Q., Zhang, Q. S., Zhou, G. F., Sweetingham, M. W., et al. (2013b). Draft genome sequence, and a sequence-defined genetic linkage map of the legume crop species Lupinus angustifolius L. PLoS One 8:e64799. doi: 10.1371/journal.pone.0064799
You, M., Boersma, J. G., Buirchell, B. J., Sweetingham, M. W., Siddique, K. H. M., Yang, H., et al. (2005). molecular marker applicable for marker-assisted selection for anthracnose disease resistance in lupin breeding. Cell Mol. Biol. Lett. 10, 123–134.
Zhou, G. F., Jian, J. B., Wang, P. H., Li, C. D., Tao, Y., Li, X., et al. (2018). Construction of an ultra-high density consensus genetic map, and enhancement of the physical map from genome sequencing in Lupinus angustifolius. Theor. Appl. Genet. 131, 209–223. doi: 10.1007/s00122-017-2997-y
Keywords: SNP, lupin, grey leaf spot, QTL, fine mapping, sequencing
Citation: Zhou G, Yang H, Renshaw D, Zou M, Thomas G and Li C (2021) Identification of Gray Leaf Spot Disease Candidate Gene in Narrow-Leafed Lupin (Lupinus angustifolius L.). Front. Genet. 12:695791. doi: 10.3389/fgene.2021.695791
Received: 15 April 2021; Accepted: 06 July 2021;
Published: 05 August 2021.
Edited by:
Longjiang Fan, Zhejiang University, ChinaReviewed by:
Ye Chu, The University of Georgia, United StatesPaolo Franchini, University of Konstanz, Germany
Copyright © 2021 Zhou, Yang, Renshaw, Zou, Thomas and Li. This is an open-access article distributed under the terms of the Creative Commons Attribution License (CC BY). The use, distribution or reproduction in other forums is permitted, provided the original author(s) and the copyright owner(s) are credited and that the original publication in this journal is cited, in accordance with accepted academic practice. No use, distribution or reproduction is permitted which does not comply with these terms.
*Correspondence: Chengdao Li, Qy5saUBtdXJkb2NoLmVkdS5hdQ==
 Gaofeng Zhou
 Huaan Yang1
 Geoff Thomas
 Chengdao Li