 Juanli Zhang1
 Qiaoli Yang1
 Jiaojiao Yang1Xiaoli Gao1
 Ruirui Luo1
 Xiaoyu Huang1Zunqiang Yan1Pengfei Wang1Wei Wang1Kaihui Xie1
 Bo Zhang1
 Shuangbao Gun1,2*
- 1College of Animal Science and Technology, Gansu Agricultural University, Lanzhou, China
- 2Gansu Research Center for Swine Production Engineering and Technology, Lanzhou, China
Piglet diarrhea is a swine disease responsible for serious economic impacts in the pig industry. Clostridium perfringens beta2 toxin (CPB2), which is a major toxin of C. perfringens type C, may cause intestinal diseases in many domestic animals. N6-methyladenosine (m6A) RNA methylation plays critical roles in many immune and inflammatory diseases in livestock and other animals. However, the role of m6A methylation in porcine intestinal epithelial (IPEC-J2) cells exposed to CPB2 has not been studied. To address this issue, we treated IPEC-J2 cells with CPB2 toxin and then quantified methylation-related enzyme expression by RT-qPCR and assessed the m6A methylation status of the samples by colorimetric N6-methyladenosine quantification. The results showed that the methylation enzymes changed to varying degrees while the m6A methylation level increased (p < 0.01). On this basis, we performed N6-methyladenosine sequencing (m6A-seq) and RNA sequencing (RNA-seq) to examine the detailed m6A modifications and gene expression of the IPEC-J2 cells following CPB2 toxin exposure. Our results indicated that 1,448 m6A modification sites, including 437 up-regulated and 1,011 down-regulated, differed significantly between CPB2 toxin exposed cells and non-exposed cells (p < 0.05). KEGG pathway analysis results showed that m6A peaks up-regulated genes (n = 394) were mainly enriched in cancer, Cushing syndrome and Wnt signaling pathways, while m6A peaks down-regulated genes (n = 920) were mainly associated with apoptosis, small cell lung cancer, and the herpes simplex virus 1 infection signaling pathway. Furthermore, gene expression (RNA-seq data) analysis identified 1,636 differentially expressed genes (DEGs), of which 1,094 were up-regulated and 542 were down-regulated in the toxin exposed group compared with the control group. In addition, the down-regulated genes were involved in the Hippo and Wnt signaling pathways. Interestingly, the combined results of m6A-seq and RNA-seq identified genes with up-regulated m6A peaks but with down-regulated expression, here referred to as “hyper-down” genes (n = 18), which were mainly enriched in the Wnt signaling pathway. Therefore, we speculate that the genes in the Wnt signaling pathway may be modified by m6A methylation in CPB2-induced IPEC-J2 cells. These findings provide new insights enabling further exploration of the mechanisms underlying piglet diarrhea caused by CPB2 toxin.
Introduction
Clostridium perfringens, which is one of the most important zoonotic pathogens (Immerseel et al., 2005), can cause severe bleeding ulcers and mucosal necrosis of the small intestine in humans and animals. It can produce four main toxins (α, β, ε, ι), according to which it is divided into five types: A, B, C, D, and E (Garcia et al., 2012). The C. perfringens beta2 (CPB2) toxin was first discovered in the supernatant of a culture of C. perfringens type C by Gibert et al. (1997). Its protein molecular weight is 28 kDa, with an isoelectric point of 5.4–5.5, and it is associated with gastrointestinal diseases in livestock caused by C. perfringens. The effect of CPB2 toxin on intestinal membrane epithelial cells indicates that it is strongly cytotoxic. When a low concentration of the toxin is introduced into these cells, the cells become rounded and damaged (Gibert et al., 1997). However, the mechanism by which CPB2 toxin induces diarrhea in animals (especially pigs) is still unclear and should be further studied.
N6-methyladenosine (m6A) modification is pervasive within mRNA and plays important regulatory roles in various biological processes (Meyer et al., 2012). In mammalian species, about one-third of mRNAs are modified by m6A (average of three to five m6A modifications in each mRNA), and many m6A sites are evolutionarily conserved between humans and mice (Huang et al., 2020). Dominissini et al. (2012) used m6A-specific antibodies to enrich fragments containing m6A and to identify the expression of m6A in whole transcripts of humans and mice by a high-throughput sequencing method (MeRIP-seq). m6A is mainly located near the termination codons and 3′UTRs of mRNA, and can influence pre-mRNA splicing (Zhao et al., 2014; Xiao et al., 2016), RNA structure (Liu et al., 2015), nuclear mRNA (Fustin et al., 2013), miRNA maturation (Alarcón et al., 2015), mRNA stability (Huang et al., 2018), chromosome inactivation (Patil et al., 2016), mRNA translation (Shi et al., 2017), and even RNA degradation (Zhu et al., 2014).
m6A modification plays very important roles in various immune and inflammatory responses to bacterial infection, such as the inflammatory response of human dental pulp cells (HDPCs) induced by lipopolysaccharide (LPS) (Feng et al., 2018) and the response of porcine small intestinal epithelial (IPEC-J2) cells to Escherichia coli K88 infection (Zong et al., 2018). In addition, Wu et al. (2020) found that deletion of YTH domain family 2 (YTHDF2) in the m6A reader promotes the demethylation of histone H3 lysine-27 trimethylation (H3K27me3) modifications, which in turn increases proinflammatory cytokine levels. However, the role of m6A modification in IPEC-J2 cells exposed to CPB2 remains unclear. Therefore, to better understand m6A modification in response to CPB2 toxin exposure, we performed N6-methyladenosine sequencing (m6A-seq) and RNA sequencing (RNA-seq) to investigate differentially methylated genes (DMGs) and differentially expressed genes (DEGs) in IPEC-J2 cells that were exposed to CPB2. Our results provide a theoretical basis for further research into the molecular mechanisms of m6A modification in IPEC-J2 cells exposed to CPB2.
Materials and Methods
CPB2 Toxin Extraction and Purification
The extraction and purification of CPB2 toxin were performed according to the method described by Luo et al. (2020). Briefly, a recombinant plasmid containing the CPB2 gene was successfully constructed and transformed into E. coli BL21 competent cells. Then, a single colony was selected, placed in medium containing kanamycin and incubated for 2.5 h at 37°C and 220 rpm. When the optical density (OD) reached 0.5–0.8, 1 mM isopropyl β-d-1-thiogalactopyranoside (IPTG, Solarbio, Beijing, China) was added to induce the bacteria at 16°C for 12 h. The precipitates were collected and suspended in 20 mM Tris-HCl buffer (pH 8.0), sonicated on ice, and purified by using High-Affinity Ni-Charged Resin FF (GenScript, Nanjing, China). The resin was washed with 10 mM imidazole lysis buffer and then eluted with 250 and 500 mM imidazole. Recombinant protein expression was detected by 12% alkyl sulfate-polyacrylamide gel electrophoresis (SDS-PAGE). Next, 10 mL of protein sample was loaded into a membrane and purified by dialysis against 1 × PBS (pH 7.6) for 24 h, then concentrated with PEG6000 for 40 min. Finally, Endotoxin Erasol (Genscript, Nanjing, China) was used to remove endotoxins.
Cell Culture
IPEC-J2 cells were provided by the Beijing Beina Chuanglian Institute of Biotechnology (Beijing, China) and cultured in 90% Dulbecco’s modified Eagle’s medium (DMEM, HyClone, Logan, United States) with 10% fetal bovine serum (FBS, HyClone), penicillin (100 U/mL), and streptomycin (100 μg/mL) at 37°C in a 5% CO2 atmosphere. The medium was changed every 2 days, and the cells were passaged by trypsinization at 80–90% confluency.
CPB2 Toxin Treatment of Cells and Total m6A Measurement
IPEC-J2 cells were seeded in 6-well plates at a density of 1×10⁵ cells/mL and cultured overnight (24 h). Then, cells in three wells were each treated with 20 μg/mL CPB2 (treatment group) while cells in the other three wells were not exposed to toxin (control group) (Gao et al., 2020; Luo et al., 2020). Total RNA was extracted by using TRIzol reagent according to the manufacturer’s instructions (Invitrogen, Carlsbad, United States), and the m6A content was detected with an m6A RNA methylation quantification kit (Epigentek, Farmingdale, United States). Specifically, RNA purity was confirmed according to the following ratios: A260/A280 > 1.9 and A260/A230 > 1.7. In each reaction, the RNA (200 ng) samples were treated with an m6A antibody, and detection was performed based on the manufacturer’s instructions. Finally, the absorbance values were measured at 450 nm.
Real-Time Quantitative PCR (RT-qPCR)
RNA (800 ng) from each sample was employed to synthesize cDNA by using a reverse transcription kit (Accurate Biotechnology, Changsha, China). Thereafter, a SYBR® Green Premix Pro Taq HS qPCR Kit (Accurate Biotechnology) and a LightCycler 480II apparatus (Roche, Basel, Switzerland) were used to perform RT-qPCR. The sequences of the primers used in this study are presented in Table 1; GAPDH served as an internal control. The relative levels of DEGs were determined by the 2−ΔΔCt method (Livak and Schmittgen, 2001).
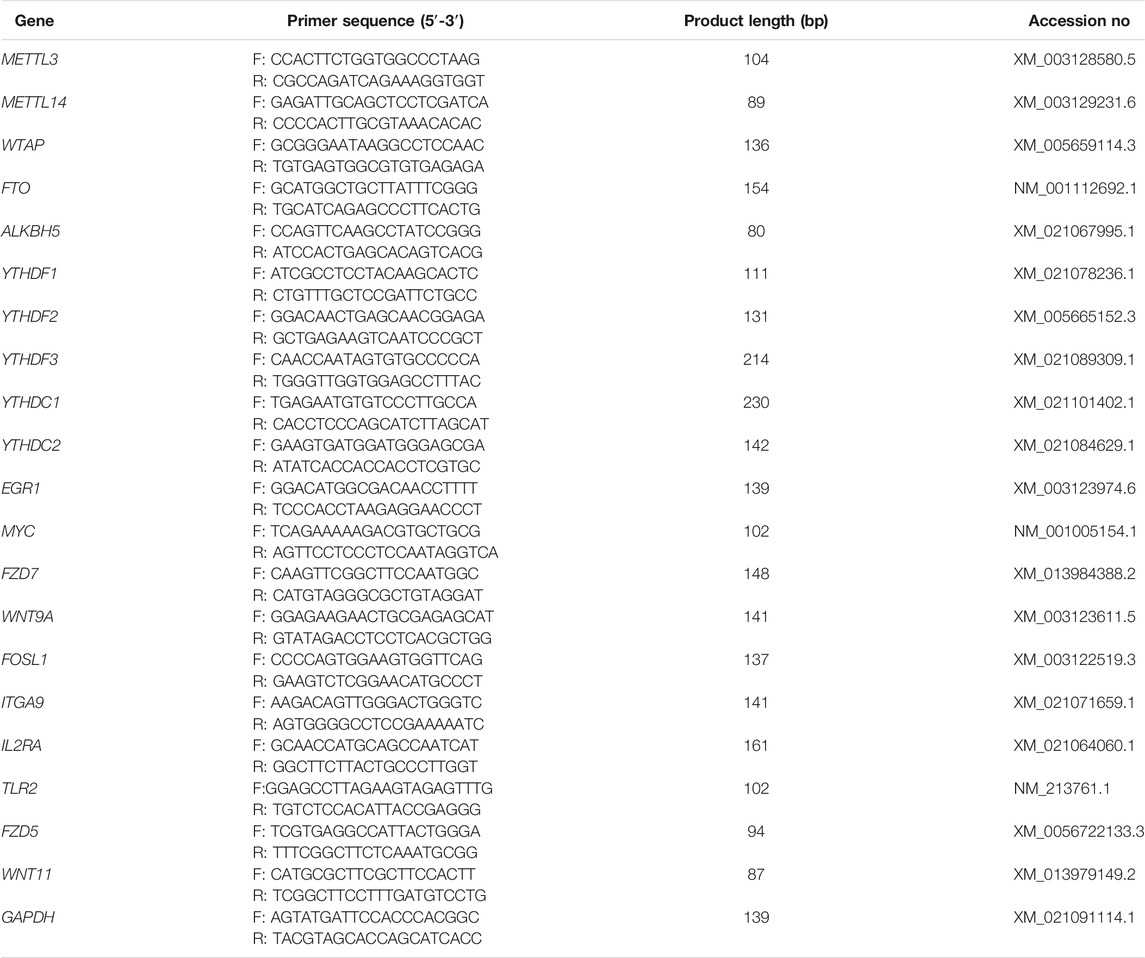
TABLE 1. Primer sequences for RT-qPCR and MeRIP-qPCR.
m6A-Seq and RNA-Seq Library Construction
First, RNA was extracted, and the RNA purity and integrity were analyzed. Total RNA was extracted from IPEC-J2 cells (see CPB2 toxin treatment of cells and total m6A measurement) by using TRIzol reagent (Invitrogen, Carlsbad, United States) and then quantified with a NanoDrop ND-1000 instrument (NanoDrop, Wilmington, United States). A Bioanalyzer 2100 system (Agilent, Santa Clara, United States) was used to evaluate the integrity of RNA according to the criterion of an RNA integrity number (RIN) > 7.0. RNA integrity was further confirmed by denaturing agarose gel electrophoresis. Second, the input (RNA-seq) library and the immunoprecipitation (IP) (m6A-seq) library were constructed. Briefly, an Epicenter Ribo-Zero Gold Kit (Illumina, San Diego, United States) was applied to digest and remove ribosomal RNA (rRNA) from the total RNA. A Magnesium RNA Fragmentation Module (NEB, Ipswich, United States) was used to fragment the RNA into 150-nucleotide-long fragments at 86°C for 7 min. The obtained RNA fragments were then divided into two portions. One portion was used to directly construct a conventional transcriptome sequencing library, which was retained as the input RNA, while the other portion was enriched by an m6A-specific antibody (Synaptic Systems, Gottingen, Germany) and was retained as IP RNA. Thereafter, the IP RNA and input RNA were reverse-transcribed to cDNA by SuperScript™ II Reverse transcriptase (Invitrogen, Carlsbad, United States). The second strand of DNA was then synthesized, and adapters were added to the blunt ends of each strand (each adapter contained a T-base overhang for ligating the adapter to the A-tailed fragmented DNA) by using E. coli DNA polymerase I (NEB, Ipswich, United States), RNase H (NEB, Ipswich, United States) and a dUTP Solution (Thermo Fisher, San Jose, United States). Then, the two strands were digested with the enzyme UDG (NEB), after which PCR was conducted with the following program: predenaturation at 95°C for 3 min; eight cycles of 15 s at 98°C, 15 s at 60°C (annealing), and 30 s at 72°C (extension); and a final extension at 72°C for 5 min. The average insert size for the final cDNA library was 300 ± 50 bp. Finally, the Illumina NovaSeq™ 6000 platform (Illumina, San Diego, United States) was used to carry out double-ended sequencing according to its standard operating procedures in PE150 sequencing mode by LC Bio Technology Co., Ltd., Hangzhou, China.
Bioinformatic Analysis of m6A-Seq and RNA-Seq
Data quality control. We handled the raw data reads of the IP and input samples by using Fastp software (https://github.com/OpenGene/fastp). In this process, the reads showing adaptor contamination, presenting an N ratio >5%, and containing low-quality sequences were removed. Finally, clean reads were obtained (Chen et al., 2018; Wang et al., 2021; Zhao et al., 2021).
Peak identification and differential peak analysis. HISAT2 software (Kim et al., 2015) (http://daehwankimlab.github.io/hisat2) was used to map reads to the Sus scrofa 11.1 reference genome (ftp://ftp.ensembl.org/pub/release-96/fasta/sus_scrofa/dna/). The mapped reads of the IP and input samples were employed for differential peak analysis by using the R package exomePeak (https://bioconductor.org/packages/exomePeak) (Meng et al., 2014; Wang et al., 2021). The peaks were visualized with IGV software (http://www.igv.org) (Robinson et al., 2017; Yang et al., 2020). We annotated the peaks by using ChIPseeker (https://bioconductor.org/packages/ChIPseeker) (Yu et al., 2015). Finally, a motif analysis was performed with the MEME2 (http://meme-suite.org) (Bailey et al., 2009) and HOMER (http://homer.ucsd.edu/homer/motif) (Heinz et al., 2010) softwares.
DMGs and DEGs analysis. StringTie (https://ccb.jhu.edu/software/stringtie) was used to determine the expression levels of all the mRNA transcripts from the input libraries by calculating their fragments per kilobase of transcript per million mapped reads (FPKM) values (total exon fragments/mapped reads [millions] × exon length [kb]) (Pertea et al., 2015), and the R package edgeR (https://bioconductor.org/packages/edgeR) was used to analyze the DEGs (Robinson et al., 2010). Gene Ontology (GO) and Kyoto Encyclopedia of Genes and Genomes (KEGG) analyses were performed with Database for Annotation, Visualization and Integrated Discovery by using OmicStudio tools (https://www.omicstudio.cn/tool) (Chen et al., 2020; Zhou et al., 2020).
M6A IP (MeRIP) Followed RT-qPCR (MeRIP-qPCR)
RNA (1,000 ng/μL) samples from the control and CPB2 groups (300 μL each sample) were subjected to m6A IP using the GenSeq® m6A MeRIP Kit (GenSeq Inc., Shanghai, China) according to the manufacturer’s protocol (Wang et al., 2020a; Hou et al., 2021). Briefly, the RNA was fragmented into smaller pieces of 200 nt by using an RNA fragmentation reagent and then divided into 3 and 297 μL. 3 μL was directly reverse-transcribed into cDNA (input), while the 297 μL was enriched with an m6A antibody and then reverse-transcribed into cDNA (IP) after purification. Finally, RT-qPCR was performed for detection.
Statistical Analyses
All experimental procedures were performed at least three times. The m6A peaks were filtered according to two criteria: enrichment ≥2 and a p-value < 0.05. The differential peaks and DEGs were screened in the CPB2 group vs the control group according to a |log2 (fold change)| >0.585 and a p-value < 0.05. The RT-qPCR and MeRIP-qPCR data were analyzed by using the SPSS v.21 and GraphPad Prism v.8.0 software programs. The mean ± standard deviation (SD) was used to describe the data, and statistically significant differences are denoted with one asterisk (*) for p < 0.05 or two asterisks (**) for p < 0.01.
Results
Detection of Methylation-Related Enzyme Expression and m6A Levels
To investigate the effect of m6A modification in CPB2-induced IPEC-J2 cells, the mRNA expression levels of methylation-related enzymes and the total m6A content of the control and CPB2 groups were detected by RT-qPCR and with an m6A RNA methylation quantification kit, respectively. As shown in Figures 1A,B, the expression levels of METTL3, ALKBH5, and YTHDF3 were increased dramatically (p < 0.01), while those of METTL14, FTO, and YTHDC2 were decreased significantly in the CPB2 toxin group relative to the control group (p < 0.01); WTAP and YTHDC1 levels were also decreased (p < 0.05), but YTHDF1 and YTHDF2 levels were not changed (p > 0.05) (Figure 1A). In addition, the total m6A level was obviously increased in the CPB2 group (p < 0.01, Figure 1B). These results suggested that differences in m6A methylation modifications may exist between the control group and the CPB2 group.
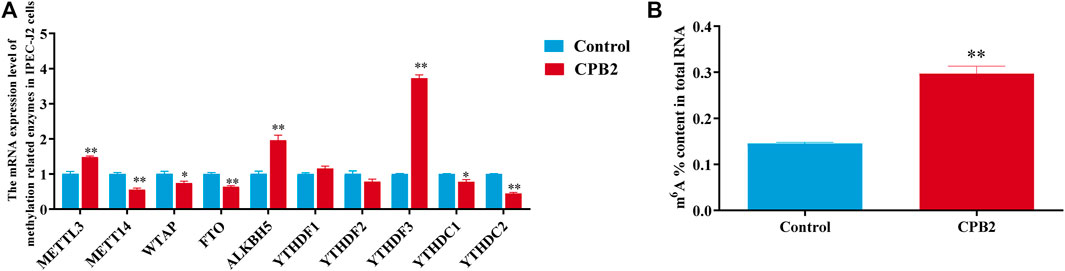
FIGURE 1. Evaluation of the expression levels of methylase-related enzymes and m6A levels under 20 μg/mL CPB2 treatment. (A) qPCR analysis of the expression of methylation-related enzymes after 24 h of cells exposure to 20 μg/ml CPB2 toxin. (B) Determination of m6A levels in IPEC-J2 cells after treating with 20 μg/mL CPB2 for 24 h.
Sequence Statistics and Quality Control
To further explore the biological process of m6A modification in IPEC-J2 cells exposed to CPB2 toxin, three samples each from the control and CPB2 groups were collected for m6A sequencing. Two types of libraries corresponding to the control group and CPB2 group were further constructed and designated the IP libraries (m6A-seq) and the input libraries (RNA-seq), respectively. For the IP libraries, a total of 89,642,446–90,242,216 raw reads were obtained for the CPB2 group, while 85,492,316–87,774,992 raw reads were obtained for the control group (Table 2). For the input libraries, there were 92,752,804–97,478,686 raw reads for the CPB2 group and 93,495,320–97,586,308 raw reads for the control group (Table 2). The percentages of clean (valid) reads for the control group and the CPB2 group were greater than 86.79% in the IP libraries and 83.24% in the input libraries. For all libraries, the Q20 and Q30 values were at least 90% (Table 2 and Supplementary Table S1). In addition, clean reads whose ribosome sequences were removed were compared with the porcine reference genome. The results showed that the clean reads were mainly aligned to exon regions, introns, and intergenic regions, and the proportions of exons exceeded 60% in the control and CPB2 groups (Supplementary Figure S1; Table S2).
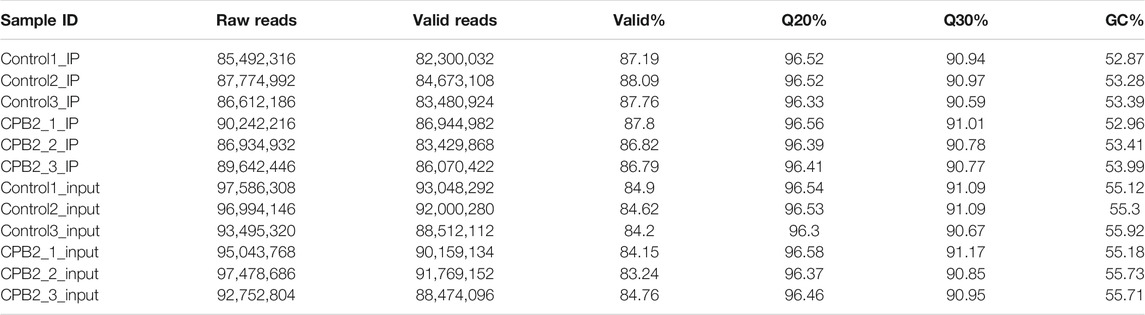
TABLE 2. Sequence statistics and quality control.
Peak Distributions of m6A Modifications in the Whole Genome
After the full-range peak calling results of the porcine reference genome were scanned, a Poisson distribution model was used to check the reads of the candidate peak regions and to calculate the p-values of given peak regions. In this experiment, we were able to distinguish the differences in these peaks (i.e., enrichment ≥2, p < 0.05) and identify the peaks in the IP libraries, whose results were compared with those of the input libraries. We found that the numbers of peaks in the control group vs the CPB2 group were 20,533 and 19,241, respectively (Supplementary Table S3). Additionally, 18,695 peaks were the same between the control group and the CPB2 group, accounting for 90% of all detected peaks (Figure 2A). Furthermore, we analyzed the distributions of peaks on the pig chromosomes in the CPB2 group and control group. Interestingly, there were more peaks on chromosomes 1, 2, 3, 6, 12, 13, and 14 than on other chromosomes, and the most peaks were distributed on chromosome 6 (Figures 2B,C, Supplementary Table S4). Then, we analyzed the distributions of peaks in gene functional elements in both groups. The results showed that the m6A peaks in the control group and CPB2 group were mainly enriched in the 3′UTRs and stop codon regions (Figures 2D,E, Figure 2F). Next, HOMER and MEME2 softwares were employed to identify the most reliable motifs in the peak regions, which identified the GGACU motif in the control group and the UGGACU motif in the CPB2 group (Figures 2G,H).
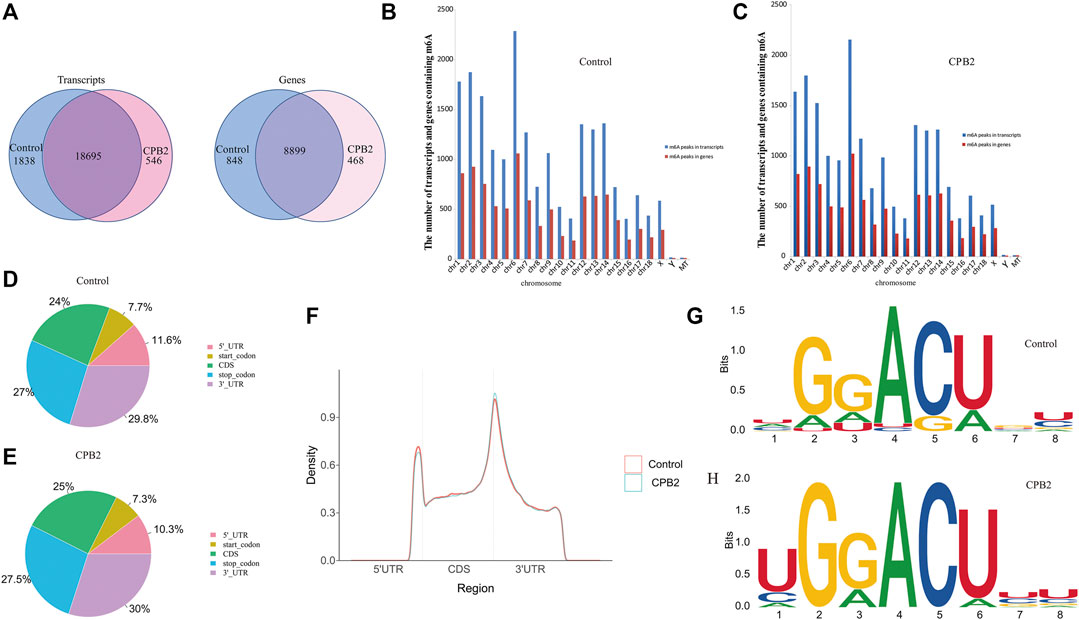
FIGURE 2. Peak Distribution. (A) m6A peaks distributions in the control group and CPB2 group among mRNA transcripts (left) and genes (right). (B) Numbers of m6A peaks in the mRNA transcripts and genes of chromosomes in the control group. (C) Numbers of m6A peaks in the mRNA transcripts and genes of chromosomes in the CPB2 group. (D) Distributions of m6A peaks in different gene functional elements (5′UTR, 3′UTR, 1st exon, and other exons) in the control group. (E) Distributions of m6A peaks in different gene functional elements (5′UTR, 3′UTR, 1st exon, and other exons) in the CPB2 group. (F) Density distributions of m6A peaks in different gene functional elements (5′UTR, CDS, and 3′UTR) in the control group and CPB2 group. (G, H) Motif sites in the control (top) and CPB2 groups (bottom).
Differential m6A Peaks Between the CPB2 and Control Groups
To analyze the distributions of m6A peaks among the different chromosomes, genes, and mRNA transcripts in the CPB2 and control groups, we scanned the differential peaks and found 1,448 differential m6A peaks. Among these peaks, we found 437 significantly upregulated peaks in 394 genes (here referred to as differentially methylated genes, DMGs) and 1,011 significantly downregulated peaks in 920 genes (Figure 3A and Supplementary Table S5). The top 20 altered m6A peaks represented the 10 most upregulated genes and the 10 most downregulated genes (Table 3 and Supplementary Table S5). Furthermore, relative to the control group (excluding the peaks showing no significant difference on the mitochondrial chromosome), the CPB2 group exhibited differential peaks distributed on other chromosomes; there were more downregulated peaks than upregulated peaks, and the peaks were most abundant on chromosome 6 (Figure 3B and Supplementary Table S6). We also counted the peaks distributed in genes and found that many genes contained one peak, which accounted for 46.7% (184/394) of the DMGs with upregulated peaks and 48.9% (452/920) DMGs with downregulated (Figure 3C and Supplementary Table S7). In analyzing the number of differential peaks among all mRNA transcripts, we found that the majority of mRNA transcripts in the whole genome showed one peak, while a few mRNA transcripts showed two or more differential peaks (Figure 3D and Supplementary Table S7). In addition, we calculated the densities of m6A modifications among mRNA molecules and found that the gene fragments containing more m6A peaks were longer (Figure 3E).
FIGURE 3. m6A peaks in the control and CPB2 groups. (A) Significantly different m6A peaks in the CPB2 group vs the control group. (B) Significant differences in the distributions of m6A peaks on pig chromosomes. (C) Distributions of differential m6A peaks in per gene. (D) Distributions of differential m6A peaks in per mRNA. (E) Distributions of peaks with different sizes.
TABLE 3. Top 10 significantly upregulated and top 10 significantly downregulated m6A peaks (CPB2 vs control).
GO and KEGG Analysis of Genes Presenting Differential m6A Peaks (DMGs)
To investigate the biological processes associated with m6A modification in IPEC-J2 cells in response to CPB2 infection, we analyzed the functions of DMGs presenting upregulated m6A peaks (n = 437) or downregulated peaks (n = 1,011) according to GO terms and KEGG signaling pathways. The GO results were divided into three categories: the biological process (BP), cellular component (CC), and molecular function (MF) categories. The top 10 BP, CC, and MF terms that were enriched for genes with upregulated and downregulated m6A peaks are shown in Figures 4A,B. For the KEGG pathway analysis, we display the top 10 enriched KEGG pathways based on their p-values. The results showed that genes with upregulated m6A peaks were mainly enriched in cancer signaling pathways (20 genes), the Cushing syndrome signaling pathway (9 genes), and the Wnt signaling pathway (9 genes) (Figure 4C and Supplementary Table S5), while genes with downregulated m6A peaks were mainly enriched in the apoptosis pathway (15 genes), the small cell lung cancer signaling pathway (11 genes) and the herpes simplex virus 1 infection signaling pathway (27 genes) (Figure 4D and Supplementary Table S5).
FIGURE 4. GO and KEGG analyses of DMGs. (A, B) Top 10 GO terms of the differentially methylated (A) upregulated genes and (B) downregulated genes. (C, D) Top 10 enriched KEGG pathways of the differentially methylated (C) upregulated genes and (D) downregulated genes.
DEGs (RNA-Seq Data) Following CPB2 Treatment of IPEC-J2 Cells
We used RNA-seq data (the m6A-seq input library) to analyze DEGs after treating IPEC-J2 cells with CPB2 (Figures 5A,B, Supplementary Table S8). In total, 1,636 DEGs were detected in the CPB2 group relative to the control group, among which 1,094 DEGs were upregulated and 542 DEGs were downregulated. We list the top 20 most significantly upregulated genes and downregulated genes in tables (10 of each; Table 4, Supplementary Table S8), and the top 10 GO terms and top 10 KEGG pathways of the DEGs are displayed in Figure 5C, Figure 5D, and Supplementary Table S8. Both upregulated and downregulated genes were involved in the regulation of transcription, DNA templates, and signal transduction as well as the positive regulation of transcription by RNA polymerase in the BP category. The upregulated genes also participated in immune and inflammatory responses. The KEGG results indicated that upregulated genes were enriched predominantly in pathways related to influenza A cytokine-cytokine receptor interaction, cell adhesion molecules (CAMs), Staphylococcus aureus infection, NOD-like receptors, chemokines and TNF signaling pathways. The downregulated genes were involved in pathways related to Hippo signaling, Wnt signaling, terpenoid backbone biosynthesis, proteoglycans in cancer, melanogenesis, bladder cancer, transcriptional misregulation in cancer, basal cell carcinoma, glycolysis/gluconeogenesis, and TGF-beta signaling.
FIGURE 5. GO and KEGG analyses of DEGs. (A) Volcano plot showing the differential gene expression in the CPB2 and control groups. (B) Heatmap showing the overall expression patterns of DEGs in three CPB2 individuals and three control individuals. Red indicates upregulated DEGs, and blue indicates downregulated DEGs. (C, D) Top 10 GO terms of the (C) upregulated and (D) downregulated DEGs. (E, F) Top 10 KEGG pathways enriched for the (E) upregulated and (F) downregulated DEGs.
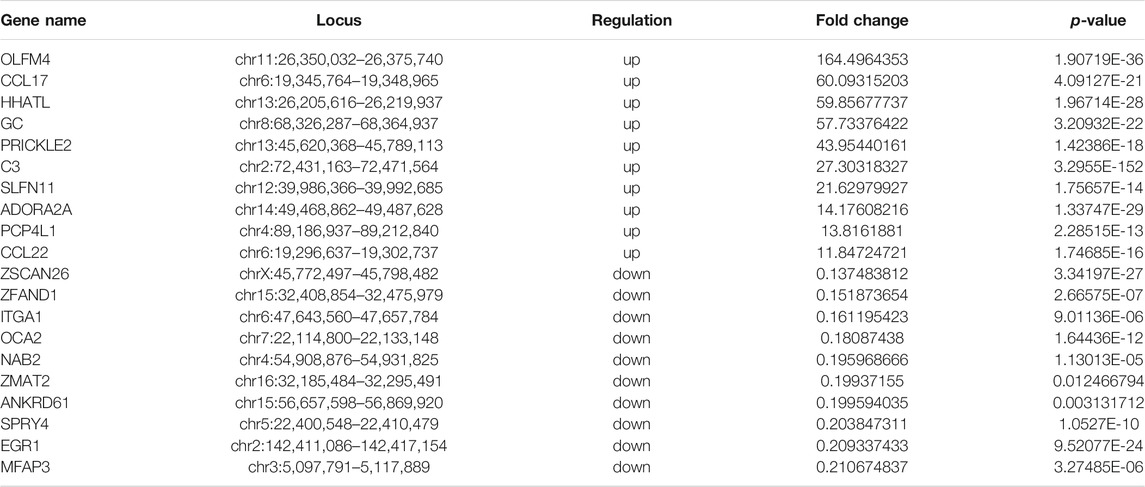
TABLE 4. Top 10 upregulated and top 10 downregulated DEGs (CPB2 vs control).
Combined m6A-Seq and RNA-Seq Analysis
To further explore the functional significance of m6A modification in IPEC-J2 cells in response to CPB2, we investigated whether m6A methylation was the basis of the observed expression differences. For this purpose, m6A-seq data and RNA-seq data were used to detect DMGs and DEGs. Thereafter, combined m6A-seq and RNA-seq analysis divided a total of 192 genes into four main groups (Figure 6A and Supplementary Table S9): a group of 52 hypermethylated and upregulated genes (hyper-up genes), a group of 47 hypomethylated and downregulated genes (hypo-down genes), a group of 18 hypermethylated and downregulated genes (hyper-down genes) and a group of 75 hypomethylated and upregulated genes (hypo-up genes). The 18 hyper-down genes, 52 hyper-up genes and 75 hypo-up genes were further investigated by KEGG analysis, which revealed that the top 10 enriched KEGG pathways among the hyper-down genes were mainly related to glycolysis/gluconeogenesis; neomycin, kanamycin, gentamicin biosynthesis and Wnt signaling pathways (Figure 6B and Supplementary Table S9). In contrast, the hyper-up genes were mainly enriched in the CAMs signaling pathway (Figure 6C and Supplementary Table S9). In addition, the 75 hypo-up genes were mainly enriched in signaling pathways such as the FoxO, Hippo, and basal cell carcinoma pathways (Figure 6D and Supplementary Table S9).
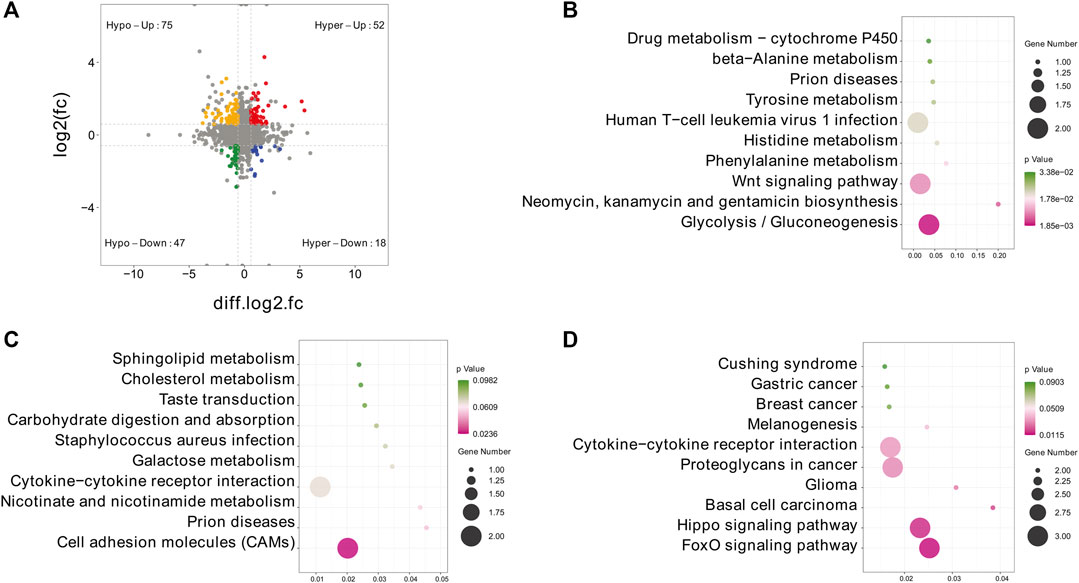
FIGURE 6. Combined m6A-seq and RNA-seq analysis. (A) Four-quadrant diagram depicting the distributions of DMGs and DEGs. (B–D) Top 10 significantly enriched KEGG pathways among the identified (B) hyper-down genes, (C) hyper-up genes and (D) hypo-up genes.
Validation of DEGs and DMGs by qPCR and MeRIP-qPCR
To verify the m6A-seq and RNA-seq data, we randomly selected 10 DEGs (EGR1, MYC, FZD7, WNT9A, FOSL1, ITGA9, IL2RA, TLR2, FZD5, and WNT11) and checked the reliability of the RNA-seq data by RT-qPCR. According to the combined m6A-seq and RNA-seq analysis results, three DMGs (WNT9A, FOSL1, and WNT11) were selected for the MeRIP-qPCR assay. The RT-qPCR and MeRIP-qPCR results (Figures 7A,B) were consistent with the RNA-seq and m6A-seq results, thus confirming the reliability of the results of our m6A-seq experiment.
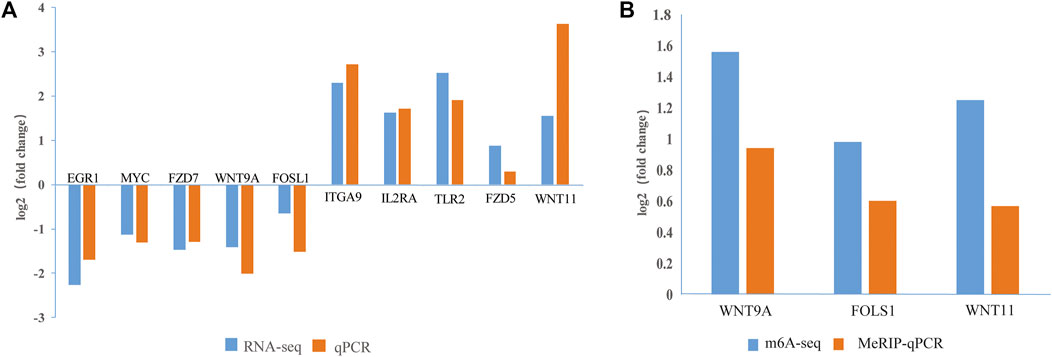
FIGURE 7. Verification of DEGs and DMGs. (A) The expression levels of 10 genes were verified by qPCR and RNA-seq. (B) The m6A methylation modifications of three genes were verified by MeRIP-qPCR and m6A-seq. The fold changes are expressed as the ratios of gene expression in CPB2-treated vs control samples. The blue and orange bars indicate the RNA-seq and m6A-seq or qRT-PCR and MeRIP-qPCR results, respectively.
Discussion
Similar to DNA and protein modifications, m6A modification is a dynamically reversible posttranscriptional change that mainly regulates mRNA expression, splicing, structure, stability, lifespan, and degradation as well as RNA modification during translation (Fu et al., 2014; Adhikari et al., 2016). This modification plays roles in bacterial and viral infections, intestinal diseases, and host immune responses (Sebastian-delaCruz et al., 2020; Wu et al., 2020). Feng et al. (2018) demonstrated that the expression levels of m6A and METTL3 were upregulated in HDPCs stimulated by LPS. Similarly, in another study, both the m6A levels and the mRNA expression of WTAP increased when THP-1 cells were treated with heat-killed Salmonella typhimurium (HKST) (Wu et al., 2020). However, Zong et al. found that when IPEC-J2 cells were infected with E. coli K88, the methylation level of m6A was significantly reduced, while the expression of m6A reader proteins (YTHDF1 and YTHDF2) were markedly increased, and the expression of the methyltransferase METTL3 and the demethylase FTO were not changed; moreover, E. coli K88 infection was shown to cause intestinal inflammation and to impair lipid transport in the YTHDF1-dependent m6A pathway in IPEC-J2 cells (Zong et al., 2018). In this experiment, we detected the mRNA expression of methylation-related enzymes and the overall level of m6A methylation, and the results demonstrated that the mRNA expression levels of the methyltransferases METTL3, METTL14, and WTAP and the demethylases FTO and ALKBH5 were altered, while the overall m6A level was increased significantly. Therefore, we speculate that the m6A methylation modification may be involved in the CPB2-induced inflammatory response of IPEC-J2 cells.
In this study, we found 18,695 peaks that were the same in the CPB2 and control groups, which accounted for 90% of all the peaks. This indicated that most of the peaks corresponded to functions that maintained the physiological homeostasis of the organism. In mouse tissues and human cells, m6A has been shown to be located mainly near stop codons and 3′UTRs (Dominissini et al., 2012; Meyer et al., 2012). We analyzed the distributions of m6A peaks in different gene functional elements and found that m6A peaks were indeed mainly distributed in 3′UTRs and stop codon regions. These findings are consistent with those of Wang et al. (2020b) and prove that m6A motif enrichment is more common in 3′UTRs than in other regions. The 3′UTR regulates the stability, localization, expression, and translation of mRNA. Multiple RNA-binding proteins bind in this region to perform regulatory functions and regulate protein–protein interactions (Mayr, 2018). The m6A methylation recognition proteins, YTHDF1 and YTHDF2, mainly recognize the m6A motifs of 3′UTRs and alter the translation efficiency and degradation rate of m6A-modified RNA (Wang et al., 2015; Chen et al., 2018). A conserved m6A motif sequence, gg (R: G, A, U; R: G, A; H: U, A, C), was recently reported (Han et al., 2019). Our results revealed conserved m6A motifs of GGACU and UGGACU in the control and CPB2 groups, respectively, similar to the findings of Han et al. (2019). These results suggest that these motifs may be recognized by certain proteins and play important roles in IPEC-J2 cells in response to CPB2.
Relative to the control group, the CPB2 group exhibited 1,448 differential peaks (437 upregulated and 1,011 downregulated). The DMGs with upregulated peaks were mainly enriched in cancer signaling pathways, the Cushing syndrome signaling pathway and the Wnt signaling pathway. Interestingly, some of these genes appeared simultaneously in many signaling pathways. For example, WNT11, WNT9A, and FZD9 were all enriched in cancer signaling pathways, the Cushing syndrome signaling pathway, and the Wnt signaling pathway. These three genes encode the main ligands and receptors that regulate the activation and deactivation of the Wnt signaling pathway. The Wnt signaling pathway impacts intestinal balance, self-renewal, and malignant transformation (Liu et al., 2011). The WNT11 gene is a novel important contributor to intestinal homeostasis and host defense and participates in the protection of host intestinal cells by blocking the invasion of pathogenic bacteria, inhibiting inflammation, and inhibiting apoptosis (Liu et al., 2011). In addition, some studies have indicated that WNT11 regulates the development of the heart and kidneys via an atypical Wnt signaling pathway and inhibits the inflammation of intestinal epithelial cells (Pandur et al., 2002; Majumdar et al., 2003; Liu et al., 2011). WNT9A is considered to act as a tumor suppressor gene in relation to the development of colorectal cancer (Ali et al., 2016). Intriguingly, according to the GO and KEGG analyses, we found that the DMGs and DEGs were almost always significantly enriched in the Wnt signaling pathway., Therefore, we propose that m6A modification is involved in the inflammatory response induced by CPB2 in IPEC-J2 cells and that it may modulate this inflammatory response by influencing the gene expression of the Wnt signaling pathway.
Conclusion
In this study, we analyzed how m6A methylation is modified in CPB2-induced IPEC-J2 cells. The results suggest that m6A methylation may play a role in the Wnt signaling pathway in CPB2-induced IPEC-J2 cells and exert anti-inflammatory or proinflammatory effects on intestinal diseases. These findings provide a basis for further research into the functions of m6A methylation modifications in CPB2 toxin-induced piglet diarrhea.
Data Availability Statement
Our data are deposited in the G E O repository, the accession number: GSE167267. We have published our data on October 5, 2021. The link for data disclosure is as follows: https://www.ncbi.nlm.nih.gov/geo/query/acc.cgi?acc=GSE167267.
Author Contributions
JZ, QY, ZY, and SG conceived the project; JZ, JY, RL, XG, XH, and PW designed most experiments; WW, KX, XG, RL, and BZ performed data analyses; JZ, JY, WW, KX, RL and XG performed the experiments; and JZ wrote the paper with suggestions from SG.
Funding
This work was supported by Education Science and Technology Innovation Project of Gansu Province (GSSYLXM-02), the National Natural Science Foundation of China (31960646), the Youth Science and Technology Fund Program of Gansu Province (20JR5RA005) and the Education Department of Gansu Province: Excellent Graduate student “Innovation Star” project 2021CXZX-351.
Conflict of Interest
The authors declare that the research was conducted in the absence of any commercial or financial relationships that could be construed as a potential conflict of interest.
Publisher’s Note
All claims expressed in this article are solely those of the authors and do not necessarily represent those of their affiliated organizations, or those of the publisher, the editors and the reviewers. Any product that may be evaluated in this article, or claim that may be made by its manufacturer, is not guaranteed or endorsed by the publisher.
Acknowledgments
We thank LC-BIO Biotech Ltd. (Hangzhou, China) for supporting the high-throughput sequencing instrument.
Supplementary Material
The Supplementary Material for this article can be found online at: https://www.frontiersin.org/articles/10.3389/fgene.2021.689748/full#supplementary-material.
References
Adhikari, S., Xiao, W., Zhao, Y.-L., and Yang, Y.-G. (2016). m6A: Signaling for mRNA Splicing. RNA Biol. 13 (9), 756–759. doi:10.1080/15476286.2016.1201628
Alarcón, C. R., Goodarzi, H., Lee, H., Liu, X., Tavazoie, S., and Tavazoie, S. F. (2015). HNRNPA2B1 Is a Mediator of m6A-dependent Nuclear RNA Processing Events. Cell 162 (6), 1299–1308. doi:10.1016/j.cell.2015.08.011
Ali, I., Medegan, B., and Braun, D. (2016). WNT9A Induction Linked to Suppression of Human Colorectal Cancer Cell Proliferation. Ijms 17 (4), 495–506. doi:10.3390/ijms17040495
Bailey, T. L., Boden, M., Buske, F. A., Frith, M., Grant, C. E., Clementi, L., et al. (2009). MEME SUITE: Tools for Motif Discovery and Searching. Nucleic Acids Res. 37, W202–W208. doi:10.1093/nar/gkp335
Chen, J., Zhang, Z., Lei, Z., Shimizu, K., Yao, P., Su, Z., et al. (2020). Occurrence and Distribution of Antibiotic Resistance Genes in the Coastal Sediments of Effluent-Receiving Areas of WWTPs, China. Bioresour. Tech. Rep. 11 (100511), 100511–100517. doi:10.1016/j.biteb.2020.100511
Chen, S., Zhou, Y., Chen, Y., and Gu, J. (2018). Fastp: an Ultra-fast All-In-One FASTQ Preprocessor. Bioinformatics 34 (17), i884–i890. doi:10.1093/bioinformatics/bty560
Dominissini, D., Moshitch-Moshkovitz, S., Schwartz, S., Salmon-Divon, M., Ungar, L., Osenberg, S., et al. (2012). Topology of the Human and Mouse m6A RNA Methylomes Revealed by m6A-Seq. Nature 485 (7397), 201–206. doi:10.1038/nature11112
Feng, Z., Li, Q., Meng, R., Yi, B., and Xu, Q. (2018). METTL 3 Regulates Alternative Splicing of MyD88 upon the Lipopolysaccharide‐induced Inflammatory Response in Human Dental Pulp Cells. J. Cel. Mol. Med. 22 (5), 2558–2568. doi:10.1111/jcmm.13491
Fu, Y., Dominissini, D., Rechavi, G., and He, C. (2014). Gene Expression Regulation Mediated through Reversible m6A RNA Methylation. Nat. Rev. Genet. 15 (5), 293–306. doi:10.1038/nrg3724
Fustin, J.-M., Doi, M., Yamaguchi, Y., Hida, H., Nishimura, S., Yoshida, M., et al. (2013). RNA-methylation-dependent RNA Processing Controls the Speed of the Circadian Clock. Cell 155, 793–806. doi:10.1016/j.cell.2013.10.026
Gao, X., Yang, Q., Huang, X., Yan, Z., Zhang, S., Luo, R., et al. (2020). Effects of Clostridium perfringens Beta2 Toxin on Apoptosis, Inflammation, and Barrier Function of Intestinal Porcine Epithelial Cells. Microb. Pathogenesis 147, 104379. doi:10.1016/j.micpath.2020.104379
Garcia, J. P., Beingesser, J., Fisher, D. J., Sayeed, S., McClane, B. A., Posthaus, H., et al. (2012). The Effect of Clostridium perfringens Type C Strain CN3685 and its Isogenic Beta Toxin Null Mutant in Goats. Vet. Microbiol. 157 (3-4), 412–419. doi:10.1016/j.vetmic.2012.01.005
Gibert, M., Jolivet-Renaud, C., and Popoff, M. R. (1997). Beta2 Toxin, a Novel Toxin Produced by Clostridium perfringens. Gene 203 (1), 65–73. doi:10.1016/s0378-1119(97)00493-9
Han, D., Liu, J., Chen, C., Dong, L., Liu, Y., Chang, R., et al. (2019). Anti-tumour Immunity Controlled through mRNA m6A Methylation and YTHDF1 in Dendritic Cells. Nature 566 (7743), 270–274. doi:10.1038/s41586-019-0916-x
Heinz, S., Benner, C., Spann, N., Bertolino, E., Lin, Y. C., Laslo, P., et al. (2010). Simple Combinations of Lineage-Determining Transcription Factors Prime Cis-Regulatory Elements Required for Macrophage and B Cell Identities. Mol. Cel 38, 576–589. doi:10.1016/j.molcel.2010.05.004
Hou, G., Zhao, X., Li, L., Yang, Q., Liu, X., Huang, C., et al. (2021). SUMOylation of YTHDF2 Promotes mRNA Degradation and Cancer Progression by Increasing its Binding Affinity with m6A-Modified mRNAs. Nucleic Acids Res. 49 (5), 2859–2877. doi:10.1093/nar/gkab065
Huang, H., Weng, H., and Chen, J. (2020). m6A Modification in Coding and Non-coding RNAs: Roles and Therapeutic Implications in Cancer. Cancer Cell 37 (3), 270–288. doi:10.1016/j.ccell.2020.02.004
Huang, H., Weng, H., Sun, W., Qin, X., Shi, H., Wu, H., et al. (2018). Recognition of RNA N6-Methyladenosine by IGF2BP Proteins Enhances mRNA Stability and Translation. Nat. Cel Biol 20 (3), 285–295. doi:10.1038/s41556-018-0045-z
Immerseel, F. V., Buck, J. D., Pasmans, F., Huyghebaert, G., Haesebrouck, F., and Ducatelle, R. (2004). Clostridium Perfringensin Poultry: an Emerging Threat for Animal and Public Health. Avian Pathol. 33 (6), 537–549. doi:10.1080/03079450400013162
Kim, D., Langmead, B., and Salzberg, S. L. (2015). HISAT: a Fast Spliced Aligner with Low Memory Requirements. Nat. Methods 12 (4), 357–360. doi:10.1038/nmeth.3317
Liu, N., Dai, Q., Zheng, G., He, C., Parisien, M., and Pan, T. (2015). N6-methyladenosine-dependent RNA Structural Switches Regulate RNA-Protein Interactions. Nature 518 (7540), 560–564. doi:10.1038/nature14234
Liu, X., Wu, S., Xia, Y., Li, X. E., Xia, Y., Zhou, Z. D., et al. (2011). Wingless Homolog Wnt11 Suppresses Bacterial Invasion and Inflammation in Intestinal Epithelial Cells. Am. J. Physiology-Gastrointestinal Liver Physiol. 301 (6), G992–G1003. doi:10.1152/ajpgi.00080.2011
Livak, K. J., and Schmittgen, T. D. (2001). Analysis of Relative Gene Expression Data Using Real-Time Quantitative PCR and the 2−ΔΔCT Method. Methods 25 (4), 402–408. doi:10.1006/meth.2001.1262
Luo, R., Yang, Q., Huang, X., Yan, Z., Gao, X., Wang, W., et al. (2020). Clostridium perfringens Beta2 Toxin Induced In Vitro Oxidative Damage and its Toxic Assessment in Porcine Small Intestinal Epithelial Cell Lines. Gene 759, 144999. doi:10.1016/j.gene.2020.144999
Majumdar, A., Vainio, S., Kispert, A., McMahon, J., and McMahon, A. P. (2003). Wnt11andRet/Gdnfpathways Cooperate in Regulating Ureteric Branching during Metanephric Kidney Development. Development 130, 3175–3185. doi:10.1242/dev.00520
Mayr, C. (2018). What Are 3′ UTRs Doing? Cold Spring Harb Perspect. Biol. 11 (4), a034728–15. doi:10.1101/cshperspect.a034728
Meng, J., Lu, Z., Liu, H., Zhang, L., Zhang, S., Chen, Y., et al. (2014). A Protocol for RNA Methylation Differential Analysis with MeRIP-Seq Data and exomePeak R/Bioconductor Package. Methods 69 (3), 274–281. doi:10.1016/j.ymeth.2014.06.008
Meyer, K. D., Saletore, Y., Zumbo, P., Elemento, O., Mason, C. E., and Jaffrey, S. R. (2012). Comprehensive Analysis of mRNA Methylation Reveals Enrichment in 3′ UTRs and Near Stop Codons. Cell 149 (7), 1635–1646. doi:10.1016/j.cell.2012.05.003
Pandur, P., Läsche, M., Eisenberg, L. M., and Kühl, M. (2002). Wnt-11 Activation of a Non-canonical Wnt Signalling Pathway Is Required for Cardiogenesis. Nature 418, 636–641. doi:10.1038/nature00921
Patil, D. P., Chen, C.-K., Pickering, B. F., Chow, A., Jackson, C., Guttman, M., et al. (2016). m6A RNA Methylation Promotes XIST-Mediated Transcriptional Repression. Nature 537 (7620), 369–373. doi:10.1038/nature19342
Pertea, M., Pertea, G. M., Antonescu, C. M., Chang, T.-C., Mendell, J. T., and Salzberg, S. L. (2015). StringTie Enables Improved Reconstruction of a Transcriptome from RNA-Seq Reads. Nat. Biotechnol. 33 (3), 290–295. doi:10.1038/nbt.3122
Robinson, J. T., Thorvaldsdóttir, H., Wenger, A. M., Zehir, A., and Mesirov, J. P. (2017). Variant Review with the Integrative Genomics Viewer. Cancer Res. 77 (21), e31–e34. doi:10.1158/0008-5472.CAN-17-0337
Robinson, M. D., Mccarthy, D. J., and Smyth, G. K. (2010). edgeR: a Bioconductor Package for Differential Expression Analysis of Digital Gene Expression Data. Bioinformatics 26 (1), 139–140. doi:10.1093/bioinformatics/btp616
Sebastian-delaCruz, M., Olazagoitia-Garmendia, A., Gonzalez-Moro, I., Santin, I., Garcia-Etxebarria, K., and Castellanos-Rubio, A. (2020). Implication of m6A mRNA Methylation in Susceptibility to Inflammatory Bowel Disease. Epigenomes 4, 16. doi:10.3390/epigenomes4030016
Shi, H., Wang, X., Lu, Z., Zhao, B. S., Ma, H., Hsu, P. J., et al. (2017). YTHDF3 Facilitates Translation and Decay of N6-Methyladenosine-Modified RNA. Cell Res 27 (3), 315–328. doi:10.1038/cr.2017.15
Wang, X., Zhao, B. S., Roundtree, I. A., Lu, Z., Han, D., Ma, H., et al. (2015). N6-methyladenosine Modulates Messenger RNA Translation Efficiency. Cell 161 (6), 1388–1399. doi:10.1016/j.cell.2015.05.014
Wang, Y., Sun, J., Lin, Z., Zhang, W., Wang, S., Wang, W., et al. (2020b). m6A mRNA Methylation Controls Functional Maturation in Neonatal Murine β-Cells. Diabetes 69 (8), 1708–1722. doi:10.2337/db19-0906
Wang, Y., Zhang, L., Ren, H., Ma, L., Guo, J., Mao, D., et al. (2021). Role of Hakai in m6A Modifycation Pathway in Drosophila. Nat. Commun. 12 (1), 1–15. doi:10.1038/s41467-021-22424-51
Wang, Y., Zheng, Y., Guo, D., Zhang, X., Guo, S., Hui, T., et al. (2020a). m6A Methylation Analysis of Differentially Expressed Genes in Skin Tissues of Coarse and Fine Type Liaoning Cashmere Goats. Front. Genet. 10, 1318. doi:10.3389/fgene.2019.01318
Wu, C., Chen, W., He, J., Jin, S., Liu, Y., Yi, Y., et al. (2020). Interplay of m6A and H3K27 Trimethylation Restrains Inflammation during Bacterial Infection. Sci. Adv. 6 (34), eaba0647. doi:10.1126/sciadv.aba0647
Xiao, W., Adhikari, S., Dahal, U., Chen, Y.-S., Hao, Y.-J., Sun, B.-F., et al. (2016). Nuclear M 6 A Reader YTHDC1 Regulates mRNA Splicing. Mol. Cel 61 (4), 507–519. doi:10.1016/j.molcel.2016.01.012
Yang, J., Liu, J., Zhao, S., and Tian, F. (2020). N6-methyladenosine Mettl3 Modulates the Proliferation and Apoptosis of Lens Epithelial Cells in Diabetic Cataract. Mol. Ther. - Nucleic Acids 20, 111–116. doi:10.1016/j.omtn.2020.02.002
Yu, G., Wang, L.-G., and He, Q.-Y. (2015). ChIPseeker: an R/Bioconductor Package for ChIP Peak Annotation, Comparison and Visualization. Bioinformatics 31 (14), 2382–2383. doi:10.1093/bioinformatics/btv145
Zhao, T., Wang, J., Wu, Y., Han, L., Chen, J., Wei, Y., et al. (2021). Increased m6A Modification of RNA Methylation Related to the Inhibition of Demethylase FTO Contributes to MEHP-Induced Leydig Cell Injury☆. Environ. Pollut. 268 (115627), 115627–115637. doi:10.1016/j.envpol.2020.115627
Zhao, X., Yang, Y., Sun, B.-F., Shi, Y., Yang, X., Xiao, W., et al. (2014). FTO-dependent Demethylation of N6-Methyladenosine Regulates mRNA Splicing and Is Required for Adipogenesis. Cel Res 24 (12), 1403–1419. doi:10.1038/cr.2014.151
Zhou, Y., Liu, J., Lei, Q., Han, H., Liu, W., Cunwei, T., et al. (2020). Transcriptome Analysis of the Chicken Follicular Theca Cells with miR-135a-5p Suppressed. G3 (Bethesda) 10 (11), 4071–4081. doi:10.1534/g3.120.401701
Zhu, T., Roundtree, I. A., Wang, P., Wang, X., Wang, L., Sun, C., et al. (2014). Crystal Structure of the YTH Domain of YTHDF2 Reveals Mechanism for Recognition of N6-Methyladenosine. Cel Res 24 (12), 1493–1496. doi:10.1038/cr.2014.152
Keywords: m6A-seq, RNA-seq, beta2 toxin, M6A modification, porcine intestinal epithelial cells
Citation: Zhang J, Yang Q, Yang J, Gao X, Luo R, Huang X, Yan Z, Wang P, Wang W, Xie K, Zhang B and Gun S (2021) Comprehensive Analysis of Transcriptome-wide m6A Methylome Upon Clostridium perfringens Beta2 Toxin Exposure in Porcine Intestinal Epithelial Cells by m6A Sequencing. Front. Genet. 12:689748. doi: 10.3389/fgene.2021.689748
Received: 01 April 2021; Accepted: 30 September 2021;
Published: 19 October 2021.
Edited by:
George E. Liu, Agricultural Research Service (USDA), United StatesReviewed by:
Narendra Singh, Stowers Institute for Medical Research, United StatesEveline M Ibeagha-Awemu, Agriculture and Agri-Food Canada (AAFC), Canada
Copyright © 2021 Zhang, Yang, Yang, Gao, Luo, Huang, Yan, Wang, Wang, Xie, Zhang and Gun. This is an open-access article distributed under the terms of the Creative Commons Attribution License (CC BY). The use, distribution or reproduction in other forums is permitted, provided the original author(s) and the copyright owner(s) are credited and that the original publication in this journal is cited, in accordance with accepted academic practice. No use, distribution or reproduction is permitted which does not comply with these terms.
*Correspondence: Shuangbao Gun, Z3Vuc2JhbzA1NkAxMjYuY29t