 Huaifeng Liu
 Yu Gao
 Shangshang Hu3
 Xianggang Wang
 Shujing Li
- 1School of Life Sciences, Bengbu Medical College, Bengbu, China
- 2Anhui Province Key Laboratory of Immunology in Chronic Diseases, Bengbu Medical College, Bengbu, China
- 3Research Center of Clinical Laboratory Science, School of Laboratory Medicine, Bengbu Medical College, Bengbu, China
Liver Hepatocellular Carcinoma (LIHC), a malignant tumor with high incidence and mortality, is one of the most common cancers in the world. Multiple studies have found that the aberrant expression of rhythm genes is closely related to the occurrence of LIHC. This study aimed to use bioinformatics analysis to identify differentially expressed rhythm genes (DERGs) in LIHC. A total of 563 DERGs were found in LIHC, including 265 downregulated genes and 298 upregulated genes. KEGG pathway enrichment and GO analyses showed that DERGs were significantly enriched in rhythmic and metabolic processes. Survival analysis revealed that high expression levels of CNK1D, CSNK1E, and NPAS2 were significantly associated with the low survival rate in LIHC patients. Through cell experiment verification, the mRNA expression levels of CSNK1D, CSNK1E, and NPAS2 were found to be strongly upregulated, which was consistent with the bioinformatics analysis of LIHC patient samples. A total of 23 nodes and 135 edges were involved in the protein–protein interaction network of CSNK1D, CSNK1E, and NPAS2 genes. Clinical correlation analyses revealed that CSNK1D, CSNK1E, and NPAS2 expression levels were high-risk factors and independently connected with the overall survival rate in LIHC patients. In conclusion, the identification of these DERGs contributes to the exploration of the molecular mechanisms of LIHC occurrence and development and may be used as diagnostic and prognostic biomarkers and molecular targets for chronotherapy in LIHC patients in the future.
Introduction
Circadian rhythms, driven by endogenous circadian clocks, exist in almost all organisms on Earth. At the molecular level, circadian clocks are roughly similar in different organisms and consist of a series of transcription and translation feedback loops (Li and Zhang, 2015). In mammals, the transcription factors BMAL1 and CLOCK (CLK), forming heterodimers, drive Period (Per), and Cryptochrome (Cry) gene transcription through E-box elements in their promoter regions. A high degree of similarity to the mammalian system exists in Drosophila, where the transcription activators CYCLE (CYC) and CLOCK (CLK) heterodimerize and drive the transcription of timeless (tim) and per (Lowrey and Takahashi, 2011).
Disruption of the normal circadian rhythm has adverse effects on the physiology of mammals. Some clinical and laboratory experiments have shown that these disturbances can lead to various diseases, including mental illnesses, metabolic disorders, neurodegenerative diseases, and cancers (Gamble et al., 2014; Cash et al., 2015; Kiessling et al., 2017). A database related to circadian expression patterns of specific genes in clinical disorders including tumors has been published (Li et al., 2018). As one of the most common malignant tumors in the world, liver hepatocellular carcinoma (LIHC) ranks among the top 10 in terms of global mortality rate and is also a highly prevalent and harmful malignant tumor in China (Bray et al., 2018). However, the molecular mechanism underlying the carcinogenesis or progression of liver cancer is still unclear.
In the current study, we aim to identify differentially expressed rhythm genes (DERGs) through comprehensive bioinformatics analysis, which maybe benefit to explore the potential molecular mechanism underlying the occurrence and development of LIHC and may be used as diagnostic and prognostic biomarkers and molecular targets for chronotherapy in LIHC patients in the future.
Materials and Methods
The flow diagram of this study was shown in Figure 1. DERGs were found through The Cancer and Tumor Genome Atlas (TCGA) database and a human circadian genes database. GO function, KEGG pathway enrichment, protein–protein interaction (PPI) network and survival analyses of DERGs were performed using R software. DERGs expression levels were analyzed in LIHC patient samples and was verified in cell experiments. Further clinical correlation analyses were conducted to explore the value of DERGs in the timing treatment of LIHC.
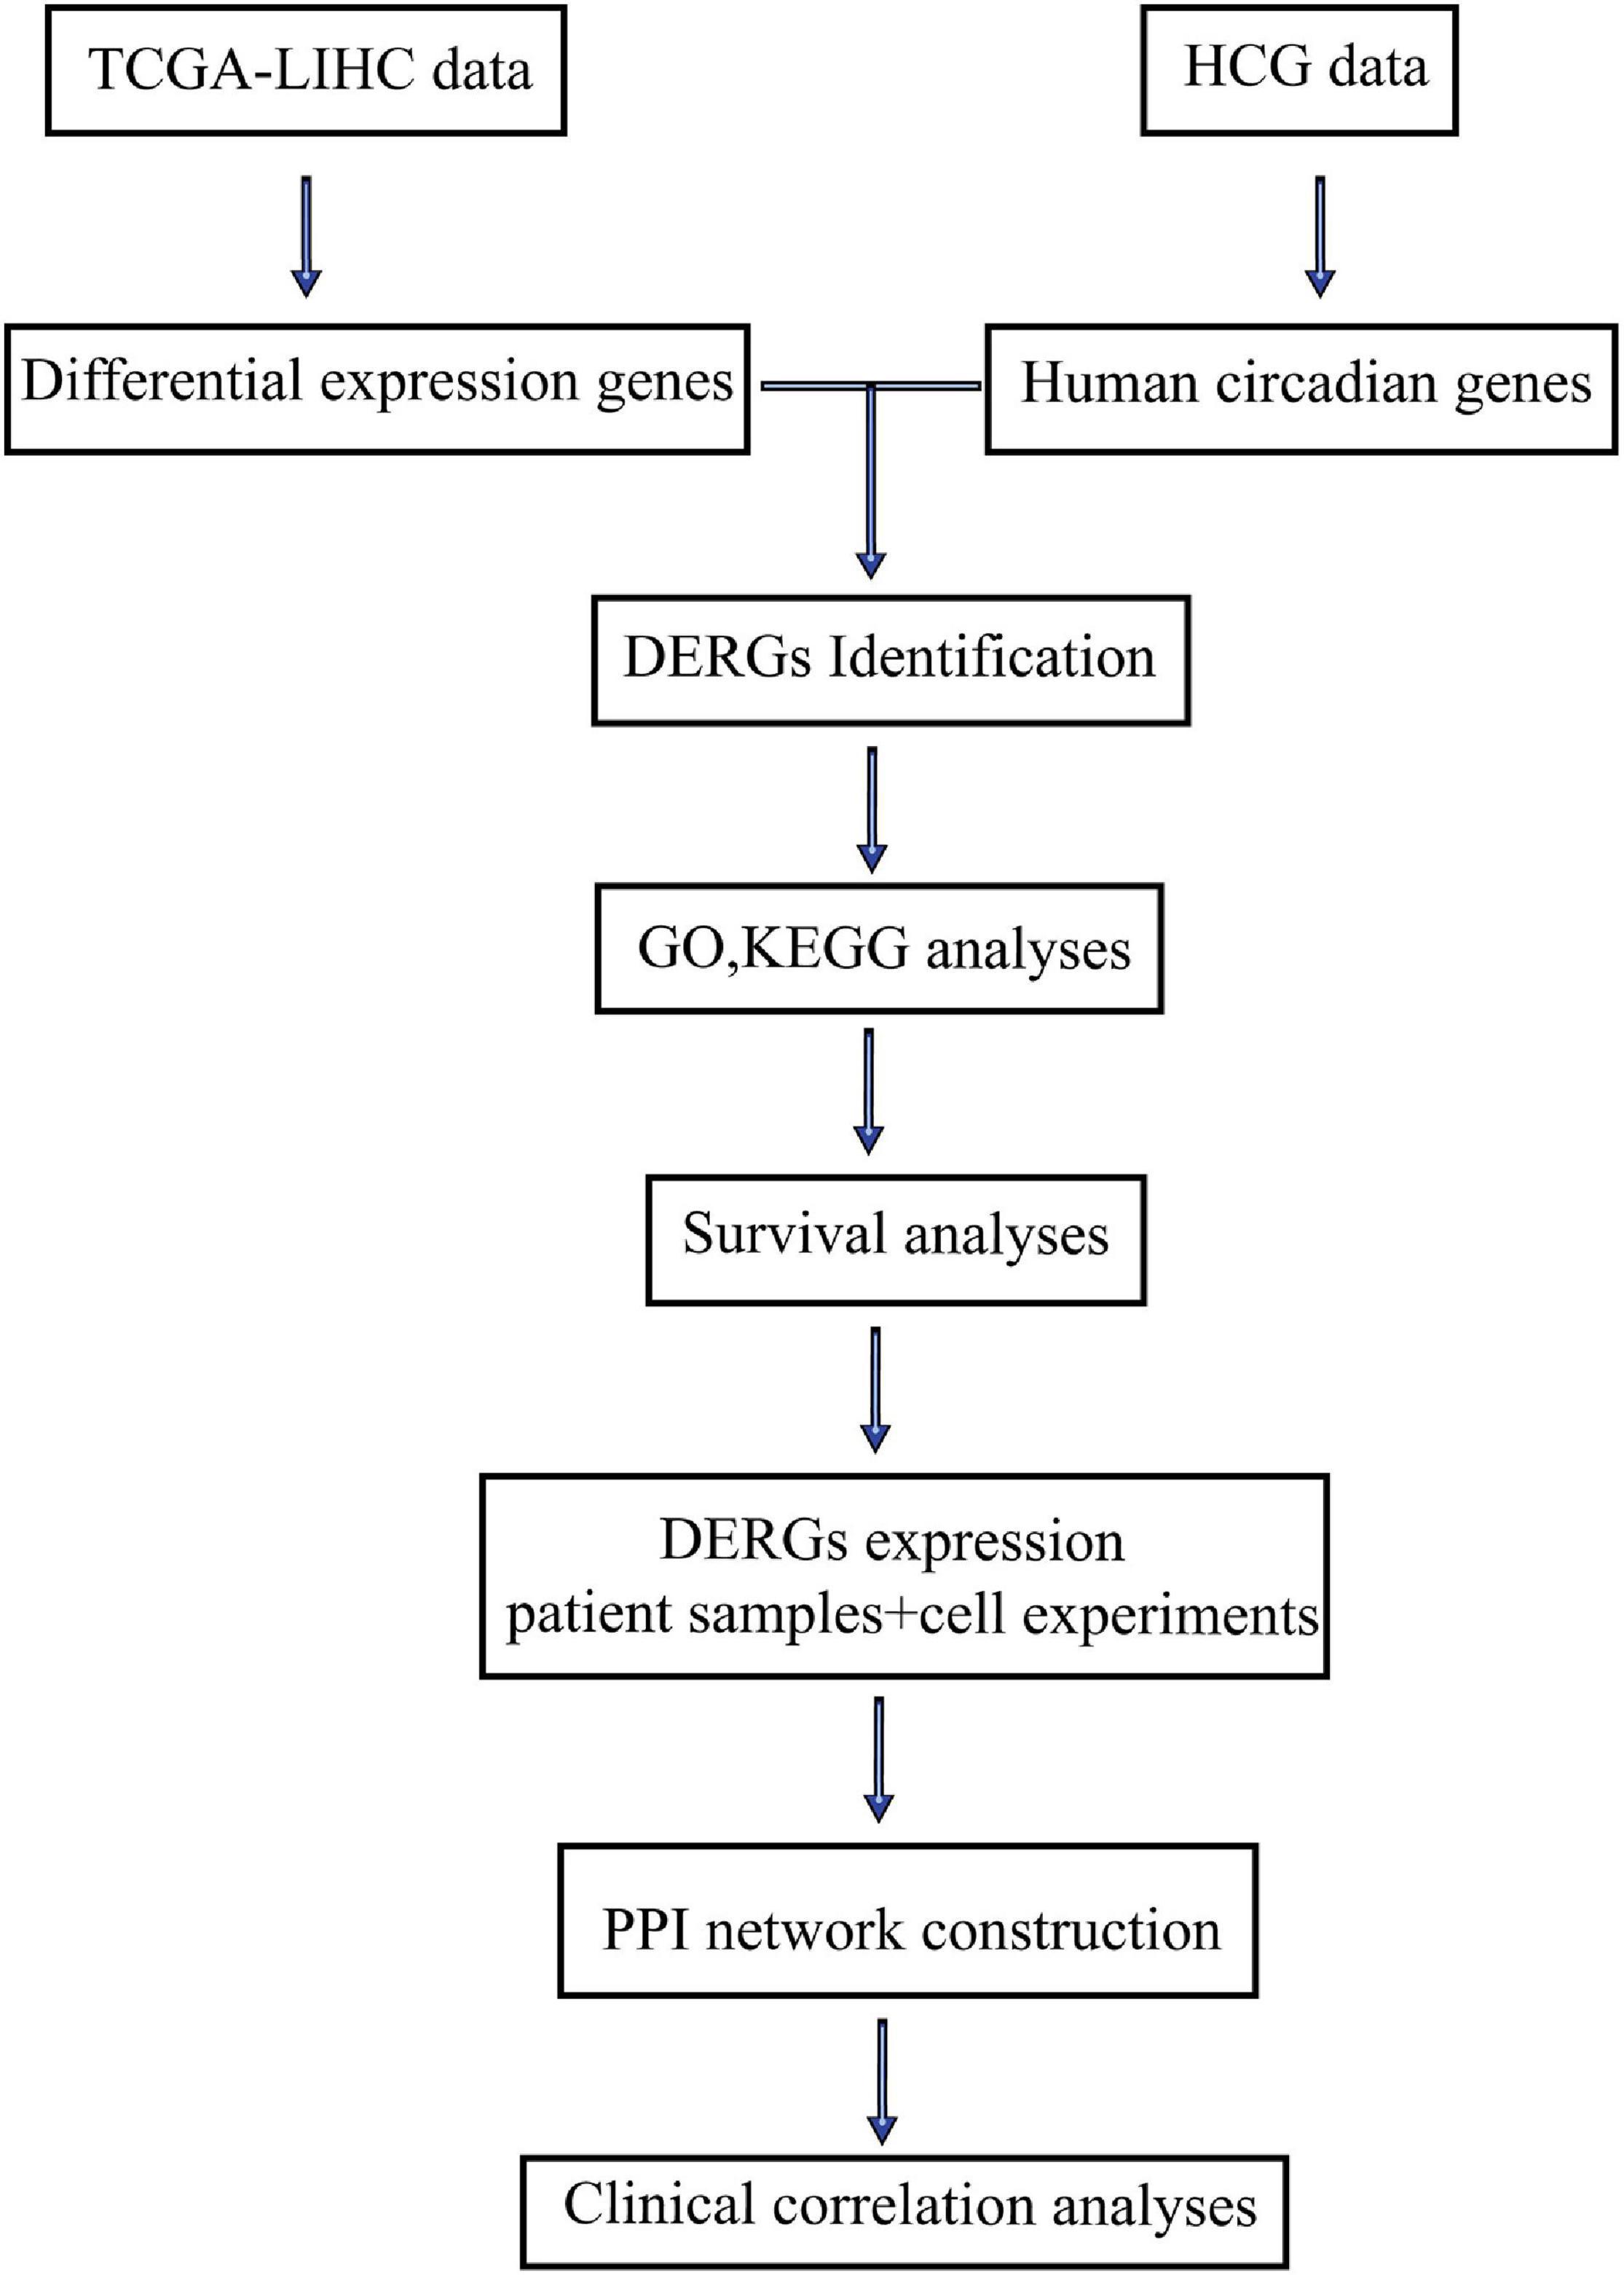
Figure 1. Flow diagram of this study.
Data Collection
First, TCGA repository interface1 was entered. Then, TCGA-LIHC was selected in the Project column. Meanwhile, transcriptome profiling was selected in the Data Category column; Gene Expression Quantification was selected as the Data Type; RNA-seq was selected in the Experimental Strategy column; and HTSeq-FPKM was selected in the Workflow Type column. Finally, all the data that matched the above conditions were downloaded.
Screening Differentially Expressed Genes
The differentially expressed genes (DEGs) between LIHC samples and non-neoplastic samples were screened using R software (version 4.0.2). DEGs were defined as those representing differences with P < 0.05. Using the Venny 2.1 online tool, 7168 DEGs were compared with the human circadian gene list (constructed by our research group) (Li et al., 2017). The intersection of both was taken; 563 DERGs were screened out and a volcano plot was drawn using R software (version 4.0.2).
GO and KEGG Pathway Analysis
Gene Ontology (GO) analysis is a general method for large-scale functional enrichment research. Gene function includes biological process (BP), molecular function (MF), and cellular component (CC) (Harris et al., 2004). KEGG is a broad functional database that stores a wealth of data on biological pathways, genomes, diseases, and drugs (Ogata et al., 1999; Kanehisa et al., 2021). First, the DERGs’ official symbols were converted through the org.hs.eg.db package in R software (version 4.0.2); the cluster Profiler package was used for GO and KEGG pathway analyses; and GO plot package was used for cluster analysis. Significant differences were defined when both P and Q values were less than 0.05.
Survival Analysis
The survival package of R software (version 4.0.2) was used to analyze ARNTL, CSNK1D, CSNK1E, NPAS2, NR1D1, PER1, PER2, PER3, PRKAG2, and RORA gene expression profiles and overall survival (OS) in TCGA-LIHC patients (excluding patent information with no survival time). Then, the survival curve analysis of the CSNK1D, CSNK1E, and NPAS2 genes was verified by using the KM-plotter online tool. On the main interface of the KM-plotter, “Start KM Plotter for liver cancer” in “RNA-seq” was selected; the gene name to be searched was inputted and the default values for other options were selected.
Matching Analysis
After screening and sorting the patient samples, the tumor samples were paired with the normal samples from the same patients (a total of 50 pairs). In addition, the expression levels of the CSNK1D, CSNK1E, and NPAS2 genes were extracted, and the matching graphs were drawn in R software (version 4.0.2).
Cell Culture
WRL-68, SMMC-7721, SNU-449, and HUH-7 cells were cultured in DMEM (Gibco, Thermo Fisher Scientific, United States) with 10% fetal bovine serum (Life Technologies, United States) and 1% penicillin and streptomycin (100 U/ml penicillin and 100 μg/ml streptomycin, Life Technologies) at 37°C in a humidified incubator containing 5% CO2.
RNA Extraction and RT-qPCR
Total RNA was extracted from cells using TRIzol (Invitrogen). Any contaminating genomic DNA was removed with RQ1 DNase (Promega, Madison, WI, United States) digestion, and the total RNA was directly amplified using the TransScript Green One-Step qRT-PCR SuperMix (TransGen Biotechnology, Beijing, China). All qPCRs were performed using the Step One Plus Real-Time PCR System (Life Technologies). The primers used for expression analysis were as follows: CSNK1D-fw: caaaaccaaacaccctcagc. CSNK1 D-rv: catcaccatgacgttgtagtcc. CSNK1E-fw: cgtgtggggaacaagtaccg. CSNK1E-rv: gatgttggcacccaggtagat. NPAS2-fw: cgtgttggaaa aggtcatcgg. NPAS2-rv: tccagtcttgctgaatgtcac.
Protein–Protein Interaction Network Construction
The website of Search Tool for the Retrieval of Interacting Genes Database (STRING)2 was a biological database designed to construct a PPI network of DERGs based on the known and predicted PPIs and then analyze the functional interactions between proteins. Subsequently, the PPI network was visualized by means of Cytoscape software (version 3.7.2).
Clinical Correlation Analyses
The relevant clinical data of the hepatoma patients, namely the phenotypes of TCGA LIHC (n = 377), were downloaded from TCGA database. In addition, according to the clinical characteristics of patients (such as age, sex, and tumor stage), we excluded some patients whose clinical data were incomplete; ultimately, we obtained data from 235 patients for Cox analysis to assess the combined effects of clinical characteristics and gene expression.
Statistical Analysis
Statistical tests were performed using R software (version 4.0.2). The t-test or Mann–Whitney test was used for comparisons between the two groups. Schoenfeld individual tests were used to evaluate the proportional hazards assumption for the fit of the Cox regression model. We used univariate and multivariate Cox proportional hazards models to evaluate the survival analysis. The optimal cut-off value generated by the “surv cutpoint” function of R package was used for survival analysis, and expression levels were divided by dichotomy. In addition, statistical significance in cell line experiments was assessed in t tests in GraphPad Prism version 8 software. A value of P < 0.05 was considered statistically significant (∗P < 0.05, ∗∗P < 0.01, ∗∗∗P < 0.001).
Results
Identification of DERGs
A total of 7168 DEGs and 1368 circadian genes were identified in the analyses of the LIHC-FPKM and CGDB datasets, respectively. Among them, 563 DERGs were found in both datasets (Figure 2A and Supplementary Table 1). Compared with normal liver tissue samples, 265 DERGs were downregulated and 298 DERGs were upregulated in LIHC tissue samples (Figure 2B).
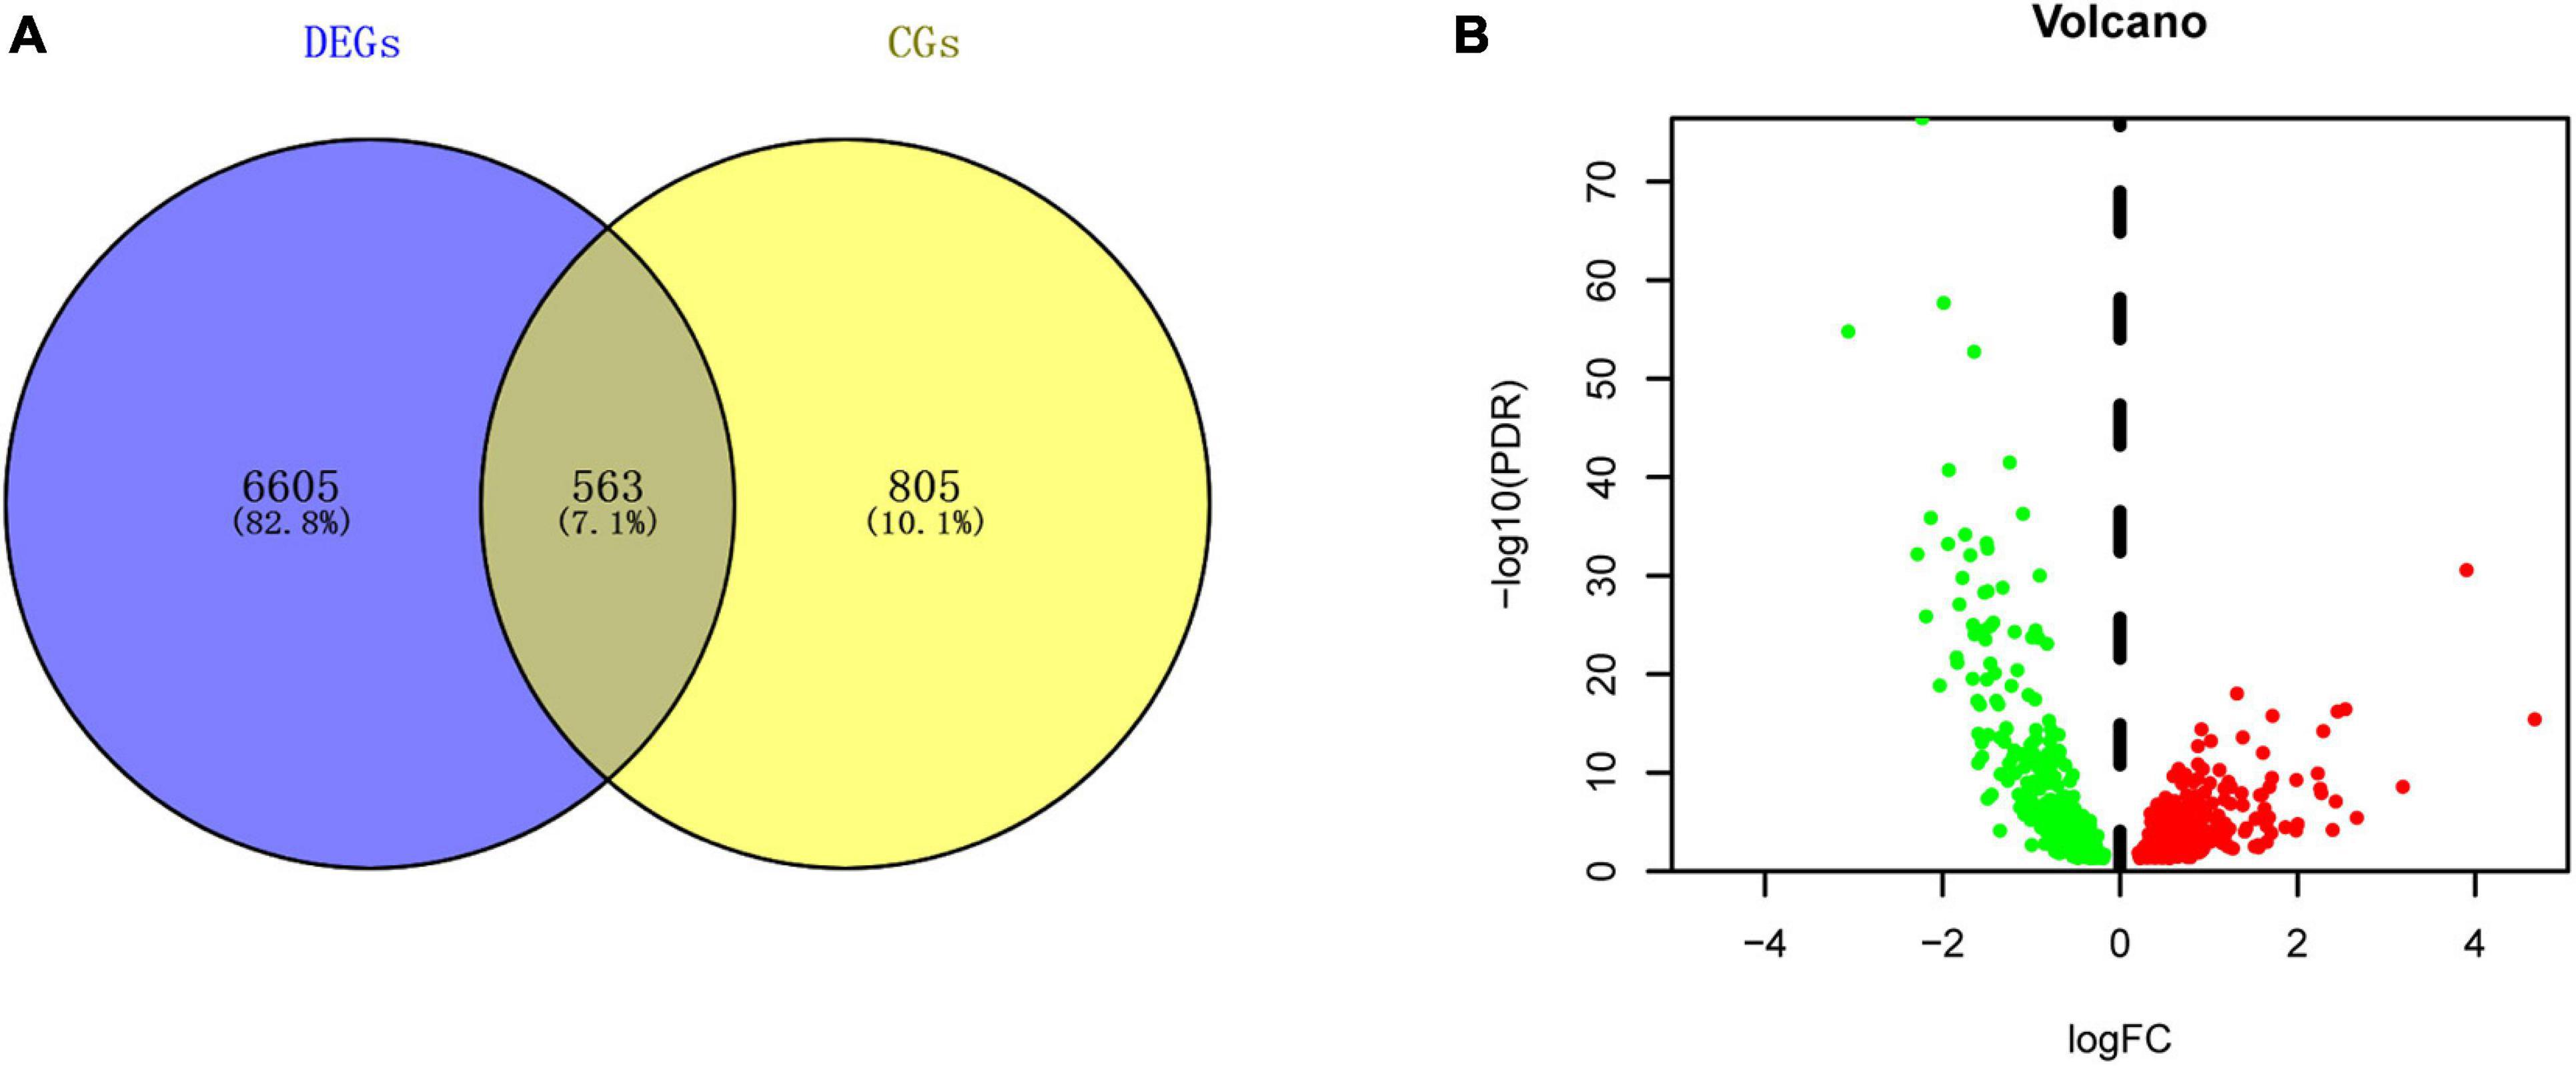
Figure 2. Identification of DERGs. (A) Intersection map of genes in the LIHC and CGDB datasets. (B) Volcano plot of DERGs. The green and red dots represent the downregulated and upregulated genes, respectively.
GO Analysis of DERGs
To further evaluate the functions and mechanisms of these DERGs, GO enrichment analysis of BPs indicated that the DERGs were mainly enriched in cellular carbohydrate metabolic process, circadian regulation of gene expression, regulation of small molecule metabolic process, regulation of lipid metabolic process, and response to nutrient levels and other processes. GO enrichment analysis of CCs indicated that the DERGs were mainly enriched in vesicle lumen and granule lumen. GO enrichment analysis of MFs indicated that the DERGs were mainly enriched in hydrolase activity, acting on carbon nitrogen bonds, steroid hormone receptor activity, and so on (Figure 3A). To further analyze the enrichment results, we performed gene cluster analysis on the BP modules with the top P-values. The results revealed that DERGs were significantly associated with rhythmic and metabolic processes (Figure 3B).
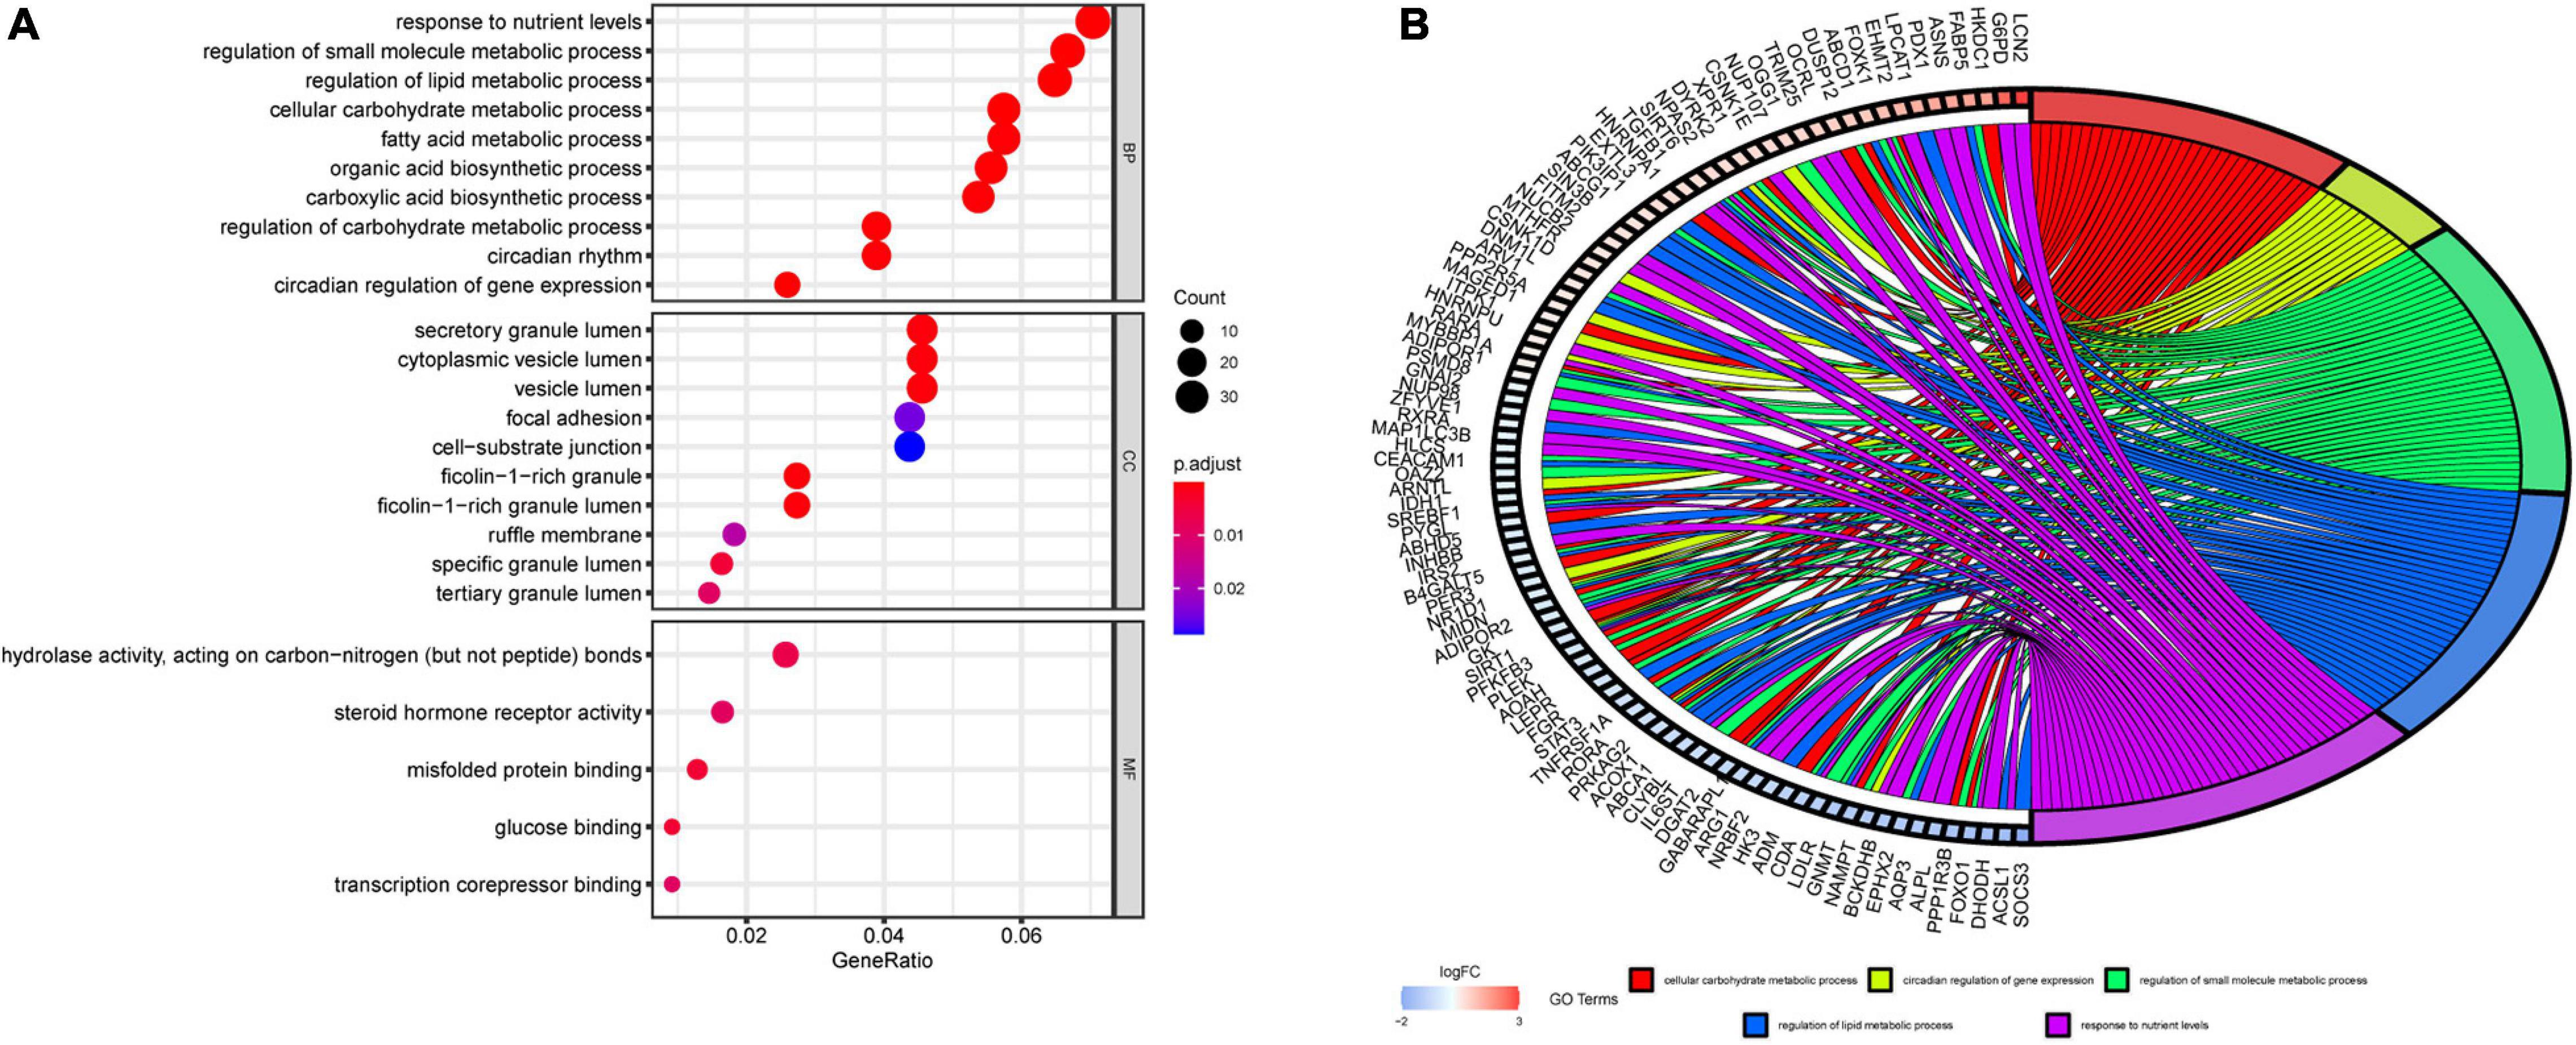
Figure 3. GO enrichment analysis of DERGs. (A) Biological process, cell components, and molecular function enrichment analyses of DERGs. (B) GO cluster analyses.
KEGG Pathway Analysis of DERGs
The KEGG pathway enrichment analysis indicated that the circadian rhythm pathway, the adipocytokine signaling pathway, and the glycine, serine, and threonine metabolism pathways were significantly affected, especially the circadian rhythm pathway, with P < 0.001 (Figure 4A). Gene cluster analysis of the KEGG pathways showed that DERGs were also significantly associated with rhythmic and metabolic processes (Figure 4B). In particular, the CNK1D, CSNK1E, NPAS2, PER1, PER2, PER3, ARNTL, NR1D1, PRKAG2, and RORA genes were significantly enriched in the circadian rhythm pathway (Figure 4C).
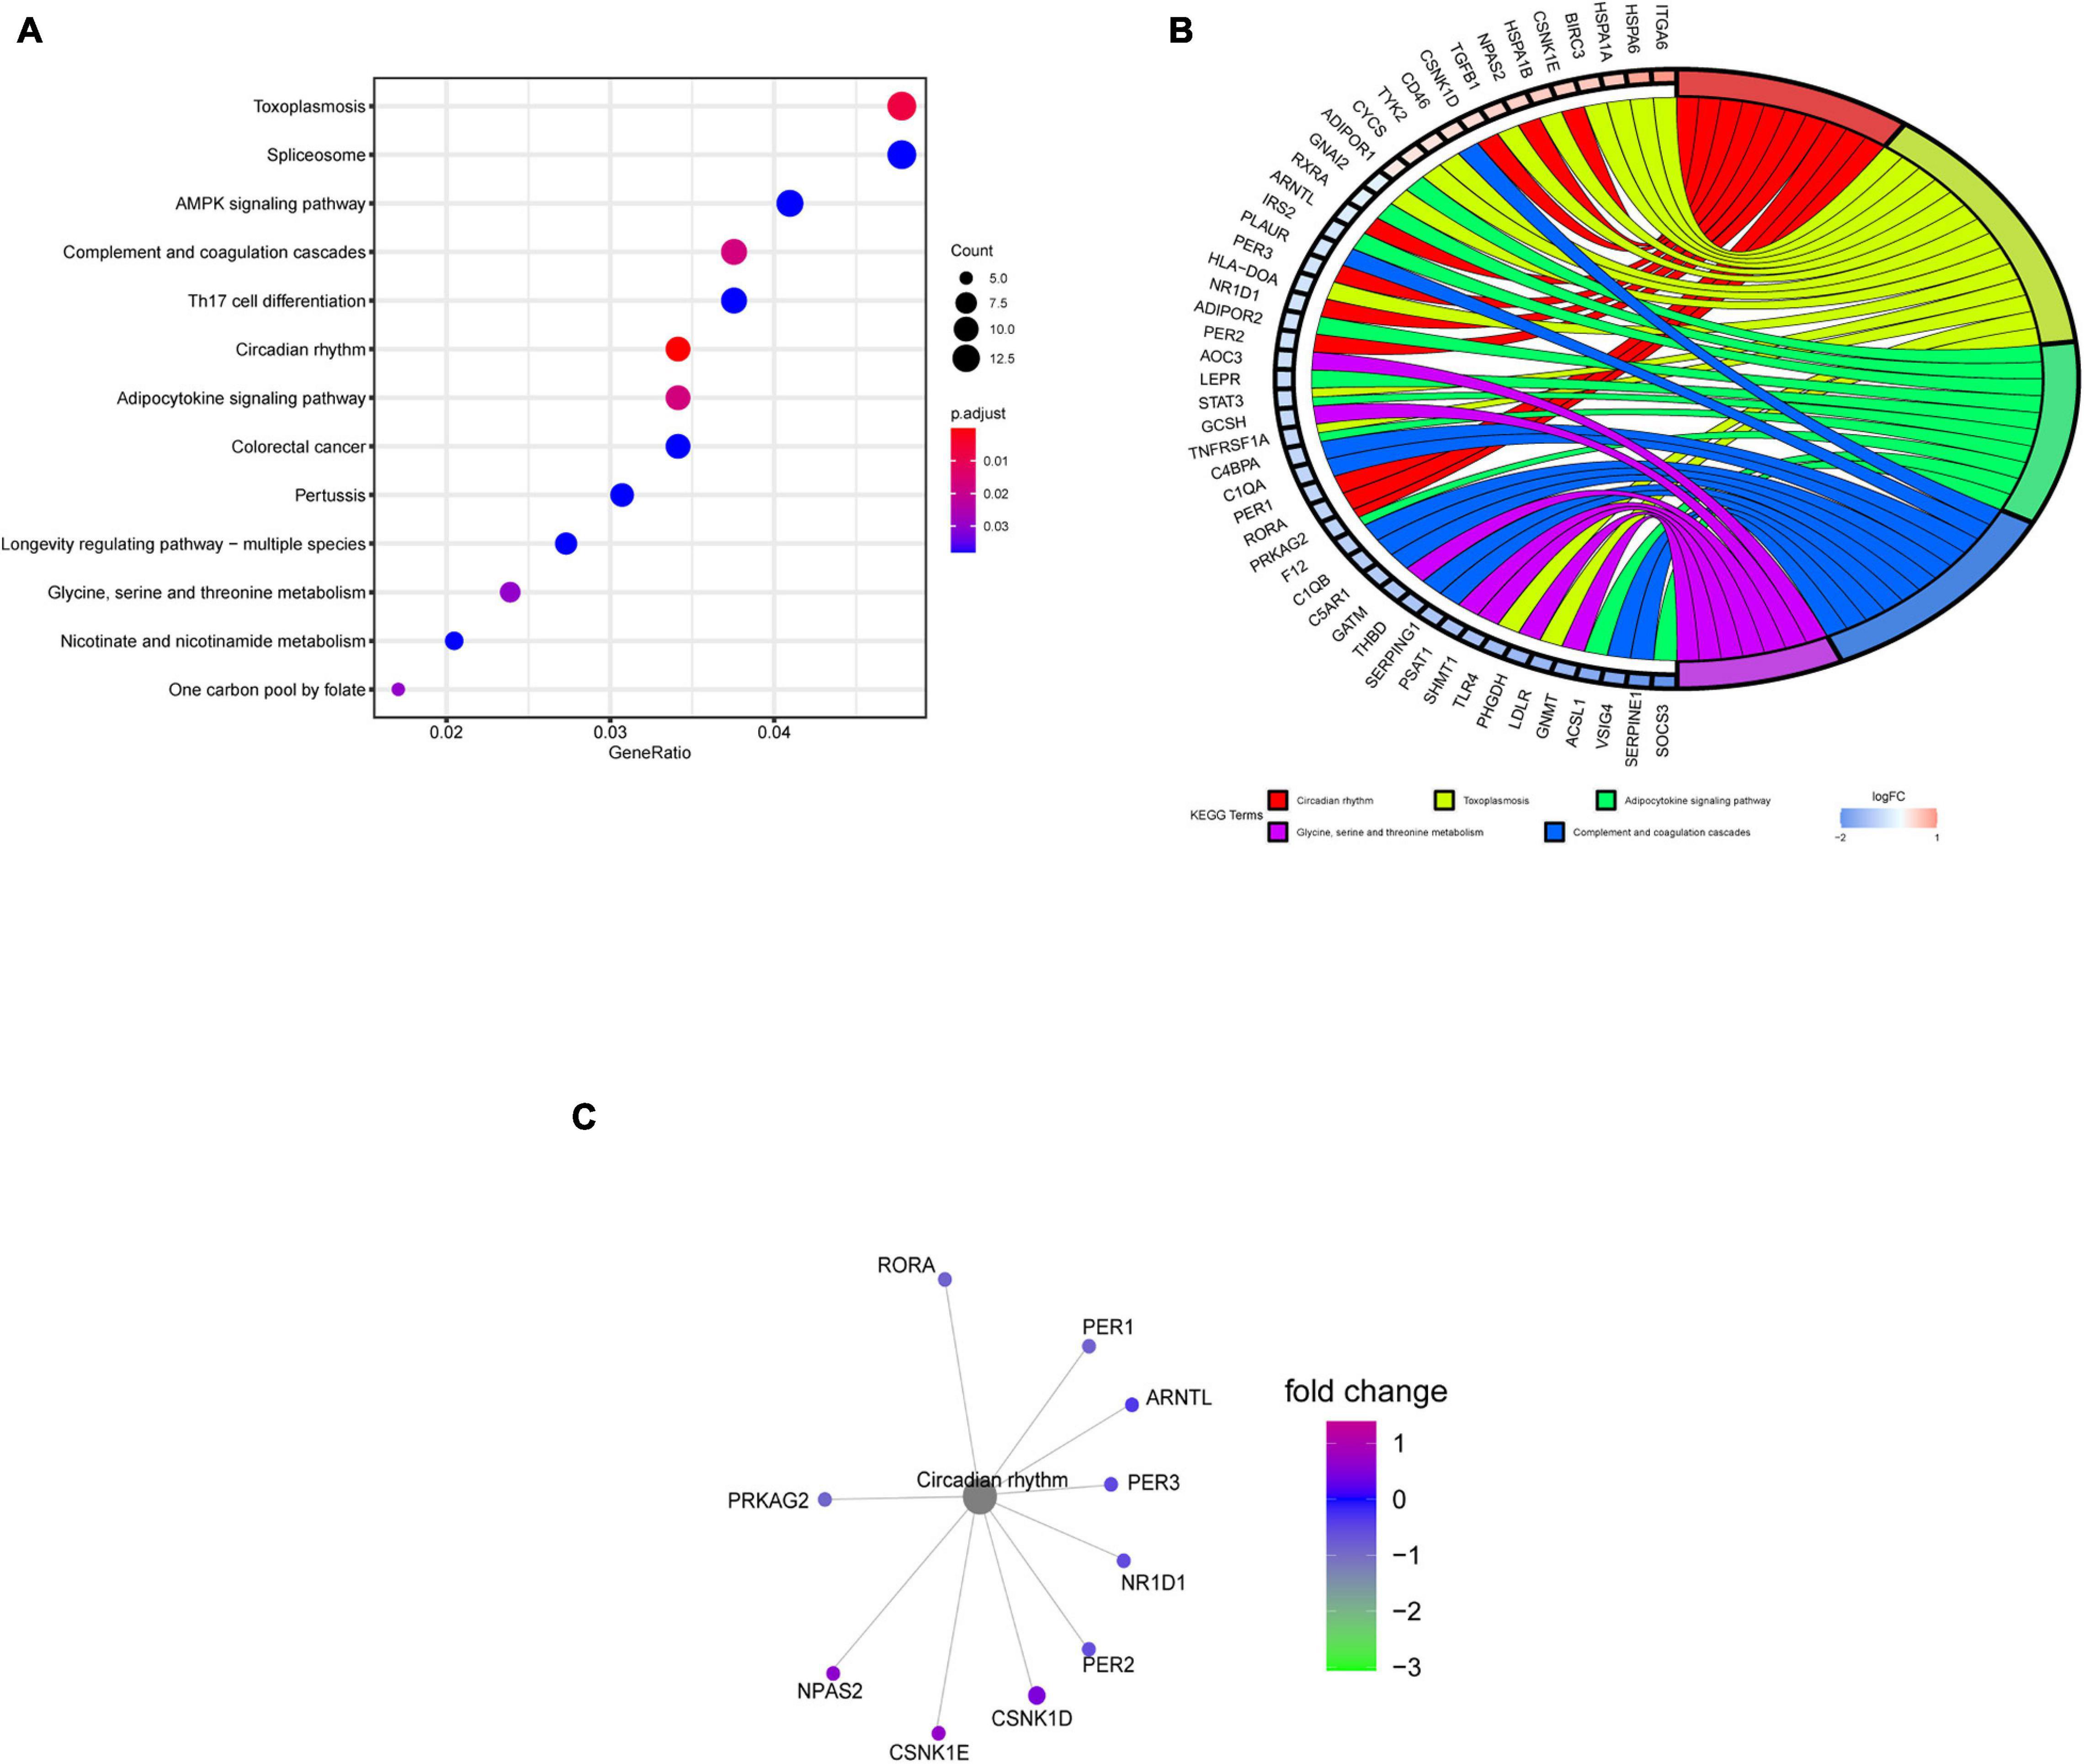
Figure 4. KEGG pathway enrichment analysis of DERGs. (A) KEGG pathway analysis of DERGs. (B) KEGG pathway cluster analyses. (C) Significantly enriched genes in the circadian rhythm pathway.
Survival Analysis
To investigate the prognostic values of DERGs, a total of 377 liver cancer samples were available for the analysis of OS (Supplementary Table 2). We found that higher expression levels of CSNK1D, CSNK1E, and NPAS2 were significantly related to shorter OS of liver cancer patients (Figure 5). Conversely, the expression levels of ARNTL, NR1D1, PER1, PER2, PER3, PRKAG2, and RORA were not significantly related to the OS of liver cancer patients (Supplementary Figure 1). KM-plotter online tool further validated these results (Supplementary Figure 2).
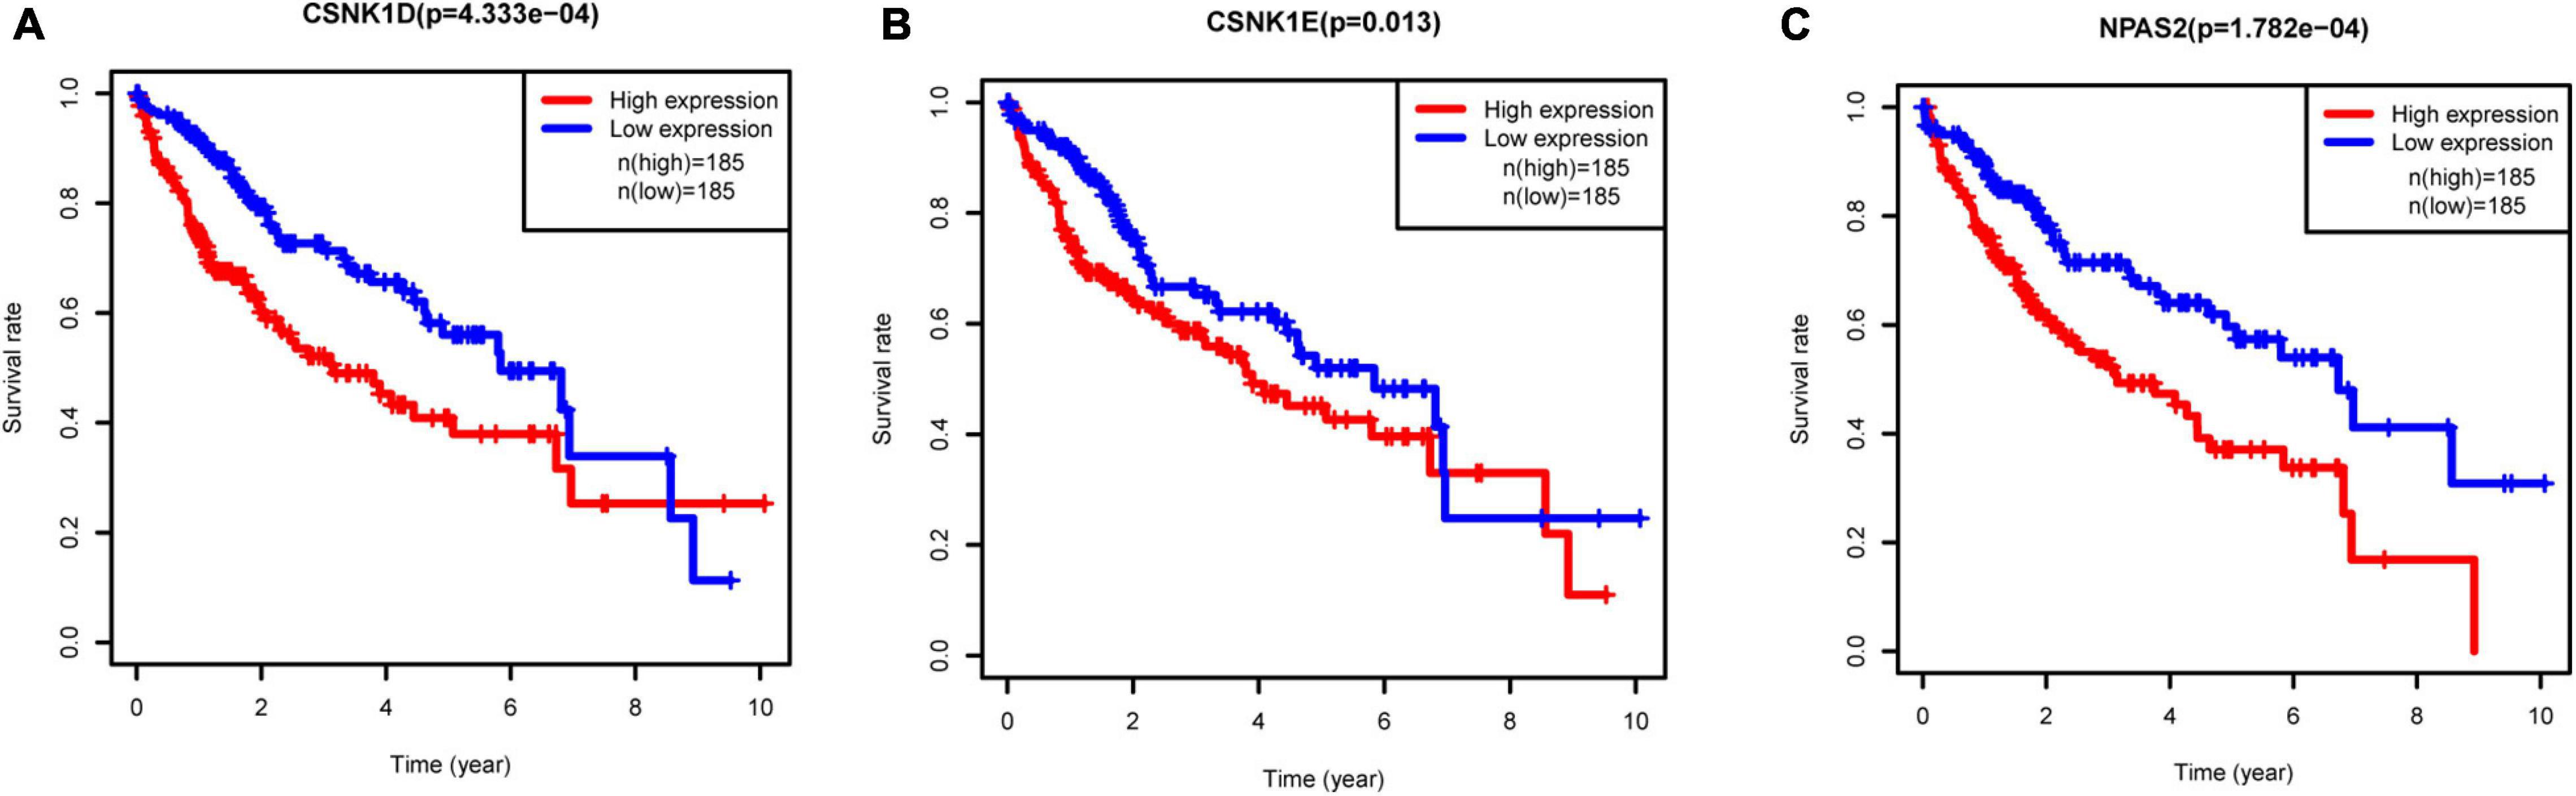
Figure 5. Relationships between three hub gene expression levels and survival rate in LIHC. (A) CSNK1D, (B) CSNK1E, and (C) NPAS2.
Analysis of DERGs Expression Levels
To explore the expression levels of genes (CSNK1D, CSNK1E, and NPAS2) in liver cancer, we compared the mRNA expression levels of tumor and normal tissues. The results revealed that the CSNK1D, CSNK1E, and NPAS2 mRNA levels were strongly upregulated in LIHC samples (Figure 6A). The patient samples were then further analyzed and sorted (Supplementary Table 3), and the normal and tumor samples from the same patients were matched for comparisons (a total of 50 pairs) of their expression levels. We obtained the same results as before (Figure 6B). Additionally, in the liver cancer cell experiment, similar results were obtained, in which the CSNK1D, CSNK1E, and NPAS2 mRNA expression levels were strongly upregulated compared with those in normal liver cells (Figure 6C).
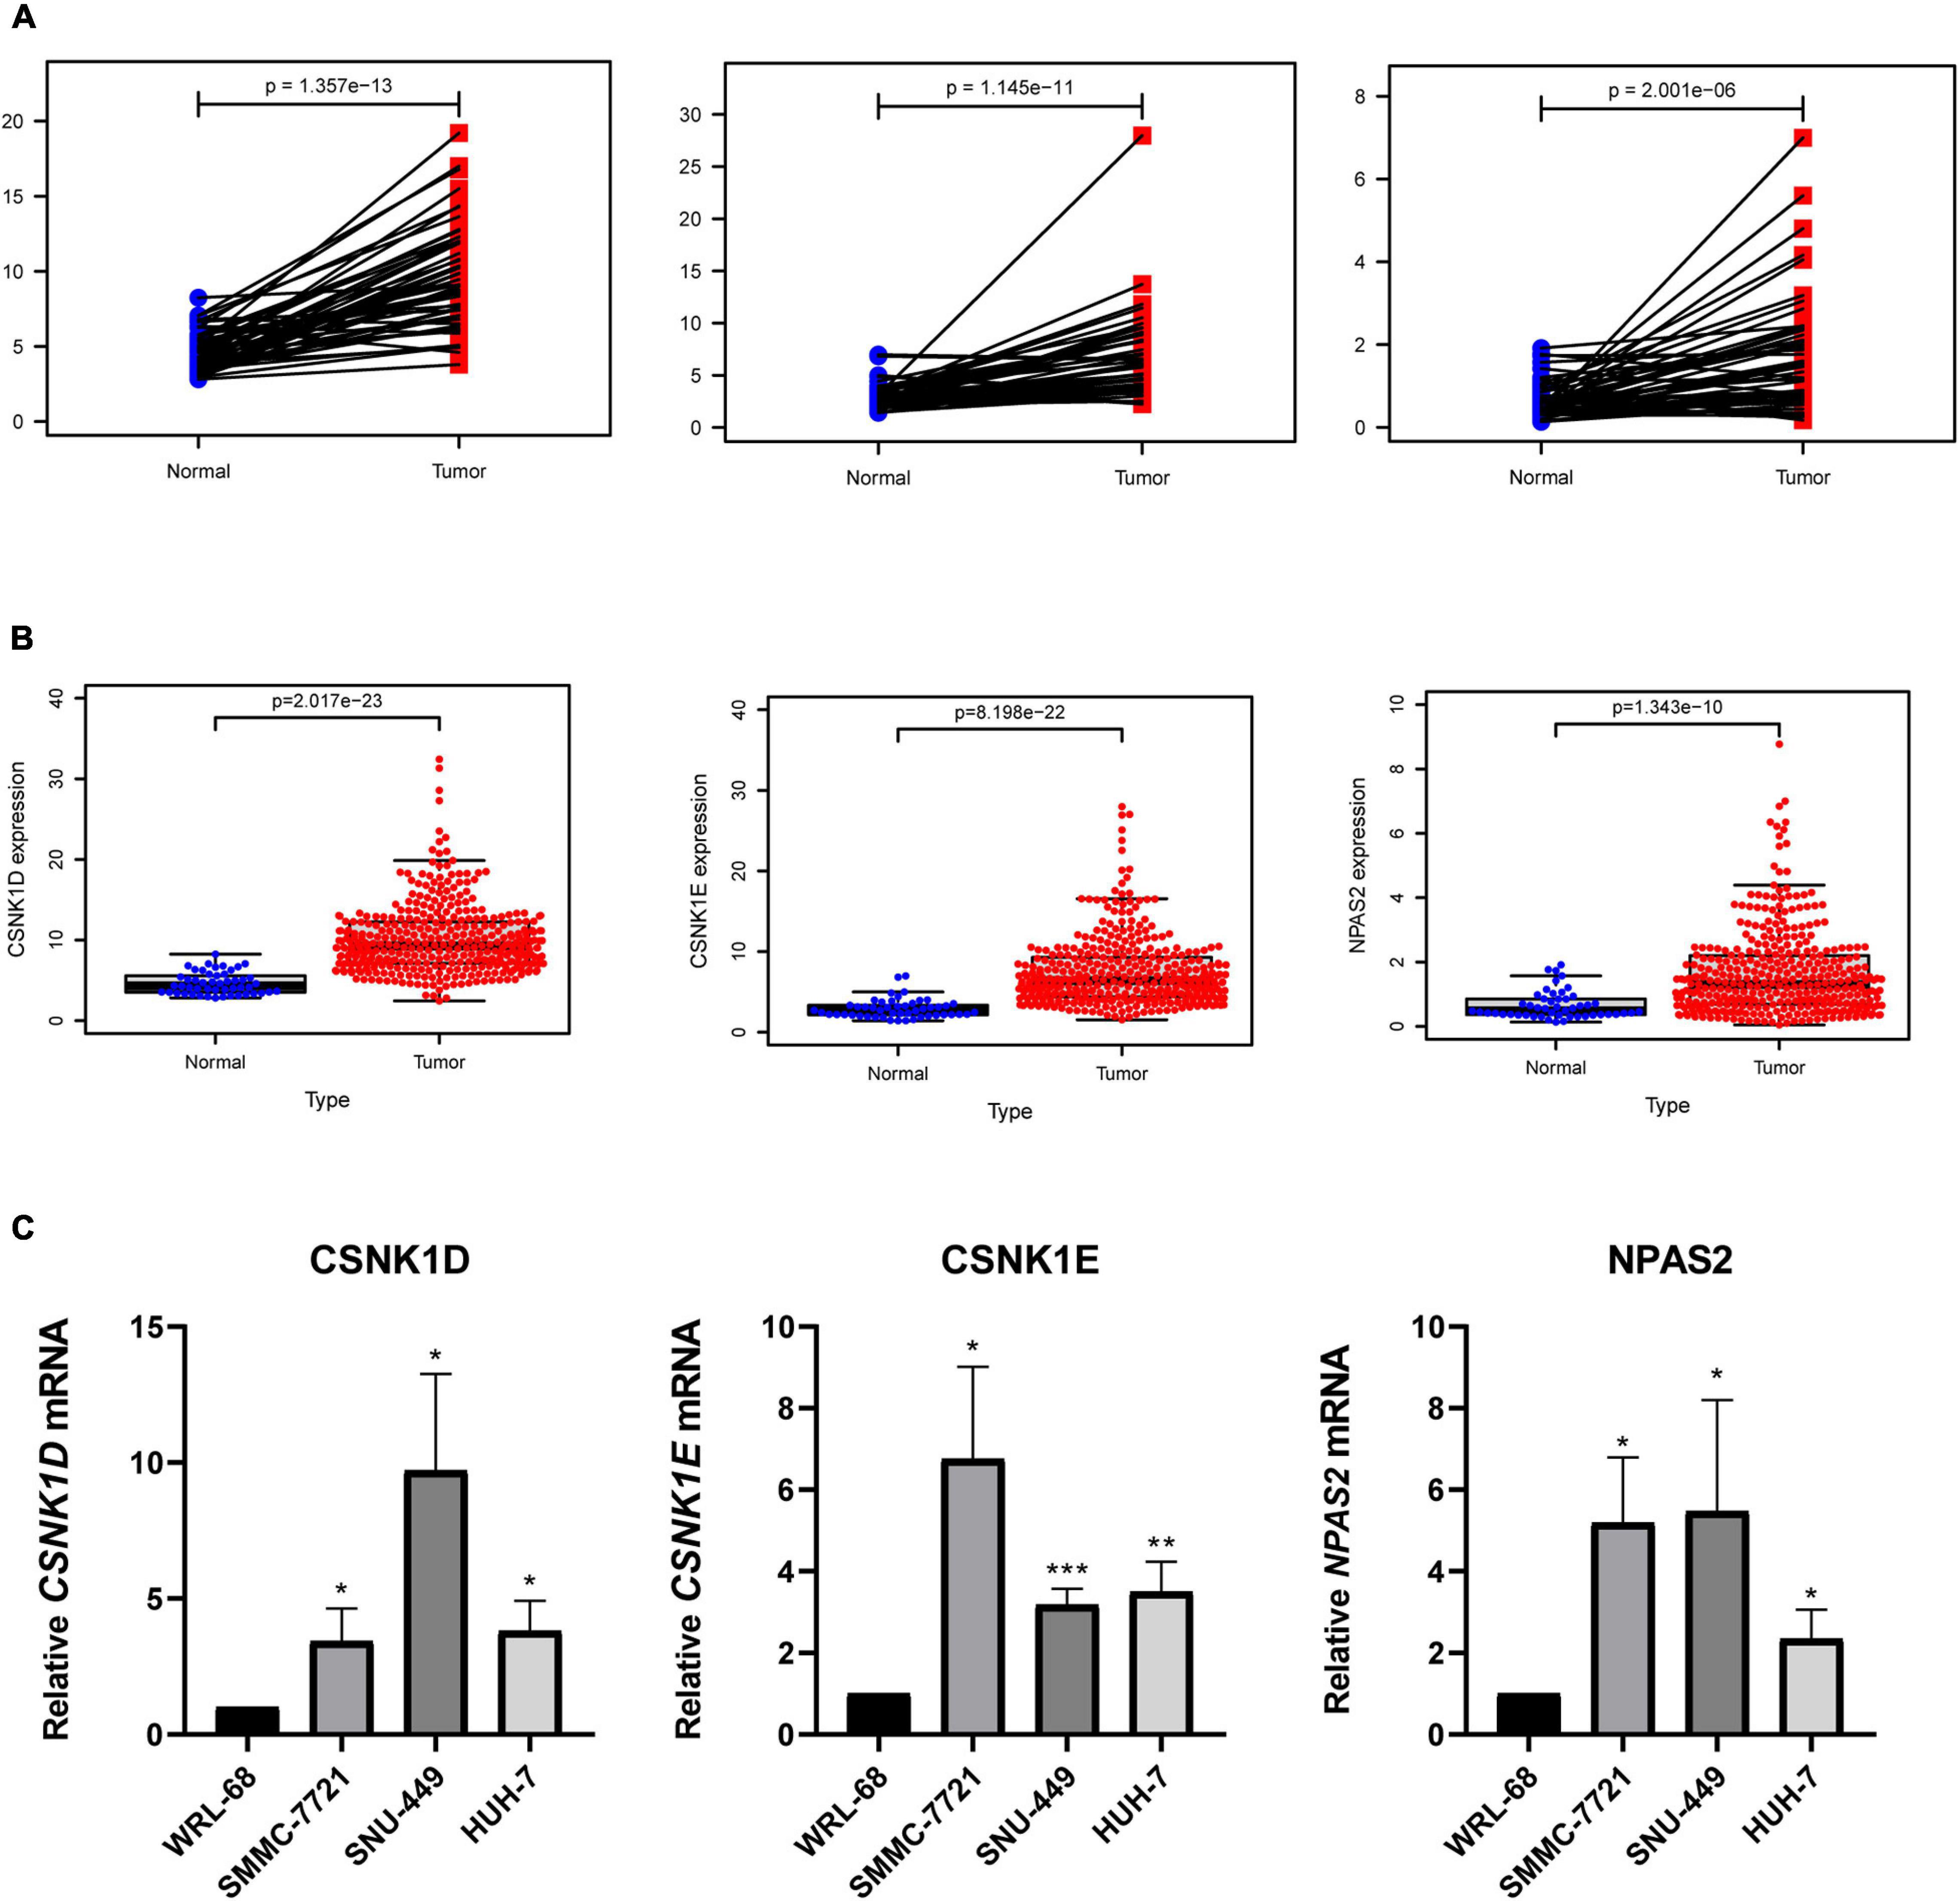
Figure 6. Expression levels of 3 hub genes in LIHC. (A) CSNK1D, CSNK1E, and NPAS2 expression levels in normal and LIHC tissues. (B) CSNK1D, CSNK1E, and NPAS2 expression levels in LIHC tissues and their matched controls. (C) The mRNA expression levels of CSNK1D, CSNK1E, and NPAS2 in LIHC cell lines. The experiments were performed independently for three times. *P < 0.05, **P < 0.01, ***P < 0.001.
PPI Network Analysis
To identify the key genes and important gene modules, the PPI network of CSNK1D, CSNK1E, and NPAS2 genes was constructed, consisting of 23 nodes and 135 edges (Figure 7). These interacting genes were PER1, PER2, CRY1, CRY2, CLOCK, BTRC, BHLHE41, ARNTL, BYSL, BMS1, NOB1, RIOK1, TSR1, RIOK2, WDR3, PNO1, LTV1, KRR1, DCAF13, and CTNNB1, which were mainly associated with circadian pathway, Hedgehog signaling pathway and Hippo signaling pathway.
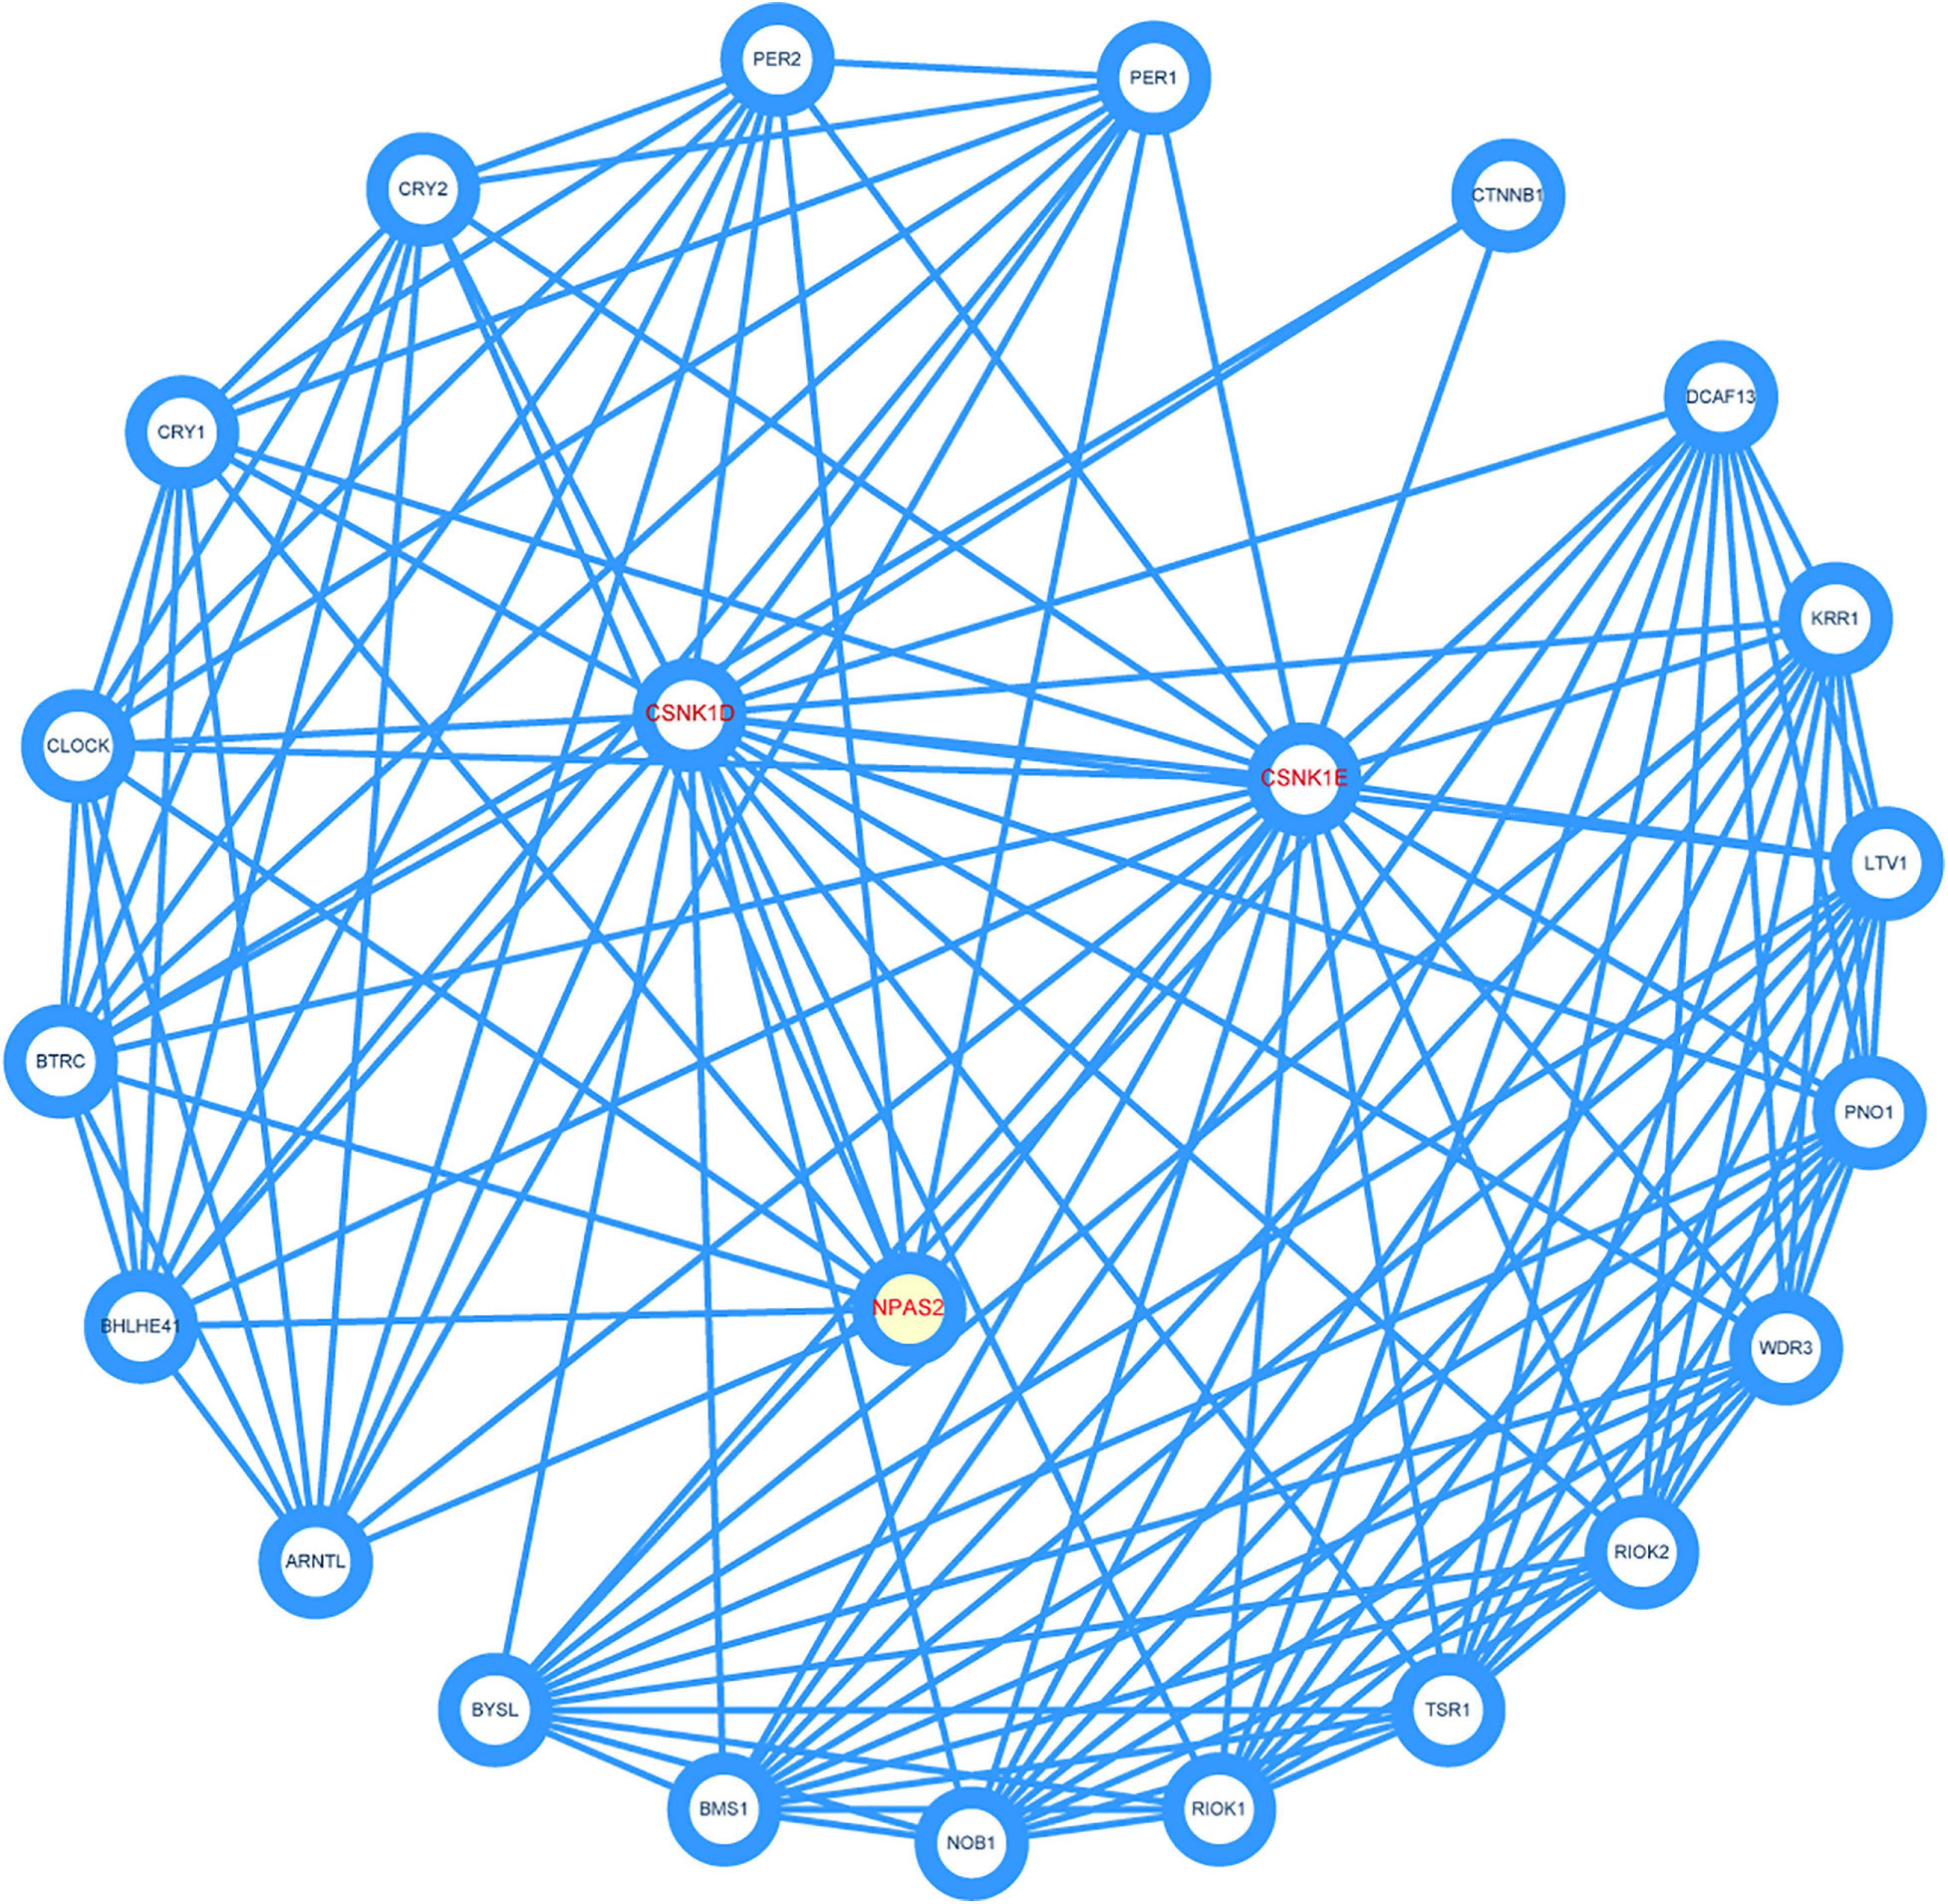
Figure 7. Construction of protein-protein interaction (PPI) network. Three hub genes were marked red.
Correlations Between DERGs Expression and Clinicopathological Factors in LIHC
To further verify the clinical diagnostic value of the three DERGs, the univariate Cox analyses were performed to verify the prognostic role of DERGs in liver cancer. They show that CSNK1D expression (HR = 2.28; 95% CI = 1.47–3.54), CSNK1E expression (HR = 1.61; 95% CI = 1.12–2.33), NPAS2 expression (HR = 1.72; 95% CI = 1.18–2.51), TNM stage, and invasion depth were high risk factors (Supplementary Tables 4–6). Similarly, the results of multivariate analysis showed that CSNK1D (HR = 2.06; 95% CI = 1.26–3.37), CSNK1E (HR = 1.50; 95% CI = 1.01–2.22) and NPAS2 (HR = 1.49; 95% CI = 0.99–2.21) were also independently associated with OS (Figures 8A–C and Supplementary Table 7). Overall, the CSNK1D, CSNK1E, and NPAS2 genes were adverse prognostic factors and independent prognostic markers.
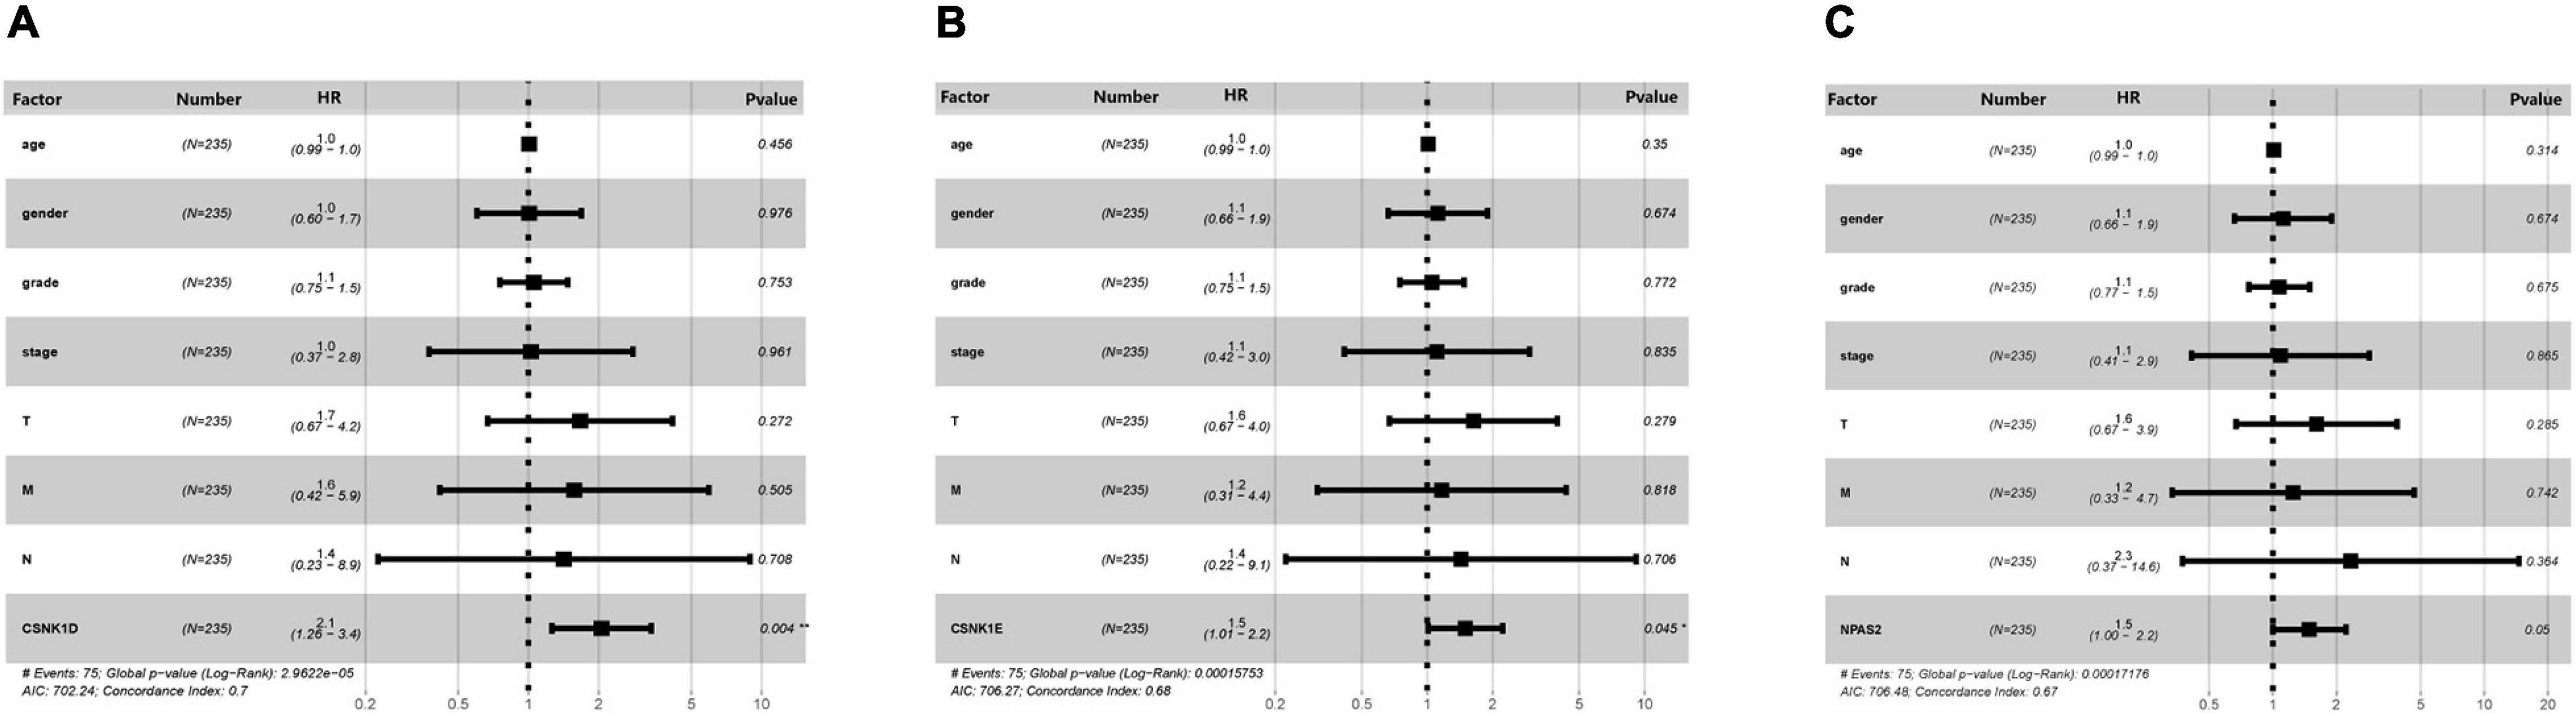
Figure 8. Multivariate Cox analysis of clinical characteristics. (A) CSNK1D, (B) CSNK1E, and (C) NPAS2. HR, hazard ratio; T, topography; N, lymph node; M, metastasis.
Discussion
Liver Hepatocellular Carcinoma is a common type of cancer that is associated with poor prognosis and high mortality (Yang and Roberts, 2010; Yang et al., 2019). Although research on the pathology of liver cancer has gradually deepened in the last few years and progress has been made in the management of diagnosis and treatment strategies for patients with liver cancer, the treatment success rate and clinical outcomes are still very poor (Lurje et al., 2019; Villanueva, 2019). With the continuous discovery of molecular biomarkers, prognostic indicators will become a promising clinical tool for liver cancer (Xu et al., 2018). Therefore, it is necessary to develop novel diagnostic and prognostic biomarkers for liver cancer to assist in clinical diagnosis and prediction.
Epidemiological studies have shown that the disruption of normal circadian rhythms may increase the risk of many types of cancer, such as breast, prostate, rectal, and endometrial cancers (Winter et al., 2007; Taniguchi et al., 2009; Kuo and Ladurner, 2019). In addition, abnormal expression levels of circadian clock genes are closely related to tumor development. Studies have found that mutations in BMAL1, CRY1, and CRY2 are often associated with a higher risk and recurrence of acute myeloid leukemia and endometrial, ovarian, colorectal, and breast cancers (Hasakova et al., 2018; Burgermeister et al., 2019; Kwon et al., 2020). Per 1, Per 2, and Per 3 are frequently expressed in human breast and colorectal cancers, non-small-cell lung cancer (NSCLC), hepatocellular and cervical squamous cell carcinomas, and glioma (Yeh et al., 2005; Mostafaie et al., 2009; Lin et al., 2019). Studies have shown that clock genes can regulate the expression of proto-oncogenes and tumor suppressor genes and participate in the cell cycle, apoptosis, DNA damage, and other processes. These findings suggest that there is a network of mechanisms between rhythm genes and cancer and several DERGs can be used as prognostic markers for clinical diagnosis.
Through bioinformatics analysis and experimental verification, we found that the CSNK1D, CSNK1E, and NPAS2 mRNA levels were strongly upregulated in LIHC samples. Moreover, CSNK1D, CSNK1E, and NPAS2 are also three key genes in the negative feedback loop of circadian rhythm. In the core loop, two E-box specific transcription factors, CLOCK [Circadian Locomotor Output Cycles Kaput, replaced by NPAS2 (Neuronal PAS domain protein 2)] and BMAL1 (Brain and muscle Arnt-like protein-1) heterodimerize during the day and activate transcription from genes containing E-boxes, including the Pers, Crys, and clock-controlled genes (CCGs). In the cytoplasm, PERs and CRYs, phosphorylated by CSNK1D/E and from a complex. Subsequently they enter the nucleus where they inhibit CLOCK/BMAL1-mediated transcription in the evening. PERs phosphorylated by CSNK1D/E are degraded via the proteasome pathway and restart a new cycle of transcription. Secondary loops include additional pairs of antagonizing transcription factors such as DBP and E4BP4, REV-ERBs, and RORs. DBP and E4BP4 regulate the expression of Rors and other CCGs through D-boxes. REV-ERBs and RORs control the expression of Bmal1, Clock (NPAS2) and other CCGs via ROR elements (ROREs) (Figure 9). These interlinked positive and negative transcription-translation feedback loops confer daily rhythmicity for homeostasis maintenance (Lowrey and Takahashi, 2011; Shostak, 2017; Shafi and Knudsen, 2019). Abnormal expression of circadian genes in transcription-translation feedback loops impacts several BPs, such as the cell cycle, apoptosis, DNA damage repair and metabolic regulation, thereby affecting tumor development and progression. However, the molecular mechanism of the occurrence and development of LIHC caused by these three rhythm genes remains to be further studied.
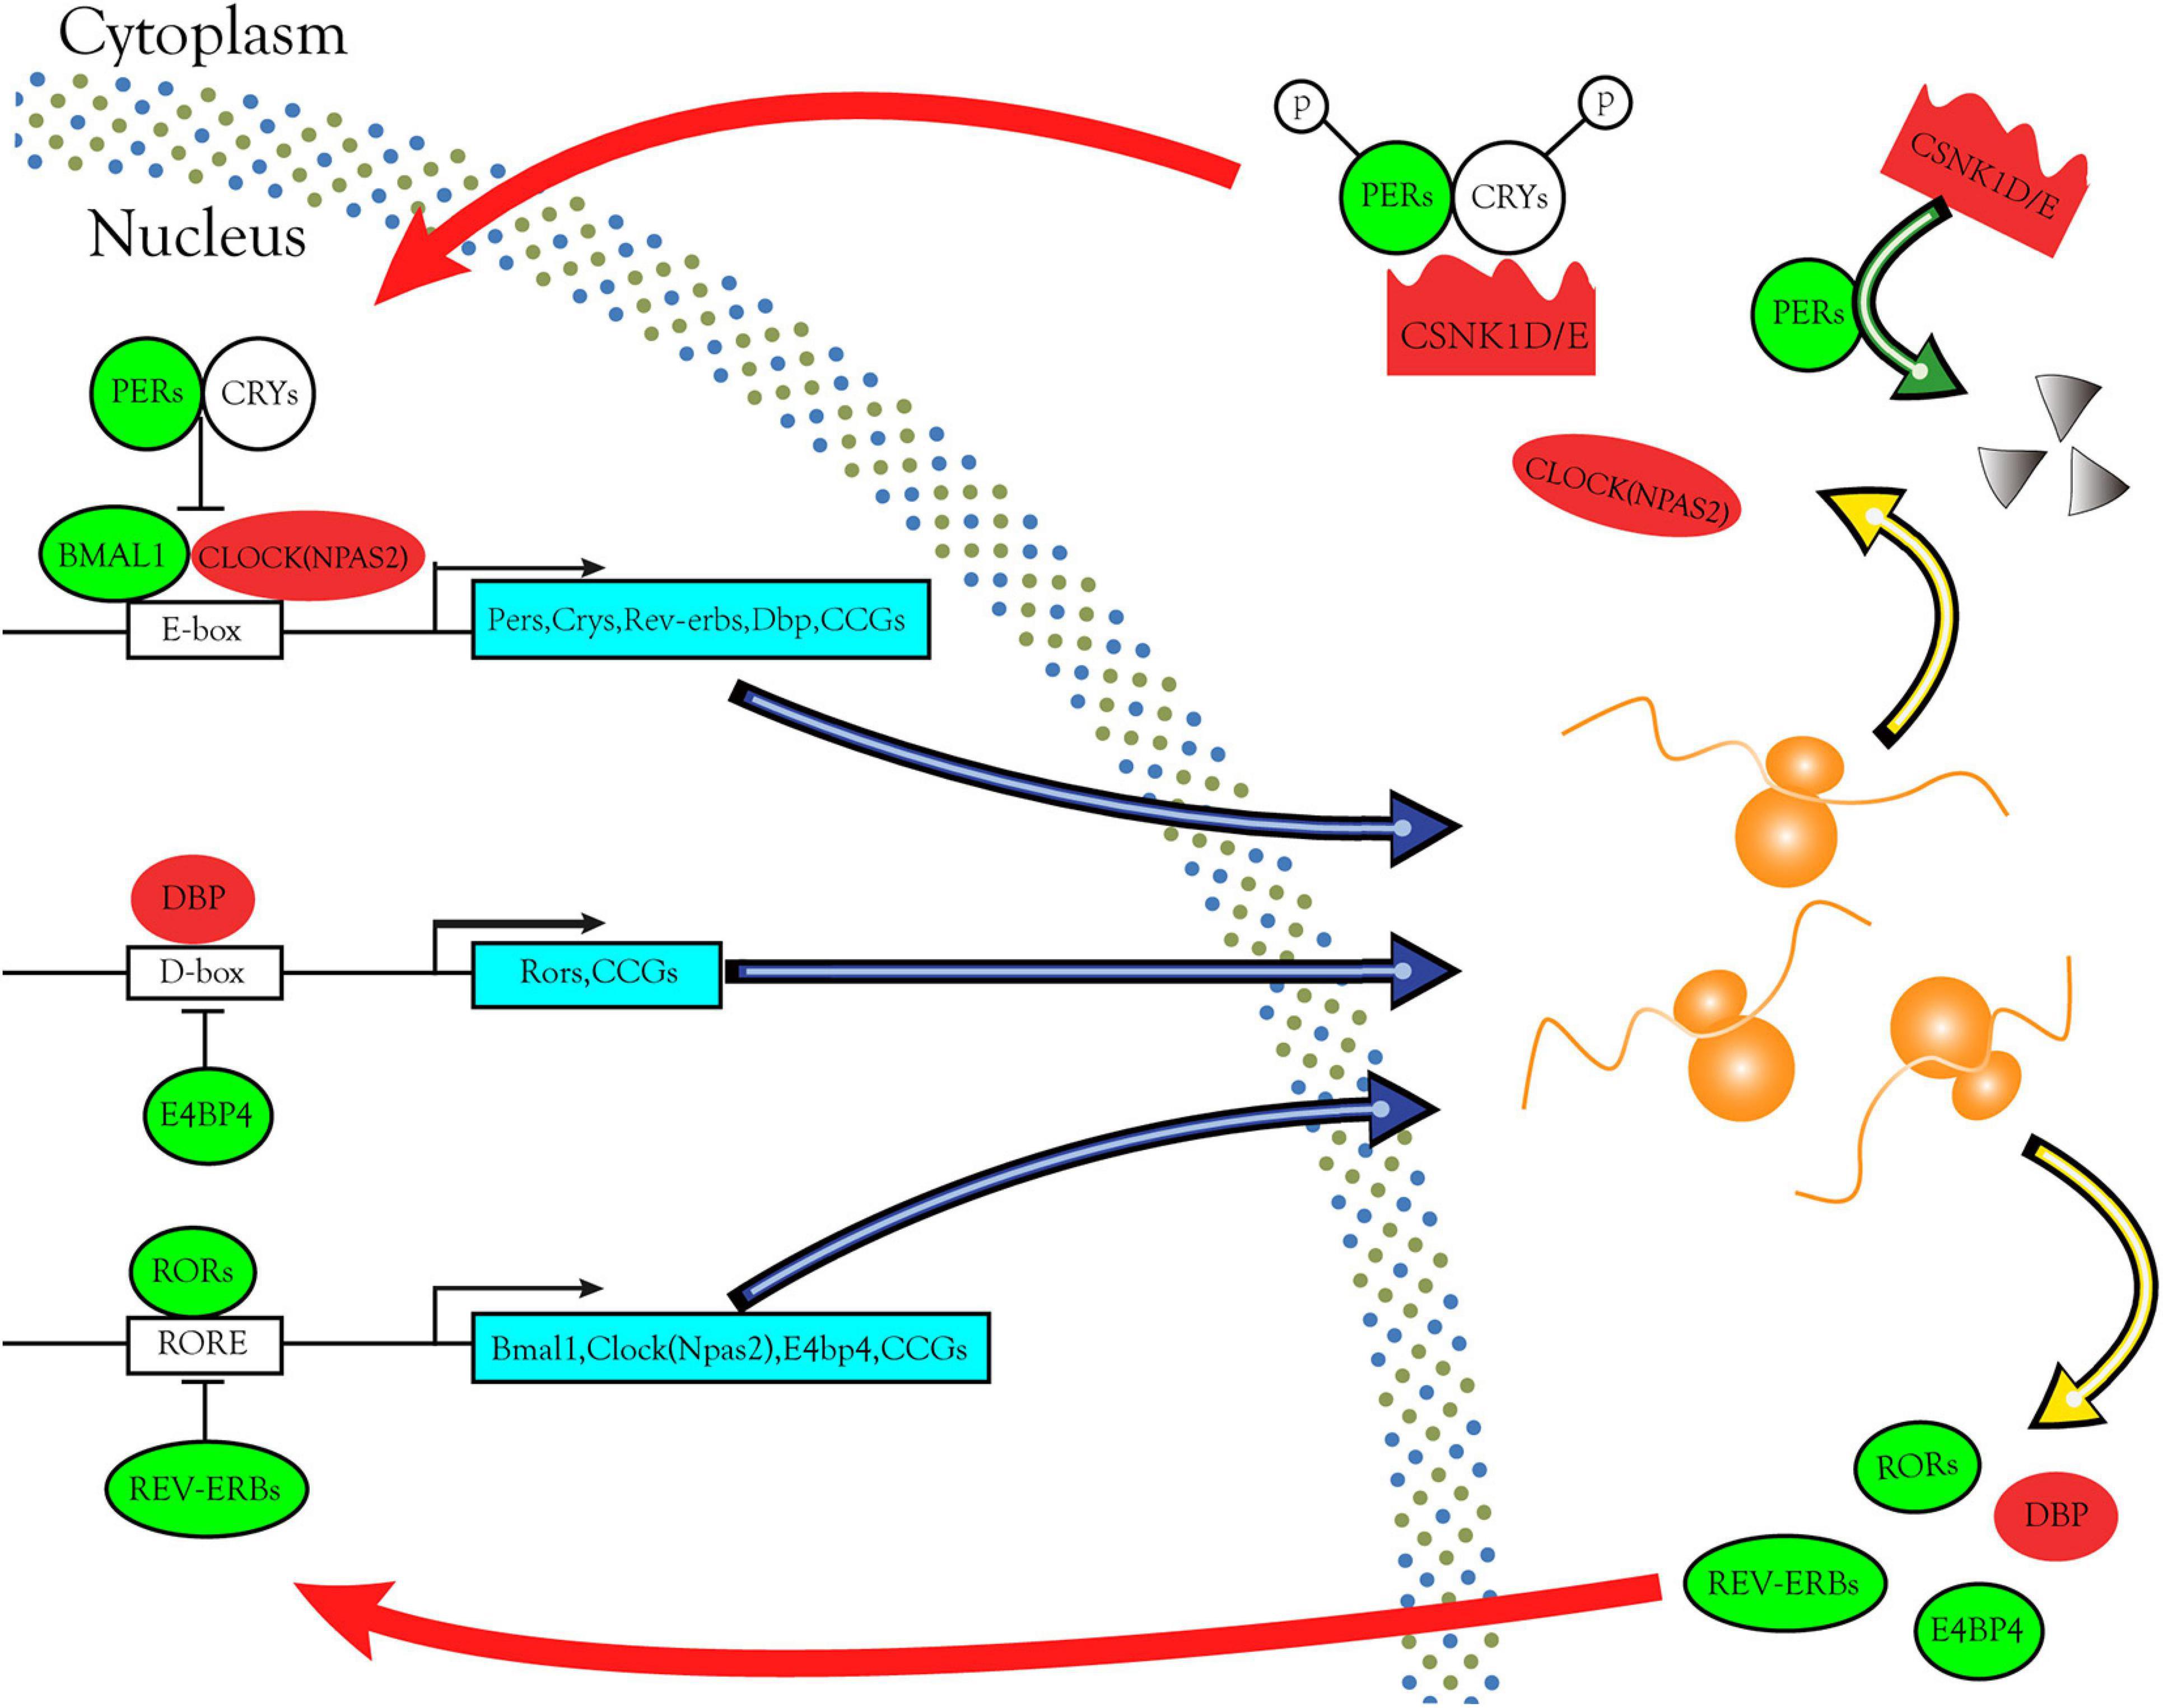
Figure 9. Circadian rhythm pathways enriched in DERGs. The expression levels of DERGs are upregulated and downregulated in LIHC patients, which are indicated in the red and green modules, respectively.
Many anticancer drugs are significantly affected by the time of administration (Smolensky and Peppas, 2007; Lévi et al., 2010; Ye et al., 2018), and their biological behavior, such as absorption, distribution, metabolism, and elimination, follow circadian rhythms. A recent study found that once the drugs are inside the tumor cells, their functions are regulated by the circadian rhythm of the tumor cells, with the result that these anticancer drugs show different anticancer activities and adverse reactions with different times of administration (Lévi et al., 2008; Dulong et al., 2015). Therefore, the identification of these DERGs contributes to be used as diagnostic and prognostic biomarkers and molecular targets for chronotherapy in LIHC patients, which has broad application prospects.
Data Availability Statement
The original contributions presented in the study are included in the article/Supplementary Material, further inquiries can be directed to the corresponding author/s.
Author Contributions
HL performed most of the bioinformatics analyses and experiments. HL, SH, and ZF created the figures and tables. HL and XW wrote the manuscript. YG designed, performed, and supervised the study. SL provided suggestions and guidance of this study, and revised the manuscript. All authors contributed to the article and approved the submitted version.
Funding
This work was supported by the National Natural Science Foundation of China (31800996), Key Projects of University Excellent Young Talents Support Plan (gxyqZD2018061), Key Projects in Natural Science of Bengbu Medical College (BYKY1716), and Research Foundation for Advanced Talents of Bengbu Medical College (15190016).
Conflict of Interest
The authors declare that the research was conducted in the absence of any commercial or financial relationships that could be construed as a potential conflict of interest.
Supplementary Material
The Supplementary Material for this article can be found online at: https://www.frontiersin.org/articles/10.3389/fgene.2021.680528/full#supplementary-material
Supplementary Figure 1 | Relationships between DERG expression levels and survival rate in hepatic carcinoma. (A) PER1, (B) PER2, (C) PER3, (D) ARNTL, (E) NR1D1, (F) PRKAG2, and (G) RORA.
Supplementary Figure 2 | Kaplan–Meier survival curves of three hub genes in hepatic carcinoma patients. (A) CSNK1D, (B) CSNK1K, and (C) NPAS2.
Supplementary Table 1 | The 563 differentially expressed rhythm genes.
Supplementary Table 2 | Information on the 377 clinical samples of LIHC.
Supplementary Table 3 | Gene (CSNK1D, CSNK1E, and NPAS2) expression profiles of 50 pairs of normal and tumor samples from the same patients.
Supplementary Table 4 | Univariate and multivariate analyses of prognostic factors (CSNK1D).
Supplementary Table 5 | Univariate and multivariate analyses of prognostic factors (CSNK1E).
Supplementary Table 6 | Univariate and multivariate analyses of prognostic factors (NPAS2).
Supplementary Table 7 | Raw data from the 235 patient samples of Cox analysis.
Footnotes
References
Bray, F., Ferlay, J., Soerjomataram, I., Siegel, R. L., Torre, L. A., and Jemal, A. (2018). Global cancer statistics 2018: GLOBOCAN estimates of incidence and mortality worldwide for 36 cancers in 185 countries. CA Cancer J. Clin. 68, 394–424. doi: 10.3322/caac.21492
Burgermeister, E., Battaglin, F., Eladly, F., Wu, W., Herweck, F., Schulte, N., et al. (2019). Aryl hydrocarbon receptor nuclear translocator-like (ARNTL/BMAL1) is associated with bevacizumab resistance in colorectal cancer via regulation of vascular endothelial growth factor A. EBioMedicine 45, 139–154. doi: 10.1016/j.ebiom.2019.07.004
Cash, E., Sephton, S. E., Chagpar, A. B., Spiegel, D., Rebholz, W. N., Zimmaro, L. A., et al. (2015). Circadian disruption and biomarkers of tumor progression in breast cancer patients awaiting surgery. Brain Behav. Immun. 48, 102–114. doi: 10.1016/j.bbi.2015.02.017
Dulong, S., Ballesta, A., Okyar, A., and Lévi, F. (2015). Identification of Circadian determinants of cancer chronotherapy through in vitro chronopharmacology and mathematical modeling. Mol. Cancer Ther. 14, 2154–2164. doi: 10.1158/1535-7163.Mct-15-0129
Gamble, K. L., Berry, R., Frank, S. J., and Young, M. E. (2014). Circadian clock control of endocrine factors. Nat. Rev. Endocrinol. 10, 466–475. doi: 10.1038/nrendo.2014.78
Harris, M. A., Clark, J., Ireland, A., Lomax, J., Ashburner, M., Foulger, R., et al. (2004). The Gene Ontology (GO) database and informatics resource. Nucleic Acids Res. 32, D258–D261. doi: 10.1093/nar/gkh036
Hasakova, K., Vician, M., Reis, R., Zeman, M., and Herichova, I. (2018). The expression of clock genes cry1 and cry2 in human colorectal cancer and tumor adjacent tissues correlates differently dependent on tumor location. Neoplasma 65, 986–992. doi: 10.4149/neo_2018_180122N47
Kanehisa, M., Furumichi, M., Sato, Y., Ishiguro-Watanabe, M., and Tanabe, M. (2021). KEGG: integrating viruses and cellular organisms. Nucleic Acids Res. 49, D545–D551. doi: 10.1093/nar/gkaa970
Kiessling, S., Beaulieu-Laroche, L., Blum, I. D., Landgraf, D., Welsh, D. K., Storch, K. F., et al. (2017). Enhancing circadian clock function in cancer cells inhibits tumor growth. BMC Biol. 15:13. doi: 10.1186/s12915-017-0349-7
Kuo, T. T., and Ladurner, A. G. (2019). Exploiting the circadian clock for improved cancer therapy: perspective from a cell biologist. Front. Genet. 10:1210. doi: 10.3389/fgene.2019.01210
Kwon, Y. J., Seo, E. B., Kwon, S. H., Lee, S. H., Kim, S. K., Park, S. K., et al. (2020). Extracellular acidosis promotes metastatic potency via decrease of the BMAL1 circadian clock gene in breast cancer. Cells 9:989. doi: 10.3390/cells9040989
Lévi, F., Altinok, A., Clairambault, J., and Goldbeter, A. (2008). Implications of circadian clocks for the rhythmic delivery of cancer therapeutics. Philos. Trans. A Math. Phys. Eng. Sci. 366, 3575–3598. doi: 10.1098/rsta.2008.0114
Lévi, F., Okyar, A., Dulong, S., Innominato, P. F., and Clairambault, J. (2010). Circadian timing in cancer treatments. Annu. Rev. Pharmacol. Toxicol. 50, 377–421. doi: 10.1146/annurev.pharmtox.48.113006.094626
Li, S., and Zhang, L. (2015). Circadian control of global transcription. Biomed. Res. Int. 2015:187809. doi: 10.1155/2015/187809
Li, S., Shui, K., Zhang, Y., Lv, Y., Deng, W., Ullah, S., et al. (2017). CGDB: a database of circadian genes in eukaryotes. Nucleic Acids Res. 45, D397–D403. doi: 10.1093/nar/gkw1028
Li, X., Shi, L., Zhang, K., Wei, W., Liu, Q., Mao, F., et al. (2018). CirGRDB: a database for the genome-wide deciphering circadian genes and regulators. Nucleic Acids Res. 46, D64–D70. doi: 10.1093/nar/gkx944
Lin, H. H., Qraitem, M., Lian, Y., Taylor, S. R., and Farkas, M. E. (2019). Analyses of BMAL1 and PER2 Oscillations in a model of breast cancer progression reveal changes with malignancy. Integr. Cancer Ther. 18:1534735419836494. doi: 10.1177/1534735419836494
Lowrey, P. L., and Takahashi, J. S. (2011). Genetics of circadian rhythms in Mammalian model organisms. Adv. Genet. 74, 175–230. doi: 10.1016/b978-0-12-387690-4.00006-4
Lurje, I., Czigany, Z., Bednarsch, J., Roderburg, C., Isfort, P., Neumann, U. P., et al. (2019). Treatment strategies for hepatocellular carcinoma ? a multidisciplinary approach. Int. J. Mol. Sci. 20:1465. doi: 10.3390/ijms20061465
Mostafaie, N., Kállay, E., Sauerzapf, E., Bonner, E., Kriwanek, S., Cross, H. S., et al. (2009). Correlated downregulation of estrogen receptor beta and the circadian clock gene Per1 in human colorectal cancer. Mol. Carcinog. 48, 642–647. doi: 10.1002/mc.20510
Ogata, H., Goto, S., Sato, K., Fujibuchi, W., Bono, H., and Kanehisa, M. (1999). KEGG: kyoto encyclopedia of genes and genomes. Nucleic Acids Res. 27, 29–34. doi: 10.1093/nar/27.1.29
Shafi, A. A., and Knudsen, K. E. (2019). Cancer and the circadian clock. Cancer Res. 79, 3806–3814. doi: 10.1158/0008-5472.Can-19-0566
Shostak, A. (2017). Circadian clock, cell division, and cancer: from molecules to organism. Int. J. Mol. Sci. 18:873. doi: 10.3390/ijms18040873
Smolensky, M. H., and Peppas, N. A. (2007). Chronobiology, drug delivery, and chronotherapeutics. Adv. Drug Deliv. Rev. 59, 828–851. doi: 10.1016/j.addr.2007.07.001
Taniguchi, H., Fernández, A. F., Setién, F., Ropero, S., Ballestar, E., Villanueva, A., et al. (2009). Epigenetic inactivation of the circadian clock gene BMAL1 in hematologic malignancies. Cancer Res. 69, 8447–8454. doi: 10.1158/0008-5472.Can-09-0551
Villanueva, A. (2019). Hepatocellular carcinoma. N. Engl. J. Med. 380, 1450–1462. doi: 10.1056/NEJMra1713263
Winter, S. L., Bosnoyan-Collins, L., Pinnaduwage, D., and Andrulis, I. L. (2007). Expression of the circadian clock genes Per1 and Per2 in sporadic and familial breast tumors. Neoplasia 9, 797–800. doi: 10.1593/neo.07595
Xu, W., Rao, Q., An, Y., Li, M., and Zhang, Z. (2018). Identification of biomarkers for barcelona clinic liver cancer staging and overall survival of patients with hepatocellular carcinoma. PLoS One 13:e0202763. doi: 10.1371/journal.pone.0202763
Yang, J. D., and Roberts, L. R. (2010). Hepatocellular carcinoma: a global view. Nat. Rev. Gastroenterol. Hepatol. 7, 448–458. doi: 10.1038/nrgastro.2010.100
Yang, J. D., Hainaut, P., Gores, G. J., Amadou, A., Plymoth, A., and Roberts, L. R. (2019). A global view of hepatocellular carcinoma: trends, risk, prevention and management. Nat. Rev. Gastroenterol. Hepatol. 16, 589–604. doi: 10.1038/s41575-019-0186-y
Ye, Y., Xiang, Y., Ozguc, F. M., Kim, Y., Liu, C. J., Park, P. K., et al. (2018). The genomic landscape and pharmacogenomic interactions of clock genes in cancer chronotherapy. Cell Syst. 6, 314–328.e2. doi: 10.1016/j.cels.2018.01.013
Keywords: circadian rhythm, liver hepatocellular carcinoma, bioinformatics analysis, differentially expressed rhythm genes, chronotherapy
Citation: Liu H, Gao Y, Hu S, Fan Z, Wang X and Li S (2021) Bioinformatics Analysis of Differentially Expressed Rhythm Genes in Liver Hepatocellular Carcinoma. Front. Genet. 12:680528. doi: 10.3389/fgene.2021.680528
Received: 14 March 2021; Accepted: 11 May 2021;
Published: 03 June 2021.
Edited by:
Luoying Zhang, Huazhong University of Science and Technology, ChinaReviewed by:
Qingming Tang, Huazhong University of Science and Technology, ChinaHuajing Teng, Beijing Institutes of Life Science (CAS), China
Copyright © 2021 Liu, Gao, Hu, Fan, Wang and Li. This is an open-access article distributed under the terms of the Creative Commons Attribution License (CC BY). The use, distribution or reproduction in other forums is permitted, provided the original author(s) and the copyright owner(s) are credited and that the original publication in this journal is cited, in accordance with accepted academic practice. No use, distribution or reproduction is permitted which does not comply with these terms.
*Correspondence: Shujing Li, bGlzaHVqaW5nQGJibWMuZWR1LmNu
†These authors have contributed equally to this work and share first authorship