
94% of researchers rate our articles as excellent or good
Learn more about the work of our research integrity team to safeguard the quality of each article we publish.
Find out more
ORIGINAL RESEARCH article
Front. Genet. , 14 December 2020
Sec. Genomics of Plants and the Phytoecosystem
Volume 11 - 2020 | https://doi.org/10.3389/fgene.2020.609668
 Afsheen Malik1
 Alvina Gul1*
 Rabia Amir1
 Faiza Munir1
 Mustafeez Mujtaba Babar2
 Syeda Marriam Bakhtiar3
 Muhammad Qasim Hayat1
 Rehan Zafar Paracha4
 Zoya Khalid5
 Hadi Alipour6*
In plants, F-box proteins (FBPs) constitute one of the largest superfamilies of regulatory proteins. Most F-box proteins are shown to be an integral part of SCF complexes, which carry out the degradation of proteins and regulate diverse important biological processes. Anthers and pollen development have a huge importance in crop breeding. Despite the vast diversity of FBPs in Arabidopsis male reproductive organs, their role in anther and pollen development is not much explored. Moreover, a standard nomenclature for naming FBPs is also lacking. Here, we propose a standard nomenclature for naming the FBPs of Arabidopsis thaliana uniformly and carry out a systematic analysis of sperm cell-specific FBP gene, i.e., 3p.AtFBP113 due to its reported high and preferential expression, for detailed functional annotation. The results revealed that 3p.AtFBP113 is located on the small arm of chromosome and encodes 397 amino acid long soluble, stable, and hydrophilic protein with the possibility of localization in various cellular compartments. The presence of the C-terminal F-box associated domain (FBA) with immunoglobulin-like fold anticipated its role in protein binding. Gene ontology based functional annotation and tissue-specific gene co-expression analysis further strengthened its role in protein binding and ubiquitination. Moreover, various potential post/co-translational modifications were anticipated and the predicted tertiary structure also showed the presence of characteristic domains and fold. Thus, the outcomes of the study will be useful in developing a better understating of the function of 3p.AtFBP113 during the process of pollen development, which will be helpful for targeting the gene for manipulation of male fertility that has immense importance in hybrid breeding.
In plants, F-box proteins (FBPs) constitute one of the largest superfamilies of regulatory proteins, which control diverse biological processes from growth to development (Gagne et al., 2002; Xu et al., 2009; Abd-Hamid et al., 2020). The FBPs are more diverse in plant species as compared to other kingdoms of life and the number of genes present in their genomes reflects this diversification. For instance, in plants, Arabidopsis, Medicago, rice, maize, soybean and chickpea genomes contain 694, 972, 678, 359, 509 and 285 FBP genes, respectively (Xiao and Jang, 2000; Jain et al., 2007; Jia et al., 2013, 2017; Gupta et al., 2015; Song et al., 2015). In comparison, human, fruit fly, and Caenorhabditis elegans genomes contain only 38, 23 and 326 FBP genes, respectively, where C. elegans is the only one among all animal species whose genome contains the largest number of FBP genes (Kipreos and Pagano, 2000). Despite the presence of numerous FBP genes in the plants, a precise and standard nomenclature for naming them is lacking and the current classification system is either adopted from non-plant organisms based on C-terminal domain diversification or is based on the mutant phenotype (Kuroda et al., 2002; Abd-Hamid et al., 2020). F-box proteins are usually characterized by the presence of 50-60 amino acid long, conserved F-box motif present at their N-terminal regions (Kipreos and Pagano, 2000) and, hence, named as F-box proteins after its first discovery in a human protein Cyclin F (Bai et al., 1996). On the other hand, C terminal regions of FBPs contain protein-protein interaction domains that are mostly of diverse types and classify FBPs into different subfamilies (Bai et al., 1996; Gagne et al., 2002). Some of the commonly known subfamilies in plants are leucine-rich repeats (LRRs), Kelch repeats, WD-40, TUB, actin, F-box associated (FAB), Armadillo (Am), tetratricopeptide repeats (TPRs), Jumonji (JmjC), and DEAD-like helicase (de Pozo and Estelle, 2000; Kipreos and Pagano, 2000; Gagne et al., 2002; Xu et al., 2009).
In plants, most F-box proteins are shown to be an integral part of SCF (Skp1-Cul-FBP) complexes. Among several ubiquitin-protein ligase (E3) families, SCF complex is the most dominant type of E3 ubiquitin ligases in plants that consists of four components namely S-phase kinase-associated protein 1 (Skp1), Cullin (Cul), RING-box protein 1 (Rbx1), and F-box protein (FBP). In SCF complex, the Cul acts as a core scaffolding region, the Rbx1 provides docking site to the ubiquitin-conjugation enzyme (E2) that takes activated ubiquitin molecules from ubiquitin-activating ligase enzyme (E1), Skp1 functions as a bridge and connects the FBP to Cul. The FBP imparts specificity due to its modular C-terminal protein-protein interaction domain and selectively recruits protein substrates for degradation through ubiquitin/26S proteasome pathway (UPP) in a process known as proteolysis (Figure 1; Gagne et al., 2002; Zheng et al., 2002; Cardozo and Pagano, 2004; Sadanandom et al., 2012; Sharma et al., 2016). Proteolysis or protein degradation by UPP is an important regulatory mechanism by which cells regulate their homeostasis by selectively degrading the marked proteins and hence ensure the proper functioning and adaptation of organisms in the prevailing environment (Sadanandom et al., 2012; Sharma et al., 2016). Recently, the role of UPP in anther development in Arabidopsis has been reported, where two F-box proteins namely reduced male fertility (RMF) and Secondary wall thickening-Associated F-box 1 (SAF1) as a part of SCF complex regulate anther dehiscence, pollen maturation and tapetum degeneration, respectively (Kim et al., 2010, 2012).
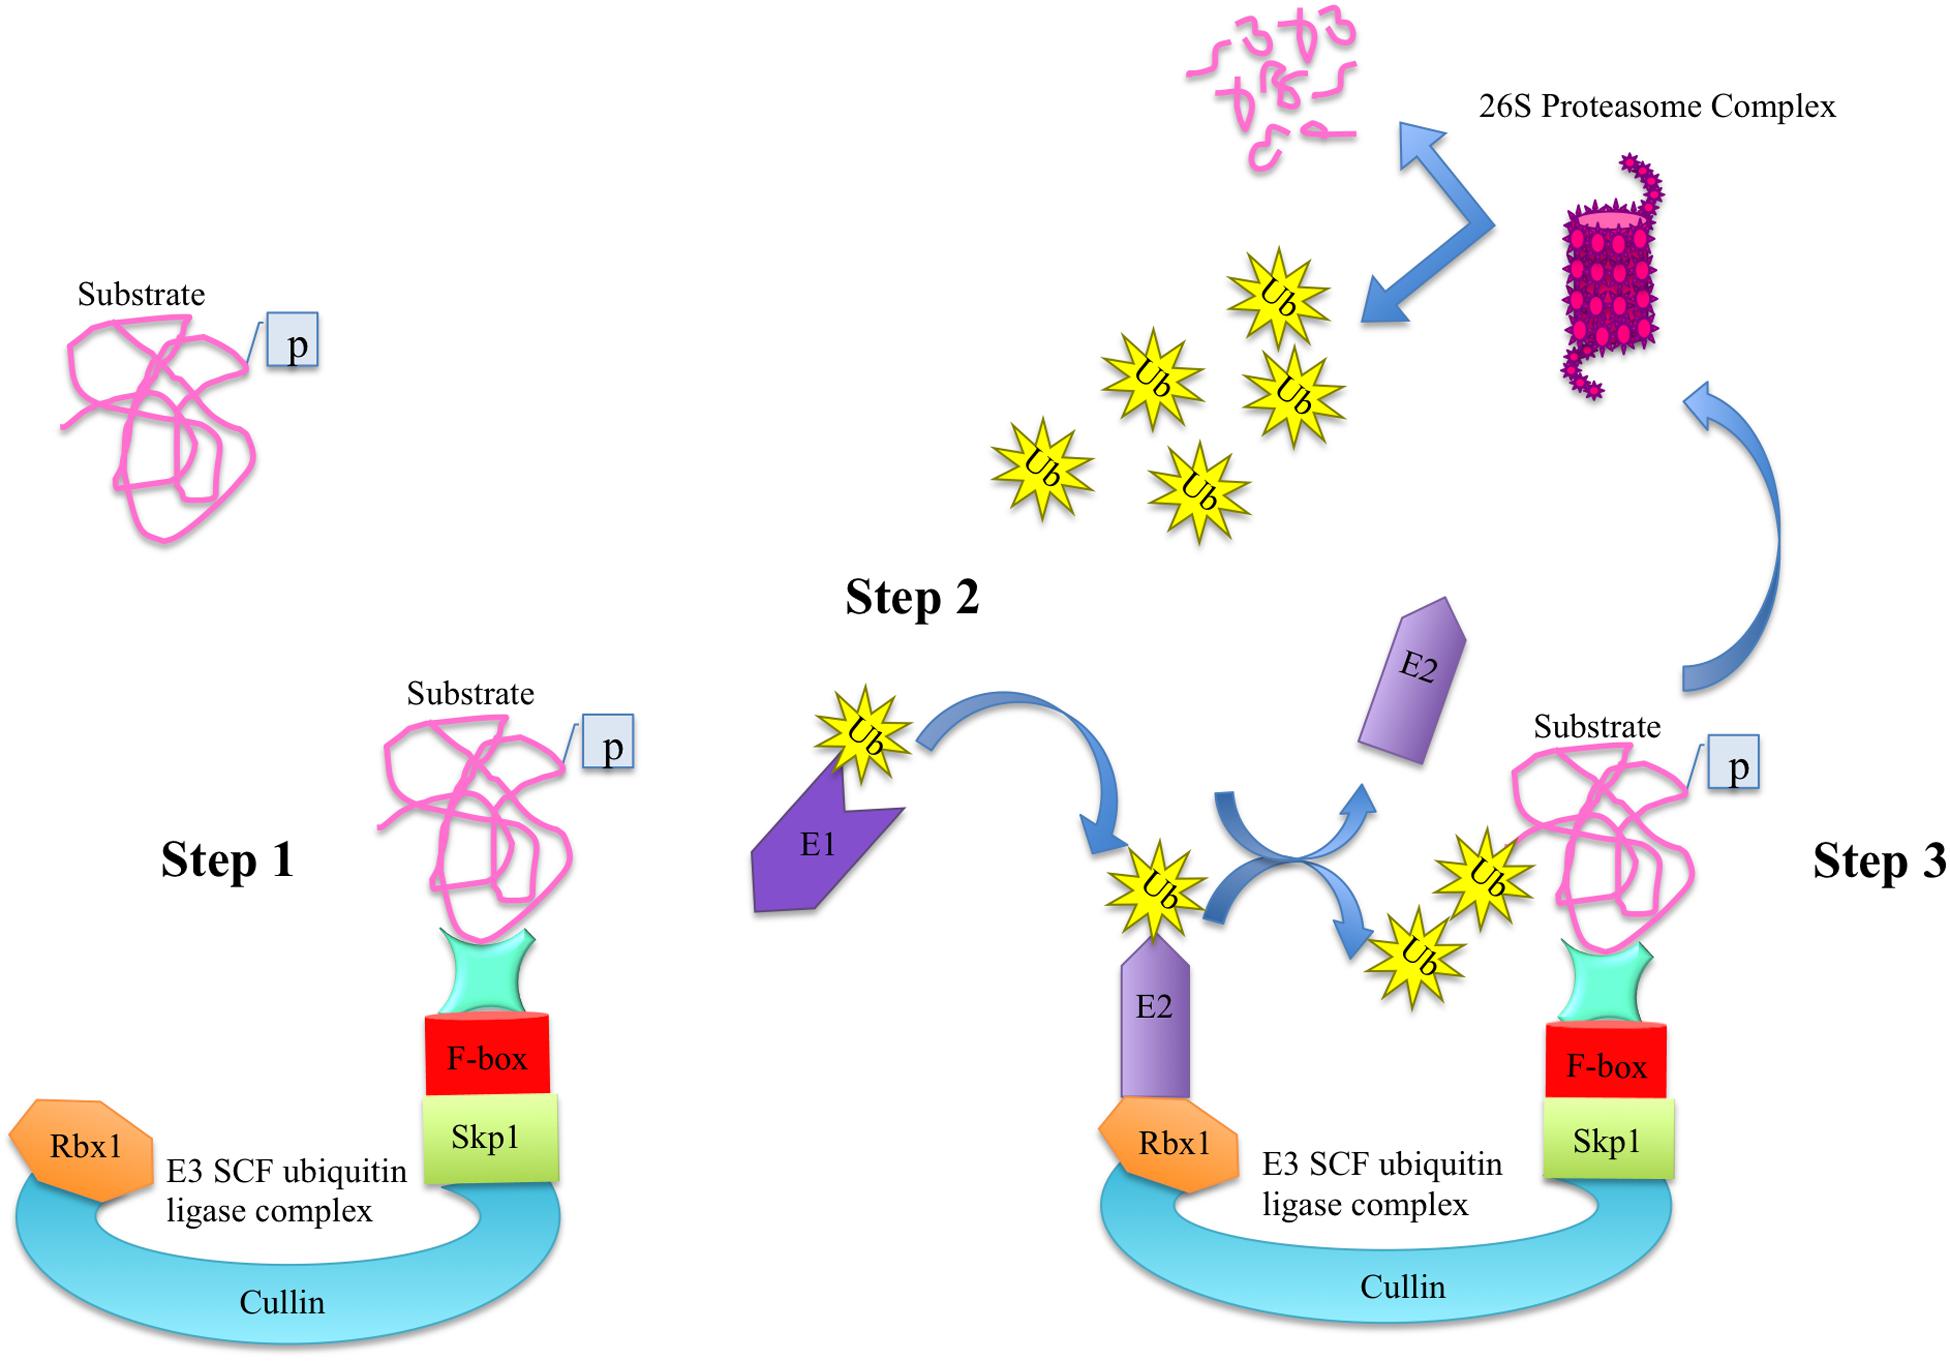
Figure 1. The ubiquitin-dependent protein degradation pathway. The degradation of substrate proteins via ubiquitin-dependent proteasome degradation pathway consists of three main steps. In step 1, the phosphorylated substrate is attached to the C-terminal domain of F-box protein of E3 ligase complex. In step 2, the ubiquitin-activating ligase enzyme E1 activates the ubiquitin molecules and transfers them to E2 conjugating enzyme, which is attached to Rbx1 of E3 ligase. Upon conjugation, the E3 ligase transfers the ubiquitin molecules to the substrate in step 3 and is free to enter in the second round of conjugation. Once a protein is marked with ubiquitin moieties, it is degraded into its constitute molecules via proteasome complex.
In seed plants, pollen grains or male gametophytes containing gametes, i.e., sperm cells develop in anthers, the male reproductive organs, during the process of male gametogenesis. The anther and pollen development and timely release of pollen grains have significant importance in crop breeding where manipulation in male fertility has been used for the generation of hybrids. However, manipulating male fertility requires a profound understanding of intricate gene networks and the underlying mechanisms essential for anther and pollen normal development (Gómze et al., 2015). Various transcriptomics studies have revealed the identification of a diverse number of genes expressed during anther and different developmental stages of pollen grains in model plant Arabidopsis thaliana. However, the role of only few FBP genes has been deciphered so far (Honys and Twell, 2004; Alves-Ferreira et al., 2007; Kim et al., 2008; Gusti et al., 2009; Xu et al., 2010; Pearce et al., 2015). Similarly, the analysis of sperm cell-specific transcriptome has revealed the amelioration and diversity of FBP genes in them indicating that FBPs might be playing some important role there (Borges et al., 2008). However, despite having a large number of FBPs in sperm cells their biological roles are largely obscured and unexplored. In this regard, functional annotation can provide a rapid and simple means for deciphering their potential role during anther and pollen development.
In the current study, keeping in view the need for a proper nomenclature for plant FBP genes, we propose a standard nomenclature for naming the FBP family members of Arabidopsis thaliana. Moreover, due to exhibiting high and preferential expression in pollen sperm cells as indicated by microarray and RT-PCR data (Borges et al., 2008) and as shown by Plant eFP viewer1 (Figure 2), we carry out systematic analysis and characterization of 3p.AtFBP113 in detail. Using various computational approaches, cellular localization, physicochemical properties, domains and fold architectures, protein interaction and gene co-expression networks, post-translational modifications, secondary and tertiary structures of sperm cell-specific FBP gene 3p.AtFBP113 were determined for developing a better understating of its probable function and role during male gametogenesis and pollen development.
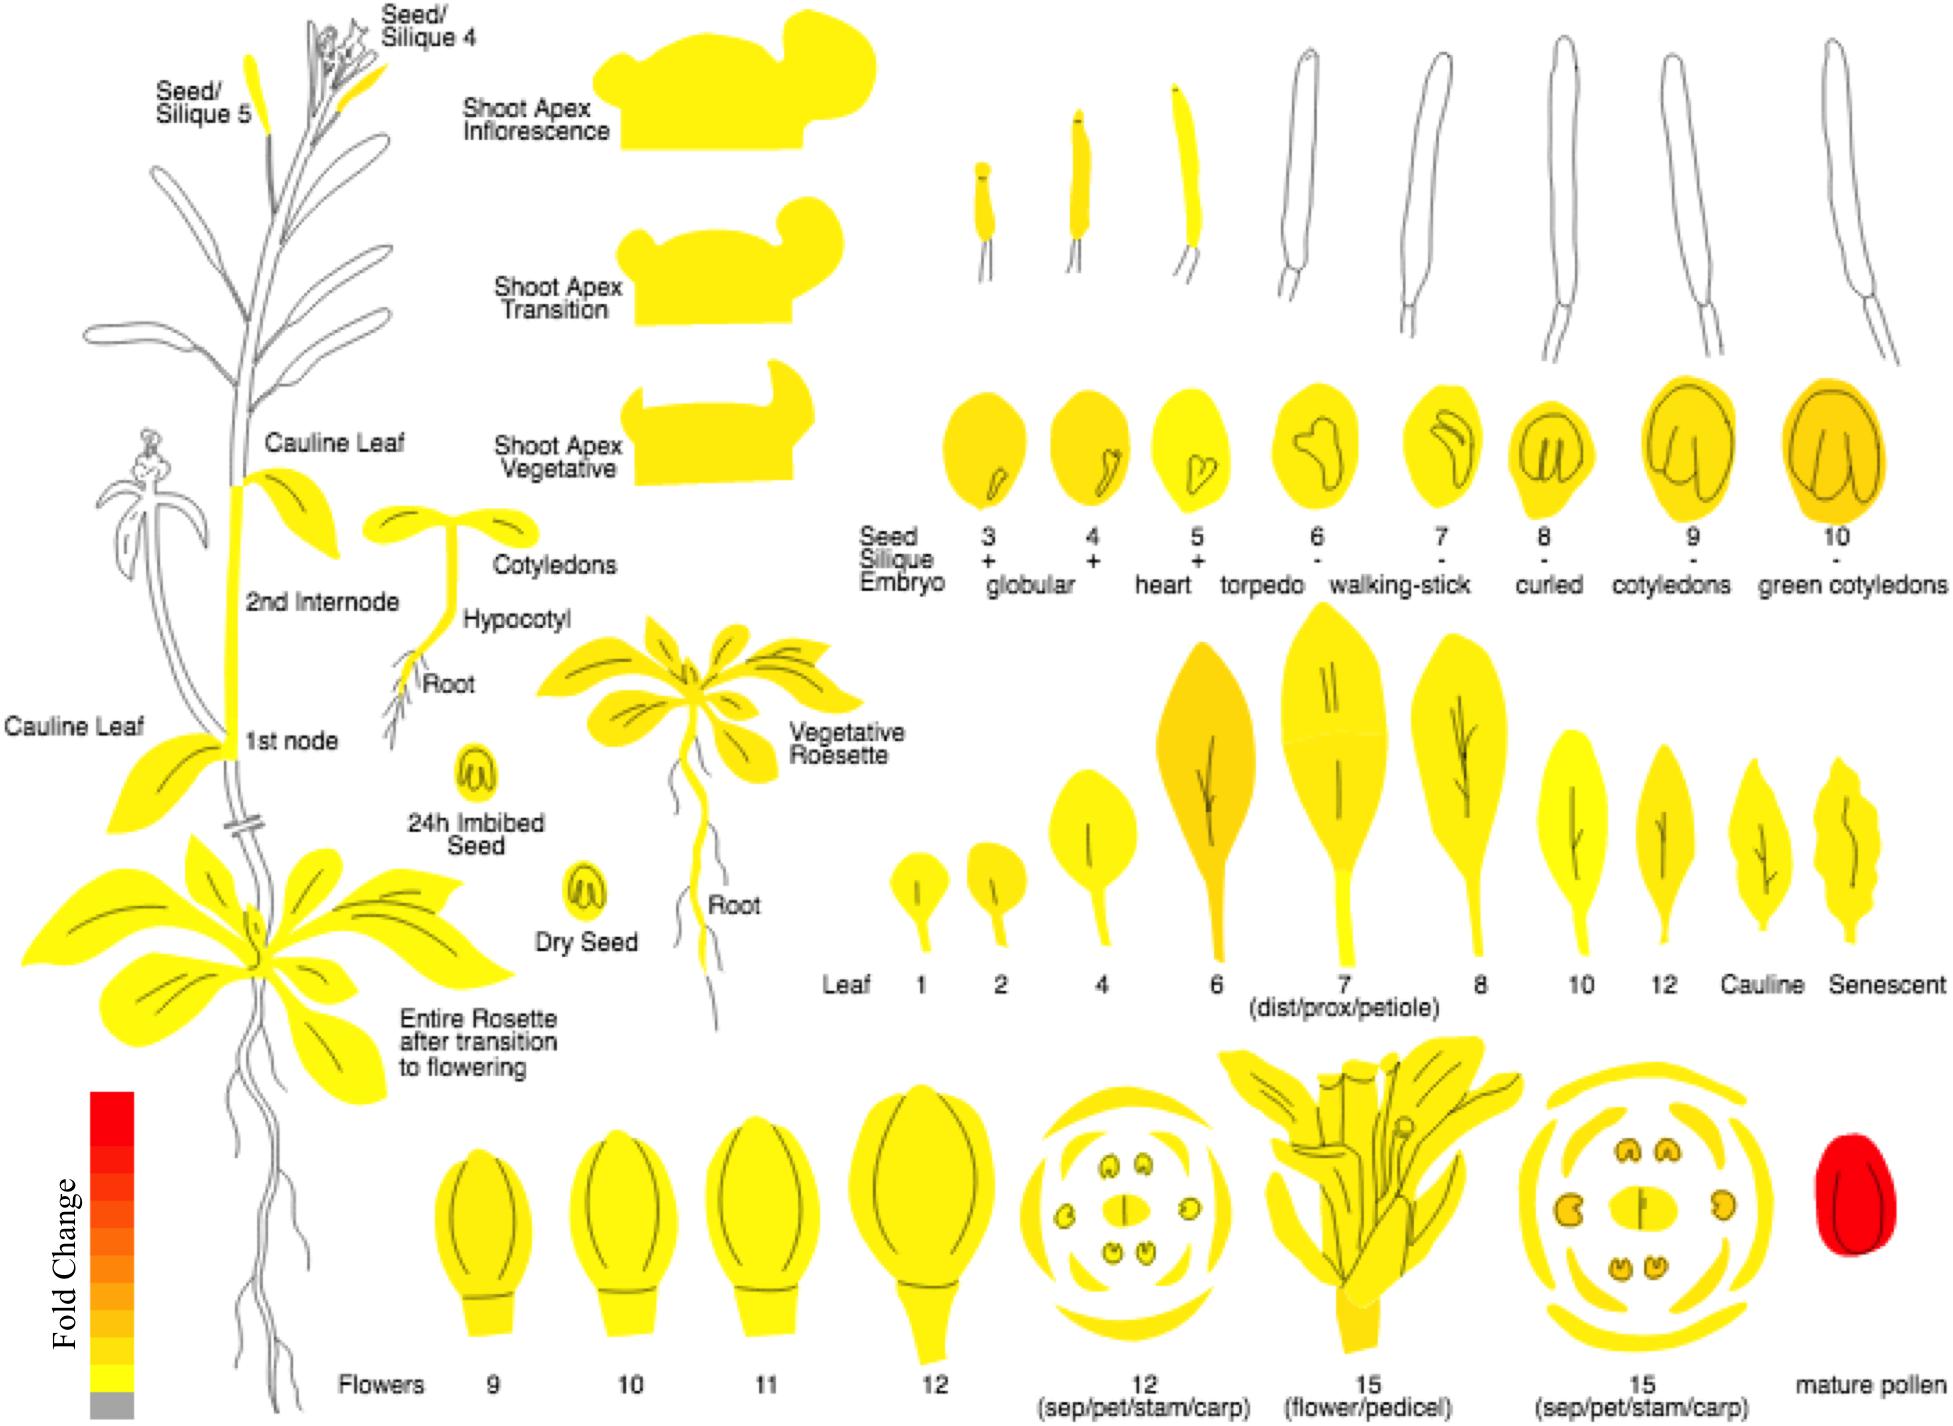
Figure 2. The expression atlas of 3p.AtFBP113. The pictograph demonstrates the expression pattern of 3p.AtFBP113 across the entire plant. The 3p.AtFBP113 exhibits high and preferential expression in mature pollen. The color legend shows the expression levels in the form of fold change, where red color shows maximum and yellow color represents minimum change.
The huge diversity of FBPs in plants and their classification based on the presence of diverse C-terminal domains into different subfamilies or naming after their mutant phenotypes (Abd-Hamid et al., 2020) urge for an accurate and standardized system for naming the FBP genes. For this purpose, we propose a standard nomenclature for naming the Arabidopsis FBP genes uniformly irrespective of their C-terminal domains and mutant phenotypes. It consists of chromosome number and the arm where the gene is residing followed by the name of the plant, FBP as root name, and the serial number of the gene present on the chromosome in question according to the GenBank database2 (Malik, 2011). However, in case, where the same locus produces different transcripts as a result of alternative splicing the lower-case letters after gene name will distinguish among them and as a general rule, the proteins will take the name of their corresponding genes. The chromosomal localization of FBP genes was determined with the help of ePlant chromosome viewer available at BAR tools3 while the orientation of 3p.AtFBP113 was determined using the GenBank database available at (see text footnote 2), respectively, by using gene identifier At3g49450. The eplant tool provides a user-friendly uniform interface for visualization of data by connecting to various web services available publically (Waese et al., 2017). The genomic distribution of FBP genes was carried out using Ensembl Plants4.
The protein sequence of 3p.AtFBP113 in FASTA format was retrieved from the UniProt database5 using accession number Q9SCL2 for detailed analysis using computational tools. Eukaryotic cells have distinct subcellular compartments, and proteins function optimal in its subcellular localization. Therefore, the correct sorting of proteins to their final destination is imperative for performing functions (Dönnes and Höglund, 2016). Different prediction tools like DeepLoc-1.06, CELLO7, SUBA8, SingalP9, TargetP 2.010 and cNLS Mapper11 were used for determining the subcellular localization of 3p.AtFBP113. DeepLoc 1.0 server is an algorithm, which uses sequence information of proteins and predicts their subcellular localization using deep neural networks (Armenteros et al., 2017). CELLO uses a support vector machine (SVM) system operating at two levels (Yu et al., 2006). SUBA is a comprehensive database of published and extensive subcellular proteomics datasets, which are manually curated (Hooper et al., 2017). SignalP 5.0 server works by employing deep neural network method for predicting signal peptides and the potential residues in the protein sequences where cleavage occurs (Armenteros et al., 2019a). TargetP 2.0 server predicts transit peptides like N-terminal signal peptide, thylakoid and mitochondrial transit peptides using deep neural networks based approaches (Armenteros et al., 2019b). The cNLS Mapper predicts the nuclear localization signals in protein sequence by combining the amino acids activity profile with an additive motif scoring algorithm (Kosugi et al., 2009). Moreover, the susceptibility of 3p.AtFBP113 for being transmembrane (TM) protein was determined using online available tools like TMHMM server v. 2.012 HMMTOP13 and Protter14. TMHMM is an online tool, which predicts the presence of TM helices using a hidden Markov model (HMM) (Krogh et al., 2001). HMMTOP predicts transmembrane helices and protein topology based on the differences in amino acid composition across the protein sequence using the hidden Markov model (Tusnády and Simon, 2001). The visual presentation of 3p.AtFBP113 protein topology was obtained using Protter (see text footnote 14). Protter is a web-based application for protein topology visualization by the integration of annotated and predicted protein sequences with experimental data (Omasits et al., 2014).
Several physicochemical properties of 3p.AtFBP113 protein like molecular weight, isoelectric point (pI), the total number of residues bearing positive charges and negative charges, instability index, aliphatic index, and grand average of hydropathicity (GRAVY) were theoretically determined with the ProtParam tool available at ExPASy15.
In order to predict conserved domain, motifs and family of 3p.AtFBP113 protein, a number of resources were utilized. They included Conserved Domain Database (CDD)16, InterProScan17, Conserved Domain Architecture Retrieval Tool (CDART)18, Simple Modular Architecture Research Tool (SMART)19, ScanProsite20, Pfam21, and SUPERFAMILY22. CDD is a resource of physically curated protein domain models, which uses 3-dimensional structure information for describing sequence-structure-function relationships (Marchler-Bauer et al., 2011). InterProScan tool allows the scanning of sequences against the InterPro signatures collected from different databases (Jones et al., 2014). CDART searches protein similarities against NCBI Entrez Protein Database using profiles of protein domains and scores them based on the domain architecture (Geer et al., 2002). SMART is a resource of manually curated protein domain models, which identifies, annotates and explores the architecture of protein domains (Letunic et al., 2015). ScanProsite is a database that contains PROSITE patterns and profiles for detection of signature motifs and protein domains on the basis of which it classifies given protein sequences into families and identifies its function (de Castro et al., 2006). Pfam database contains a great collection of protein families, their annotation and multiple sequence alignment based on hidden Markov models (HMM) (El-Gebali et al., 2019). SUPERFAMILY is a database of the Hidden Markov Model (HMM) library, which annotates proteins structurally and functionally and it classifies protein structure domains at superfamily level using Structural Classification of Protein (SCOP) database (Oates et al., 2015).
Motifs are short patterns of sequences that usually impart significant structural or functional characteristic to proteins and are usually conserved in protein families or subfamilies (Mohamed et al., 2016). MotifFinder23 was used to detect the motifs present in 3p.AtFBP113 sequence. Folds are the general architecture of proteins and are detected using the PFP-FunDSeqE predictor web server24. The PFP-FunDSeqE web server predicts the folds in protein sequences by coupling information of the functional domain and sequential evolution (Shen and Chou, 2009).
The N-, O- and C-linked glycosylation in 3p.AtFBP113 protein sequence was predicted using GlycoEP25 tool with 0 threshold values. This tool uses SVM models, which were developed using non-redundant datasets of glycosite patterns for the prediction of N-, O-, and C-linked glycosites with high accuracy (Chauhan et al., 2013). NetAcet 1.0 server26 and NetPhos 3.1 server27 were used for prediction of potential N-acetylation and phosphorylation sites, respectively. NetAcet server makes predictions using neural network method (Kiemer et al., 2005), while the NetPhos server predicts phosphorylation at serine, threonine and tyrosine using an artificial neural network method (Blom et al., 1999).
Gene ontology (GO) is a well-known tool for annotating and describing the functional attributes of genes, the biological processes in which they are involved and the cellular components they are residing in Butte and Chen (2013). The functional characterization of 3p.AtFBP113 was carried out using the ARGOT 2.5 web server28. ARGOT2.5 web server infers the sequence function by integrating the GO terms clustering with the weighting scheme (Fontana et al., 2009).
In the cellular environment, a protein usually interacts with many other proteins for the execution of its function, therefore, the prediction of protein functional network is important to gain insight into its function (Szklarczyk et al., 2019). STRING database29 with a score cut-off value of 0.400 was used for predicting interacting partners of 3p.AtFBP113 protein to infer about its probable functions.
The Expression Angler BAR tool (see text footnote 3) was used for analyzing, exploring, interpreting, and visualizing the microarray or RNA-seq data to comprehend the probable function of 3p.AtFBP113. The Expression Angler BAR tool identifies genes, which co-express or exhibit comparable expression patterns by calculating the correlation coefficient for expression patterns of all expression vectors of genes to the expression pattern of gene of interest (Austin et al., 2016). In Expression Angler, the microgametogenesis developmental phase was selected and searched for genes exhibiting expression patterns similar to 3p.AtFBP113 during the process. Their expression levels were obtained using the default parameter.
The PSIPRED web tool30 was used for the prediction of the secondary structure of 3p.AtFBP113. PSIPRED is Position Specific Iterated-Blast based secondary structure prediction tool. It uses two feed-forward neural networks on PSI-Blast alignment output for prediction of secondary structures like alpha helixes, Beta pleated sheets and coils from the primary sequence of the protein (McGuffin et al., 2000).
For determining the 3-dimensional (3D) structure of 3p.AtFBP113, first protein BLAST was used for finding suitable homologous protein structure (with similarity > 30%) as a template in protein data bank library (PDB)31. Since the search did not yield any suitable template, so I-TASSER32 and Robetta33 servers were used for the prediction of 3p.AtFBP113 structure and function. I-TASSER server implements TASSER algorithms iteratively for the automated prediction of structure and function of target proteins using their amino acid sequences (Zhang, 2008). Robetta server analyzes the sequence and divides them into presumed domains and if the template is found comparative modeling is initiated otherwise the structure is build ab initio (Kim et al., 2004). Both servers return models with confidence scores. For I-TASSER generated model the C-score is from -5, 2 and for Robetta it ranges from 0 to 1, where the more positive value indicates a high reliability of models. The selected models were refined with the help of YASARA (Yet Another Scientific Artificial Reality Application) energy minimization server34. YASARA minimizes the energy by employing the YASARA force field (Krieger et al., 2009) and returns the output with energy and Z scores. The lower energy and higher Z score validate the structures. The 3D models were validated using ProSA, a web-based tool, which produces a Z score. The negative Z score describes that the overall quality of the model is good (Wiederstein and Sippl, 2007). The stereochemical qualities of the models were analyzed using the PDBsum module PROCHECK (Laskowski et al., 1993) and ERRAT module of SAVES v5.0 tool (Colovos and Yeates, 1993). Finally, the models were visualized using open source software PyMol (DeLano, 2002). The comprehensive flowchart describing the functional annotation of 3p.AtFBP113 is shown in Figure 3.
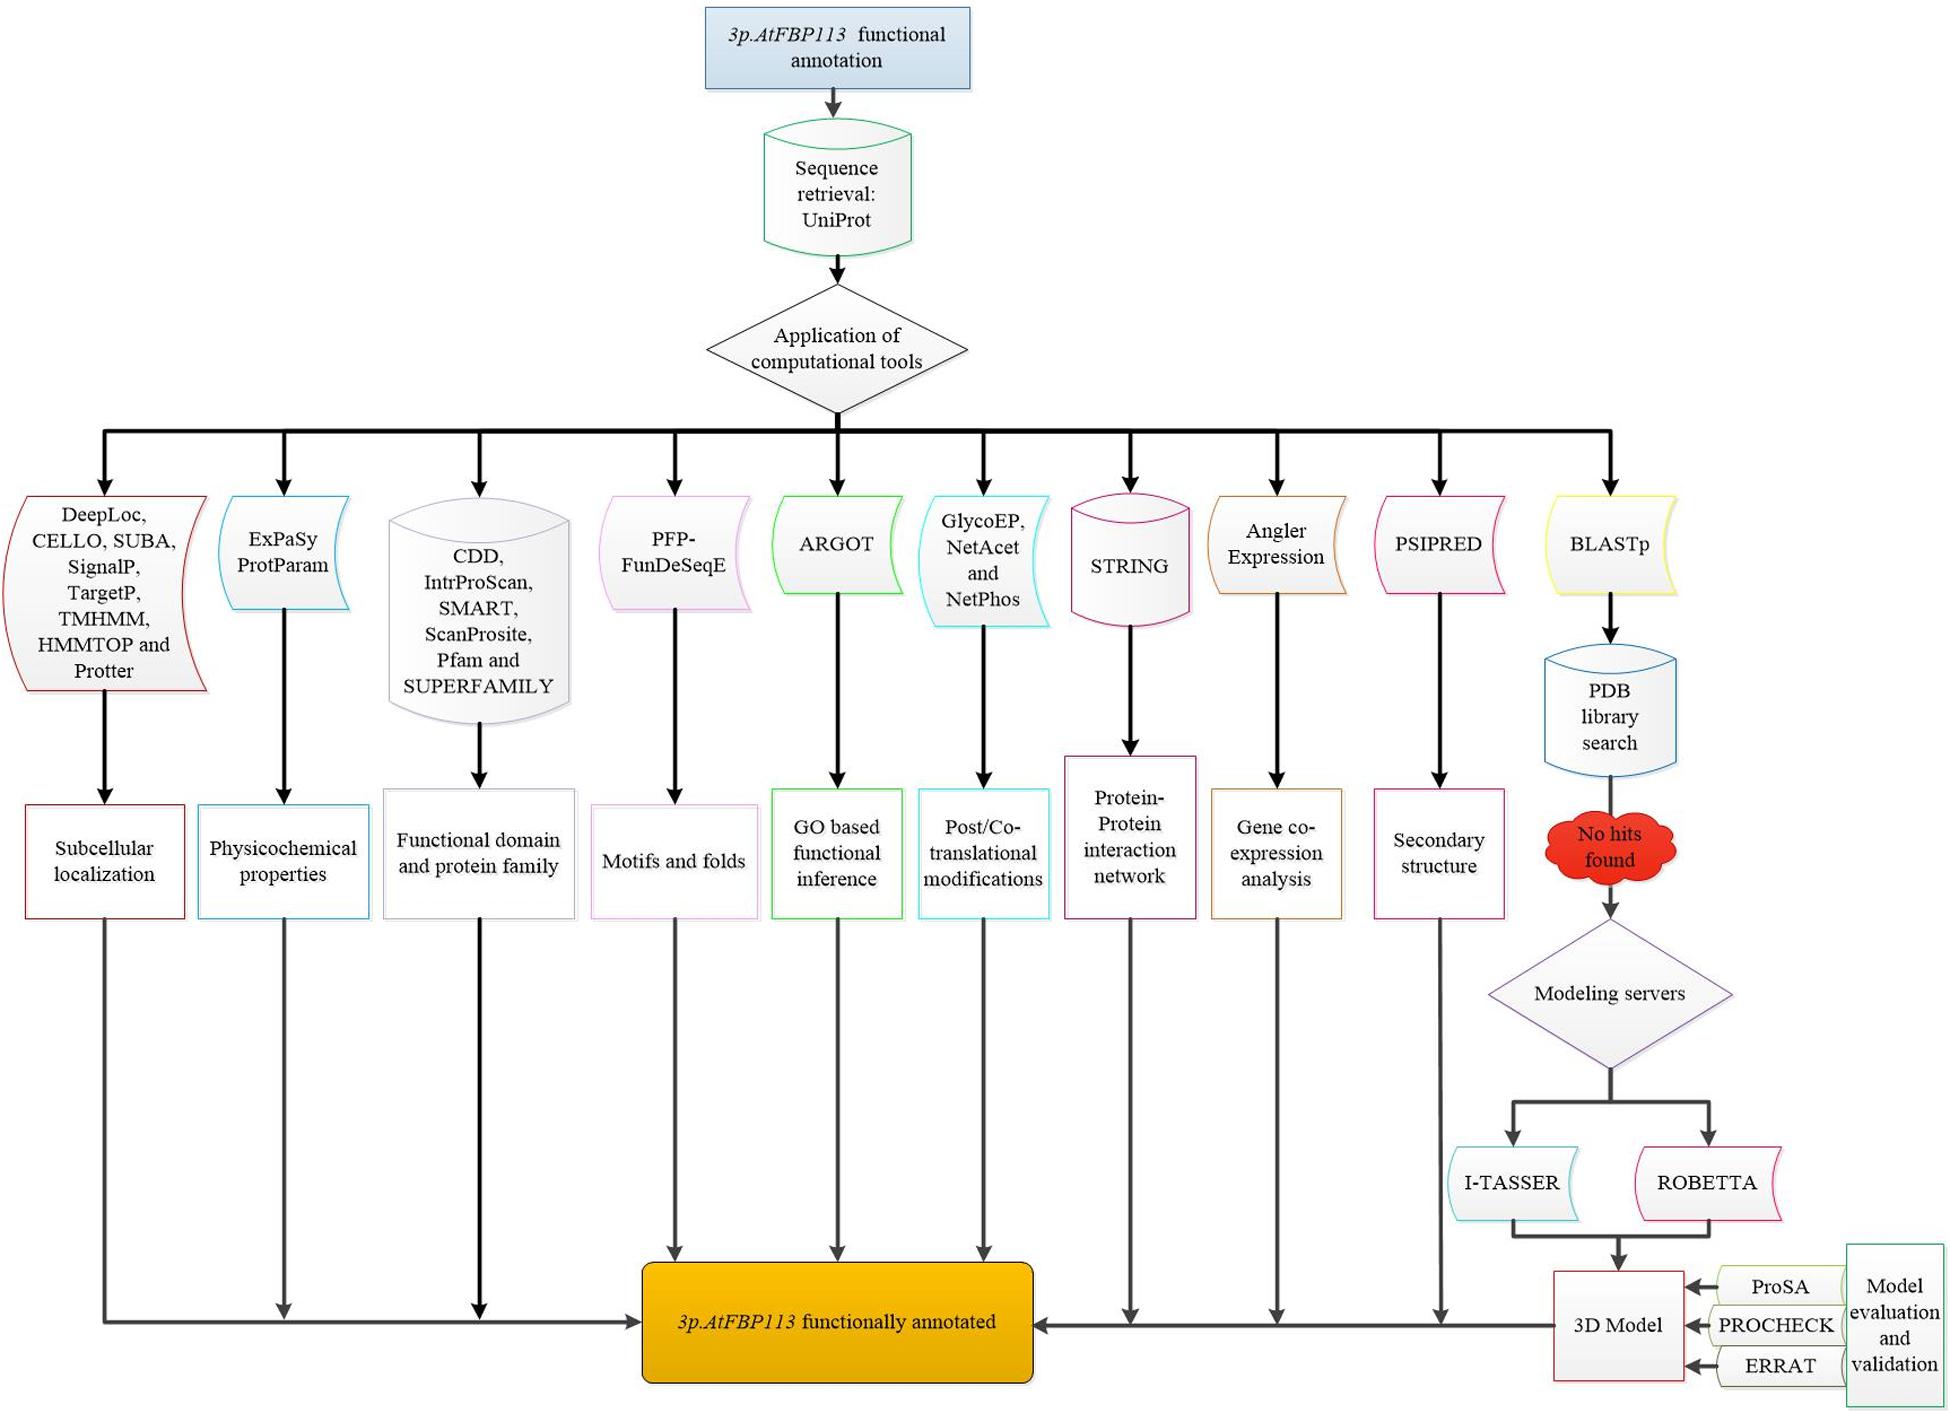
Figure 3. Flowchart demonstrating the functional annotation of 3p.AtFBP113. The diagrammatical representation depicts the comprehensive step by step methods used for inferring the probable functions of 3p.AtFBP113.
The schematic representation of standardized nomenclature, which is proposed here for naming the FBP genes, exemplifying gene of interest is shown in Figure 4A, while Arabidopsis FBP gene family nomenclature is provided in Supplementary Table S1. The ePlant chromosome viewer used for determining the location of the genes revealed that our target gene is residing on the short arm (p) of chromosome 3 (Figure 4B) and according to the nomenclature our gene of interest is as 3p.AtFBP113. The NCBI search showed that 3p.AtFBP113 is located in reverse orientation on chromosome 3 reference genome sequence NC_003074.8 (Figure 4C) while sequence analysis showed that 3p.AtFBP113 is 1.24 Kb long gene that consists of a single exon (Figure 4D) and encodes 397 amino acid long protein. The genomic distribution of FBP genes showed their even distribution on all five chromosomes (Figure 5A). The even distribution of FBP encoding genes describes a positive correlation with chromosomes length, i.e., the chromosomes 1, 3 and 5, which are longer harbor more FBP genes as compared to chromosomes 2 and 4, which are shorter in size. However, among longer chromosomes, the number of FBP encoding genes on chromosome 3 is greater as compared to chromosome 5, which is comparatively bigger in size (Figure 5B).
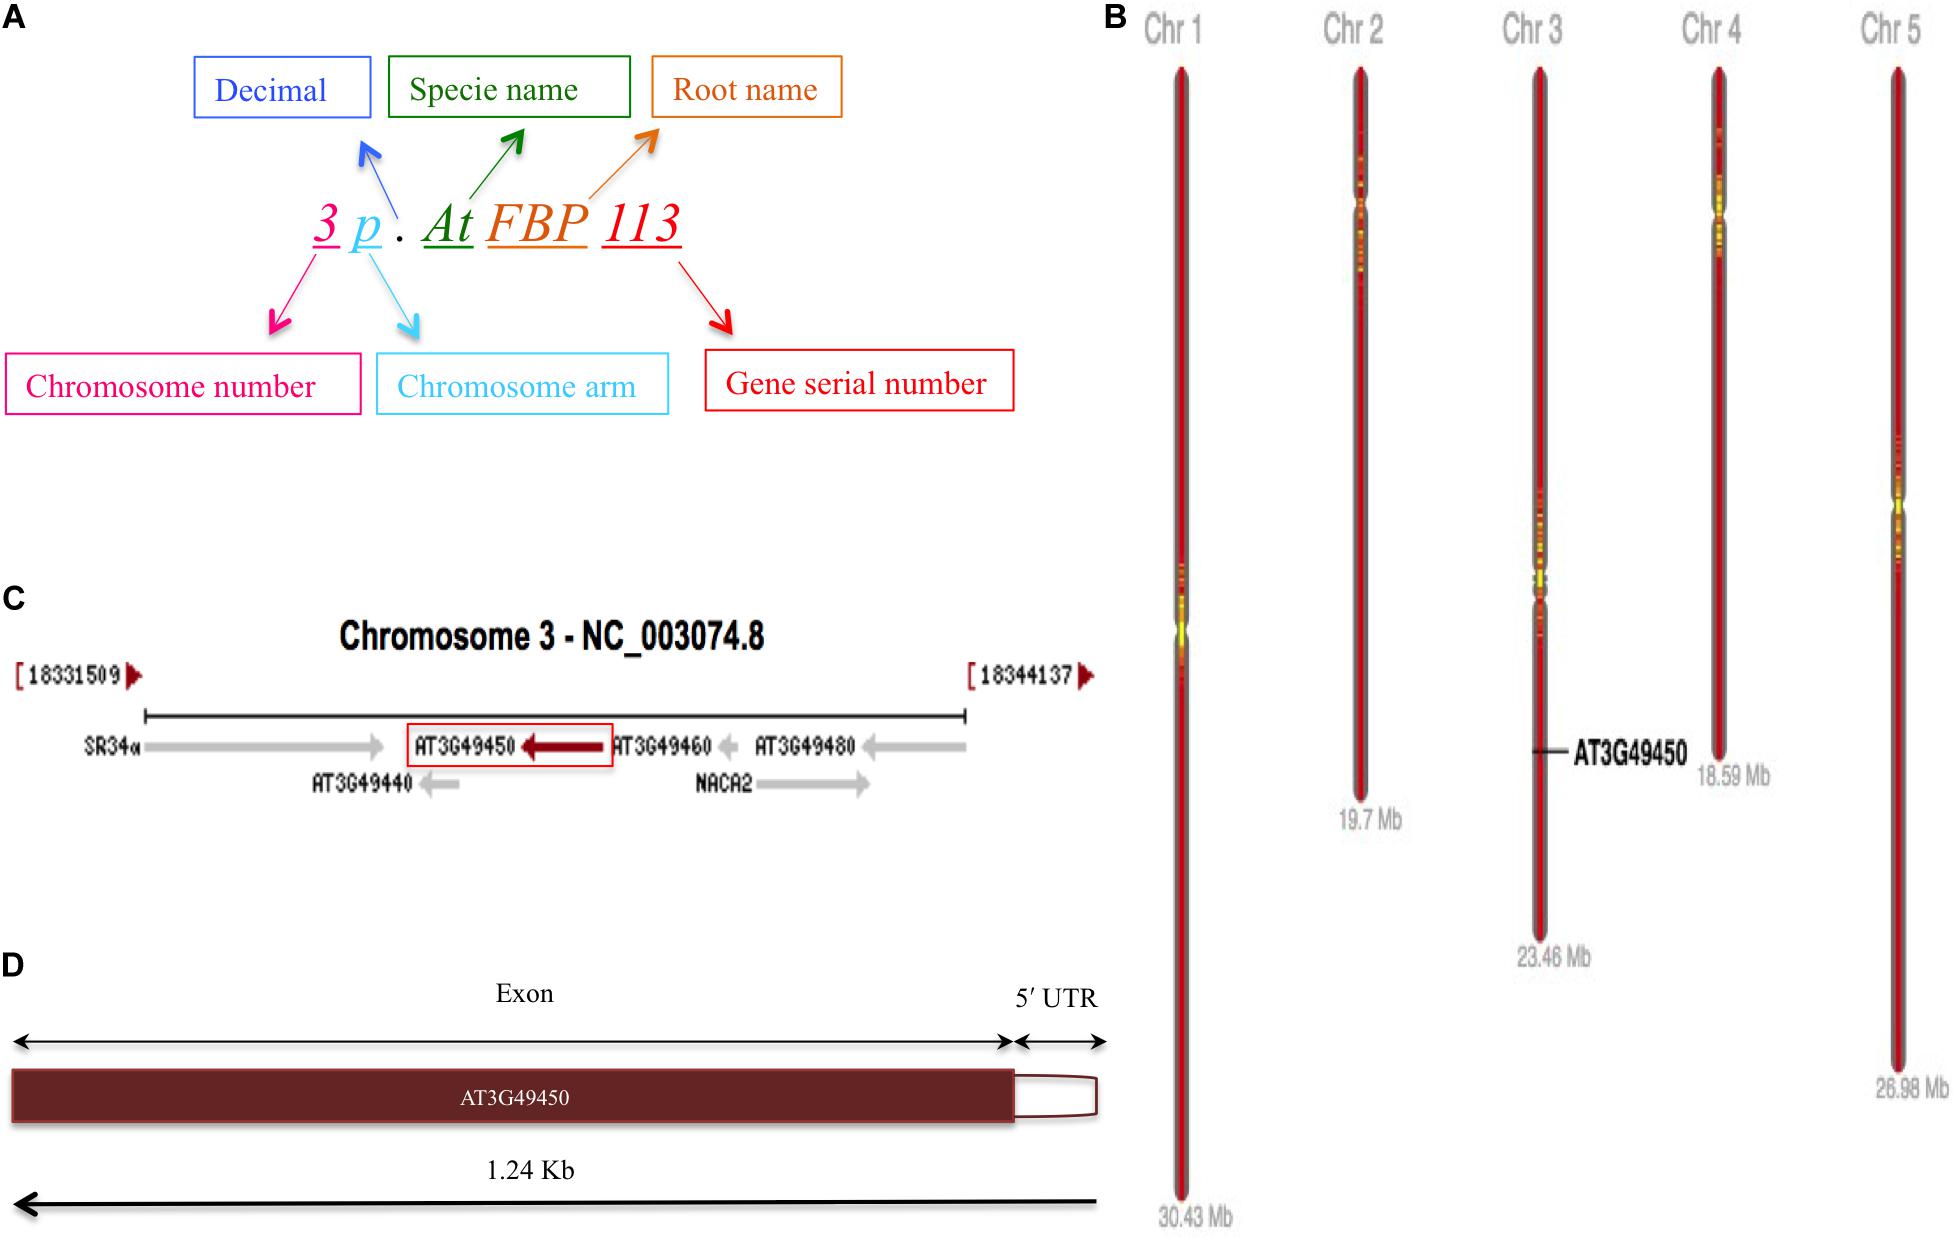
Figure 4. FBP gene family nomenclature system, and 3p.AtFBP113 chromosome localization, orientation and, gene structure. (A) Demonstrates an alphanumerical nomenclature system consisting of several parts, exemplifying gene of interest, for naming FBP gene family in Arabidopsis. (B) Specifically demonstrates that 3p.AtFBP113 is located on the short arm of Arabidopsis chromosome 3 in high gene density region. (C) Shows that 3p.AtFBP113 is located in reverse orientation on NCBI reference chromosome sequence NC_003074.8 along with other genes. (D) Describes 3p.AtFBP113 structure. The gene is 1.24 Kb long and encodes one exon with the 5′ UTR region.
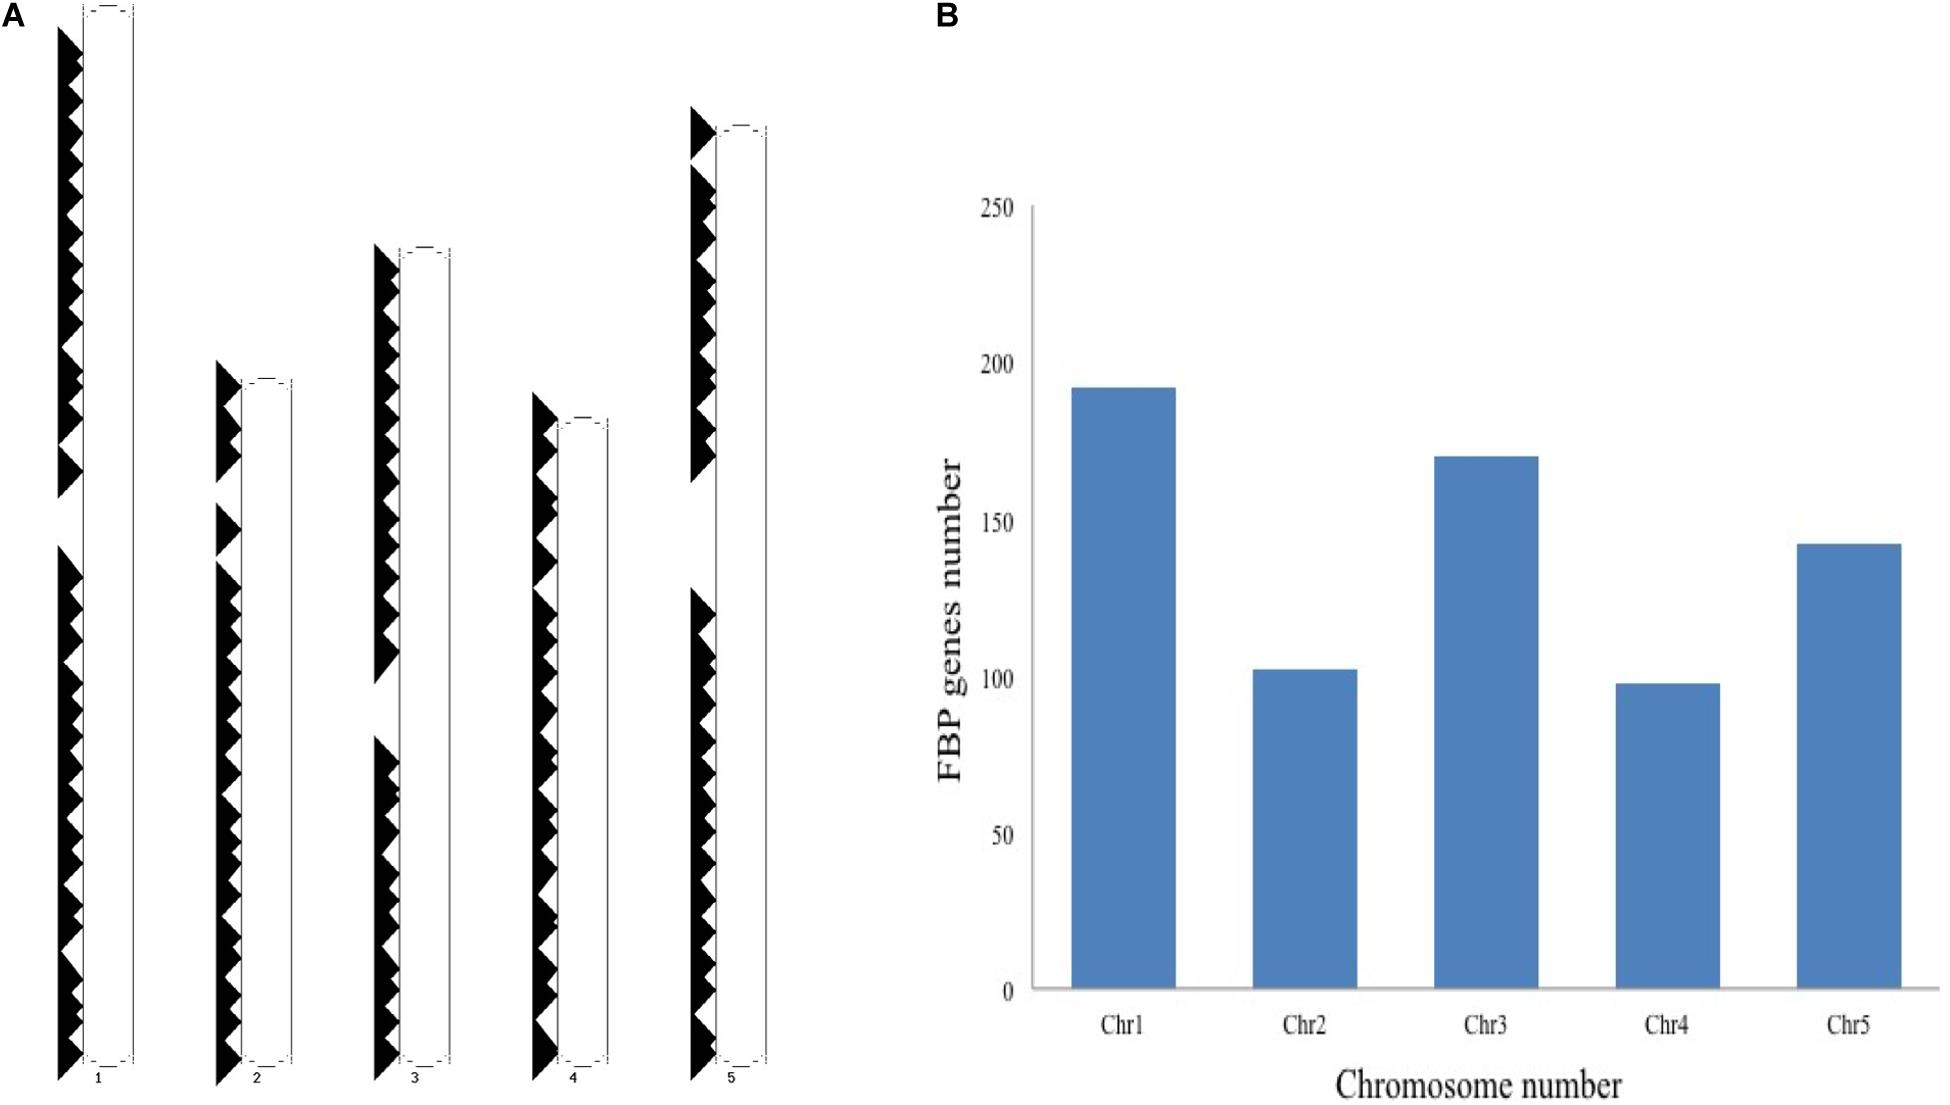
Figure 5. Genomic distribution of Arabidopsis thaliana F-box genes. (A) Shows the distribution and localization of FBP genes on five different chromosomes of Arabidopsis thaliana. (B) Describes the positive correlation between the chromosome length and the number of FBP encoding genes. The longer chromosomes tend to have more FBP genes as compared to the smaller chromosomes except that more FBP genes are residing on chromosome 3 as compared to chromosome 5, which is larger than chromosome 3.
Different computational tools were used to perform detailed systemic analysis on the 3p.AtFBP113 protein sequence retrieved from UniPort. The subcellular localization prediction tools anticipated that 3p.AtFBP113 is located either in the nucleus, cytoplasm, or plasma membrane and lacks signal/transit peptides and transmembrane helixes. The cNLS mapper predicted the presence of two kinds of nuclear localizing signals, i.e., monopartite and bipartite. The monopartite signal, present at the N-terminal region, suggested strong nuclear localization due to high score while the bipartite signal score suggested its localization in both compartments, i.e., cytoplasm and nucleus. The visualization of 3p.AtFBP113 protein topology obtained using Protter is presented in Figure 6. The computed physicochemical properties of 3p.AtFBP113 protein are summarized in Table 1.
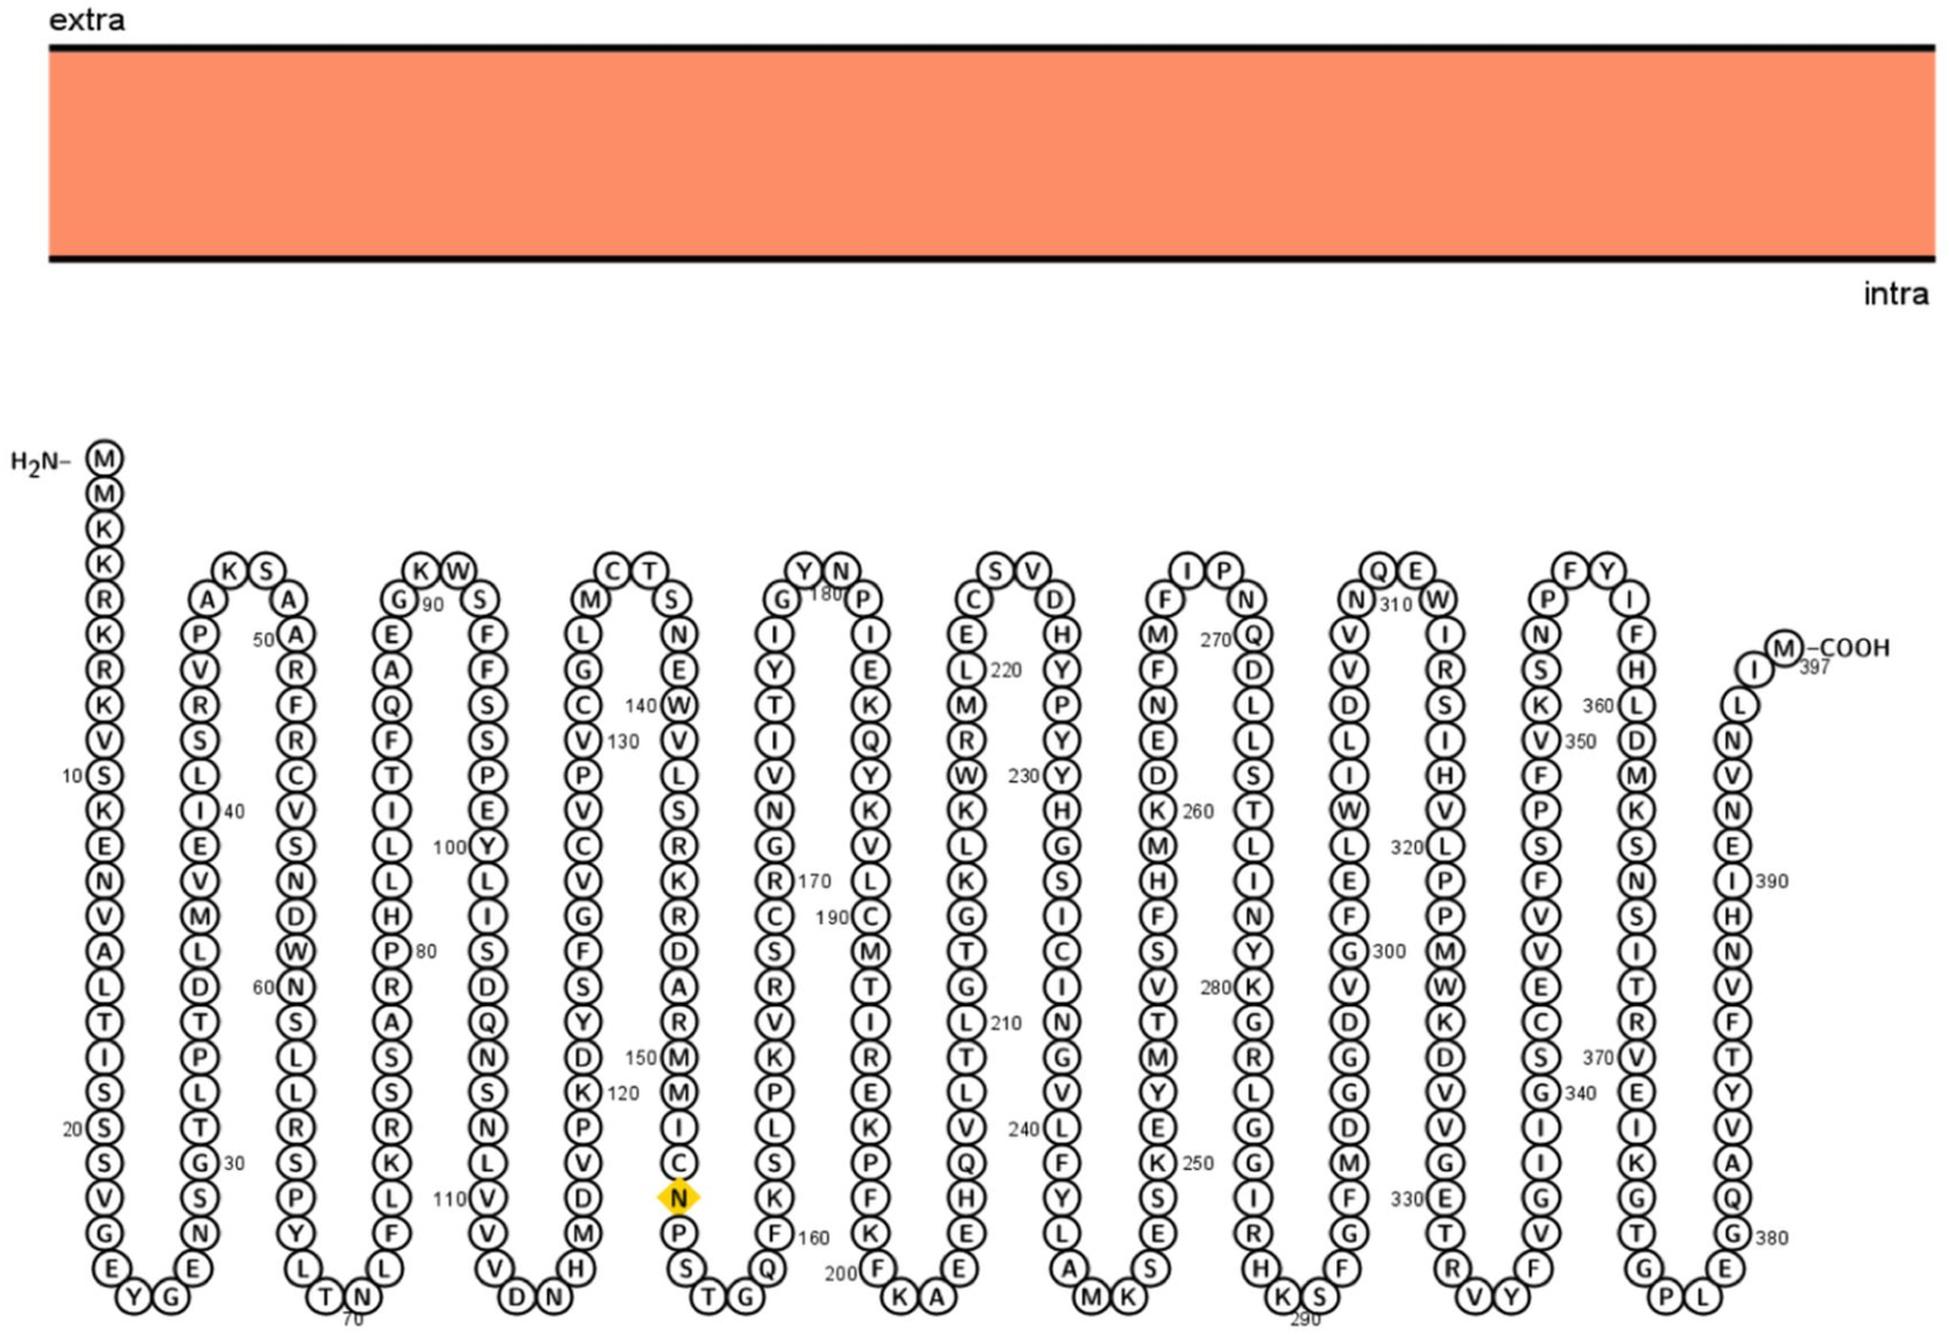
Figure 6. Visualization of 3p.AtFBP113 protein topology. Protter shows that 3p.AtFBP113 is lacking transmembrane helices and is present in the intracellular region. Therefore, it is deprived of the typical topology, which is the characteristic feature of TM proteins.

Table 1. Physicochemical properties of 3p.AtFBP113 protein predicted using the ProtParam tool available at the ExPASy server.
All functional domain prediction databases used like CDD, ScanProsite, SMART, Pfam, CDART, and InterProScan predicted that the 3p.AtFBP113 contains an approximately 40-50 amino acid long F-box domain at its N-terminal region. Besides the N-terminal domain, some of these databases like CDD, SMART, Pfam and CDART outputs showed an additional domain at the C-terminal region. For instance, CDD, and CDART predicted F-box associated domain type1 (FBA1) spanning from 127 to 365 amino acids, while SMART and Pfam outputs showed a F-box associated domain type3 (FBA3) spanning from 233 to 357 amino at C-terminal. InterProScan database search revealed that 3p.AtFBP113 sequence contains at its C-terminus region either F-box associated interaction domain (127-365 aa) or FBA3 domain (234-357 aa). The CDD and CDART predicted it to be a member of either F-box-like domain superfamily or FBA1 domain superfamily. The InterProScan output showed it as a member of either F-box domain superfamily or F-box-like domain superfamily, whereas the Superfamily outcome anticipated it to belong to F-box domain superfamily of proteins. The domains, which are predicted by different bioinformatics tools, are shown in Figure 7. The MotifFinder detected three motifs in the protein sequence, i.e., F-box or F-box-like motif in the N-terminal region while FBA3 motif in the C-terminal region, whereas, PFP-FunDSeqE web server predicted immunoglobulin-like fold in the protein sequence.

Figure 7. Predicted functional domains in 3p.AtFBP113 protein sequence. The figure depicts that 3p.AtFBP113 sequence contains two main domains one residing in its N-terminal region, whereas the other is present at the C-terminal region. Though different C-terminal domains are predicted from different domain prediction databases but these have overlapping regions and belong to the same subclass of F-box proteins, i.e., F-box associated domain (FBA).
Glycosylation is one of the major modifications of proteins after their translation and glycoproteins carry out various important processes at the cellular level like folding of proteins, cell to cell interaction, cell recognition, and host-pathogen interaction (Chauhan et al., 2013). In 3p.AtFBP113 protein sequence, the GlycoEP tool predicted 154N as a potential residue for N-linked glycosylation; many residues, i.e., 42S, 61S, and 252S were predicted as potential O-linked sites while it could not predict any potential C-linked glycosylation sites in the protein sequence. N-terminal acetylation is the most common modification, which occurs co-translationally (Kiemer et al., 2005). NetAcet 1.0 server output showed that 3p.AtFBP113 sequence does not contain any potential acetylation site. Phosphorylation at serine, threonine, or tyrosine is the most important modification, which affects signaling of various cellular processes (Blom et al., 1999). NetPhos 3.1 server predicted various potential phosphorylation sites in 3p.AtFBP113 sequence (Figure 8). The anticipated potential sites in 3p.AtFBP113 sequence for different post/co-translational modifications are mentioned in Table 2.
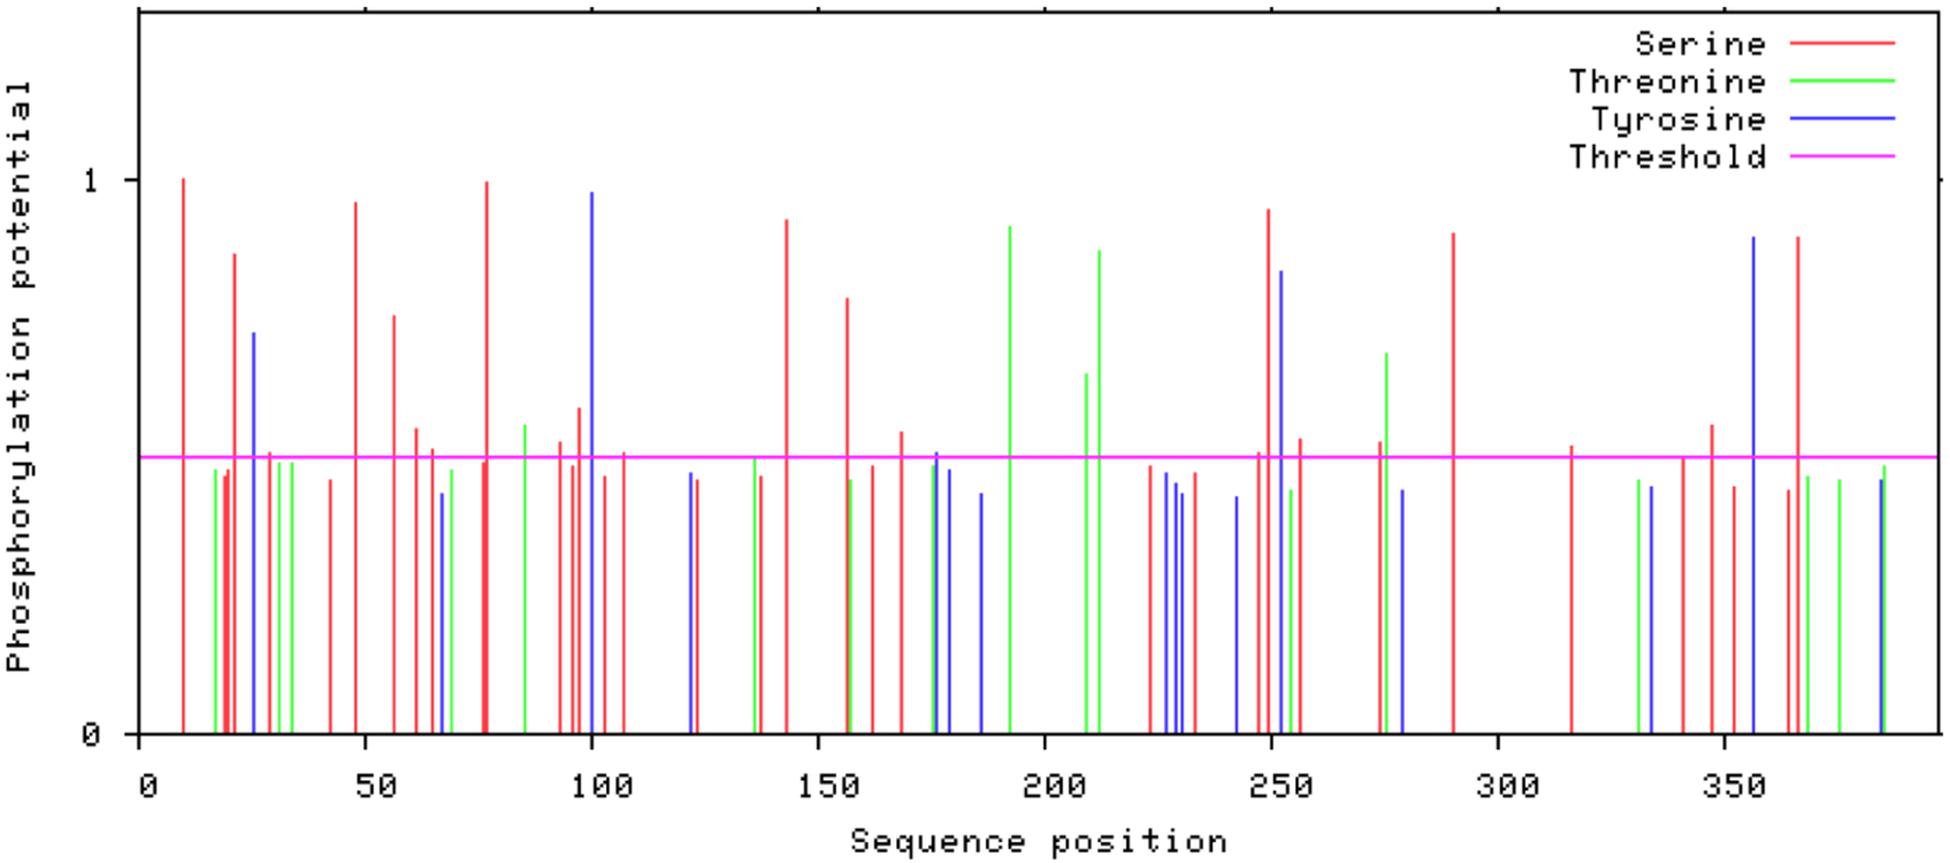
Figure 8. The predicted potential phosphorylation sites in 3p.AtFBP113 sequence. Several residues with high potential for phosphorylation were predicted by the NetPhos server as indicated by their high score in the graph. The higher score, i.e., 1 demonstrates high confidence in the prediction. Among these, serine residues seem to have more potential for phosphorylation as many serine residues have a score near 1.
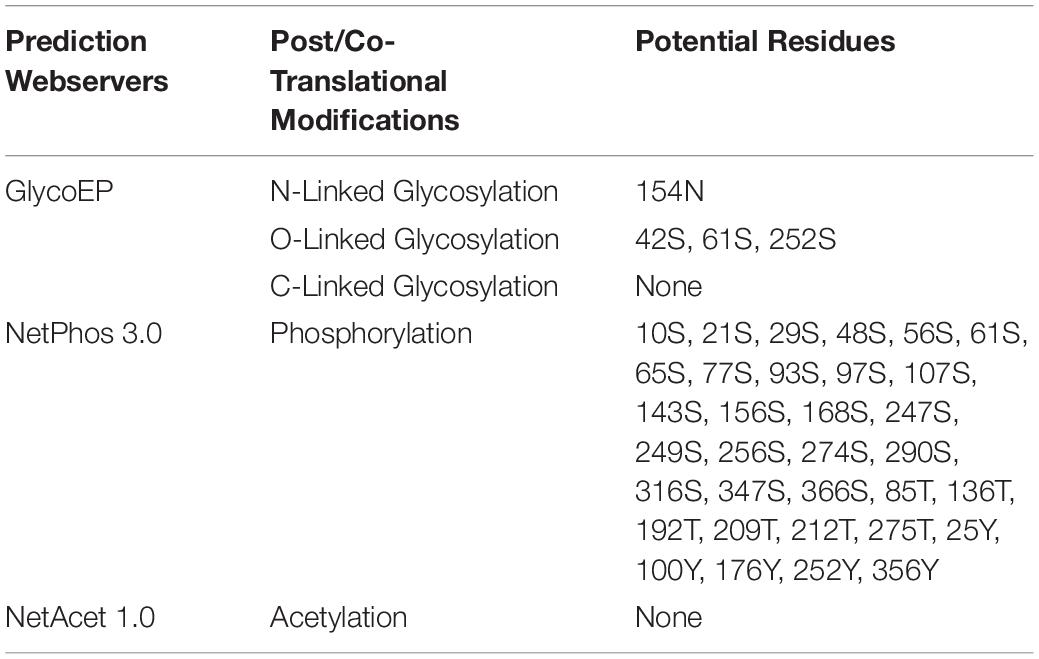
Table 2. Potential residues predicted in 3p.AtFBP113 protein sequence to undergo post/co-translational modifications.
ARGOT2.5 output returned various GO terms (Supplementary Table S2) among which the most significant terms anticipated that 3p.AtFBP113 is involved in the biological processes like protein ubiquitination. At the molecular level, 3p.AtFBP113 is predicted to take part in protein binding, while at the cellular level it is anticipated to be a part of the proteasome core complex.
For understanding 3p.AtFBP113 functions in the context of a well-organized biological network in the cellular environment, the STRING database was used for predicting the interacting partners of 3p.AtFBP113 protein. However, with cut-off value 0.04, we could not obtain reliable interacting protein partners. Next, using Expression Angler we obtained about 24 genes having similar expression patterns with that of 3p.AtFBP113 during the process of microgametogenesis (Figure 9). TAIR database was searched for annotation of genes functions. The genes that showed strong similar expression patterns, i.e., having Pearson correlation coefficient ≥ 0.7 were mainly those involved in protein phosphorylation, cell division, transportation, protein ubiquitination, and protein binding (Supplementary Table S3).
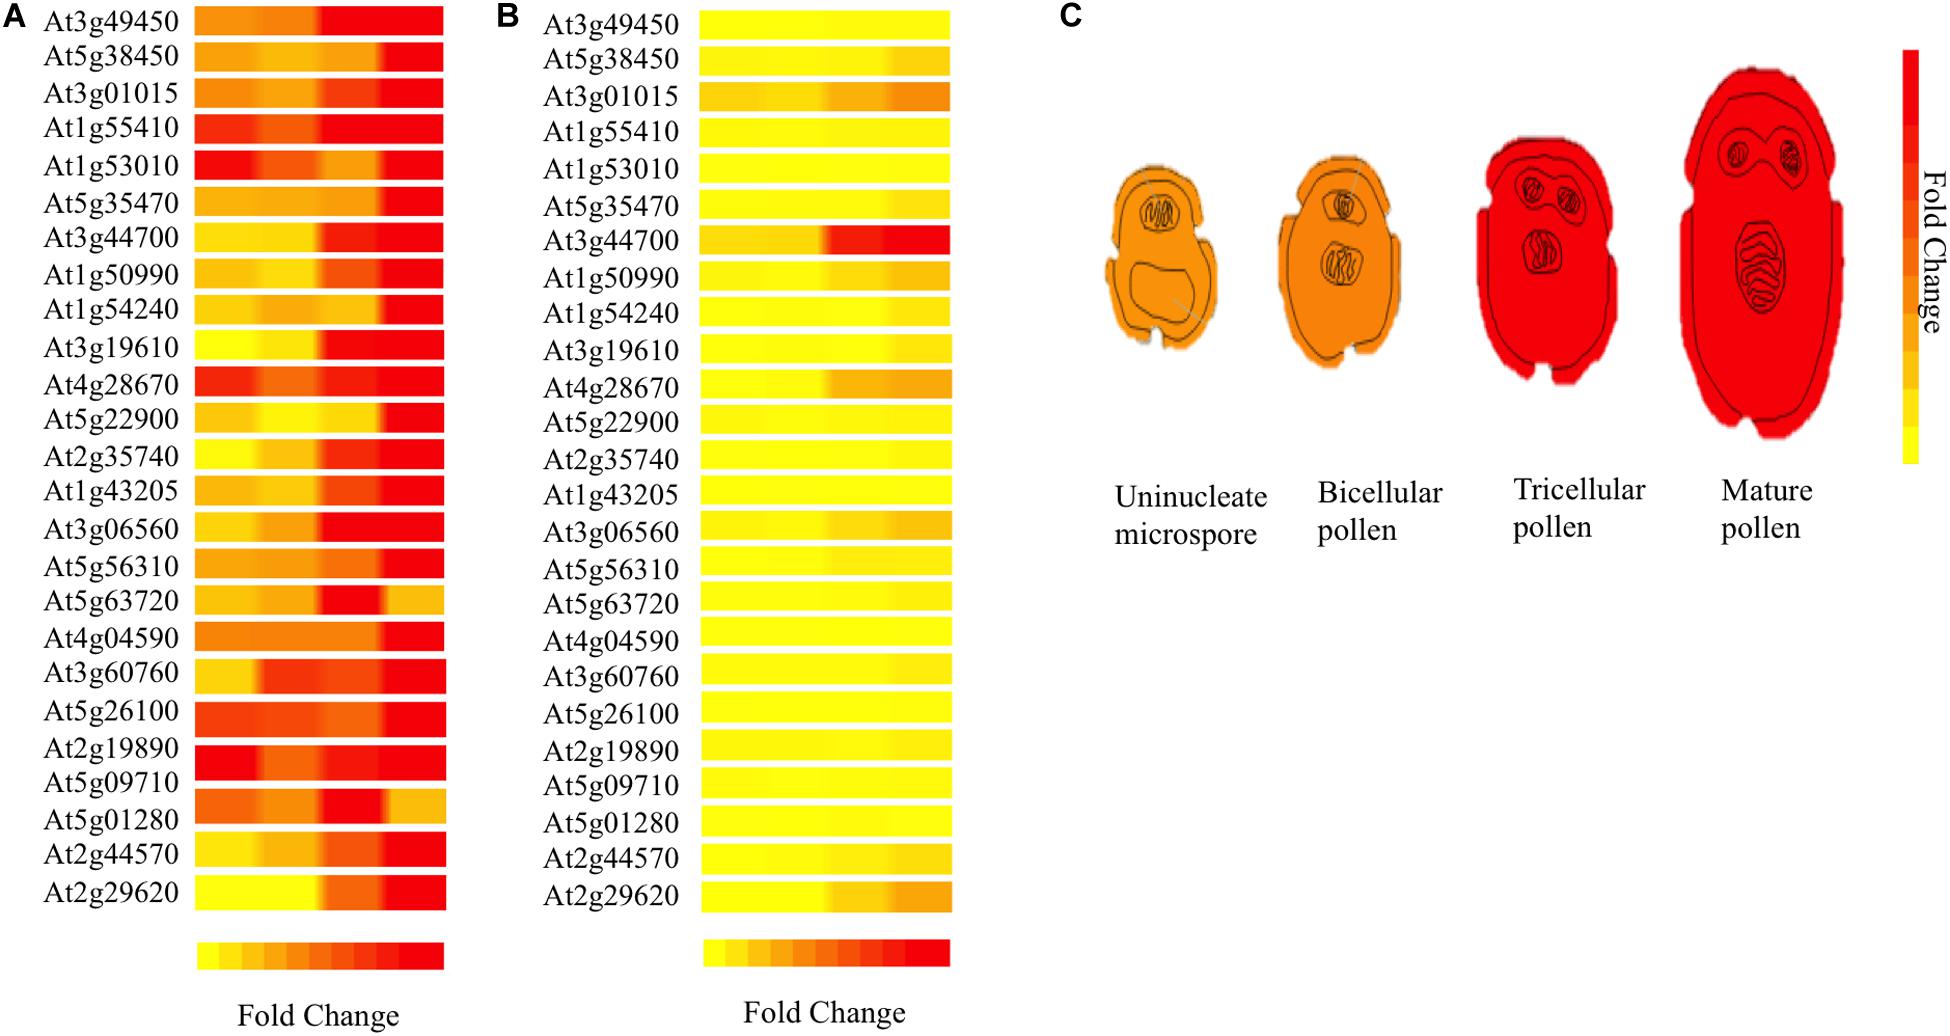
Figure 9. Heat map of genes co-expressed with 3p.AtFBP113 in a tissue-specific manner. The part (A) of the figure shows the local expression patterns of genes co-express with candidate gene 3p.AtFBP113 (At3g49450) in the form of a heat map during different developmental stages of microgametogenesis. (B) Shows the global view of gene expression indicating strong differential expression of a gene during last stage of microgametogenesis. The color legend indicates the expression levels in the form of fold change, where red shows maximum and yellow represents minimum change. (C) Depicts the expression of 3p.AtFBP113 exclusively during different developmental stages of microgametogenesis. The gene expression is low during early phases while reaches to a high level during later stages of reproduction as indicated by the color legend of fold change.
The secondary and tertiary structures of 3p.AtFBP113 were predicted to get insights into its structural features and function. PSIPRED results showed that 3p.AtFBP113 sequence is dominated by β-pleated sheets and coils followed by α-helices (Figure 10). Since we could not find any suitable homologous protein 3D structure in the PDB library for homology modeling, so we generated 3D structures using I-TASSER and Robetta servers. I-TASSER output generated 5 models with different C-scores ranging from -4 to -2, and the model with the highest C-score that reflects high confidence was selected as a final model. The Robetta server used comparative modeling and also generated 5 models among which the best model is selected. The refinement with the YASARA energy minimization server returned the models with low energy and high Z-values. Next, the validation of I-TASSER and Robetta models with ProSA web server returned Z scores within the range of experimentally determined 3D structures of proteins and depicted their good overall quality (Figures 11A,B). The analysis of Ramachandran plots generated by the PDBsum module PROCHECK revealed that for I-TASSER and Robetta generated models, 94.3% and 97.7% of the residues phi (Φ) and psi (Ψ) bonds conformations were resided in most favored regions and additionally allowed regions, thus depicting the good quality of 3p.AtFBP113 3D models (Figures 11C,D). The ERRAT module of the SAVES v5.0 tool showed that the overall quality factor of the I-TASSER protein model was 87.9 while that of the Robetta model was 84.6. Thus all validation tools employed suggested the good quality of the predicted 3D model. Finally, the visualization of 3D models with PyMol showed the presence of two types of domains in 3p.AtFBP113 protein sequence (Figure 12).
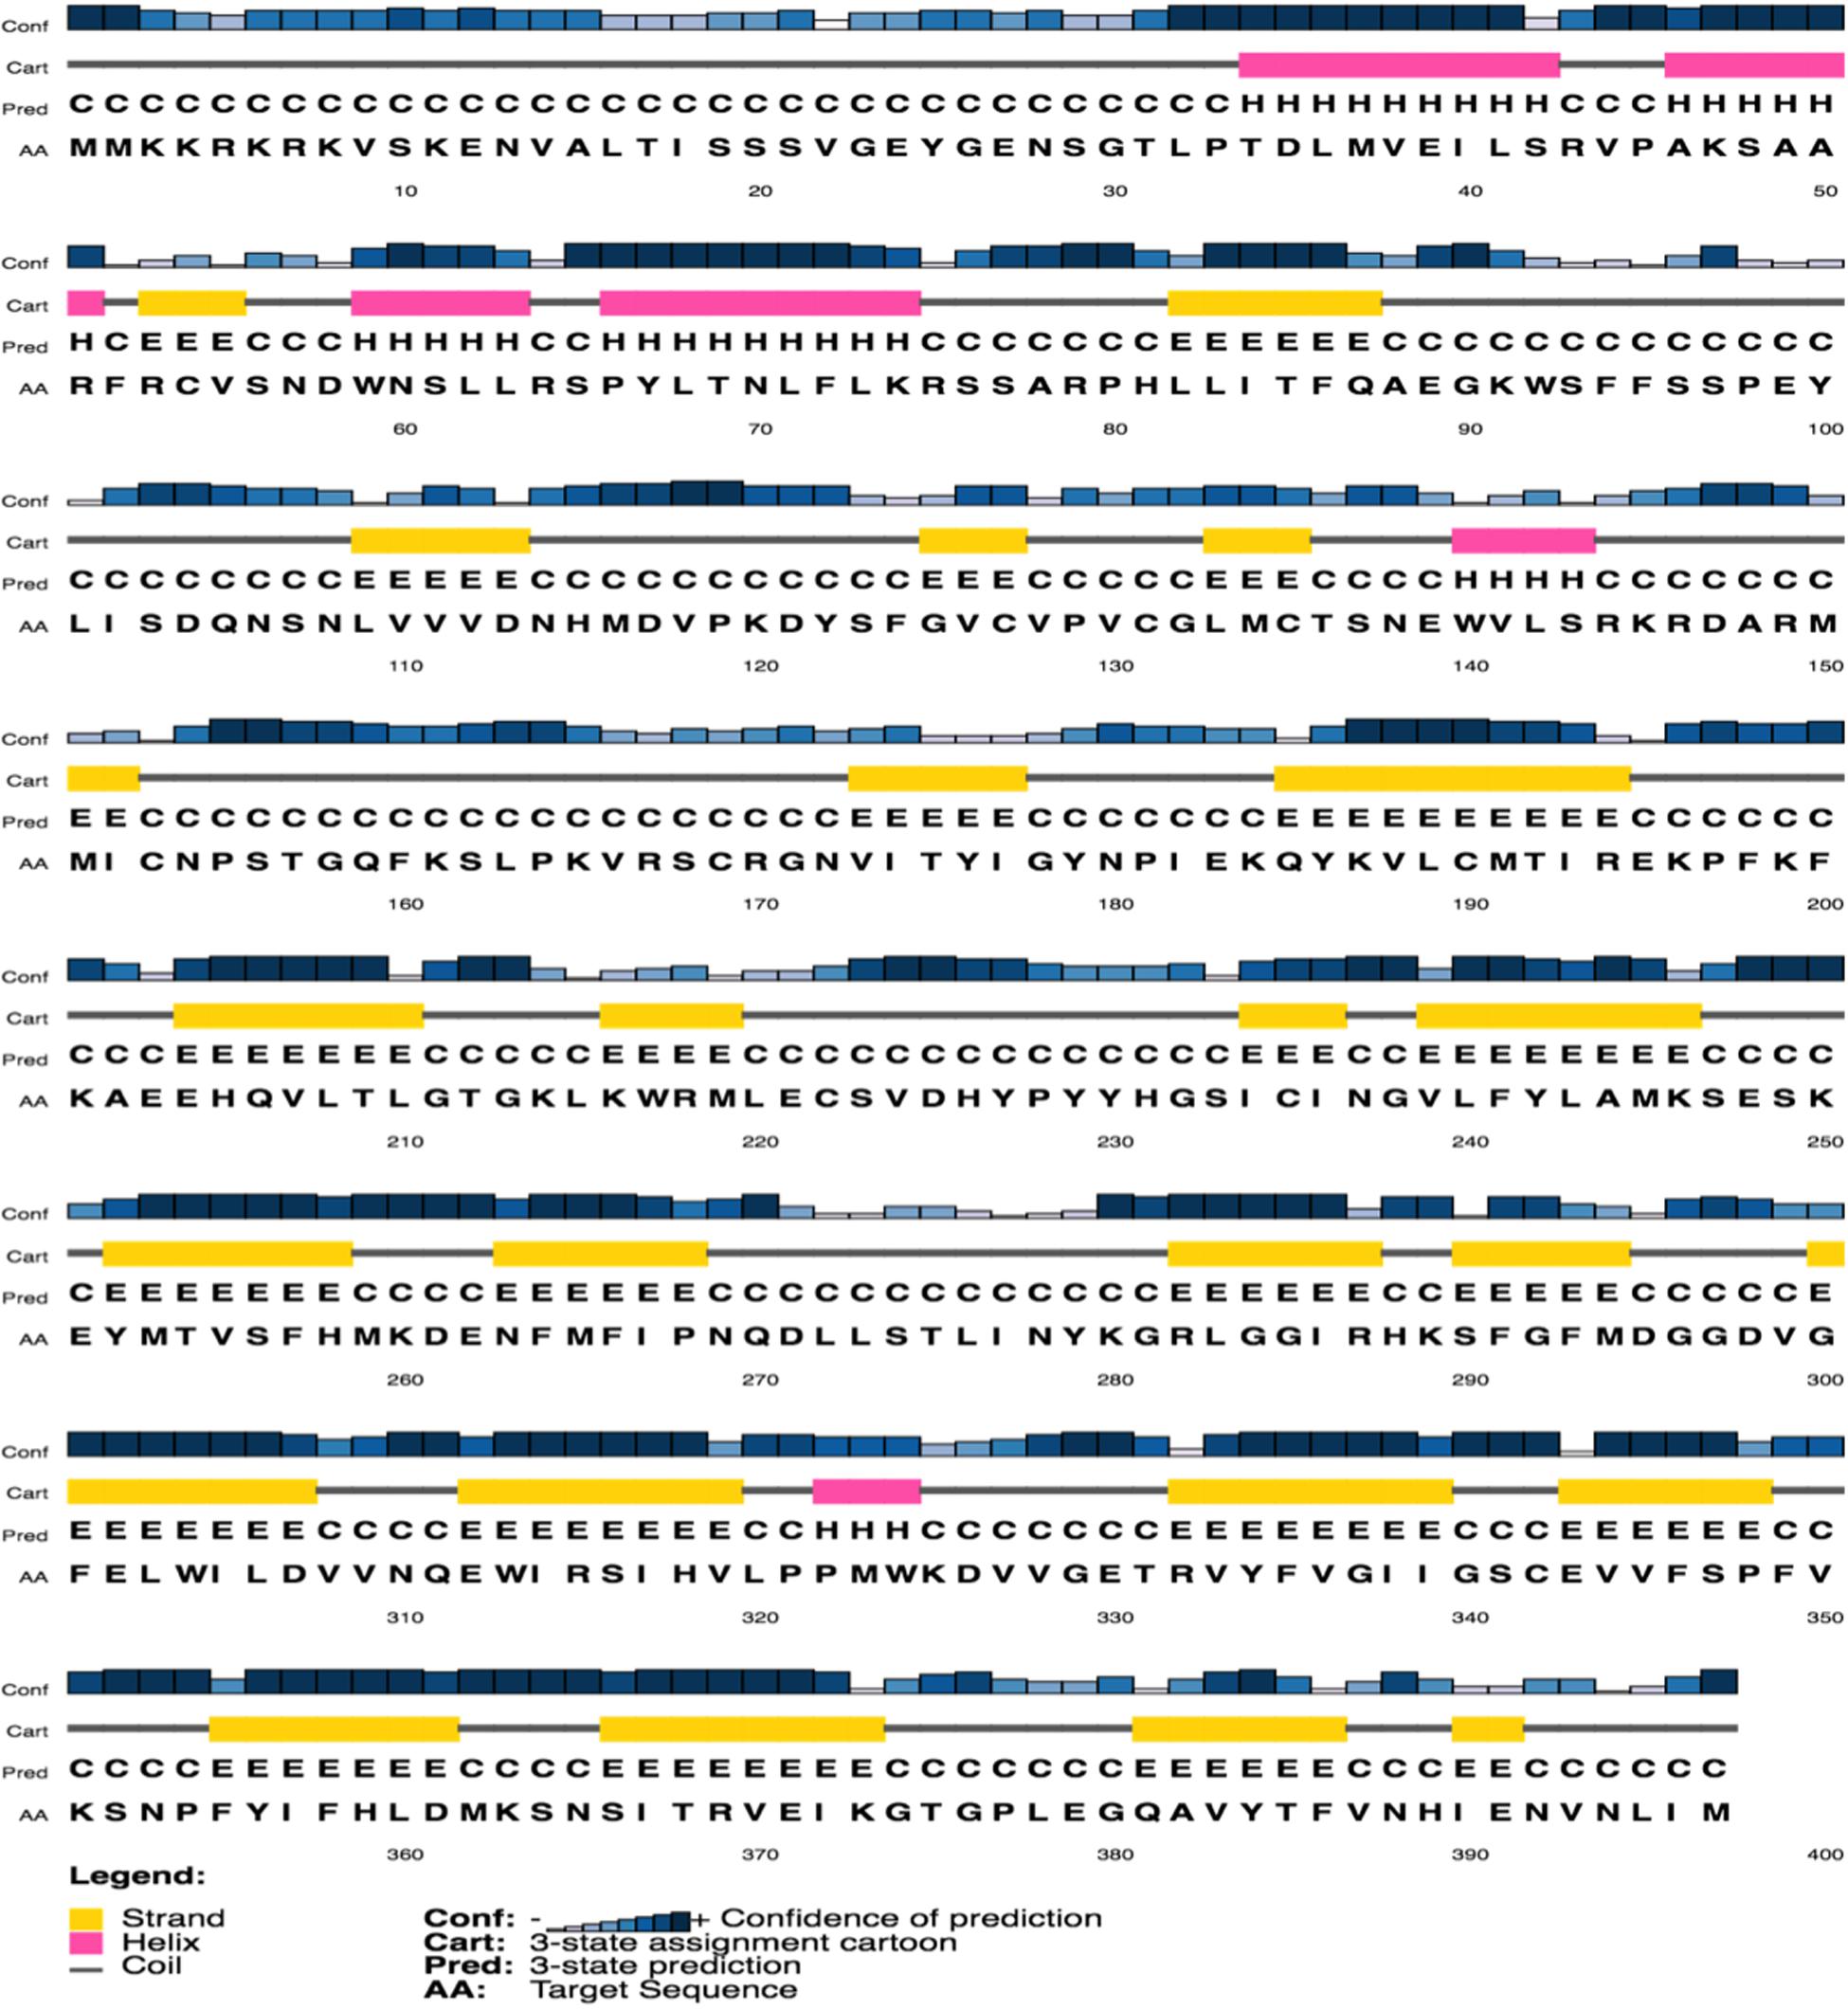
Figure 10. Predicted secondary structure of 3p.AtFBP113 protein. The secondary structure of 3p.AtFBP113 shows that the β-strands (yellow cylinders) are the most abundant secondary structural elements followed by α-helices (pink cylinders). Moreover, the coils (gray lines) are also abundant in the secondary structure of 3p.AtFBP113.
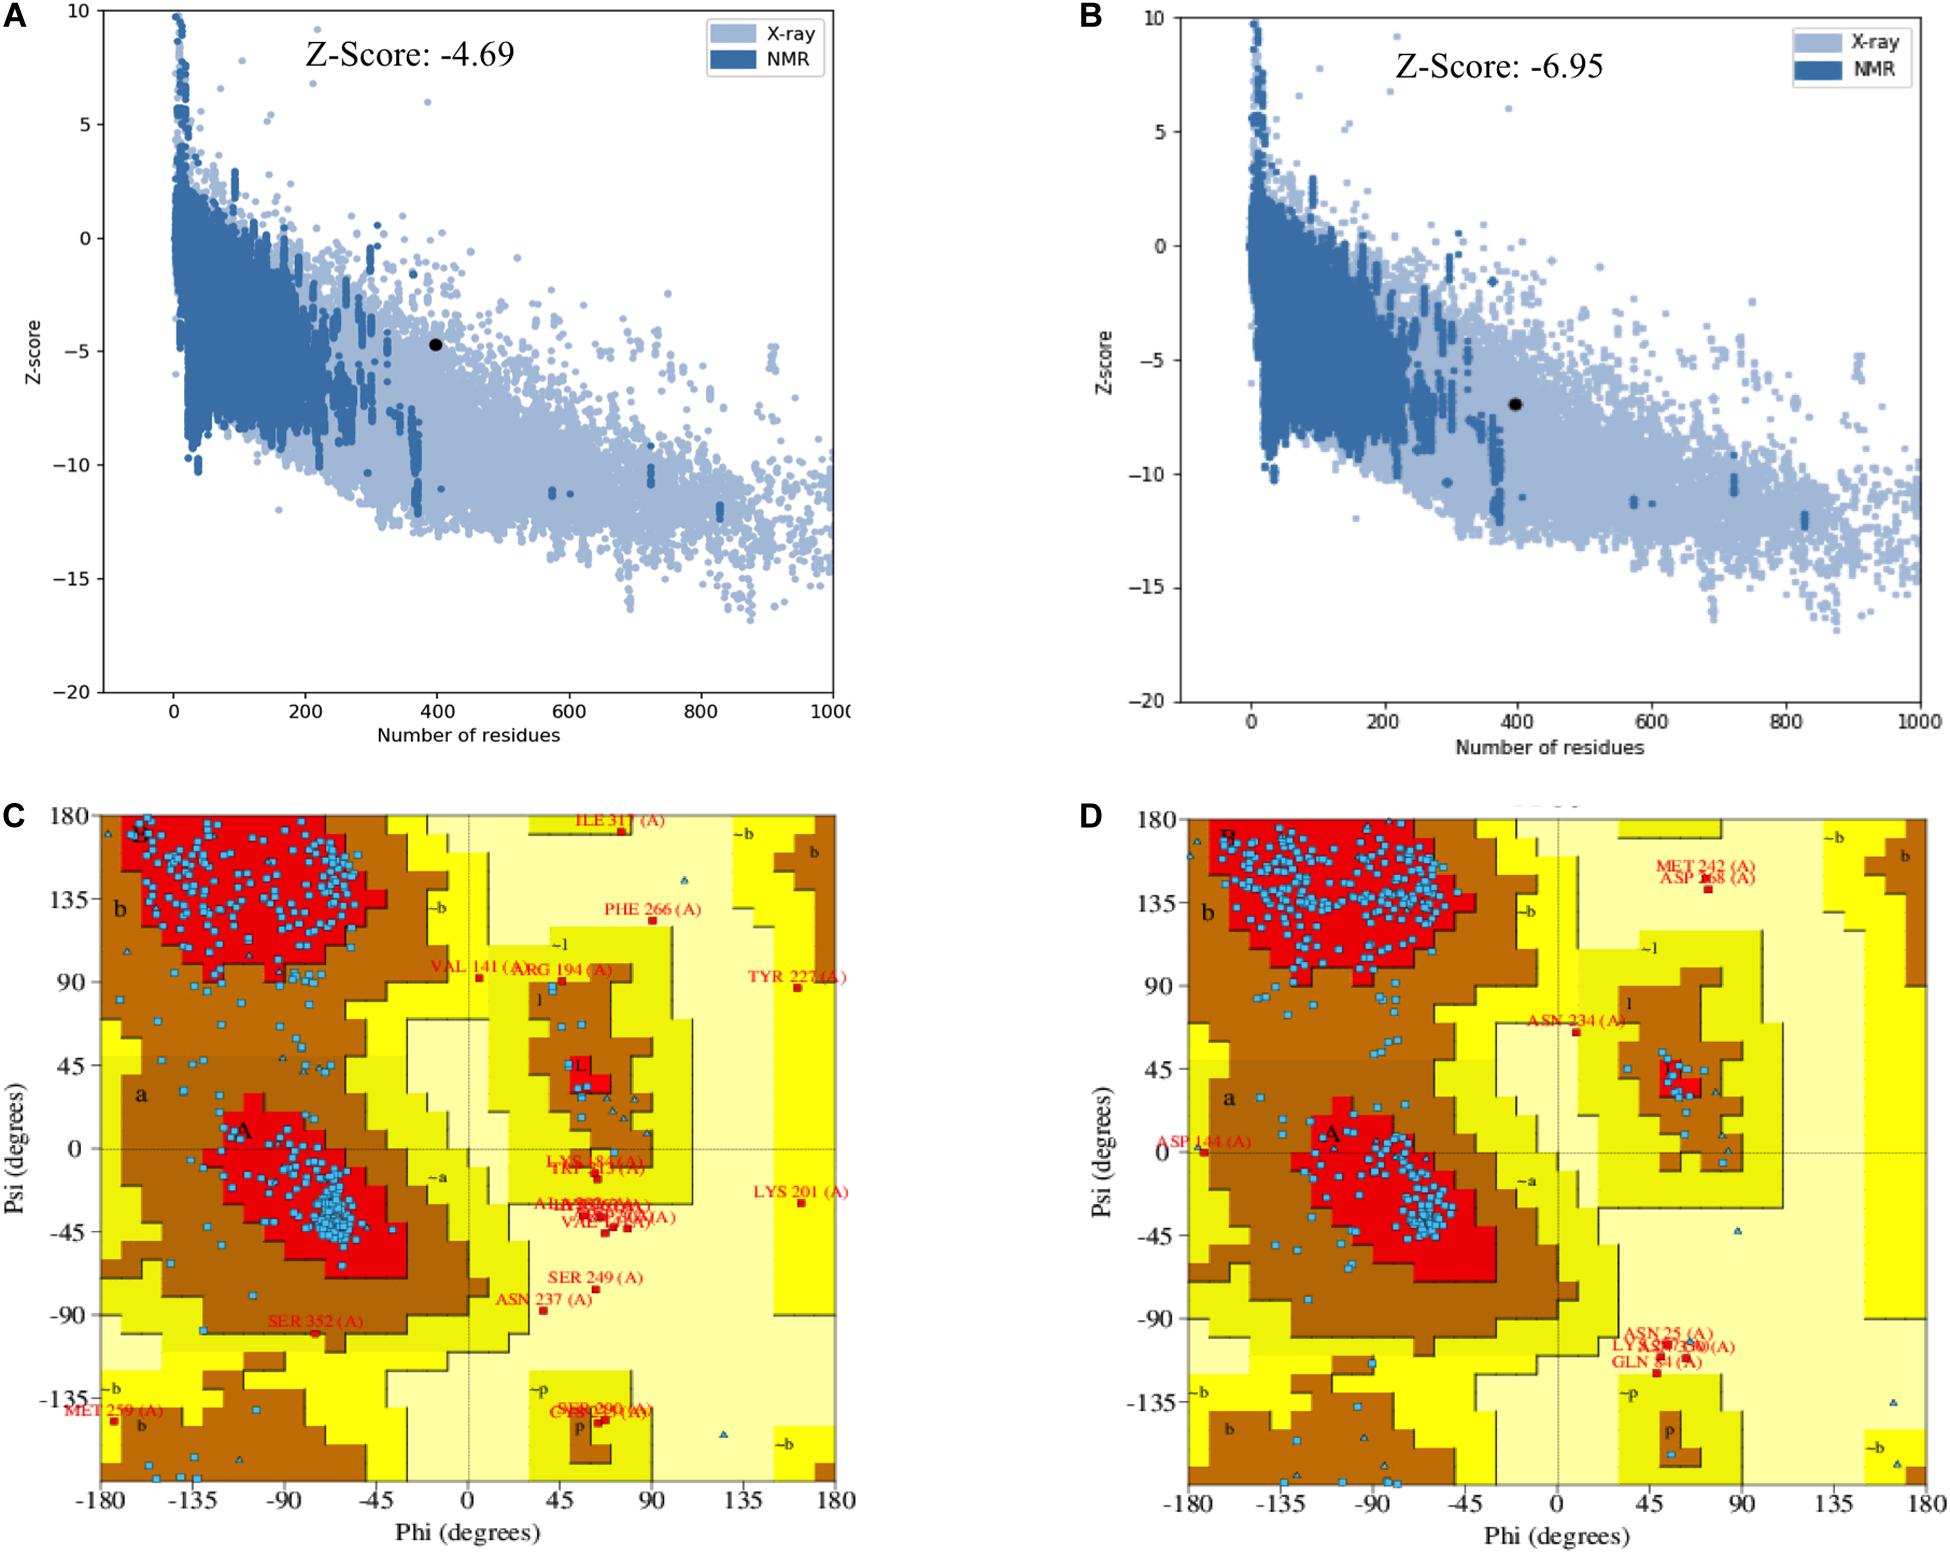
Figure 11. Validation of I-TASSER and Robetta generated 3p.AtFBP113 protein 3D models. The plot in part (A) shows Z-score for I-TASSER generated 3D model, whereas in (B) for the model developed by Robetta server. The graphs demonstrate good overall quality of the models due to the presence of their Z scores within the range of experimentally determined protein structures. The part (C) of the figure shows the phi (Φ) and psi (Ψ) bonds conformation of the 3D structure generated by I-TASSER where total 97.4 % of residues phi (Φ) and psi (Ψ) bonds are in conformation, which is either most favorable or is allowed, while 2.6% residues are outliers. (D) Shows the Ramachandran plot of Robetta generated 3D model. The plot shows that most favored, additionally allowed and generously allowed regions have 98% of residues while 2% of the residues have allosteric hindrances and are outliers.
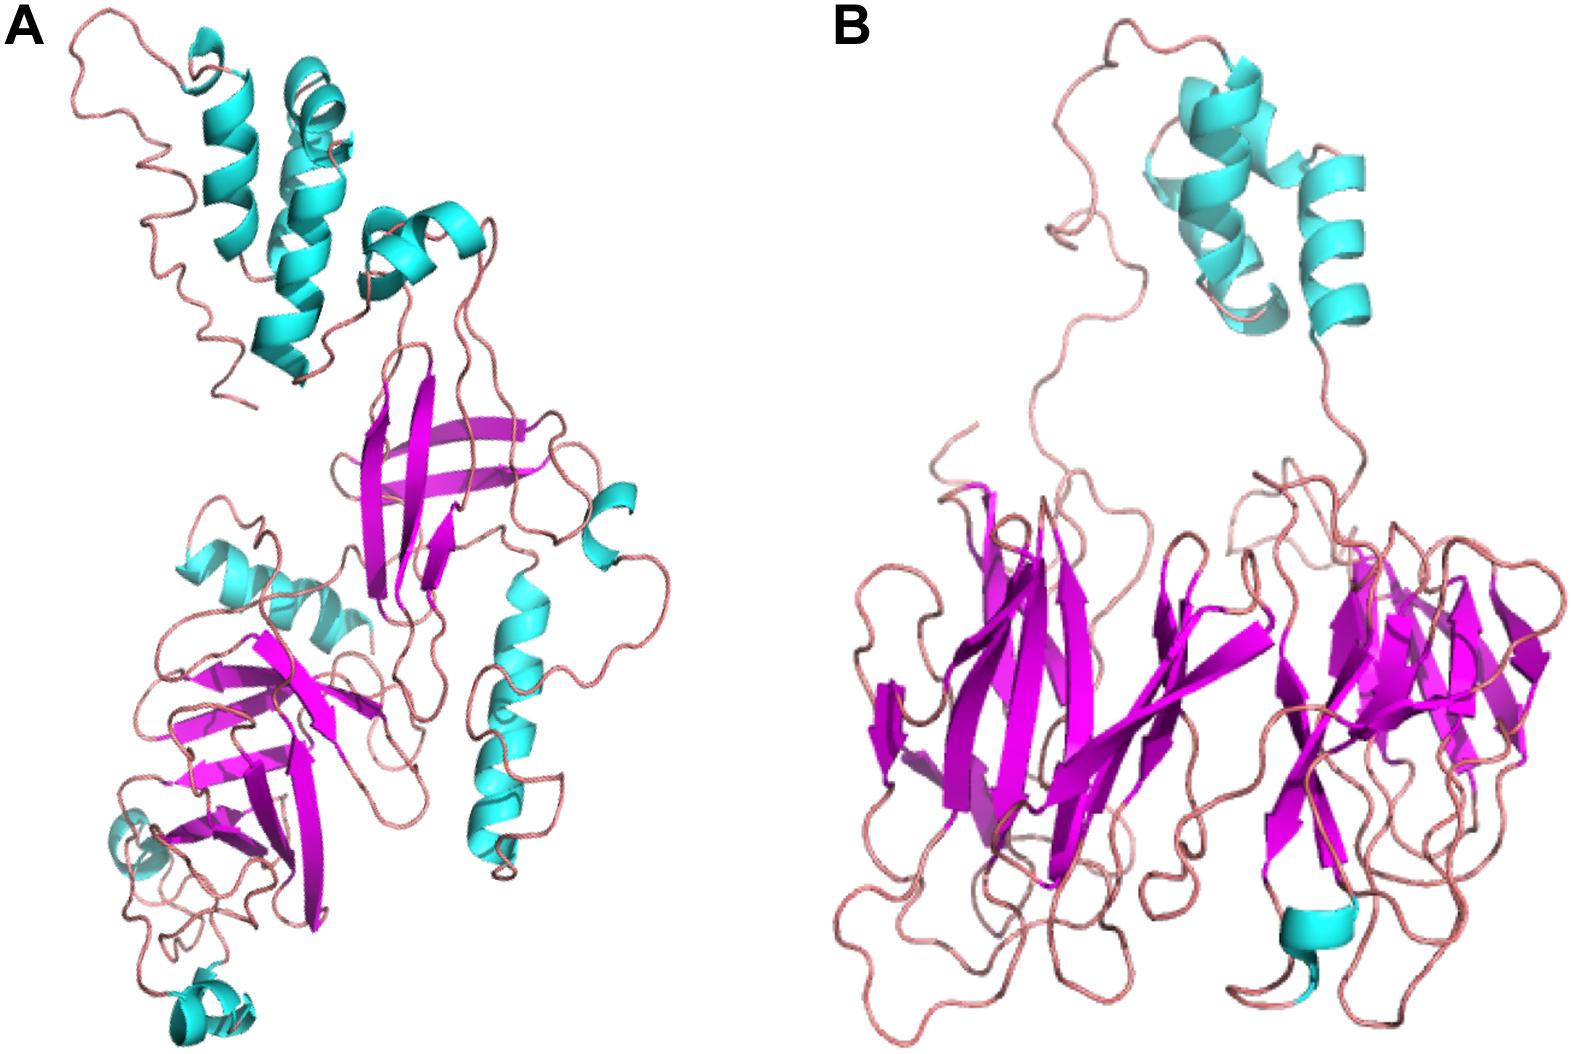
Figure 12. The tertiary structures of 3p.AtFBP113 protein generated by two different modeling servers. (A) The schematic representation of the complete tertiary structure generated by I-TASSER as a ribbon diagram. (B) The ribbon diagram of the 3D structure, generated by Robetta software. In both tertiary structures, the β-pleated sheaths are shown by magenta color and cyan color describes the α-helices, whereas coils (light red) constitute the rest of the protein part. The α-helices form the F-box domain in the N-terminal region, whereas two antiparallel β-pleated sheaths, which form immunoglobulin-like fold, constitute the C-terminal FBA domain.
In plants, F-box protein genes (FBPs) constitute one of the largest superfamilies of regulatory proteins. However, a standard and precise classification system for naming FBP genes is lacking in plants. In order to overcome the existing limitation, in this study, a nomenclature has been proposed for naming the FBP genes of Arabidopsis thaliana (Malik, 2011). The proposed systemic nomenclature will be helpful not only in introducing uniformity and communicating research findings effectively in the Arabidopsis FBP gene family but can also be applied to FBP gene families of other plant species whose genome sequencing have been completed and have well-defined chromosome maps. The genomic distribution of Arabidopsis FBPs depicts a positive relation between FBP number and chromosomal length as opposed to the study, which found out uneven FBPs distribution on cotton chromosomes (Zhang et al., 2019; Figure 5). Targeting the genes involved in anther or pollen development can manipulate male fertility, which is of immense importance in crop breeding and increasing the crop yield (Gómze et al., 2015). In plants, the prevalence of a huge number of FBP gene members and their involvement in controlling diverse growth and developmental processes make them potential targets for crop improvement. However, despite the identification of a large number of FBP genes expressed during male gametogenesis in Arabidopsis, the biological functions of only a few genes are described so far (Borges et al., 2008; Kim et al., 2008, 2010, 2012; Gusti et al., 2009) and functional roles for most FBPs are largely obscure and unknown. To bridge this gap, in the present study, a detailed analysis of the FBP gene, 3p.AtFBP113, which specifically expressed in sperm cells, using advanced computational tools was carried out to dissect its probable functional role during the microgametogenesis and pollen development. The results demonstrated that 3p.AtFBP113 transcribes into 1.24 Kb long mRNA that consists of only a single exon and encodes 397 amino acid long protein. Proteins perform optimally in their subcellular localization and subcellular localization prediction anticipated that 3p.AtFBP113 is located either in the nucleus and/or is present in the cytoplasm or plasma membrane, which is consistence with the previous studies demonstrating diverse cellular compartments for FBP localization (Dill et al., 2004; Yan et al., 2011; Zhang et al., 2013; Zhou et al., 2015). The presence of the signal peptide in the N-terminal region of the proteins directs them to their final destination, i.e., plasma membrane or extracellular matrix (Blobel, 1980). The analysis demonstrated a lack of signal peptide in the protein sequence, thereby, eliminating its chance of being a classical secretory protein. Proteins lacking N-terminal signal peptides can have other kinds of sequences, which direct them to other cellular compartments like chloroplast, mitochondria, or peroxisomes, however, the TargetP tool could not detect such additional signal sequences. The analysis of the 3p.AtFBP113 protein sequence with cNLS mapper anticipated two different kinds of nuclear localizing signals that impact FBP localization and is in agreement with previous study results showing the importance of NLS in FBPs localization and their functions (Landry et al., 2012). The possibility of FBP to be a membrane protein was determined using various transmembrane (TM) predicting tools like TMHMM, HMMTOP, and Protter. All these prediction tools could not predict the presence of any potential TM helix in the protein sequence, which is necessary for qualifying as membrane protein thus supporting the possibility of nuclear and/or cytoplasmic localization of 3p.AtFBP113. The physicochemical properties of a protein are important not only for the execution of its functions but also provide significant information for setting up the experiment for protein isolation and crystallization (Mohanta et al., 2019). The detailed analysis of 3p.AtFBP113 protein sequence revealed that it has a molecular weight of 45 kDa and isoelectric point (pI) of 9.07 demonstrating its alkaline/basic nature (Table 1), which are important parameters for protein separation during electrophoresis (Mohanta et al., 2019). The instability index (<40), negative GRAVY score and high aliphatic index anticipated stable, hydrophilic/soluble nature, and high thermal stability of 3p.AtFBP113 (Table 1; Kyte and Doolittle, 1982; Rogers et al., 1986). Proteins are usually characterized by the presence of well-defined functional and structural units known as domains and folds respectively and a protein sequence can have one to several domains for the execution of their tasks, which classify them into diverse protein families (Schaeffer and Daggett, 2011; Punta et al., 2012). Virtually all domain prediction tools which were employed showed that the protein contains two distinct domains, i.e., F-box domain occupying the N-terminal region and FBA1/FBA3/FBA interaction domain at C-terminal region and belong to either F-box/F-box-like/FBA1 domain superfamily. Although all prediction tools successfully predicted different C-terminal domains in protein sequence, however, they occupy more or less the same positions (Figure 7). Moreover, the PFP-FunDSeqE web server output showed that the 3p.AtFBP113 sequence contains immunoglobulin-like fold, which is in agreement with previous findings (Kuroda et al., 2002). The immunoglobulin-like fold is characterized by the presence of two beta-sheets containing antiparallel beta-strands connected by disulfide bridge (Wang, 2013) and is known to involve in processes like binding and recognition of molecules (Halaby and Mornon, 1998). The prediction of the presence of immunoglobulin-like fold in 3p.AtFBA113 suggests that it may involve in protein binding and the presence of C-terminal FBA domain in 3p.AtFBA113 may function as a protein-protein interaction domain, which is a characteristic feature of many F-box proteins (Gagne et al., 2002).
Post/co-translational modifications introduce functional diversity in proteins and, therefore, regulate the cell environment (Karve and Cheema, 2011). Proteins undergo three main kinds of modifications during or after their translation namely glycosylation (the addition of sugar moiety), phosphorylation (transfer of phosphate group to the hydroxyl group of serine, threonine or tyrosine) and acetylation (transfer of acetyl group) among which glycosylation and phosphorylation are most prevalent in nature (Karve and Cheema, 2011). The results showed that 3p.AtFBP113 protein contains one potential residue for N-linked glycosylation and three potential residues for O-linked glycosylation. The proteins lacking N-terminal signal peptides do not experience glycosylation. Therefore, glycosylation of 3p.AtFBP113 in subcellular compartments, which is predicted to lack signal peptide, is not possible (West and Hart, 2017). However, the susceptibility of nucleo-cytoplasmic glycosylation cannot be neglected (West and Hart, 2017) and needs further experimental confirmation in this regard. Besides glycosylation, protein is predicted to contain 33 potential sites for phosphorylation, which include 22 Serine, 6 Threonine, and 5 Tyrosine residues (Table 2). However, residues with confidence values near 1 seem to have more potential for phosphorylation (Figure 8) and, therefore, warrant experimental analysis for determining the most suitable and significant phosphorylation site in the protein sequence.
The functional annotation of 3p.AtFBP113 via domain and motif prediction databases suggests its F-box protein with protein binding ability. The ARGOT2.5 output confirms the tentative annotation by identifying various GO terms among which the most significant terms were protein ubiquitination (GO:0016567), protein binding (GO:0005515), and proteasome complex, alpha-subunit complex (GO:0019773). In the cellular environment, the understating about biological and molecular functions a protein is performing requires the knowledge about the networks in which it is involved like PPI, gene regulation, and metabolic networks. However, reliable partners interacting with 3p.AtFBP113 could not be identified using the STRING database. Next, to further strengthen the aforementioned functional annotation in the biological context, digital co-expression analysis in a tissue-specific manner was carried to get insights into 3p.AtFBP113 probable function (Figure 9), which nowadays are increasingly used for annotating and inferring genes functions (D’Haeseleer et al., 2000; Aoki et al., 2007; Usadel et al., 2009; Morenorisueno et al., 2010; Li et al., 2015; Serin et al., 2016; Ma et al., 2018). The genes that exhibited strong similar expression patterns were mainly involved in cell division, protein phosphorylation, transportation, protein ubiquitination, and protein binding. These genes module further supports the possibility of involvement of 3p.AtFBP113 in protein binding and ubiquitination pathway during microgametogenesis. Various studies have shown that gametogenesis is a highly active process involving a large number of proteins and F-box mediated protein regulation by SCF-ubiquitin dependent protein degradation pathway during the process ensures tight regulation and progression of the cell cycle (Doronkin et al., 2003; Pagano, 2004; Genschik and Criqui, 2007; De La Chesnaye et al., 2008; Gusti et al., 2009; Kanatsu-Shinohara et al., 2014).
The knowledge of protein tertiary structure is of immense importance for understanding its molecular and biochemical functions (Chen, 2009). Due to the absence of suitable a PBD template for homology based structure prediction, I-TASSER, and Robetta servers were used for the generation of the good quality 3D structure of 3p.AtFBP113 (Figure 12). These 3D models can further be evaluated by introducing different genetic variations for determining their effects on its biological functions.
In this study, a new standard nomenclature system for naming the FBP genes has been proposed, which will introduce uniformity and will be helpful in communicating the research findings effectively. Besides, the present study is the first attempt in demonstrating the functional role of the sperm cell-specific F-box protein gene using advanced computational tools, which suggests it as an important player during the process of microgametogenesis and a potential target for hybrid breeding in future works. This study will serve as a roadmap for the experimental elucidation of the aforementioned functions of 3p.AtFBP113 and its 3D structure. As to the best of our knowledge, none of the FBA domain containing F-box protein has been targeted for 3D structural resolution using X-ray crystallographic or NMR spectroscopic techniques, hence our 3D structure can serve as a starting point for unlocking the structure-function relationship for this largest subfamily of FBPs. Such efforts will not only provide better insight into 3p.AtFBP113 functions but also serve as a reference for elucidating the functions of other FBP genes expressing in sperm cells or pollen grains with the ultimate goal of improving crop yields to ensure food security.
The original contributions presented in the study are included in the article/Supplementary Material, further inquiries can be directed to the corresponding author/s.
AM conceived the idea, designed the project, did all the experiments, analyzed and interpreted the data, and wrote the manuscript. AG, RA, FM, MB, SB, MH, RP, ZK, and HA provided their input and critically revised the manuscript. AG supervised the study and finalized the manuscript. All authors read and approved the final manuscript.
The authors declare that the research was conducted in the absence of any commercial or financial relationships that could be construed as a potential conflict of interest.
We thank Malik Muhammad Zohaib, who wrote down the genes coordinates and genes lengths for F-box protein gene family nomenclature, and Uzma Malik for helpful discussion regarding protein modeling.
The Supplementary Material for this article can be found online at: https://www.frontiersin.org/articles/10.3389/fgene.2020.609668/full#supplementary-material
Supplementary Table 1 | The proposed nomenclature of Arabidopsis thaliana F-box protein gene family.
Supplementary Table 2 | Gene Ontology (GO) based functional annotation of 3p.AtFBP113 using ARGOT2.5 server.
Supplementary Table 3 | Functional classification and annotation of genes co-expressed with 3p.AtFBP113 during microgametogenesis.
3D, three-dimensional; CDART, Conserved Domain Architecture Retrieval Tool; CDD, Conserved domain database; FBA, F-box associated domain; FBP, F-box protein; GO, gene ontology; SCF, Skp1-Cullin-F-box protein; SMART, Simple Modular Architecture Research Tool.
Abd-Hamid, N., Ahmad-Fauzi, M., Zainal, Z., and Ismail, I. (2020). Diverse and dynamic roles of F-box proteins in plant biology. Planta 251, 68. doi: 10.1007/s00425-020-03356-8
Alves-Ferreira, M., Wellmer, F., Banhara, A., Kumar, V., Riechmann, J. L., and Meyerowitz, E. M. (2007). Global expression profiling applied to analysis of Arabidopsis stamen development. Plant Physiol. 145, 747–762. doi: 10.1104/pp.107.104422
Aoki, K., Ogata, Y., and Shibata, D. (2007). Approaches for extracting practical information from gene co-expression networks in plant biology. Plant Cell Physiol. 48, 381–390. doi: 10.1093/pcp/pcm013
Armenteros, J. J. A., Salvatore, M., Emanuelsson, O., Winther, O., von Heijne, G., Elofsson, A., et al. (2019b). Detecting sequence signals in targeting peptide using deep learning. Life Sci. Alliance. 2:e201900429. doi: 10.26508/lsa.201900429
Armenteros, J. J. A., Sønderby, C. K., Sønderby, S. K., Nielsen, H., and Winther, O. (2017). DeepLoc: prediction of protein subcellular localization using deep learning. Bioinformatics 33, 3387–3395. doi: 10.1093/bioinformatics/btx431
Armenteros, J. J. A., Tsirigos, K. D., Sønderby, C. K., Petersen, T. N., Winther, O., Brunak, S., et al. (2019a). SignalP 5.0 improves signal peptide predictions using deep neural networks. Nat. Biotechnol. 37, 420–423. doi: 10.1038/s41587-019-0036-z
Austin, R. S., Hin, S., Waese, J., Ierullo, M., Pasha, A., Wang, T. T., et al. (2016). New BAR tools for mining expression data and exploring Cis-elements in Arabidopsis thaliana. Plant J. 8, 490–504. doi: 10.1111/tpj.13261
Bai, C., Sen, P., Hofmann, K., Ma, L., Goebl, M., Harper, J. W., et al. (1996). SKP1 Connects cell cycle regulators to the ubiquitin proteolysis machinery through a novel motif, the F-Box. Cell 86, 263–274. doi: 10.1016/S0092-8674(00)80098-7
Blobel, G. (1980). Intracellular protein topogenesis. Proc. Natl. Acad. Sci. U.S.A. 77, 1496–1500. doi: 10.1073/pnas.77.3.1496
Blom, N., Gammeltoft, S., and Brunak, S. (1999). Sequence- and structure-based prediction of eukaryotic protein phosphorylation sites. J. Mol. Biol. 294, 1351–1362. doi: 10.1006/jmbi.1999.3310
Borges, F., Gomes, G., Gardner, R., Moreno, N., McCormick, S., José, A., et al. (2008). Comparative transcriptomics of Arabidopsis sperm cells. Plant Physiol. 148, 1168–1181. doi: 10.1104/pp.108.125229
Butte, A. J., and Chen, D. (2013). “Translational Bioinformatics for Genomic Medicine,” in Genomic and Personalized Medicines, eds G. S. Ginburg and H. F. Willard (Cambridge, MA: Academic Press), 272–286.
Cardozo, T., and Pagano, M. (2004). The SCF ubiquitin ligase: Insights into a molecular machine. Nat. Rev. Mol. Cell Biol. 5, 739–751. doi: 10.1038/nrm1471
Chauhan, J. S., Rao, A., Gajendra, P., and Raghava, S. (2013). In silico platform for prediction of N-, O- and C-glycosites in eukaryotic protein sequences. PLoS One 8:e67008. doi: 10.1371/journal.pone.0067008
Chen, D. (2009). “Structural genomics: exploring the 3D protein landscape,” in Biomedical Computation Review (Simbios, the NIH National Center for Physics-Based Simulation of Biological Structures, Bethesda, ML: NIH), 11–18.
Colovos, C., and Yeates, T. O. (1993). Verification of protein structures: patterns of nonbonded atomic interactions. Protein Sci. 2, 1511–1519. doi: 10.1002/pro.5560020916
de Castro, E., Sigrist, C. J. A., Gattiker, A., Bulliard, V., Langendijk-Genevaux, P. S., Gasteiger, E., et al. (2006). ScanProsite: detection of PROSITE signature matches and ProRule-associated functional and structural residues in proteins. Nucl. Acids Res. 34, W362–W365. doi: 10.1093/nar/gkl124
De La Chesnaye, E., Kerr, B., Paredes, A., Merchant-Larios, H., Mendez, J. P., and Ojeda, S. R. (2008). Fbxw15/Fbxo12J is an F-box protein-encoding gene selectively expressed in oocytes of the mouse ovary. Biol. Reprod. 78, 714–725. doi: 10.1095/biolreprod.107.063826
de Pozo, J. C., and Estelle, M. (2000). F-box proteins and protein degradation: an emerging theme in cellular regulation. Plant Mol. Biol. 44, 123–128. doi: 10.1023/A:1006413007456
DeLano, W. L. (2002). PyMol: an open-source molecular graphics tool. CCP4 Newsl. Prot. Crystall 40, 82–92.
D’Haeseleer, P., Liang, S., and Somogyi, R. (2000). Genetic network inference: from co-expression clustering to reverse engineering. Bioinformatics 16, 707–726. doi: 10.1093/bioinformatics/16.8.707
Dill, A., Thomas, S. G., Hu, J., Steber, C. M., and Sun, T. (2004). The Arabidopsis F-Box protein SLEEPY1 targets gibberellin signaling repressors for gibberellin-induced degradation. Plant Cell 16, 1392–1405. doi: 10.1105/tpc.020958
Dönnes, P., and Höglund, A. (2016). Predicting protein subcellular localization: past, present, and future. Genom. Proteom. Bioinfo. 2, 209–215. doi: 10.1016/s1672-0229(04)02027-3
Doronkin, S., Djagaeva, I., and Beckendorf, S. K. (2003). The COP9 signalosome promotes degradation of Cyclin E during early Drosophila oogenesis. Dev. Cell 4, 699–710. doi: 10.1016/s1534-5807(03)00121-7
El-Gebali, S., Mistry, J., Bateman, A., Eddy, S. R., Luciani, A., Potter, S. C., et al. (2019). The Pfam protein families database in 2019. Nucl. Acids Res. 47, D427–D432. doi: 10.1093/nar/gky995
Fontana, P., Cestaro, A., Velasco, R., Formentin, E., and Toppo, S. (2009). Rapid annotation of anonymous sequences from genome projects using semantic similarities and a weighting scheme in gene ontology. PLoS One 4:e4619. doi: 10.1371/journal.pone.0004619
Gagne, J. M., Downes, B. P., Shiu, S. H., Durski, A. M., and Vierstra, R. D. (2002). The F-box subunit of the SCF E3 complex is encoded by a diverse superfamily of genes in Arabidopsis. Proc. Natl. Acad. Sci. U.S.A. 99, 11519–11524. doi: 10.1073/pnas.162339999
Geer, L. Y., Domrachev, M., Lipman, D. J., and Bryant, S. H. (2002). CDART: Protein homology by domain architecture. Genome Res. 12, 1619–1623. doi: 10.1101/gr.278202
Genschik, P., and Criqui, M. C. (2007). “The UPS: an engine that drives the cell cycle,” in Cell Cycle Control and Plant Development, ed. D. Inzé (Oxford: Blackwell Publishing), 87–113.
Gómze, J. F., Talle, B., and Wilson, Z. A. (2015). Anther and pollen development: a conserved developmental pathway. J. Integr. Plant Biol. 57, 876–891. doi: 10.111/jipb.12425
Gupta, S., Garg, V., Kant, C., and Bhatia, S. (2015). Genome-wide survey and expression analysis of F-box genes in chickpea. BMC Genomics 16:67. doi: 10.1186/s12864-015-1293-y
Gusti, A., Baumberger, N., Nowack, M., Pusch, S., Eisler, H., Potuschak, T., et al. (2009). The Arabidopsis thaliana F-Box protein FBL17 is essential for progression through the second mitosis during pollen development. PLoS One 4:e4780. doi: 10.1371/journal.pone.0004780
Halaby, D. M., and Mornon, J. P. (1998). The immunoglobulin superfamily: an insight on its tissular, species, and functional diversity. J. Mol. Evol. 46, 389–400. doi: 10.1007/pl00006318
Honys, D., and Twell, D. (2004). Transcriptome analysis of haploid male gametophyte development in Arabidopsis. Genome Biol. 5:R85. doi: 10.1186/gb-2004-5-11-r85
Hooper, C. M., Castleden, I., Tanz, S. K., Aryamanesh, N., and Millar, A. H. (2017). SUBA4: the interactive data analysis centre for Arabidopsis subcellular protein locations. Nucl. Acids Res. 45, D1064–D1074. doi: 10.1093/nar/gkw1041
Jain, M., Nijhawan, A., Arora, R., Agarwal, P., Ray, S., Sharma, P., et al. (2007). F-box proteins in rice. Genome-wide analysis, classification, temporal and spatial gene expression during panicle and seed development, and regulation by light and abiotic stress. Plant Physiol. 143, 1467–1483. doi: 10.1104/pp.106.091900
Jia, F., Wu, B., Li, H., Huang, J., and Zheng, C. (2013). Genome-wide identification and characterization of F-box family in maize. Mol. Genet. Genomics 288, 559–577. doi: 10.1007/s00438-013-0769-1
Jia, Q., Xiao, Z., Wong, F., Sun, S., Liang, K., and Lam, H. M. (2017). Genome-wide analyses of the soybean F-box gene family in response to salt stress. Int. J. Mol. Sci. 18:818. doi: 10.3390/ijms18040818
Jones, P., Binns, D., Chang, H.-Y., Fraser, M., Li, W., McAnulla, C., et al. (2014). InterProScan 5: genome-scale protein function classification. Bioinformatics 30, 1236–1240. doi: 10.1093/bioinformatics/btu031
Kanatsu-Shinohara, M., Onoyama, I., Nakayama, K. I., and Shinohara, T. (2014). Skp1-Cullin-F-box (SCF)-type ubiquitin ligase FBXW7 negatively regulates spermatogonial stem cell self-renewal. Proc. Natl. Acad. Sci. U.S.A. 111, 8826–8831. doi: 10.1073/pnas.1401837111
Karve, T. M., and Cheema, A. K. (2011). Small changes huge impact: the role of protein posttranslational modification in cellular homeostasis and disease. J. Amino Acids. 2011:207691. doi: 10.4061/2011/207691
Kiemer, L., Bendtsen, J. D., and Blom, N. (2005). NetAcet: prediction of N-terminal acetylation sites. Bioinformatics 21, 1269–1270. doi: 10.1093/bioinformatics/bti130
Kim, D. E., Chivian, D., and Baker, D. (2004). Protein structure prediction and alanysis using Robetta server. Nucl. Acid Res. 1, W526–W531. doi: 10.1093/nar/gkh468
Kim, H. J., Oh, S. A., Brownfield, L., Hong, S. H., Ryu, H., Hwang, I., et al. (2008). Control of plant germline proliferation by SCF(FBL17) degradation of cell cycle inhibitors. Nature 23, 1134–1137. doi: 10.1038/nature07289
Kim, O.-K., Jung, J.-H., and Park, C.-M. (2010). An Arabidopsis F-box protein regulates tapetum degeneration and pollen maturation during anther development. Planta 232, 253–266. doi: 10.1007/s00425-010-1178-x
Kim, Y. Y., Jung, K. W., Jeung, J. U., and Shin, J. S. (2012). A novel F-box protein represses endothecial secondary wall thickening for anther dehiscence in Arabidopsis thaliana. J. Plant Physiol. 169, 212–216. doi: 10.1016/j.jplph.2011.09.006
Kipreos, E. T., and Pagano, M. (2000). The F-box protein family. Genome Biol. 1:REVIEWS3002. doi: 10.1186/gb-2000-1-5-reviews3002
Kosugi, S., Hasebe, M., Tomita, M., and Yanahawa, H. (2009). Systematic identification of cell cycle-dependent yeast nucleocytoplasmic shuttling proteins by prediction of composite motifs. Proc. Natl. Acad. Sci. U.S.A. 106, 10171–10176. doi: 10.1073/pnas.0900604106
Krieger, E., Joo, K., Lee, J., Lee, J., Raman, S., Thompson, J., et al. (2009). Improving physical realism, stereochemistry and side-chain accuracy in homology modelling: four approaches that performed well in CASP8. Proteins 77, 114–122. doi: 10.1002/prot.22570
Krogh, A., Larsson, B., Heijne, G. V., and Sonnhammer, E. L. (2001). Predicting transmembrane protein topology with a hidden Markov model: application to complete genomes. J. Mol. Biol. 305, 567–580. doi: 10.1006/jmbi.2000.4315
Kuroda, H., Takahashi, N., Shimada, H., Seki, M., Shinozaki, K., and Minami, M. (2002). Classification and expression analysis of Arabidopsis F-Box-containing protein genes. Plant Cell Physiol. 43, 1073–1085. doi: 10.1093/pcp/pcf151
Kyte, J., and Doolittle, R. F. (1982). A simple method for displaying the hydropathic character of a protein. J. Mol. Biol. 157, 105–132. doi: 10.1016/0022-2836(82)90515-0
Landry, B. D., Doyle, J. P., Toczyski, D. P., and Benanti, J. A. (2012). F-box protein specificity for G1 cyclins is dedicated by subcellular localization. PLoS Genet 8:e1002851. doi: 10.1371/journal.pgen.1002851
Laskowski, R. A., MacArthur, M. W., Moss, D. S., and Thornton, J. M. (1993). PROCHECK - a program to check the stereochemical quality of protein structures. J. App. Cryst. 26, 283–291. doi: 10.1107/S0021889892009944
Letunic, I., Doerks, T., and Bork, P. (2015). SMART: Recent updates, new developments and status in 2015. Nucl. Acids Res. 43, D257–D260. doi: 10.1093/nar/gku949
Li, Y., Pearl, S. A., and Jackson, S. A. (2015). Gene networks in plant biology: approaches in reconstruction and analysis. Trends Plant Sci. 20, 664–675. doi: 10.1016/j.tplants.2015.06.013
Ma, X., Zhao, H., Xu, W., You, Q., Yan, H., Gao, Z., et al. (2018). Co-expression gene network analysis and functional module identification in bamboo growth and development. Front. Genet. 9:547. doi: 10.3389/fgene.2018.00574
Malik, A. (2011). Cloning, Sequencing and Transformation of OsGLP10-8q Under CaMV 35S Promoter Into Tobacco. M.Phil. Thesis, Pir Mehr Ali Shah Arid Agriculture University Rawalpindi, Rawalpindi, PK.
Marchler-Bauer, A., Lu, S., Anderson, J. B., Chitsaz, F., Derbyshire, M. K., DeWeese-Scott, C., et al. (2011). CDD: a conserved domain database for the functional annotation of proteins. Nucl. Acids Res. 39, D225–D229. doi: 10.1093/nar/gkq1189
McGuffin, L. J., Bryson, K., and Jones, D. T. (2000). The PSIPRED protein structure prediction server. Bioinformatics 16, 404–405. doi: 10.1093/bioinformatics/16.4.404
Mohamed, S. A. E. H., Elloumi, M., and Thompson, J. D. (2016). “Motif discovery in protein sequences,” in Pattern Recognition: Analysis and Applications, ed. S. Ramakrishnan (London: IntechOpen), doi: 10.5772/65441
Mohanta, T. K., Khan, A., Hashem, A., Abd Allah, E. F., and Al-Harrasi, A. (2019). The molecular mass and isoelectric point of plant proteomes. BMC Genomics 20:631. doi: 10.1186/s12864-019-5983-8
Morenorisueno, M. A., Busch, W., and Benfey, P. N. (2010). Omics meet networks- using systems approaches to infer regulatory networks in plants. Curr. Opin. Plant Biol. 13, 126–131. doi: 10.1016/j.pbi.2009.11.005
Oates, M. E., Stahlhacke, J., Vavoulis, D. V., Smither, B., Rackham, O. J. L., Sardar, A. J., et al. (2015). The SUPERFAMILY 1.75 database in 2014: a doubling of data. Nucl. Acids Res. 43, D227–D233. doi: 10.1093/nar/gku1041
Omasits, U., Ahrens, C. H., Müller, S., and Wollscheid, B. (2014). Protter: Interactive protein feature visualization and integration with experimental proteomic data. Bioinformatics 30, 884–886. doi: 10.1093/bioinformatics/btt607
Pagano, M. (2004). Control of DNA synthesis and mitosis by the Skp2-p27-Cdk1/2 axis. Mol. Cell 14, 414–416. doi: 10.1016/S1097-2765(04)00268-0
Pearce, S., Ferguson, A., King, J., and Wilson, Z. A. (2015). FlowerNet: a gene expression correlation network for anther and pollen development. Plant Physiol. 167, 1717–1730. doi: 10.1104/pp.114.253807
Punta, M., Coggil, P. C., Eberhardt, R. Y., Mistry, J., Tate, J., Boursnell, C., et al. (2012). The Pfam Protein families database. Nucl. Acid Res. 40, D290–D301. doi: 10.1093/nar/gkr1065
Rogers, S., Wells, R., and Rechsteiner, M. (1986). Amino acid sequences common to rapidly degraded proteins: the PEST hypothesis. Science 234, 364–368. doi: 10.1126/science.2876518
Sadanandom, A., Bailey, M., Ewan, R., Lee, J., and Nelis, S. (2012). The ubiquitin-proteasome system: central modifier of plant signaling. New Phytol. 196, 13–28. doi: 10.1111/j.1469-8137.2012.04266.x
Schaeffer, R. D., and Daggett, V. (2011). Protein folds and protein folding. Protein Eng. Des. Sel. 24, 11–19. doi: 10.1093/protein/gzq096
Serin, E. A. R., Harm, N., Hilhorst, H. W. M., and Wilco, L. (2016). Learning from co-expression networks: possibilities and challenges. Front. Plant Sci. 7:444. doi: 10.3389/fpls.2016.00444
Sharma, B., Joshi, D., Yadav, P. K., Gupta, A. K., and Bhatt, T. K. (2016). Role of ubiquitin-mediated degradation system in plant biology. Front. Plant Sci. 7:806. doi: 10.3389/fpls.2016.00806
Shen, H., and Chou, K. (2009). Predicting protein fold pattern with functional domain and sequential evolution information. J. Theor. Biol. 256, 441–446. doi: 10.1016/j.jtbi.2008.10.007
Song, J. B., Wang, Y. X., Li, H. B., Li, B. W., Zhou, Z. S., Gao, S., et al. (2015). The F-box family genes as key elements in response to salt, heavy metal and drought stresses in Medicago truncatula. Funct. Integr. Genomics 15, 495–507. doi: 10.1007/s10142-015-0438-z
Szklarczyk, D., Gable, A. L., Lyon, D., Junge, A., Wyder, S., Huerta-Cepas, J., et al. (2019). STRING v11: Protein-protein association networks with increased coverage, supporting functional discovery in genome-wide experimental datasets. Nucl. Acids Res. 47, D607–D613. doi: 10.1093/nar/gky1131
Tusnády, G. E., and Simon, I. (2001). The HMMTOP transmembrane topology prediction server. Bioinformatics 17, 849–850. doi: 10.1093/bioinformatics/17.9.849
Usadel, B., Obayashi, T., Mutwil, M., Giorgi, F. M., Bassel, G. W., Tanimoto, M., et al. (2009). Co-expression tools for plant biology: opportunities for hypothesis generation and caveats. Plant Cell Environ. 32, 1633–1651. doi: 10.1111/j.1365-3040.2009.02040.x
Waese, J., Fan, J., Pasha, A., Yu, H., Fucile, G., Shi, R., et al. (2017). ePlant: visualizing and exploring multiple levels of data for hypothesis generation in plant biology. Plant Cell 29, 1806–1821. doi: 10.1105/tpc.17.00073
Wang, J. H. (2013). The sequence signature of an Ig-fold. Protein Cell 4, 569–572. doi: 10.1007/s13238-013-3903-2
West, C. M., and Hart, G. W. (2017). “Nucleocytoplasmic Glycosylation,” in Essential of Glucobiology, eds A. Varki, R. D. Cummings, J. D. Esko, H. H. Freeze, P. Stanley, C. R. Bertozzi, et al. (Cold Spring Harbor, NY: Cold Spring Harbor Laboratory Press), doi: 10.1101/glycobiology.3e.018
Wiederstein, M., and Sippl, M. J. (2007). ProSA-web: interactive web service for the recognition of errors in three-dimensional structures of proteins. Nucl. Acids Res. 35, W407–W410. doi: 10.1093/nar/gkm290
Xiao, W., and Jang, J. (2000). F-box proteins in Arabidopsis. Trends Plant Sci. 5, 454–457. doi: 10.1016/S1360-1385(00)01769-6
Xu, G., Ma, H., Nei, M., and Kong, H. (2009). Evolution of F-box genes in plants: Different modes of sequence divergence and their relationships with functional diversification. Proc. Natl. Acad. Sci. U.S.A. 106, 835–840. doi: 10.1073/pnas.0812043106
Xu, J., Yang, C., Yuan, Z., Zhang, D., Gondwe, M. Y., Ding, Z., et al. (2010). The aborted microspores regulatory network is required for postmeiotic male reproductive development in Arabidopsis thaliana. Plant Cell 22, 91–107. doi: 10.1105/tpc.109.071803
Yan, Y. S., Chen, X. Y., Yang, K., Sun, Z. X., Fu, Y. P., Zhang, Y. M., et al. (2011). Overexpression of an F-box protein gene reduces abiotic stress tolerance and promotes root growth in rice. Mol. Plant 1, 190–197. doi: 10.1093/mp/ssq066
Yu, C. U., Chen, Y., Lu, C., and Hwang, J. (2006). Prediction of protein subcellular localization. Proteins 64, 643–651. doi: 10.1002/prot.21018
Zhang, S., Tian, Z., Li, H., Guo, Y., Zhang, Y., Roberts, J. A., et al. (2019). Genome wide analysis and characterization of F-box gene family in Gossypium hirsutum L. BMC Genomic 20:993. doi: 10.1186/s12864-019-6280-2
Zhang, X., Gou, M., and Liu, C. J. (2013). Arabidopsis Kelch repeat F-Box proteins regulate phenylpropanoid biosynthesis via controlling the turnover of phenylalanine ammonia-lyase. Plant Cell 25, 4994–5010. doi: 10.1105/tpc.113.119644
Zhang, Y. (2008). I-TASSER server for protein 3D structure prediction. BMC Bioinform. 9:40. doi: 10.1186/1471-2105-9-40
Zheng, N., Schulman, B. A., Song, L., Miller, J. J., Jeffrey, P. D., Wang, P., et al. (2002). Structure of the Cul1-Rbx1-Skp1-F boxSkp2 SCF ubiquitin ligase complex. Nature 416, 703–709. doi: 10.1038/416703a
Keywords: F-box protein, microgametogenesis, Arabidopsis thaliana, sperm cell, pollen grain, nomenclature
Citation: Malik A, Gul A, Amir R, Munir F, Babar MM, Bakhtiar SM, Hayat MQ, Paracha RZ, Khalid Z and Alipour H (2020) Classification and Computational Analysis of Arabidopsis thaliana Sperm Cell-Specific F-Box Protein Gene 3p.AtFBP113. Front. Genet. 11:609668. doi: 10.3389/fgene.2020.609668
Received: 23 September 2020; Accepted: 16 November 2020;
Published: 14 December 2020.
Edited by:
Million Tadege, Oklahoma State University, United StatesReviewed by:
Jianghua Chen, Key Laboratory of Tropical Plant Resource and Sustainable Use, Xishuangbanna Tropical Botanical Garden (CAS), ChinaCopyright © 2020 Malik, Gul, Amir, Munir, Babar, Bakhtiar, Hayat, Paracha, Khalid and Alipour. This is an open-access article distributed under the terms of the Creative Commons Attribution License (CC BY). The use, distribution or reproduction in other forums is permitted, provided the original author(s) and the copyright owner(s) are credited and that the original publication in this journal is cited, in accordance with accepted academic practice. No use, distribution or reproduction is permitted which does not comply with these terms.
*Correspondence: Alvina Gul, YWx2aW5hX2d1bEBhc2FiLm51c3QuZWR1LnBr; YWx2aW5hX2d1bEB5YWhvby5jb20=; Hadi Alipour, YWxpcG91cmhhZGk2NEBnbWFpbC5jb20=
Disclaimer: All claims expressed in this article are solely those of the authors and do not necessarily represent those of their affiliated organizations, or those of the publisher, the editors and the reviewers. Any product that may be evaluated in this article or claim that may be made by its manufacturer is not guaranteed or endorsed by the publisher.
Research integrity at Frontiers

Learn more about the work of our research integrity team to safeguard the quality of each article we publish.