- 1Henan Key Lab of Information-Based Electrical Appliances, Zhengzhou University of Light Industry, Zhengzhou, China
- 2State Key Laboratory of Esophageal Cancer Prevention & Treatment and Henan Key Laboratory for Esophageal Cancer Research of The First Affiliated Hospital, Zhengzhou University, Zhengzhou, China
The diagnosis of the degree of differentiation of tumor cells can help physicians to make timely detection and take appropriate treatment for the patient's condition. In this study, the original dataset is clustered into two independent types by the Kohonen clustering algorithm. One type is used as the development sets to find correlation indicators and establish predictive models of differentiation, while the other type is used as the validation sets to test the correlation indicators and models. In the development sets, thirteen indicators significantly associated with the degree of differentiation of esophageal squamous cell carcinoma are found by the Kohonen clustering algorithm. Thirteen relevant indicators are used as input features and the degree of tumor differentiations is used as output. Ten classification algorithms are used to predict the differentiation of esophageal squamous cell carcinoma. Artificial bee colony-support vector machine (ABC-SVM) predicts better than the other nine algorithms, with an average accuracy of 81.5% for the 10-fold cross-validation. Based on logistic regression and ReliefF algorithm, five models with the greater merit for the degree of differentiation are found in the development sets. The AUC values of the five models are 0.672, 0.628, 0.630, 0.628, and 0.608 (P < 0.05). The AUC values of the five models in the validation sets are 0.753, 0.728, 0.744, 0.776, and 0.868 (P < 0.0001). The predicted values of the five models are constructed as the input features of ABC-SVM. The accuracy of the 10-fold cross-validation reached 82.0 and 86.5% in the development sets and the validation sets, respectively.
1. Introduction
Esophageal squamous cell carcinoma (ESCC) is one of the most common malignant tumors in China, which has a high mortality rate (McCormack et al., 2017; Domingues et al., 2019; Hou et al., 2019). The degree of tumor cell differentiation of esophageal squamous cell carcinoma is an important reference information in cancer diagnosis and treatment. High differentiation means that the tumor cells are more similar to normal cells, the tumor is less malignant and less likely to metastasize. It is less sensitive to radiotherapy and chemotherapy and has better prognosis. The difference between low-differentiated cells and normal cells is very big, and the malignancy of tumor is relatively high. It is easy to metastasize in the clinical process, and it is more sensitive to radiotherapy and chemotherapy, so the prognosis is poor. As long as early detection and timely treatment can be done, the metastatic speed of tumor can be slowed down through integrated treatment of traditional Chinese and western medicine, and achieve better clinical efficacy (Cong et al., 2019).
Cancer cells have the characteristic of differentiating into normal cells (Tamaoki et al., 2018). In medicine, this feature is used by doctors to determine the degree of differentiation of tumor cells. After the patient's biopsy pathology, the malignancy and differentiation of the tumor are confirmed, by observing the characteristic state of tumor cells under a microscope. The traditional method of determining the degree of differentiation is complicated and needs to rely on human experience to make decisions (Maehara et al., 2018; Jadcherla et al., 2019). In this paper, we aim to develop a new model to predict the degree of differentiation of esophageal cancer patients based on blood indicators and tumor size parameters. The prediction model can better predict the degree of esophageal cancer tumor differentiation, which can assist professional physicians in making decisions and improve the clinical treatment effect.
The original dataset is clustered into two distinct datasets by the Kohonen algorithm. The first dataset is used to develop the prediction model for the degree of esophageal squamous cell carcinoma differentiation and the second dataset is used to validate the prediction model. First, in the development sets, the Kohonen clustering algorithm is used to cluster multiple indicators significantly associated with esophageal squamous cell carcinoma. Thirteen indicators significantly associated with the degree of esophageal squamous cell carcinoma differentiation are found. Based on these 13 indicators, 10 classification algorithms are used to predict the degree of differentiation. The results show that ABC-SVM predicts better than the other nine algorithms, with an average accuracy of 81.5% for the 10-fold cross-validation. Then, logistic regression and ReliefF algorithm are used to find five models that have greater predictive value for the degree of esophageal cancer differentiation. The AUC values of the five models in the development sets are 0.672, 0.628, 0.630, 0.628, and 0.608, with P-values less than 0.05. The AUC values of the five models in the validation sets are 0.753, 0.728, 0.744, 0.776, and 0.868, with P-values less than 0.0001. The results are shown that the five models have some predictive value for the differentiation of esophageal squamous cell carcinoma. The five models are constructed as ABC-SVM predictive features. The 10-fold cross-validation accuracy is achieved at 82.0 and 82.5% in the development sets and validation sets, respectively. The new features are constructed by the five models which have a high correlation with the degree of tumor differentiation of esophageal squamous cell carcinoma. And the ABC-SVM algorithm is used to predict the degree of tumor differentiation of esophageal squamous cell carcinoma which can achieve good results.
The main focus of this article is to investigate the indicators significantly associated with the degree of esophageal squamous cell carcinoma differentiation and to develop the model to predict the tumor differentiation of esophageal squamous cell carcinoma. By using Khonen clustering algorithm, ABC-SVM algorithm, logistic regression, ReliefF algorithm, and ROC curve method, the method for predicting the degree of esophageal squamous cell carcinoma differentiation is proposed. The main contributions of this article can be summarized as:
(1) Thirteen indicators associated with the degree of esophageal squamous cell carcinoma differentiation are found in the development sets and are validated in the external validation sets.
(2) Five models with predictive value for esophageal squamous cell carcinoma differentiation are found in the development sets and are validated in the external validation sets.
(3) Based on five prediction models, new features of differentiation degree are constructed and the degree of esophageal squamous cell carcinoma differentiation is well-predicted by ABC-SVM.
The rest of this paper is organized as follows. In section 2, the original data is analyzed and clustered. Thirteen indicators that are significantly correlated with the degree of differentiation are found and validated in section 3. Section 4 provides details of the process of developing and validating five models significantly associated with the degree of esophageal squamous cell carcinoma differentiation. And the five models are constructed as new features and are studied in development sets and validation sets. The conclusions are drawn in section 5.
2. Data Set Analysis
2.1. Data Introduction
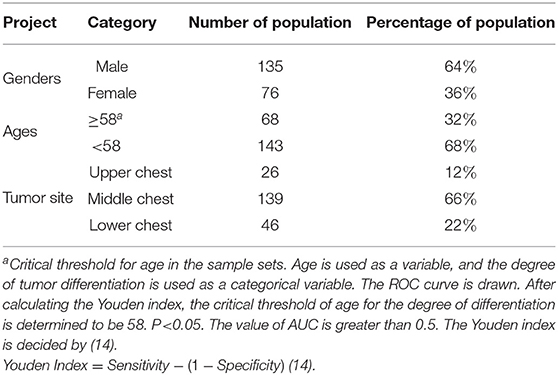
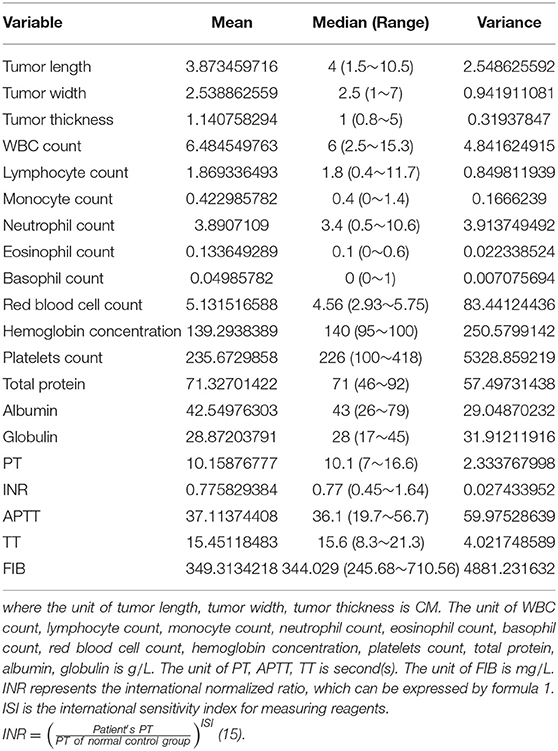
The original dataset for this study contains 211 samples, each with 21 indicators. The 21 indicators include: WBC count, lymphocyte count, monocyte count, neutrophil count, eosinophil count, basophil count, red blood cell count, hemoglobin concentration, platelets count, total protein, albumin, globulin, PT, INR, APTT, TT, FIB, tumor site, tumor length, tumor width, tumor thickness. The gender, age, tumor site information and the population proportions of the original data sets are shown in Table 1. The mean, median, range, and variance information of the 20 indicators in the original sample sets are shown in Table 2.
2.2. Clustering of Data Sets
In order to ensure that the predictive model has some predictive power and application, the method of Khonen clustering is used to cluster all the samples from the original dataset into two different categories of dataset. One type is used as the development sets to develop the prediction model for the degree of esophageal cancer differentiation. Another type is used as the validation sets to validate the developed prediction model.
The Kohonen neural network contains an input layer and a mapping layer. It is able to leverage network architecture to discover features and correlations of data sets (Pastukhov and Prokofiev, 2016). Data with similar characteristics are aggregated and clustered. The Kohonen algorithm is based on the principle of clustering objects with the same characteristics into one class. It not only handles large amounts of multivariate data with high dimensionality, but also preserves the important information implied by the original data (Kumar, 2017; Pasa et al., 2017).
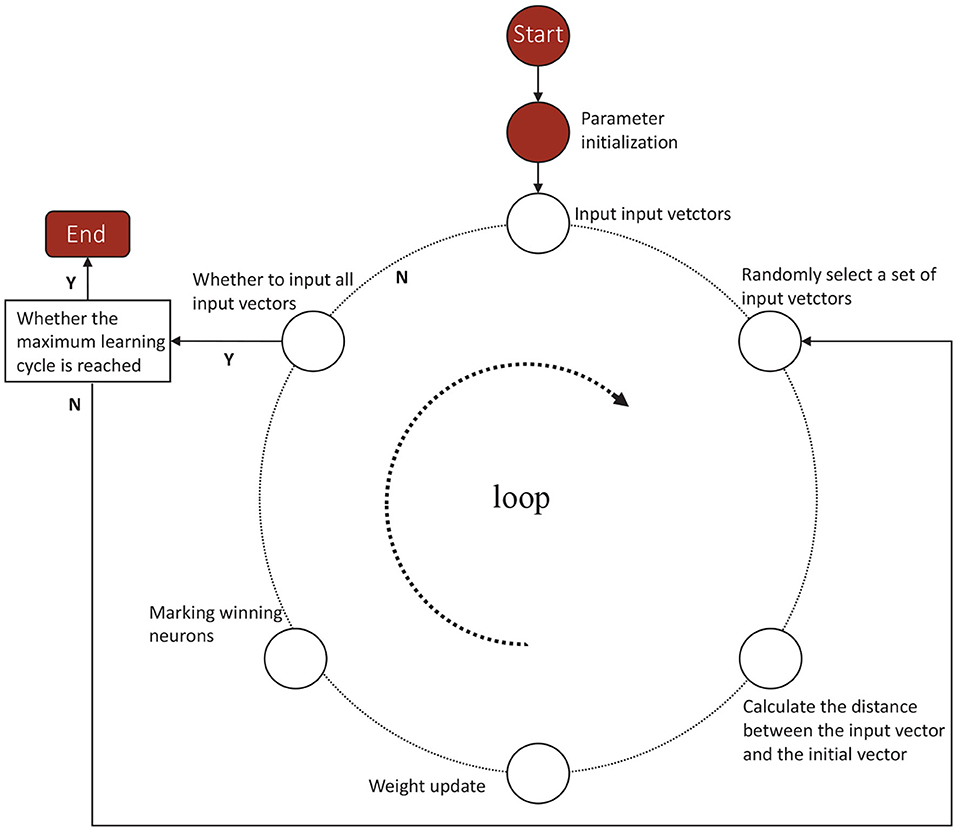
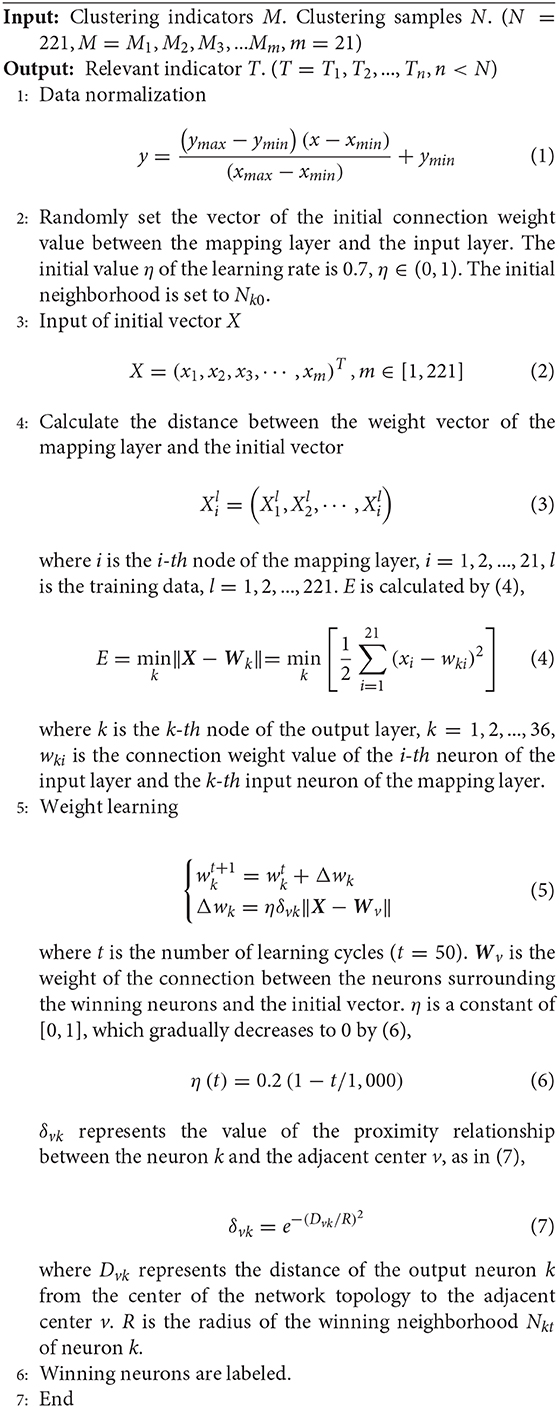
According to the competitive learning algorithm, the connection weights of the winning network's output neurons become stronger and stronger. In order to reduce the distance between the winning neuron and the input vector, the connection weights of neighboring neurons around the winning neuron are adjusted to be closer to the original input vector. Eventually different categories are gradually formed (Sun et al., 2020; Yang et al., 2020). As shown in Figure 1, a Kohonen neural network of 36–21 structure is established. The flow diagram of Kohonen neural network algorithm is shown in Figure 2. Algorithm 1 presents the main procedures of the Khonen neural network algorithm. In the Kohonen algorithm, N is set as 221 and m is given as 21. i is regarded as 21 and l is set as 221.
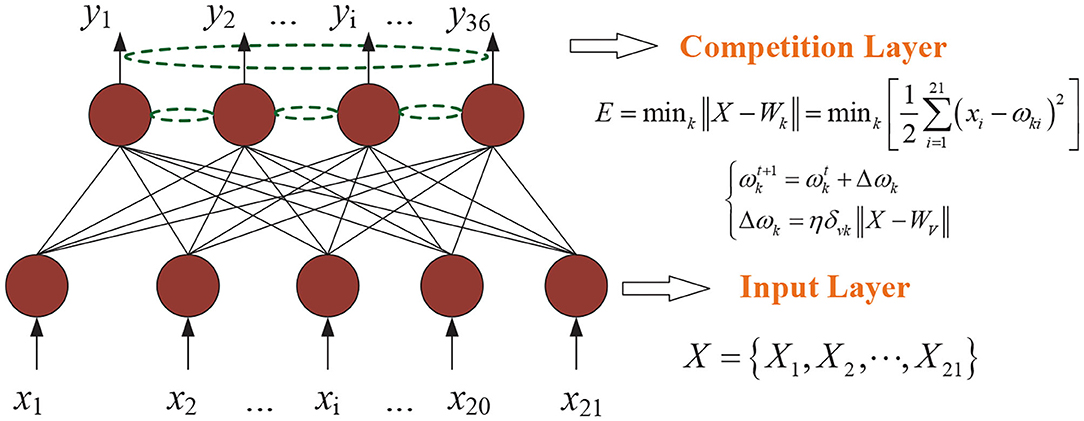
Figure 1. Khonen neural network of 36–21 structure. η is the learning rate. k represents the k-th node of the output layer and ω is regarded as the connection weight value. X stands for the initial vector and i is the i-th node of the input layer.
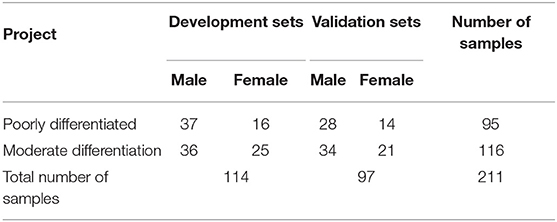
As shown in Table 3, the original dataset is partitioned into two separate datasets by the Kohonen clustering algorithm. These are two different classes of datasets, one as development sets and one as validation sets. The development sets contain 114 samples, with 53 low differentiation samples and 61 medium differentiation samples. Each sample contains 21 indicators. The validation sets contain 97 samples, with 40 samples for low differentiation and 57 samples for medium differentiation, each sample containing 21 indicators. The development sets is used to find indicators and prediction models that are significantly correlated with the degree of differentiation of esophageal squamous cell carcinoma. For the validation sets, on the one hand, it is used to validate the relevance of the indicators found in the development sets. On the other hand, it is used to validate the validity of the prediction models found in the development sets.
3. Correlation Analysis of Indicators
3.1. Clustering of Correlation Indicators
To ensure the rapidity and validity of the predictive model, 21 indicators need to be screened. The Kohonen clustering algorithm is used to screen the indicators that are significantly associated with the differentiation of esophageal squamous cell carcinoma. In the Kohonen algorithm, N is set as 21 and m is given as 114. i is regarded as 114 and l is set as 21.
According to the clustering results, 21 indicators are clustered by Kohonen clustering algorithm in the development sets, and finally 13 indicator that are significantly associated with the degree of esophageal cancer differentiation are found. The 13 indicators that are significantly correlated with the degree of differentiation are WBC count, lymphocyte count, monocyte count, neutrophil count, eosinophil count, basophil count, red blood cell count, PT, INR, tumor site, tumor length, tumor width, tumor thickness in Table 4.

Table 4. Information of 13 indicators that are significantly related to the degree of differentiation in the development sets.
3.2. Correlation Indicators Validation and ESCC Differentiation Prediction
In recent years, machine learning technology has developed rapidly and has outstanding performance in many fields (Jain et al., 2019; Parikh and Menon, 2019; Sahiner et al., 2019; Sun et al., 2019). Common classification algorithms include Support Vector Machine (SVM) (Hou et al., 2018), Classification And Regression Tree (CART), K-Nearest Neighbor (KNN), Ensemble algorithm, Extreme Learning Machine (ELM), etc. Different algorithms have their own unique advantages. Various classification prediction problems are successfully solved by these algorithms (McCoy and Auret, 2019; Wu and Zhao, 2019).
In order to verify the correlation between these thirteen indicators and the degree of differentiation of esophageal squamous cell carcinoma, the degree of differentiation is predicted based on 21 and 13 indicators, respectively. In this study, 10 different classification algorithms are used to predict the differentiation of esophageal squamous cell carcinoma. Ten classification algorithms used in this paper are SVM (Vadali et al., 2019), Quadratic Discriminant Analysis (QDA) (Siqueira et al., 2017), CART (Cheng et al., 2017), Linear Discriminant Analysis (LDA) (Liu et al., 2016), KNN (Suyundikov et al., 2015), Ensemble (Xiao et al., 2018), ELM (Sachnev et al., 2015), Particle Swarm Optimization-Support Vector Machine (PSO-SVM) (Jiang et al., 2010), Genetic Algorithm-Support Vector Machine (GA-SVM) (Tao et al., 2019), and ABC-SVM (Alshamlan et al., 2016). Thirteen and twenty-one indicators are used as input characteristics, respectively. And the degrees of differentiation of esophageal squamous cell carcinoma are used as the outputs. The average accuracy of the 10-fold cross-validation of 10 classification algorithms are shown in Table 5.
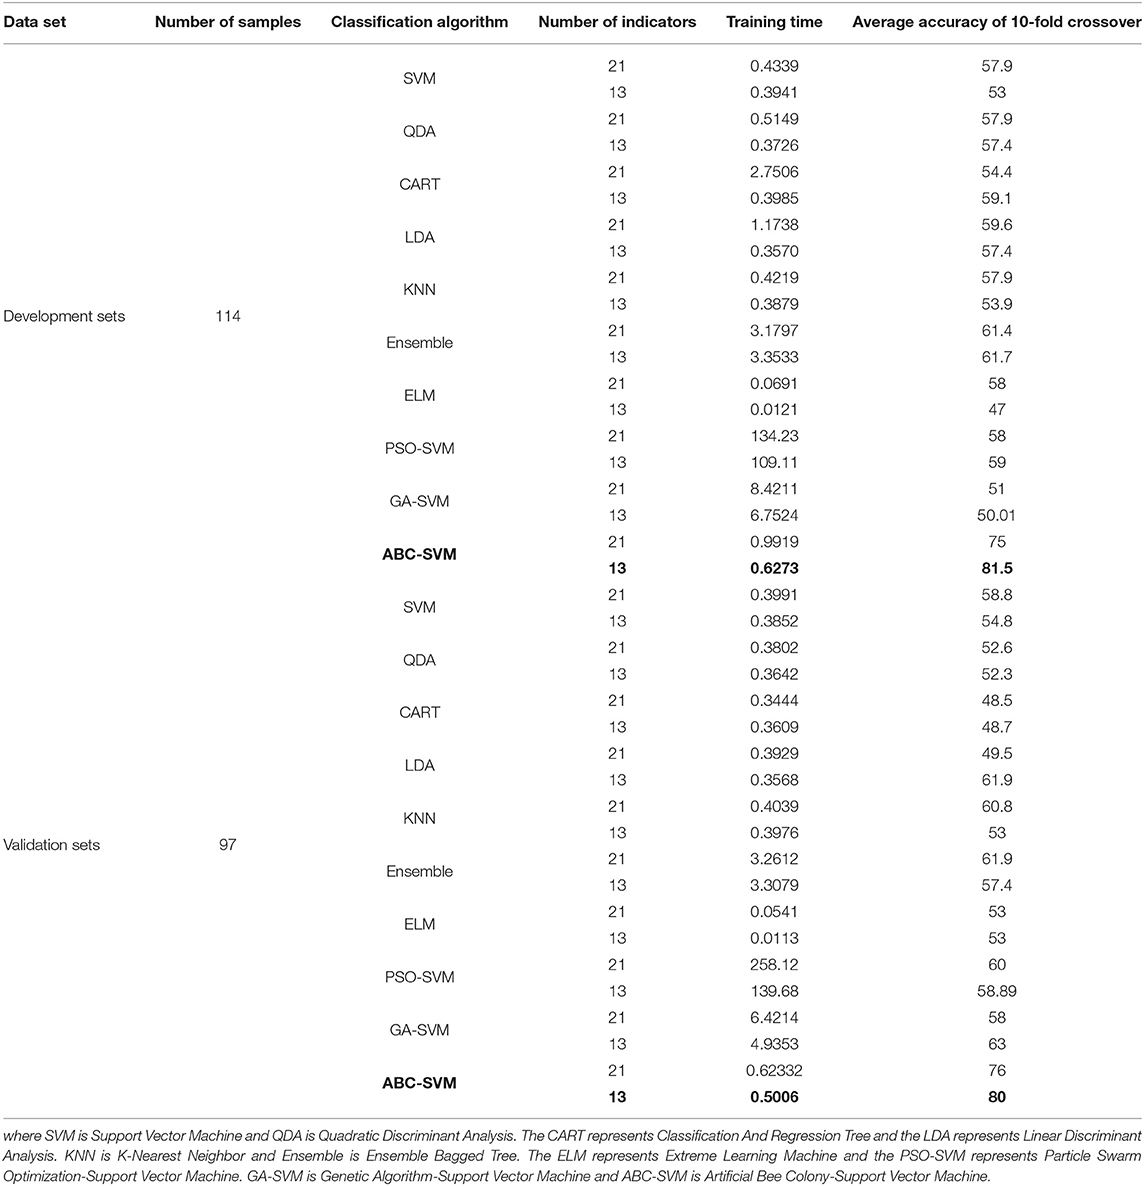
Table 5. The prediction results of the degree of differentiation of 10 classification algorithms based on 21 indicators and 13 indicators.
Cross-validation is used to test the accuracy of the algorithms. Ten-fold cross-validation is a commonly used method to test the classification performance of classifiers. Based on the large datasets, different algorithms are tested and it is shown that 10-fold is an appropriate choice to obtain the best error estimate. The dataset is divided into 10 parts, and nine of them are rotated for training and one for validation. The mean of the 10 times results is used as an estimate of the accuracy of the algorithm.
As shown in Table 5, the degree of differentiation of esophageal squamous cell carcinoma is predicted by 10 different classification algorithms in the development sets and validation sets, based on 21 and 13 indicators, respectively. The results show that ABC-SVM has a higher average accuracy than the other nine algorithms for 10-fold cross-validation and is more efficient in training. In the development sets, the average accuracy of the 10-fold cross-validation of ABC-SVM predicting the degree of differentiation based on 13 indicators is 81.5%. The average accuracy rate based on 21 indicators is only 75.0%. In the validation sets, the average accuracy of the 10-fold cross-validation of ABC-SVM predicting the degree of differentiation based on 13 indicators is 80.0%. The average accuracy rate based on 21 indicators is only 76.0%. Thus, these 13 indicators screened by the clustering algorithm have a higher correlation with the degree of tumor differentiation of esophageal squamous cell carcinoma. The 13 indicators screened by the clustering algorithm not only improved the prediction accuracy of the differentiation degree, but also reduced the training time of the classification algorithm and improved the training efficiency of the classification algorithm.
ABC algorithm is a widely used optimization algorithm. It can solve high dimensional and complex problems, and achieves good results in our study. In order to improve the classification efficiency of the SVM, the SVM parameters c and g are optimized by ABC. ABC-SVM not only has a few control parameters, but also achieves global optimum in solving complex high-dimensional problems. The ABC-SVM also has some limitations. It has slow running time when solving large sample data. Moreover, SVM is sensitive to the choice of parameters and kernel functions.
4. Development and Validation of the Predictive Model for the Degree of Differentiation of Esophageal Squamous Cell Carcinoma
4.1. Development of the Predictive Model for the Degree of Differentiation of ESCC
The data from the development sets are analyzed by using the multiple logistic regression approach. A multiple logistic regression model is a linear regression model with multiple independent variables. It is used to reveal the linear relationship between the dependent variable and multiple variables (Linfante et al., 2016; Sun et al., 2017). Its mathematical model can be formulated as
where Y is the dependent variable. β0 stands for constant. x1, x2, ..., xp represent independent variables. β1, β2, ..., βp are the weighting coefficients of the corresponding independent variables.
Thirteen indicators significantly associated with the degree of esophageal squamous cell carcinoma differentiation are used as inputs and the degree of differentiation as the output. The resulting model can be expressed as
where X1 represents the tumor site and X2 represents the tumor length. X3 is the tumor width and the X4 is the tumor thickness. X5 represents the WBC count and the X6 represents the lymphocyte count. X7 is the monocyte count and X9 is the eosinophil count. X11 represents the red blood cell count and X12 represents the PT. X13 represents the INR.
The receiver operating characteristic (ROC) curve is used in a wide range of applications. As a common analytical tool, the ROC curve not only to describe the discrimination accuracy of the prediction model, but also to find critical thresholds for classification (Mas, 2018; Obuchowski and Bullen, 2018; Sun et al., 2018; Luquefernandez et al., 2019). In this study, the ROC curve is used to test the predictive ability of the model. The ROC curve of Model 1 in the development sets is shown in Figure 3A. The ROC results for Model 1 in the development sets are shown in Table 6. The value of area under curve (AUC) is 0.672, larger than 0.5. P = 0.0007. It follows that Model 1 has some predictive value for the differentiation of esophageal squamous cell carcinoma.
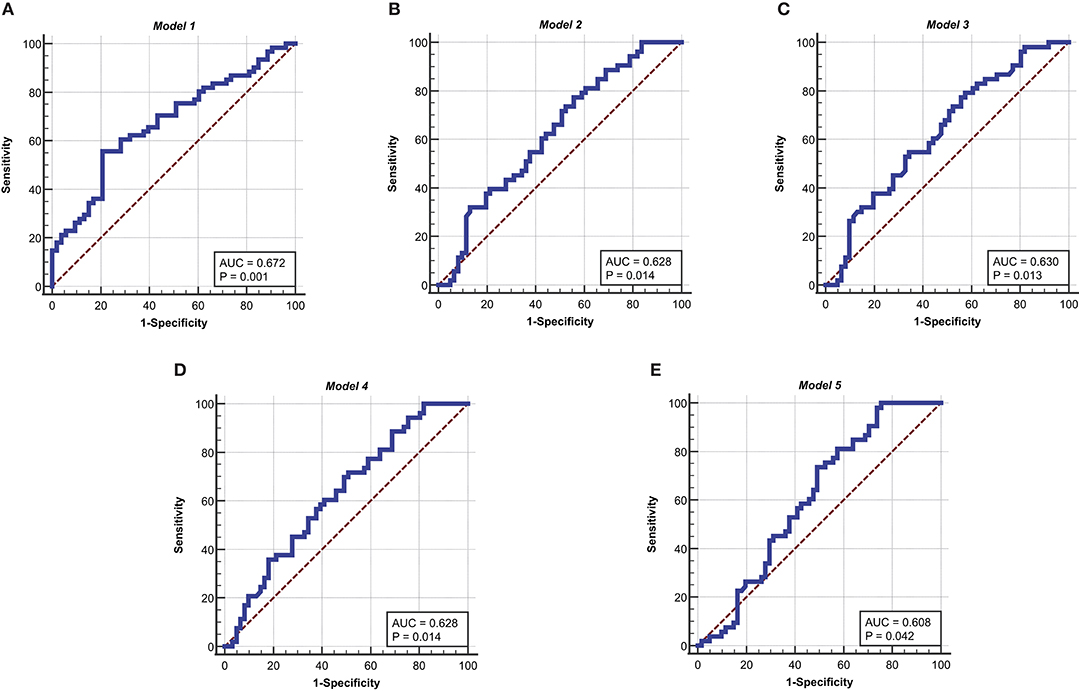
Figure 3. ROC curves for the five models in the development sets. (A) ROC curve of Model 1. (B) ROC curve of Model 2. (C) ROC curve of Model 3. (D) ROC curve of Model 4. (E) ROC curve of Model 5. The ordinate is “Sensitivity” and the abscissa is “1-Specificity,” the curves is clearly located at the upper left of the diagonal and has a good significance.
Then, the Kohonen algorithm is used again to obtain 5 indicators that are significantly related to the degree of differentiation. In the Kohonen algorithm, N is set as 13 and m is given as 114. i is regarded as 114 and l is set as 13. Thirteen indicators are clustered by Kohonen algorithm to obtain five relevant indicators, which are tumor thickness, monocyte count, eosinophil count, basophil count, and INR. Multiple logistic regression is used, with five correlation indicators as inputs and the degrees of differentiation as outputs. The Model 2 and the Model 3 are obtained. The Model 2 can be expressed by Equation (10). The Model 3 can be represented by Equation (11). The ROC curve of Model 2 and Model 3 in the development sets is shown in Figures 3B,C, respectively. The ROC results for Model 2 and Model 3 in the development sets are shown in Table 6. The value of area under curve (AUC) for Model 2 is 0.628, larger than 0.5. P = 0.0142. The value of area under curve (AUC) for Model 3 is 0.630, larger than 0.5. P = 0.013. The results show that Model 2 and Model 3 have good predictive value for the differentiation of esophageal squamous cell carcinoma.
where X1 is the tumor thickness and X2 is the monocyte count. X3 represents the eosinophil count and X4 represents the basophil count. X5 is the INR.
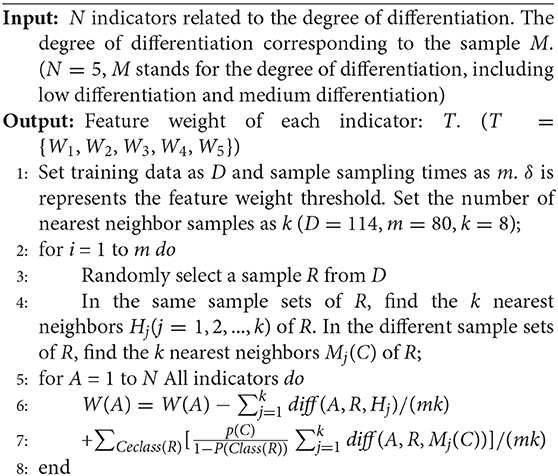
ReliefF is a feature weighting algorithm and runs efficiently. It has no restriction on the data type and assigns higher weight to all features that are highly correlated with the category (Palmamendoza et al., 2018; Urbanowicz et al., 2018). Algorithm 2 presents the main procedures of the ReliefF algorithm.
Five indicators significantly associated with esophageal squamous cell carcinoma are used as inputs and the degrees of differentiation as outputs. Model 4 and Model 5 are obtained by the ReliefF algorithm. The Model 4 is decided by (12). The Model 5 could be written as (13). The ROC curve of Model 4 and Model 5 in the development sets are shown in Figures 3D,E, respectively. The ROC results for Model 4 and Model 5 in the development sets are shown in Table 6. The value of area under curve (AUC) for Model 4 is 0.628, larger than 0.5. P = 0.0142. The value of area under curve (AUC) for Model 5 is 0.608, larger than 0.5. P = 0.0417. Therefore, Model 4 and Model 5 have some predictive value for the differentiation of esophageal squamous cell carcinoma.
where X1 is the tumor thickness and X2 is the monocyte count. X3 represents the eosinophil count and X4 represents the basophil count. X5 is the INR.
4.2. Validation of the Predictive Model for the Degree of Differentiation of ESCC
In this paper, in order to test the validity of the models, the five models obtained in the development sets are used for testing and evaluation in the validation sets. The ROC curves of Model 1, Model 2, Model 3, Model 4, and Model 5 are shown in Figures 4A–E, respectively. The ROC analysis of the five models in the validation sets are shown in Table 7. The results show that the five models in the validation sets also have good predictive value. The AUC values of the five models in the validation sets are 0.753, 0.728, 0.744, 0.776, and 0.868. The P-values for five models are less than 0.0001. Therefore, the five models have some application performance and potential predictive capability.
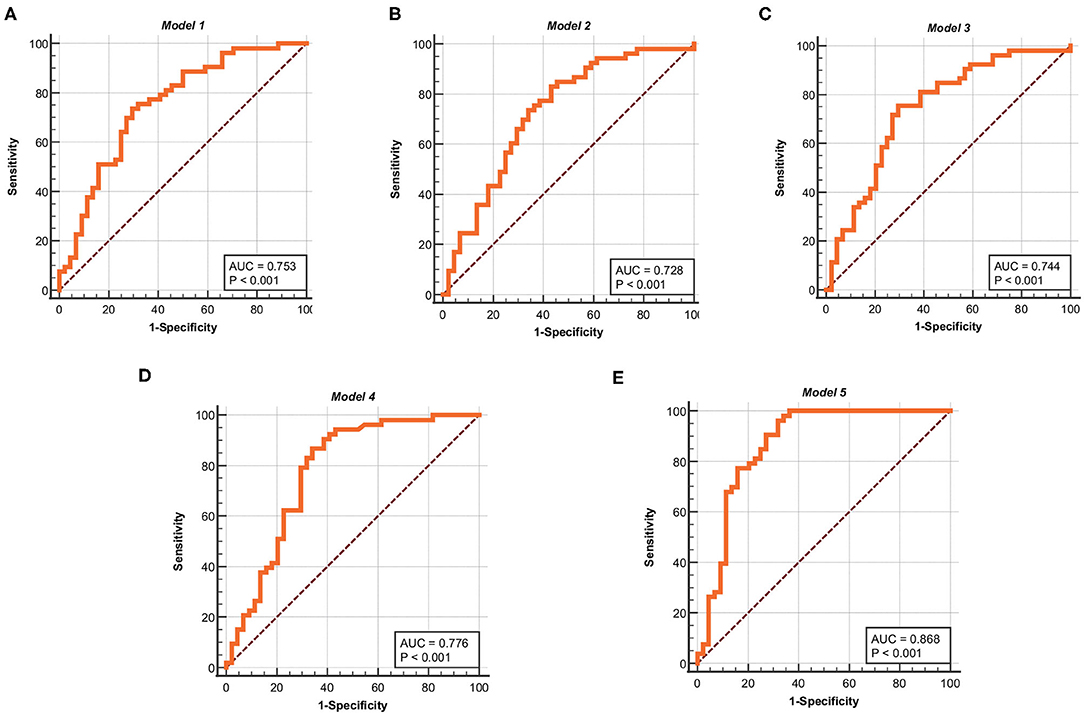
Figure 4. ROC curves for the five models in the validation sets. (A) ROC curve of Model 1. (B) ROC curve of Model 2. (C) ROC curve of Model 3. (D) ROC curve of Model 4. (E) ROC curve of Model 5. The ordinate is “Sensitivity” and the abscissa is “1-Specificity,” the curves is clearly located at the upper left of the diagonal and has a good significance.
4.3. Constructing New Features to Predict the Degree of Differentiation of ESCC
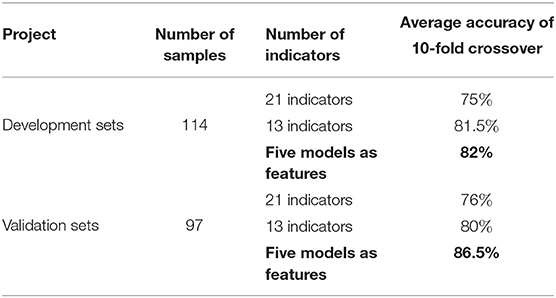
To better achieve the accurate prediction of the degree of esophageal squamous cell carcinoma differentiation, new features are constructed based on the five models obtained in this paper. The predict values of the five models are taken as input features and the degrees of differentiation as the outputs. The ABC-SVM algorithm is used to predict the degree of differentiation of esophageal squamous cell carcinoma. In the development sets, the average accuracy of the 10-fold cross-validation of the ABC-SVM based on the five models features is 82%. The average accuracy of the 10-fold cross-validation of the ABC-SVM based on 21 and 13 indicators is only 75 and 81.5%, respectively. In the validation sets, the average accuracy of the 10-fold cross-validation of the ABC-SVM model based on the five model features is 86.5%. The average accuracy of the 10-fold cross-validation of the ABC-SVM based on 21 and 13 indicators is only 76 and 80%, respectively. As shown in Table 8, the prediction accuracy is improved by combining the features of the five models. It reached 82 and 86.5% in the development sets and validation sets, respectively. Based on the new features of the five model constructs, the operational efficiency of the ABC-SVM is enhanced, and the prediction accuracy of esophageal squamous cell carcinoma differentiation is effectively improved.
5. Conclusions
In this paper, the Kokonen clustering algorithm, ABC-SVM, logistic regression, ReliefF, and ROC are used to analyze and predict the tumor differentiation of esophageal squamous cell carcinoma. Thirteen indicators significantly associated with esophageal squamous cell carcinoma are found in the development sets by the Kohonen clustering algorithm. Ten classification algorithms are used to predict the tumor differentiation of esophageal squamous cell carcinoma based on 13 significantly correlated indicators. The results showed that ABC-SVM have a good prediction performance, with the 10-fold cross-validation accuracy of 81.5%. Five models with high predictive value for esophageal squamous cell carcinoma differentiation are found in the development sets by the logistic regression and ReliefF algorithm. The AUC values of the five models in the development sets are 0.672, 0.628, 0.630, 0.628, and 0.608 (P < 0.05). The AUC values of the five models in the validation set are 0.753, 0.728, 0.744, 0.776, and 0.868 (P < 0.001). The five models are used as input features and the ABC-SVM algorithm is used to predict the degree of tumor differentiation. The 10-fold cross-validation accuracy of ABC-SVM in the development sets and validation sets is 82.0 and 86.5%, respectively. In this study, tumor differentiation of esophageal squamous cell carcinoma patients is effectively analyzed and predicted, which can assist physicians in their diagnostic decisions and provide timely diagnosis and effective treatment of patients.
Data Availability Statement
The datasets presented in this article are not readily available because the data used in the study are private and confidential data. Requests to access the datasets should be directed to Junwei Sun, anVud2Vpc3VuJiN4MDAwNDA7eWVhaC5uZXQ=.
Ethics Statement
Ethical review and approval was not required for the study on human participants in accordance with the local legislation and institutional requirements. The ethics committee waived the requirement of written informed consent for participation.
Author Contributions
All authors listed have made a substantial, direct and intellectual contribution to the work, and approved it for publication.
Funding
This work was supported in part by the National Key Research and Development Program of China for International S and T Cooperation Projects under Grant 2017YFE0103900, in part by the Joint Funds of the National Natural Science Foundation of China under Grant U1804262, in part by the State Key Program of National Natural Science of China under Grant 61632002, in part by the Foundation of Young Key Teachers from University of Henan Province under Grant 2018GGJS092, in part by the Youth Talent Lifting Project of Henan Province under Grant 2018HYTP016, in part by the Henan Province University Science and Technology Innovation Talent Support Plan under Grant 20HASTIT027, in part by the Zhongyuan Thousand Talents Program under Grant 204200510003, and in part by the Open Fund of State Key Laboratory of Esophageal Cancer Prevention and Treatment under Grant K2020-0010 and Grant K2020-0011.
Conflict of Interest
The authors declare that the research was conducted in the absence of any commercial or financial relationships that could be construed as a potential conflict of interest.
Acknowledgments
We acknowledge the Henan Key Lab of Information-Based Electrical Appliances, Zhengzhou University of Light Industry for providing environments conducive to research. We are grateful to State Key Laboratory of Esophageal Cancer Prevention & Treatment and Henan Key Laboratory for Esophageal Cancer Research of The First Affiliated Hospital, Zhengzhou University for providing data conducive to research.
Supplementary Material
The Supplementary Material for this article can be found online at: https://www.frontiersin.org/articles/10.3389/fgene.2020.595638/full#supplementary-material
References
Alshamlan, H. M., Badr, G., and Alohali, Y. (2016). ABC-SVM: artificial bee colony and SVM method for microarray gene selection and multi class cancer classification. Int. J. Mach. Learn. Comput. 6, 184–190. doi: 10.18178/ijmlc.2016.6.3.596
Cheng, Z., Nakatsugawa, M., Hu, C., Robertson, S. P., Hui, X., Moore, J. A., et al. (2017). Evaluation of classification and regression tree (CART) model in weight loss prediction following head and neck cancer radiation therapy. Adv. Radiat. Oncol. 3, 346–355. doi: 10.1016/j.adro.2017.11.006
Cong, Q., Li, G., Wang, Y., Zhang, S., and Zhang, H. (2019). DW-MRI for esophageal squamous cell carcinoma, correlations between ADC values with histologic differentiation and VEGF expression: a retrospective study. Oncol. Lett. 17, 2770–2776. doi: 10.3892/ol.2019.9934
Domingues, I., Sampaio, I. L., Duarte, H., Santos, J. A. M., and Abreu, P. H. (2019). Computer vision in esophageal cancer: a literature review. IEEE Access 7, 103080–103094. doi: 10.1109/ACCESS.2019.2930891
Hou, H., Meng, Z., Zhao, X., Ding, G., Sun, M., Wang, W., et al. (2019). Survival of esophageal cancer in China: a pooled analysis on hospital-based studies from 2000 to 2018. Front. Oncol. 9:548. doi: 10.3389/fonc.2019.00548
Hou, K., Shao, G., Wang, H., Zheng, L., Zhang, Q., Wu, S., et al. (2018). Research on practical power system stability analysis algorithm based on modified SVM. Protect. Control Modern Power Syst. 3:11. doi: 10.1186/s41601-018-0086-0
Jadcherla, S. R., Hanandeh, N., Hasenstab, K., and Nawaz, S. (2019). Differentiation of esophageal PH-impedance characteristics classified by the mucosal integrity marker in human neonates. Pediatr. Res. 85, 355–360. doi: 10.1038/s41390-018-0237-z
Jain, S., Mazaheri, B., Raviv, N., and Bruck, J. (2019). Cancer classification from healthy DNA using machine learning. bioRxiv. doi: 10.1101/517839. [Epub ahead of print].
Jiang, H., Tang, F., and Zhang, X. (2010). “Liver cancer identification based on PSO- SVM model,” in Automation, Robotics and Vision. ICARCV, 2519–2523. doi: 10.1109/ICARCV.2010.5707396
Kumar, K. (2017). Application of the Kohonen map analysis (KMA) on chromatographic datasets to achieve unsupervised classification of olive and non-olive oil samples: a novel approach. Anal. Methods 9, 6386–6393. doi: 10.1039/C7AY01963G
Linfante, I., Starosciak, A., Walker, G., Dabus, G., Castonguay, A. C., Gupta, R., et al. (2016). Predictors of poor outcome despite recanalization: a multiple regression analysis of the NASA registry. J. NeuroIntervent. Surg. 8, 224–229. doi: 10.1136/neurintsurg-2014-011525
Liu, W., Sun, Z., Chen, J., and Jing, C. (2016). Raman spectroscopy in colorectal cancer diagnostics: comparison of PCA-LDA and PLS-DA models. Spectroscopy 2016, 1–6. doi: 10.1155/2016/1603609
Luquefernandez, M. A., Redondosanchez, D., and Maringe, C. (2019). CVAUROC: stata module to compute cross-validated area under the curve for ROC analysis after predictive modelling for binary outcomes. Stata J. 19, 615–625. doi: 10.1177/1536867X19874237
Maehara, R., Fujikura, K., Takeuchi, K., Akita, M., Abesuzuki, S., Karbanova, J., et al. (2018). Sox2-silenced squamous cell carcinoma: a highly malignant form of esophageal cancer with sox2 promoter hypermethylation. Modern Pathol. 31, 83–92. doi: 10.1038/modpathol.2017.112
Mas, J. (2018). Receiver Operating Characteristic (ROC) Analysis. Cham: Springer International Publishing. doi: 10.1007/978-3-319-60801-3_30
Mccormack, V., Menya, D., Munishi, M. O., Dzamalala, C., Gasmelseed, N., Roux, M. L., et al. (2017). Informing etiologic research priorities for squamous cell esophageal cancer in Africa: a review of setting-specific exposures to known and putative risk factors. Int. J. Cancer 140, 259–271. doi: 10.1002/ijc.30292
McCoy, J. T., and Auret, L. (2019). Machine learning applications in minerals processing: a review. Miner. Eng. 132, 95–109. doi: 10.1016/j.mineng.2018.12.004
Obuchowski, N. A., and Bullen, J. (2018). Receiver operating characteristic (ROC) curves: review of methods with applications in diagnostic medicine. Phys. Med. Biol. 63:1–28. doi: 10.1088/1361-6560/aab4b1
Palmamendoza, R., Rodriguez, D., and Demarcos, L. (2018). Distributed reliefF-based feature selection in spark. Knowl. Inform. Syst. 57, 1–20. doi: 10.1007/s10115-017-1145-y
Parikh, D., and Menon, V. (2019). Machine learning applied to cervical cancer data. Int. J. Math. Sci. Comput. 5, 53–64. doi: 10.5815/ijmsc.2019.01.05
Pasa, L. A., Costa, J. A. F., and Medeiros, M. G. d. (2017). An ensemble algorithm for Kohonen self-organizing map with different sizes. Logic J. IGPL 25, 1020–1033. doi: 10.1093/jigpal/jzx046
Pastukhov, A. A., and Prokofiev, A. A. (2016). Kohonen self-organizing map application to representative sample formation in the training of the multilayer perceptron. St Petersburg Polytech. Univers. J. Phys. Math. 2, 134–143. doi: 10.1016/j.spjpm.2016.05.012
Sachnev, V., Saraswathi, S., Niaz, R., Kloczkowski, A., and Suresh, S. (2015). Multi-class BCGA-ELM based classifier that identifies biomarkers associated with hallmarks of cancer. BMC Bioinformatics 16:166. doi: 10.1186/s12859-015-0565-5
Sahiner, B., Pezeshk, A., Hadjiiski, L. M., Wang, X., Drukker, K., Cha, K. H., et al. (2019). Deep learning in medical imaging and radiation therapy. Med. Phys. 46:e1–e36. doi: 10.1002/mp.13264
Siqueira, L. F. S., Junior, R. F. D. A., De Araujo, A. A., Morais, C. L., and Lima, K. M. G. (2017). LDA vs. QDA for FT-MIR prostate cancer tissue classification. Chemometr. Intell. Lab. Syst. 162, 123–129. doi: 10.1016/j.chemolab.2017.01.021
Sun, J., Han, G., Zeng, Z., and Wang, Y. (2019). Memristor-based neural network circuit of full-function Pavlov associative memory with time delay and variable learning rate. IEEE Trans. Cybernet. 50, 2935–2945. doi: 10.1109/TCYB.2019.2951520
Sun, J., Wu, Y., Cui, G., and Wang, Y. (2017). Finite-time real combination synchronization of three complex-variable chaotic systems with unknown parameters via sliding mode control. Nonlinear Dyn. 88, 1677–1690. doi: 10.1007/s11071-017-3338-z
Sun, J., Yang, Y., Wang, Y., Wang, L., Song, X., and Zhao, X. (2020). Survival risk prediction of esophageal cancer based on self-organizing maps clustering and support vector machine ensembles. IEEE Access. 8, 131449–131460. doi: 10.1109/ACCESS.2020.3007785
Sun, J., Zhao, X., Fang, J., and Wang, Y. (2018). Autonomous memristor chaotic systems of infinite chaotic attractors and circuitry realization. Nonlinear Dyn. 94, 2879–2887. doi: 10.1007/s11071-018-4531-4
Suyundikov, A., Stevens, J., Corcoran, C., Herrick, J. S., Wolff, R. K., and Slattery, M. L. (2015). Accounting for dependence induced by weighted KNN imputation in paired samples, motivated by a colorectal cancer study. PLoS ONE 10:e0119876. doi: 10.1371/journal.pone.0119876
Tamaoki, M., Komatsuzaki, R., Komatsu, M., Minashi, K., Aoyagi, K., Nishimura, T., et al. (2018). Multiple roles of single-minded 2 in esophageal squamous cell carcinoma and its clinical implications. Cancer Sci. 109, 1121–1134. doi: 10.1111/cas.13531
Tao, Z., Huiling, L., Wenwen, W., and Xia, Y. (2019). GA-SVM based feature selection and parameter optimization in hospitalization expense modeling. Appl. Soft Comput. 75, 323–332. doi: 10.1016/j.asoc.2018.11.001
Urbanowicz, R. J., Meeker, M., La Cava, W., Olson, R. S., and Moore, J. H. (2018). Relief-based feature selection: Introduction and review. J. Biomed. Inform. 85, 189–203. doi: 10.1016/j.jbi.2018.07.014
Vadali, S., Deekshitulu, G. V. S. R., and Murthy, J. V. R. (2019). Analysis of liver cancer using data mining SVM algorithm in MATLAB. Adv. Intell. Syst. Comput. 816, 163–175. doi: 10.1007/978-981-13-1592-3_12
Wu, J., and Zhao, Y. (2019). Machine learning technology in the application of genome analysis: a systematic review. Gene 705, 149–156. doi: 10.1016/j.gene.2019.04.062
Xiao, Y., Wu, J., Lin, Z., and Zhao, X. (2018). A deep learning-based multi-model ensemble method for cancer prediction. Comput. Methods Prog. Biomed. 153, 1–9. doi: 10.1016/j.cmpb.2017.09.005
Keywords: ESCC, degree of differentiation, prediction model, clustering algorithm, ABC-SVM, ROC, ReliefF algorithm
Citation: Wang Y, Yang Y, Sun J, Wang L, Song X and Zhao X (2020) Development and Validation of the Predictive Model for Esophageal Squamous Cell Carcinoma Differentiation Degree. Front. Genet. 11:595638. doi: 10.3389/fgene.2020.595638
Received: 19 August 2020; Accepted: 25 September 2020;
Published: 23 October 2020.
Edited by:
Quan Zou, University of Electronic Science and Technology of China, ChinaReviewed by:
Linqiang Pan, Huazhong University of Science and Technology, ChinaXingyi Zhang, Anhui University, China
Copyright © 2020 Wang, Yang, Sun, Wang, Song and Zhao. This is an open-access article distributed under the terms of the Creative Commons Attribution License (CC BY). The use, distribution or reproduction in other forums is permitted, provided the original author(s) and the copyright owner(s) are credited and that the original publication in this journal is cited, in accordance with accepted academic practice. No use, distribution or reproduction is permitted which does not comply with these terms.
*Correspondence: Junwei Sun, anVud2Vpc3VuJiN4MDAwNDA7eWVhaC5uZXQ=
 Yanfeng Wang1
 Yuli Yang