
95% of researchers rate our articles as excellent or good
Learn more about the work of our research integrity team to safeguard the quality of each article we publish.
Find out more
ORIGINAL RESEARCH article
Front. Genet. , 14 December 2020
Sec. Systems Biology Archive
Volume 11 - 2020 | https://doi.org/10.3389/fgene.2020.573877
This article is part of the Research Topic Analysis of Bioinformatics Tools in Systems Genetics View all 10 articles
 Xiaoyao Liu1
 Mingjing Yin1Xinpeng Liu1Junlong Da1Kai Zhang1Xinjian Zhang1Lixue Liu1Jianqun Wang1Han Jin1Zhongshuang Liu1Bin Zhang1,2*Ying Li1*
Stem cells from fetal tissue protect against aging and possess greater proliferative capacity than their adult counterparts. These cells can more readily expand in vitro and senesce later in culture. However, the underlying molecular mechanisms for these differences are still not fully understood. In this study, we used a robust rank aggregation (RRA) method to discover robust differentially expressed genes (DEGs) between fetal bone marrow mesenchymal stem cells (fMSCs) and aged adult bone marrow mesenchymal stem cells (aMSCs). Multiple methods, including gene set enrichment analysis (GSEA), Gene Ontology (GO) analysis, and Kyoto Encyclopedia of Genes and Genomes (KEGG) pathway analysis were performed for functional annotation of the robust DEGs, and the results were visualized using the R software. The hub genes and other genes with which they interacted directly were detected by protein–protein interaction (PPI) network analysis. Correlation of gene expression was measured by Pearson correlation coefficient. A total of 388 up-regulated and 289 down-regulated DEGs were identified between aMSCs and fMSCs. We found that the down-regulated genes were mainly involved in the cell cycle, telomerase activity, and stem cell proliferation. The up-regulated DEGs were associated with cell adhesion molecules, extracellular matrix (ECM)–receptor interactions, and the immune response. We screened out four hub genes, MYC, KIF20A, HLA-DRA, and HLA-DPA1, through PPI-network analysis. The MYC gene was negatively correlated with TXNIP, an age-related gene, and KIF20A was extensively involved in the cell cycle. The results suggested that MSCs derived from the bone marrow of an elderly donor present a pro-inflammatory phenotype compared with that of fMSCs, and the HLA-DRA and HLA-DPA1 genes are related to the immune response. These findings provide new insights into the differences between aMSCs and fMSCs and may suggest novel strategies for ex vivo expansion and application of adult MSCs.
Stem cells can be isolated at all stages of ontogeny, from the early developing embryo to the post-reproductive adult organism. Adult stem cells are less potent than embryonic stem cells, but still play a very important role in maintaining overall health (Jin, 2017). Adult bone marrow was the first source of mesenchymal stem cells (MSCs) to be identified and is still by far the best characterized (Friedenstein et al., 1987; Kolf et al., 2007; Lv et al., 2014). These cells hold great promise as seed cells in tissue engineering and regenerative medicine, based on their self-renewal, multi-differentiation, and immunoregulation abilities (Dogan et al., 2014; Wei et al., 2015; Castagnini et al., 2016; Mehrabani et al., 2016). However, there is growing evidence that demonstrates that the number of bone marrow-derived MSCs is limited and declines with the age of the donor (Dexheimer et al., 2011). Thus, long-term cell culture is needed to obtain large numbers of cells suitable for clinical applications. However, MSCs may undergo senescence, as well as impaired function during ex vivo expansion (Turinetto et al., 2016).
Although fetal and adult MSCs share the same morphology and surface molecules, previous studies have shown that MSCs from fetal tissues are more adaptable, with greater self-renewal capacity, both in vivo and in vitro (O’Donoghue and Fisk, 2004; Guillot et al., 2007; Ding et al., 2011). The prevalence of MSCs in fetal bone marrow is significantly higher than that in adult tissue (O’Donoghue and Fisk, 2004; Ding et al., 2011). Fetal MSCs are readily expandable in vitro, with a shorter doubling time, and display no obvious change in phenotype after 20 passages (Campagnoli et al., 2001). Existing research recognizes the critical role telomerase plays in self-renewal and the replicative potential of stem cells (Hayflick, 2000). Comparative studies of fetal liver hematopoietic stem cells (HSCs) and adult bone marrow HSCs have confirmed that fetal stem cells have higher telomerase activity and again suggest that proliferative potential is limited and declines with age (Verfaillie et al., 2002). In addition, telomere length is longer in fetal MSCs (Xu et al., 2016).
Another advantage of MSCs is their immunomodulatory properties (Chen et al., 2011; Andrzejewska et al., 2019). Bone marrow MSCs (BM-MSCs) from both adults and fetuses reportedly possess immune-suppressive effects. Fetal MSCs display immunological inertness and appear to have stronger immunomodulatory abilities than their adult counterparts (Götherström et al., 2005; Chang et al., 2006).
Mesenchymal stem cells isolated from fetal tissue may therefore have greater potential for clinical application, but the exact mechanisms by which they exert their effects are still not very clear. Moreover, the application of fetal tissue is not widely accepted and is still being debated. Understanding the difference between fetal and adult stem cells and their regulatory mechanisms may provide new insights for the clinical application of adult stem cells.
In this study, two existing datasets from Gene Expression Omnibus (GEO) were analyzed by the robust rank aggregation (RRA) method, which facilitates the detection of genes that are ranked consistently in multiple datasets and assigns a significance score for each gene (Reimand et al., 2010). This method was used to identify robust differentially expressed genes (DEGs) between MSCs derived from elderly adult bone marrow and fetal bone marrow. Functions of these robust DEGs were then explored by gene set enrichment analysis (GSEA), Gene Ontology (GO), and Kyoto Encyclopedia of Genes and Genomes (KEGG) analyses. Using protein–protein interaction (PPI) network analysis, we screened out four hub genes, MYC, KIF20A, HLA-DRA, and HLA-DPA1, which were closely related to function. Furthermore, GO and KEGG enrichment analyses were utilized to verify potential biological functions of hub genes and their first neighbors.
All available datasets were acquired from the GEO database1. The screening criteria of datasets were inclusion of gene expression data of BM-MSCs from fetal and aged donors. Eventually, two datasets, GSE97311 (Spitzhorn et al., 2019) and GSE68374 (Paciejewska et al., 2016), were included in the study. Series matrix files and platform information of GSE97311 and GSE68374 were downloaded from the GEO database for further study. The GSE97311 dataset contained three fetal femur-derived MSC samples and four adult MSC samples. The GSE68374 dataset included three biological replicates for both fetal and adult bone marrow-derived MSC samples.
The microarray data of GSE97311 and GSE68374 were initially normalized and differential expression was analyzed using the R software though the “limma” package (Ritchie et al., 2015). The results were presented on a volcano plot (Li, 2012). We then used the “RobustRankAggreg” package (Reimand et al., 2010) to integrate the differential expression results of the two datasets to identify the robust DEGs. As this RRA method screens genes ranked consistently better than expected based on null hypothesis of uncorrelated inputs, batch effect correction is not needed (Liu et al., 2018). Benjamini–Hochberg’s method was used to control the false discovery rate (FDR). The P-value of each gene represents its ranking in the final gene list. Genes with a P-value < 0.05 and | logFC| > 1 in the final list were considered significant DEGs for the next mining. The R package “pheatmap” was used to visualize expression patterns of the top 40 DEGS (top 20 up-regulated genes and top 20 down-regulated genes) from RRA analysis.
The following sets were downloaded from the Molecular Signatures Database version 7.12 : H.all.v7.symbles.gmt, c2.cp.kegg.v7.1.symbols.gmt, and other interesting gene sets involved in the oxidative response, production of interleukin 6, telomerase activity, and stem cell self-renewal in c5.bp.v7.1.symbols.gmt. The GseaPreranked tool was then used to perform enrichment analysis for all the DEGs integrated via RRA method, which are ranked by log FC from large to small. Gene set permutations were performed 1000 times for each analysis. We then visualized the results of GSEA using “ggplot2” in the R package (Ito and Murphy, 2013).
BinGO (Maere et al., 2005), a plug-in of Cytoscape, was used for GO enrichment. The KEGG pathway analyses were conducted by the R package “clusterprofiler” (Yu et al., 2012). The GO terms and KEGG pathways with adjusted P-value < 0.05 were considered statistically significant and visualized by the “GOplot” package (Walter et al., 2015). The Z-score was calculated, which hinted at whether the biological process (or/molecular function/cellular component) or KEGG pathway was more likely to be reduced (negative value) or increased (positive value).
The DEGs with P < 0.001 were defined as the most robust DEGs and uploaded to the STRING database to establish a PPI network (Szklarczyk et al., 2017). Interaction scores > 0.4 were set as the cut-off point. The STRING analysis results were then imported into the Cytoscape software version 3.8.0, and the network was ranked by degree and betweenness methods using the cytoHubba plug-in (Chin et al., 2014) to select hub genes. Hub genes were screened according to the degree score > 10 and ranked at the top 10 of total genes, sorted by the betweenness method. We then selected the first neighbors of hub genes that were directly related to the hub genes, to construct their sub-networks, respectively.
Correlations were analyzed by Pearson’s correlation (Schober et al., 2018) for genes involved in the sub-network, which was built by hub gene and its first neighbors. Genes with a Pearson’s correlation coefficient greater than 0.5 were considered most significant correlation with hub genes and were selected for GO annotation and KEGG pathway enrichment analysis. A total of 13 samples were included in correlation analysis and the expression of genes was obtained from GSE97311 and GSE68374 datasets.
The expression profiles of aged adult BM-MSCs (aMSCs) were compared with those of fetal BM-MSCs (fMSCs). Based on the screening criteria of P < 0.05 and | logFC| > 1, a total of 933 DEGs were identified from GSE97311, including 553 up-regulated genes and 380 down-regulated genes (Figure 1A). In addition, 993 DEGs, including 496 up-regulated genes and 497 down-regulated genes, were identified from GSE68374, according to the same criteria (Figure 1B). We integrated the results of the two datasets using the RRA method, and obtained 14,024 up-regulated genes and 9872 down-regulated genes (Supplementary Table S1), which finally yielded 677 robust DEGs. A heatmap of the top 20 up-regulated robust genes and top 20 down-regulated robust genes are presented in Figure 1C, and a complete list of the robust DEGs is provided in Supplementary Table S2. The most significant up-regulated gene was AKR1C3 (P = 4.24E-07, logFC = 4.005), followed by FMO3 (P = 4.79E-06, logFC = 3.849), and TMEM140 (P = 5.60E-06, logFC = 3.385). Moreover, FBN (P = 2.02E-06, logFC = −3.449); SCD (P = 4.05E-06, logFC = −3.363); CLDN1 (P = 5.60E-06, logFC = −3.209) were the most significant down-regulated genes.
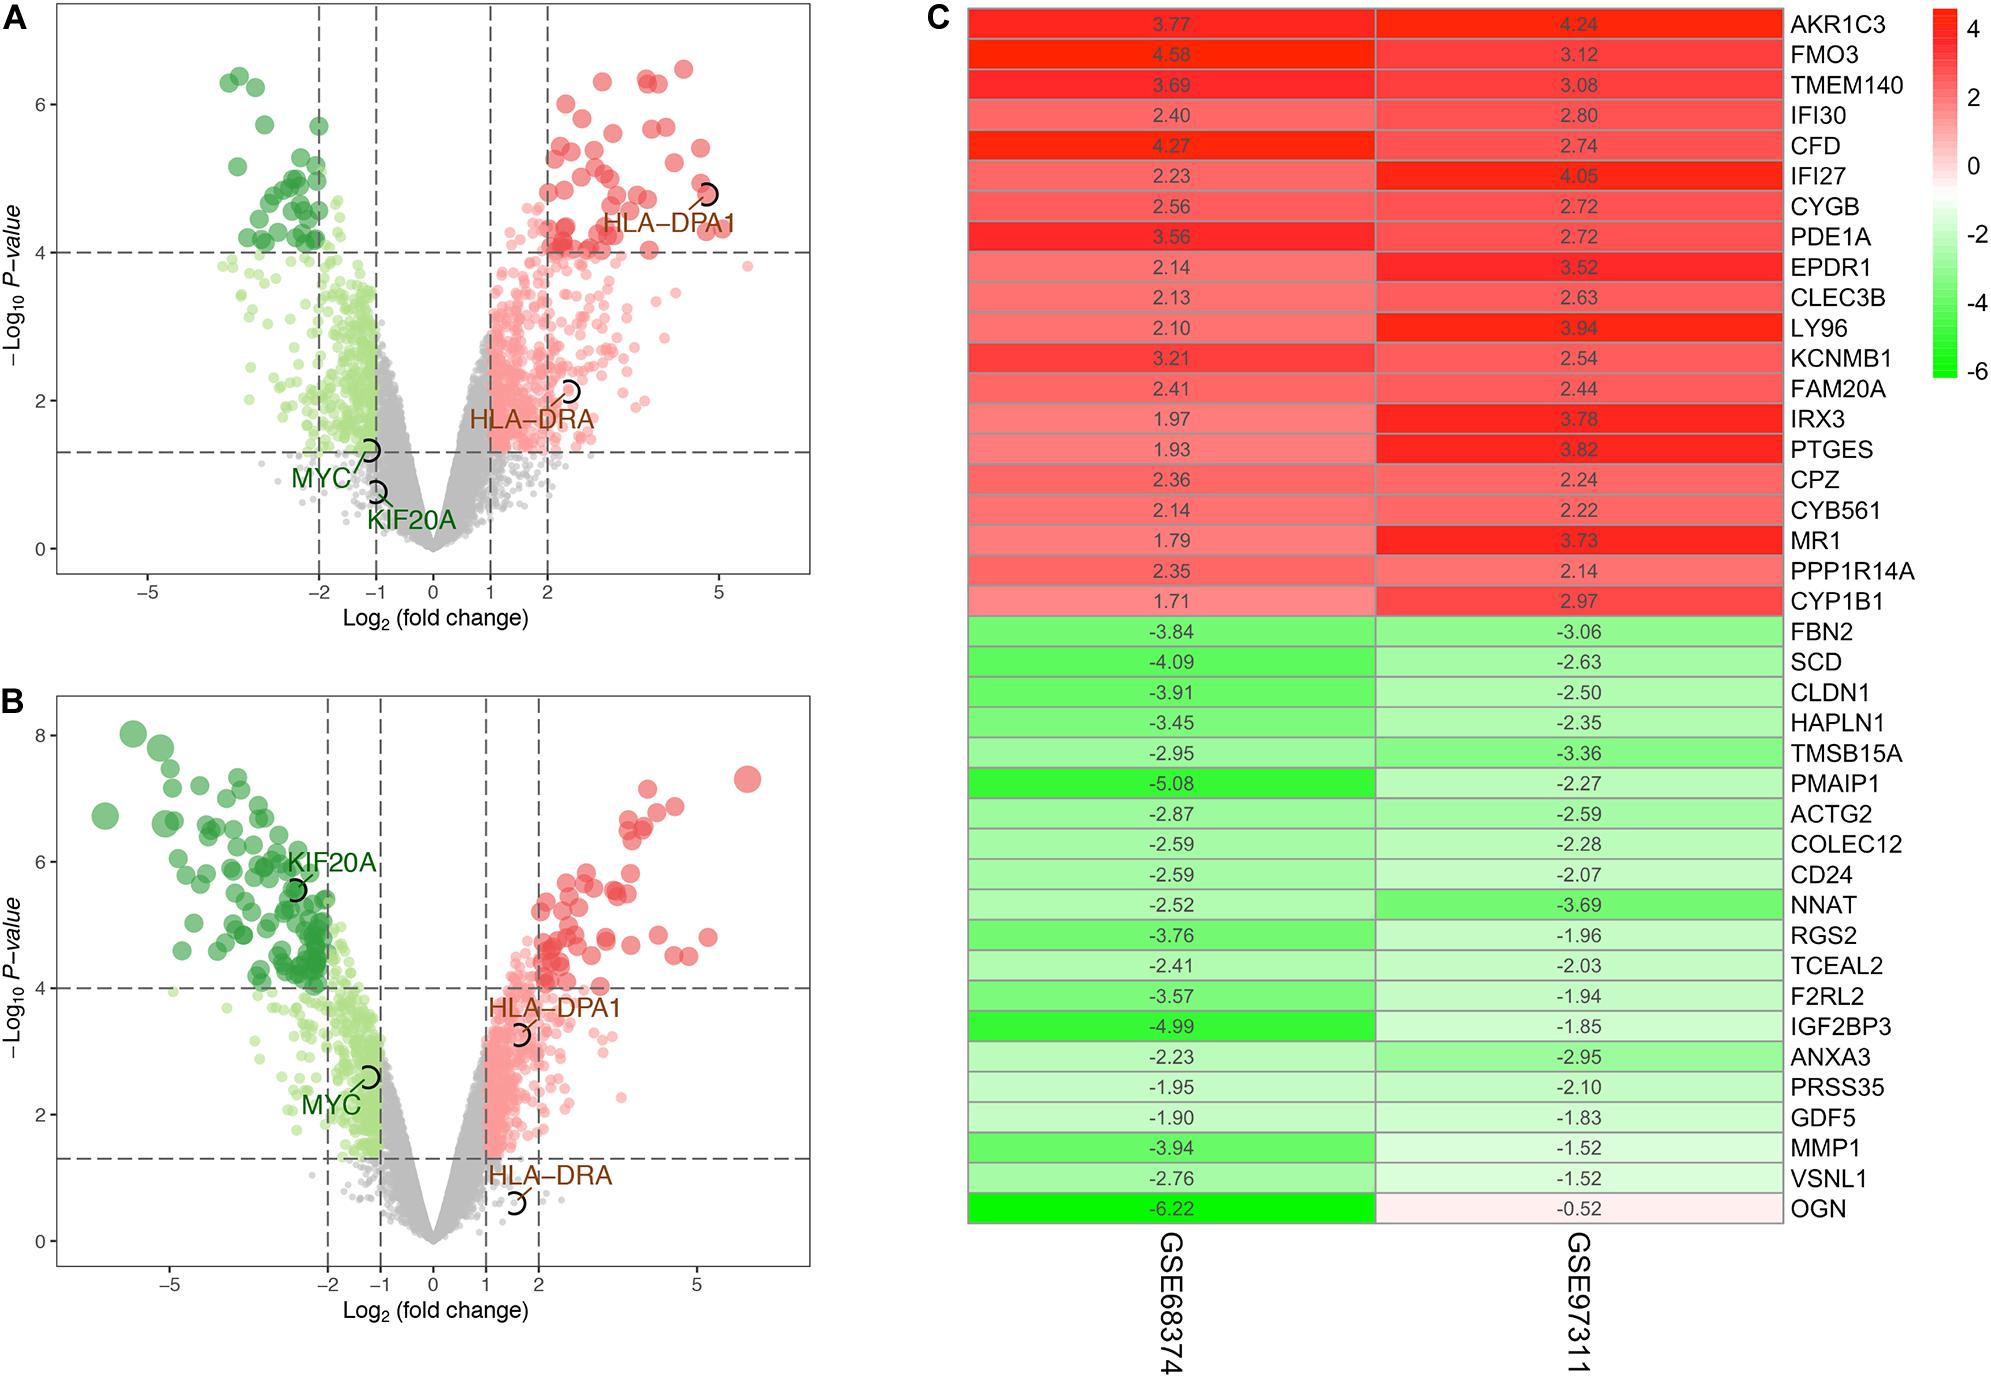
Figure 1. Identification of differentially expressed genes (DEGs). (A) Volcano plot of DEGs for dataset GSE68374. (B) Volcano plot of DEGs for dataset GSE97311. (C) The heatmap of the top 40 (20 up-regulated and 20 down-regulated) DEGs according to P-value identified by the RRA method. The number in the heat map represents log FC. The gradual color ranging from red to green indicates the changing process from up- to down-regulation. Genes circle by black ellipses are the hub genes screened out by subsequent analysis.
The ranked list of DEGs is shown in Supplementary Table S3. Results of GSEA for KEGG pathways revealed that most up-regulated DEGs in aMSCs were related to immune-related diseases (Figure 2A), and down-regulated DEGs were abundant in the cell cycle, ribosome pathway, and spliceosome pathway (Figure 2C). Using hallmark gene sets, the interferon response and myogenesis were enriched in aMSCs (Figure 2B). Moreover, E2F targets, the G2M checkpoint, and MYC targets were enriched in fMSCs (Figure 2D). Gene sets with the highest enrichment scores were all associated with the cell cycle. All gene sets were significantly enriched at an FDR < 0.05.
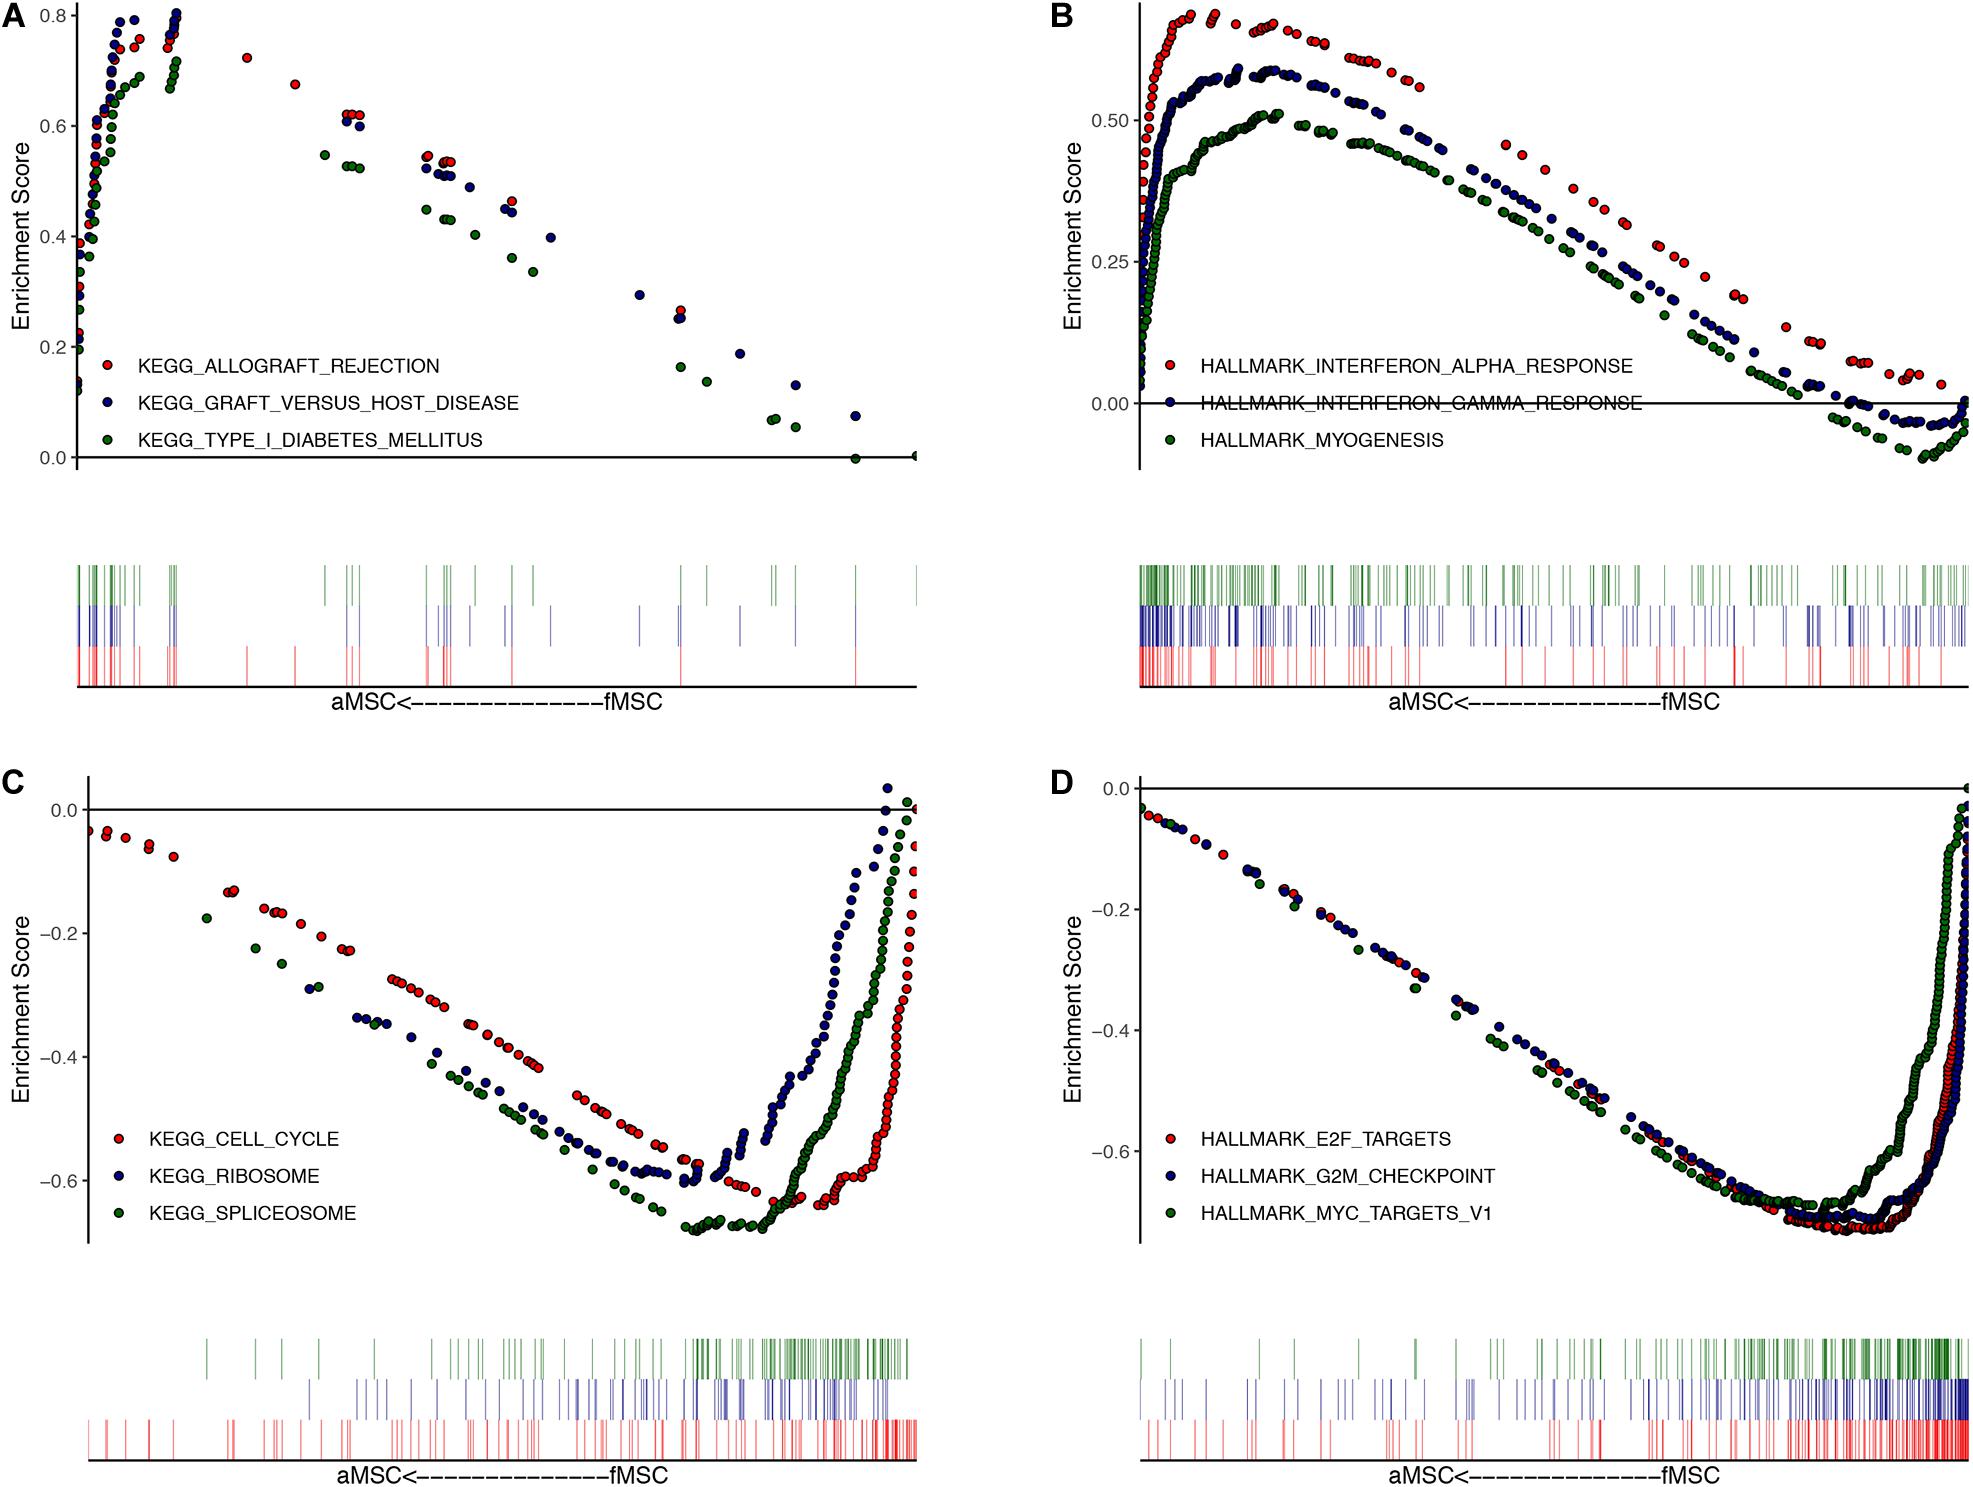
Figure 2. Gene set enrichment analysis (GSEA) for DEGs. The top three enriched gene sets (according to GSEA enrichment score) in aMSC group: (A) for KEGG; (B) for HALLMARK. The top three enriched gene sets (according to GSEA enrichment score) in fMSC group: (C) for KEGG; (D) for HALLMARK. All gene sets are significantly enriched at a false discovery rate (FDR) < 0.05. The location of the vertical bar shows the occurrence of the gene in the ranked list.
To further determine the functions of robust DEGs in specific biological processes, we performed GSEA analysis related to aging and stem cell self-renewal. The GO annotation in terms of response to oxidative stress and IL-6 production enriched in the aMSC group (Figure 3A). The GO gene sets of telomerase activity, somatic stem cell population maintenance, stem cell division, and stem cell proliferation were all enriched in fMSCs (Figure 3B).
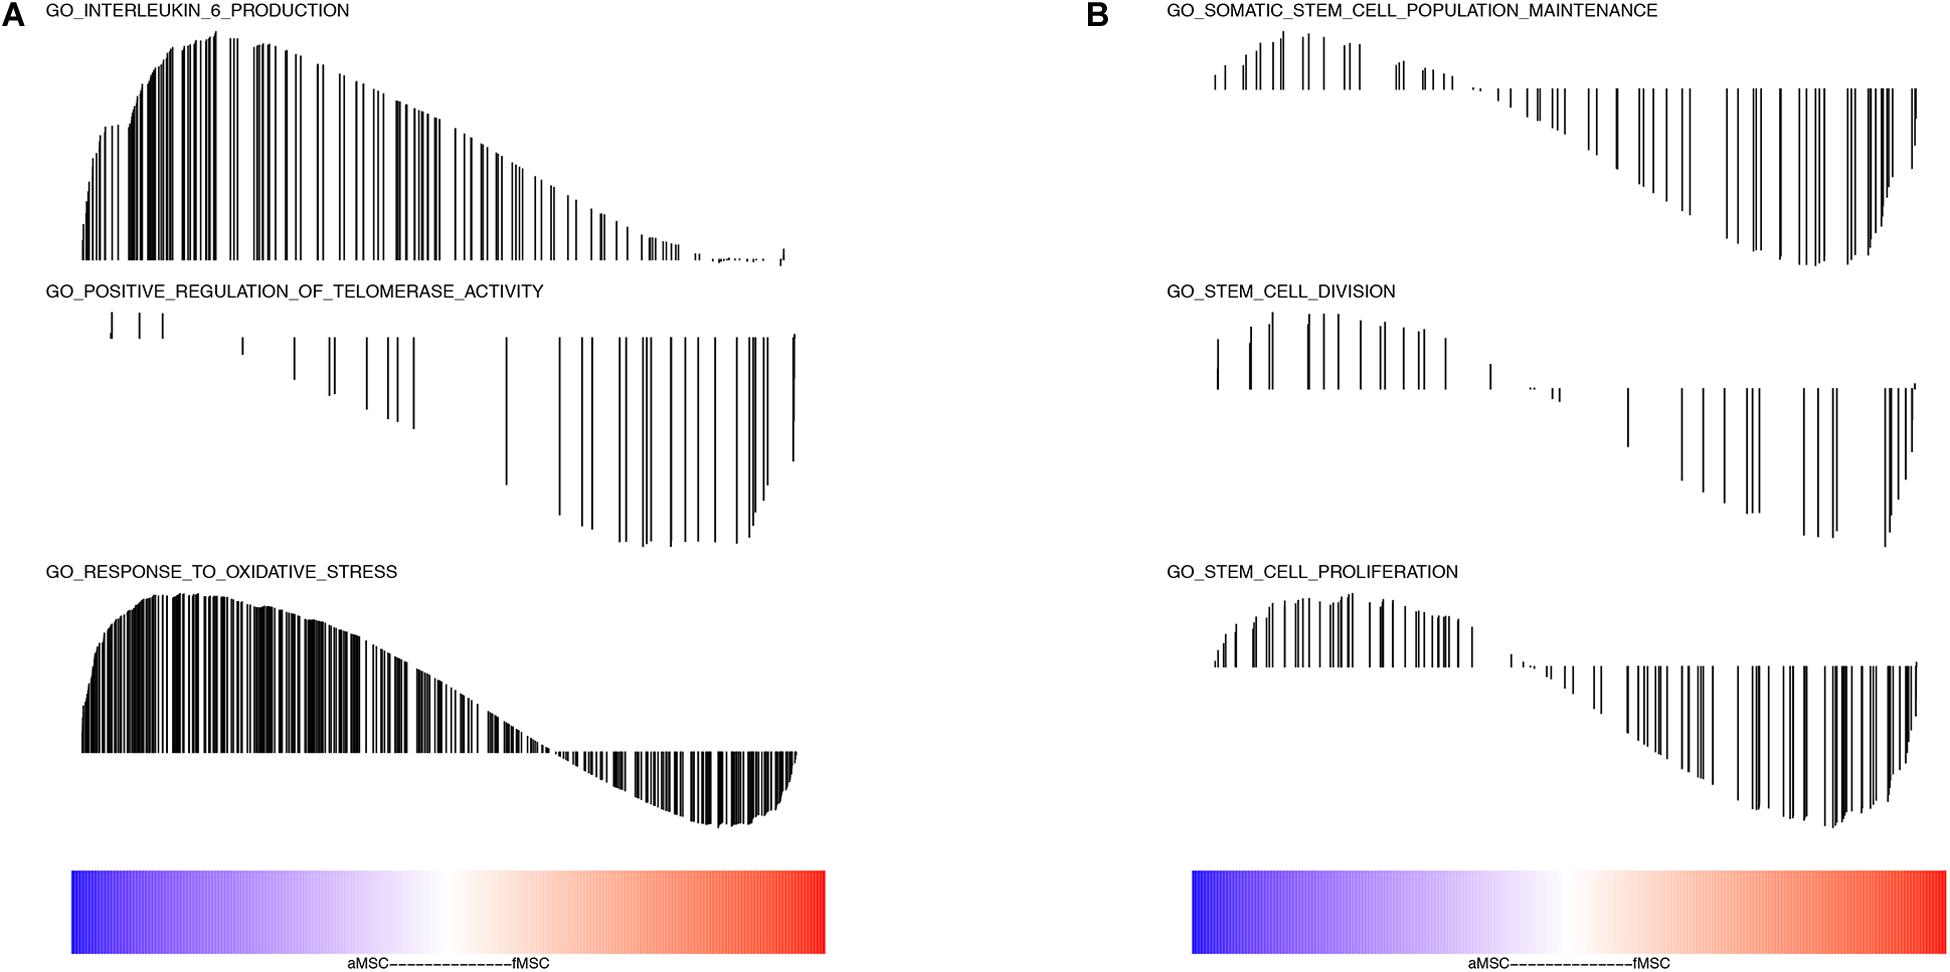
Figure 3. Analyses of gene sets related to aging and stem cell self-renewal. (A) Interleukin 6 production (NES = 1.939, FDR q-value = 0.019); positive regulation of telomerase activity (NES = –1.616, FDR q-value = 0.021); response to oxidative stress (NES = 1.4371426, FDR q-value = 0.076). (B) Somatic stem cell population maintenance (NES = –1.378, FDR q-value = 0.069); stem cell division (NES = –1.207, FDR q-value = 0.158); stem cell proliferation (NES = –1.266, FDR q-value = 0.046). The color bar indicates the sort order of genes (blue represents up-regulated in aMSC group and red represents up-regulated in fMSC group). The location of vertical bar indicates the occurrence of that gene within the ranked list and the height of the bar indicated the enrichment score.
Using the BINGO plug-in, we obtained a global perspective of the changes in gene expression patterns. The up-regulated DEGs in aMSCs were enriched in biological processes such as the immune response, response to stimulus, extracellular structure organization, cell adhesion, and biological adhesion (Figure 4A). In contrast, down-regulated DEGs were mainly enriched in the cell cycle and developmental processes (Figure 4B). Based on the results of KEGG enrichment analysis, the top five significant pathways were cell adhesion molecules, complement and coagulation cascades, Staphylococcus aureus infection, hematopoietic cell lineage, and extracellular matrix (ECM)–receptor interaction. Unlike the other pathways, the peroxisome proliferator-activated receptor (PPAR) signaling pathway was more likely to be inhibited in aMSCs (Figures 5A,B).
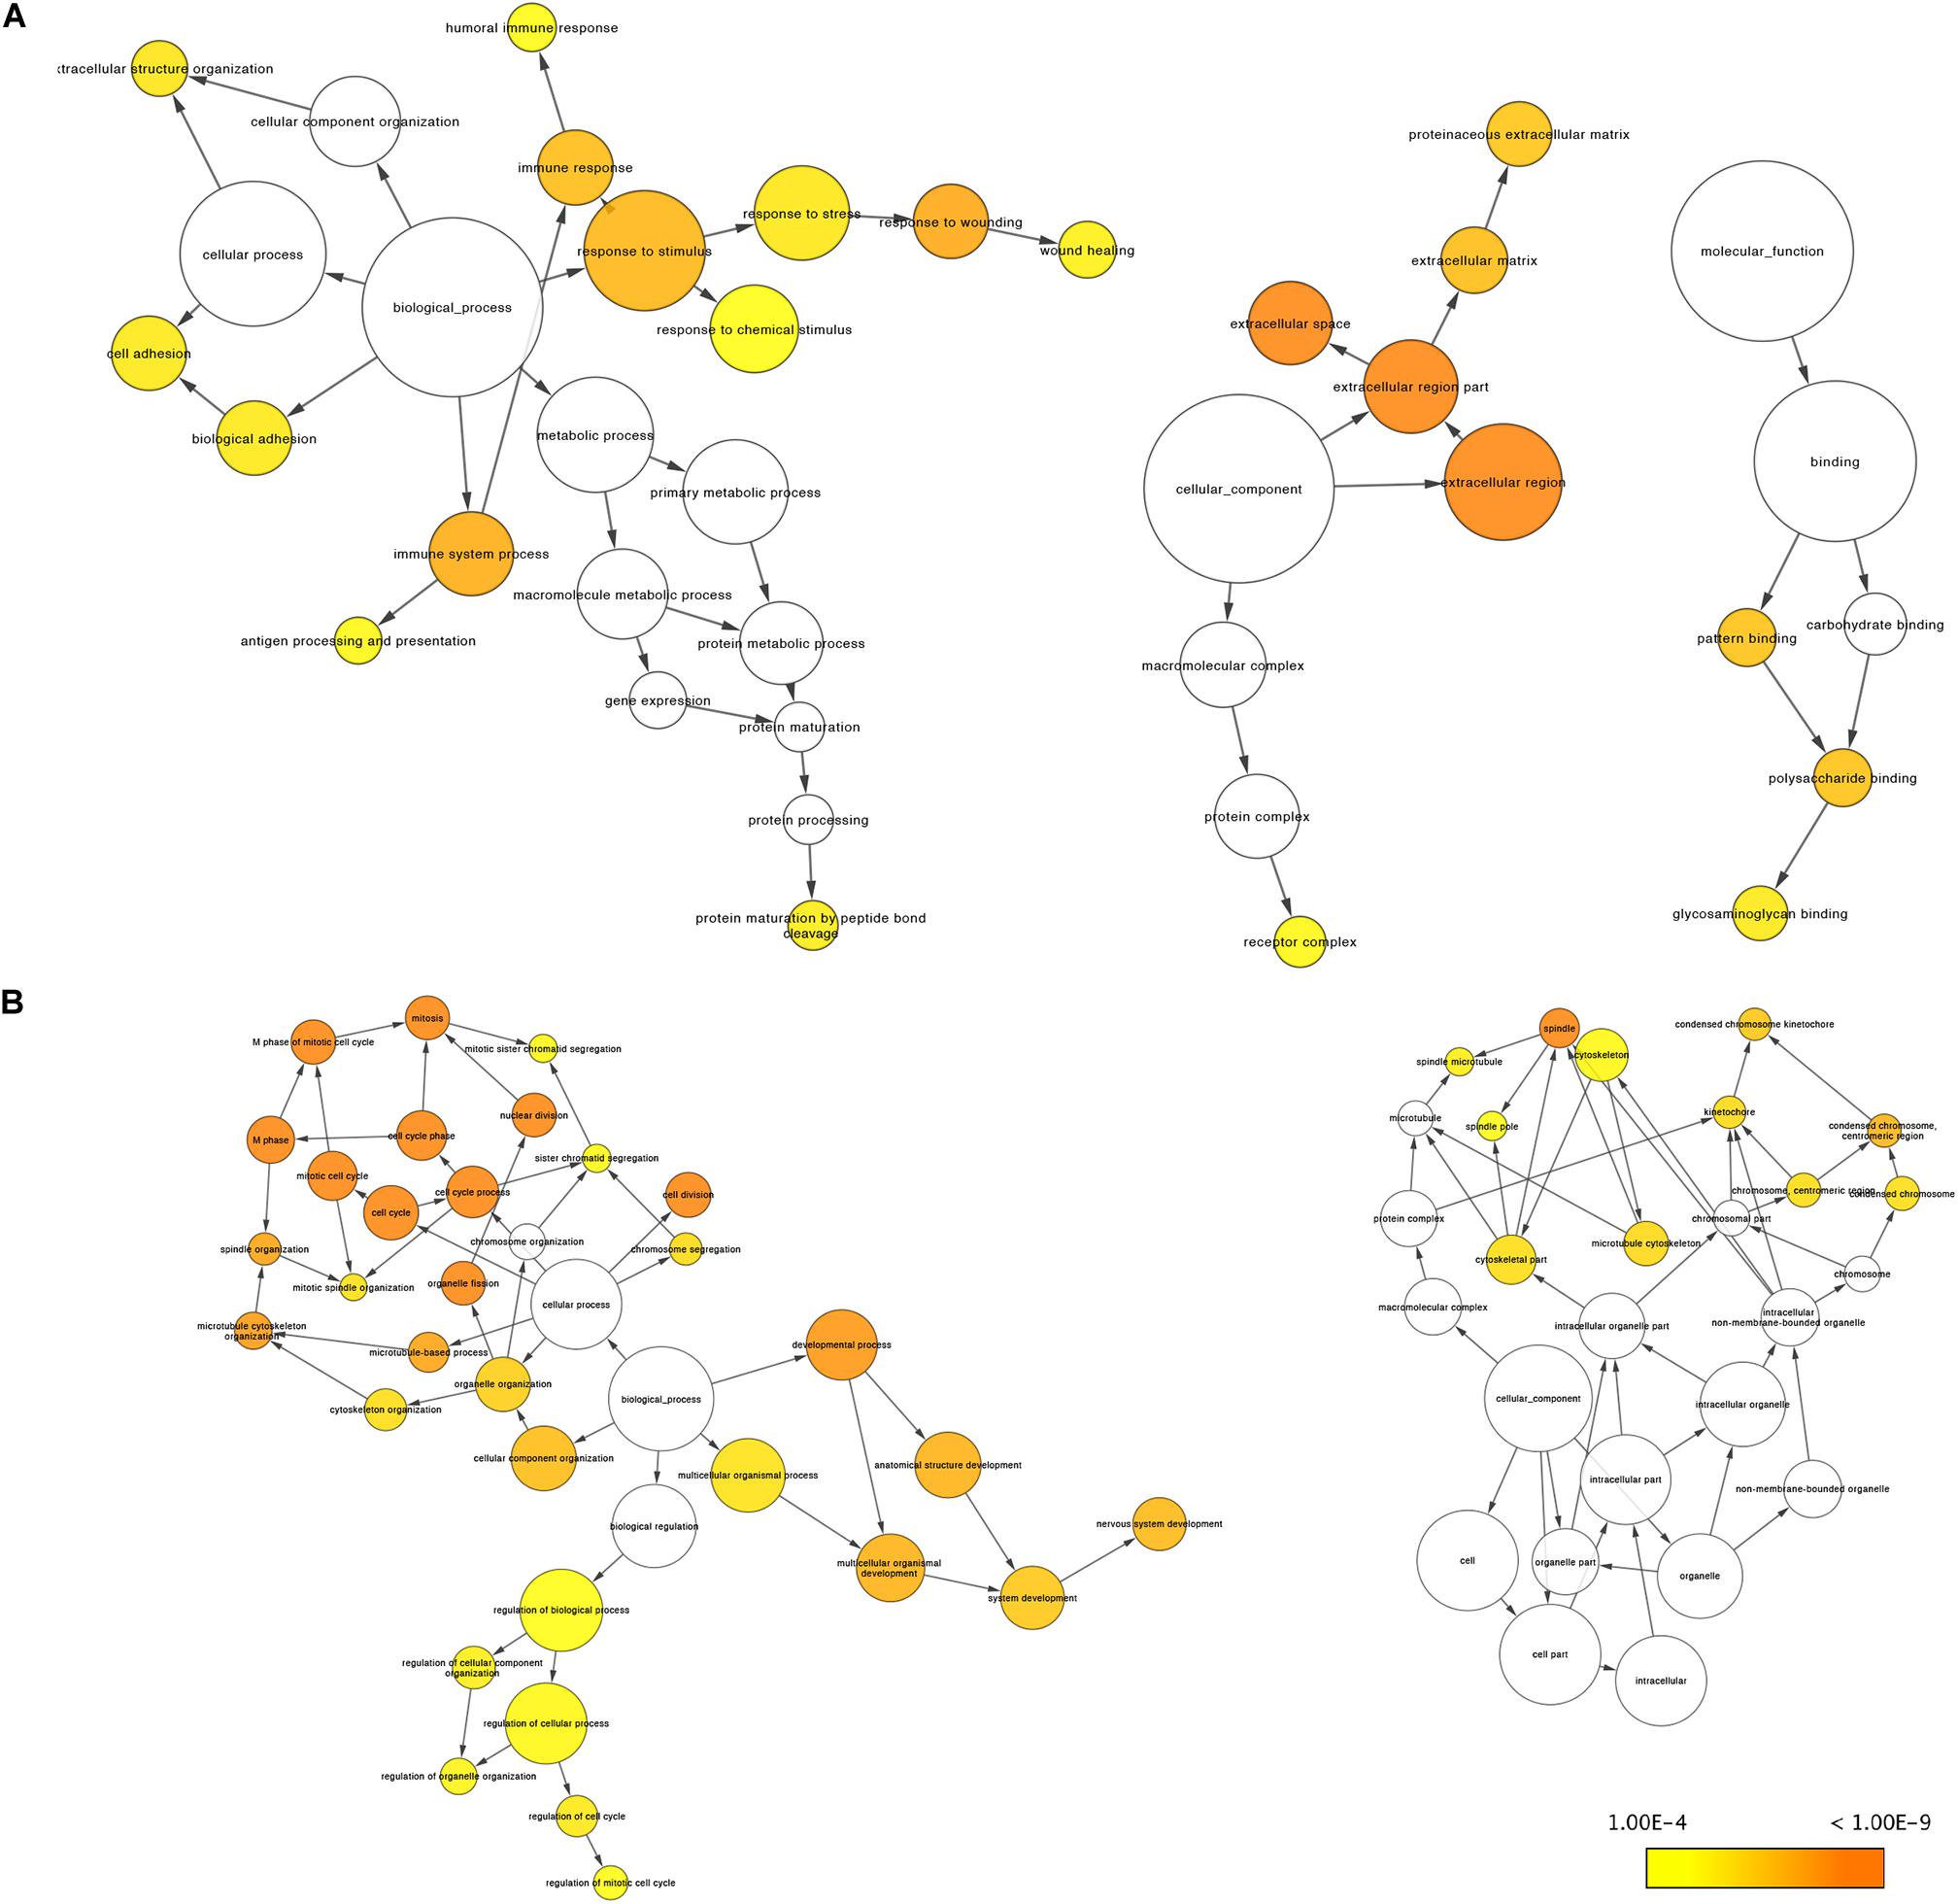
Figure 4. Gene Ontology analyses of robust up-regulated (A) and down-regulated (B) DEGs by BINGO plug-in. There is no enrichment for molecular function in B. The size of the nodes is proportional to the number of genes in that term. Significance decreases from dark orange (p = 1.00E-9) to yellow (p = 1.00E-4).
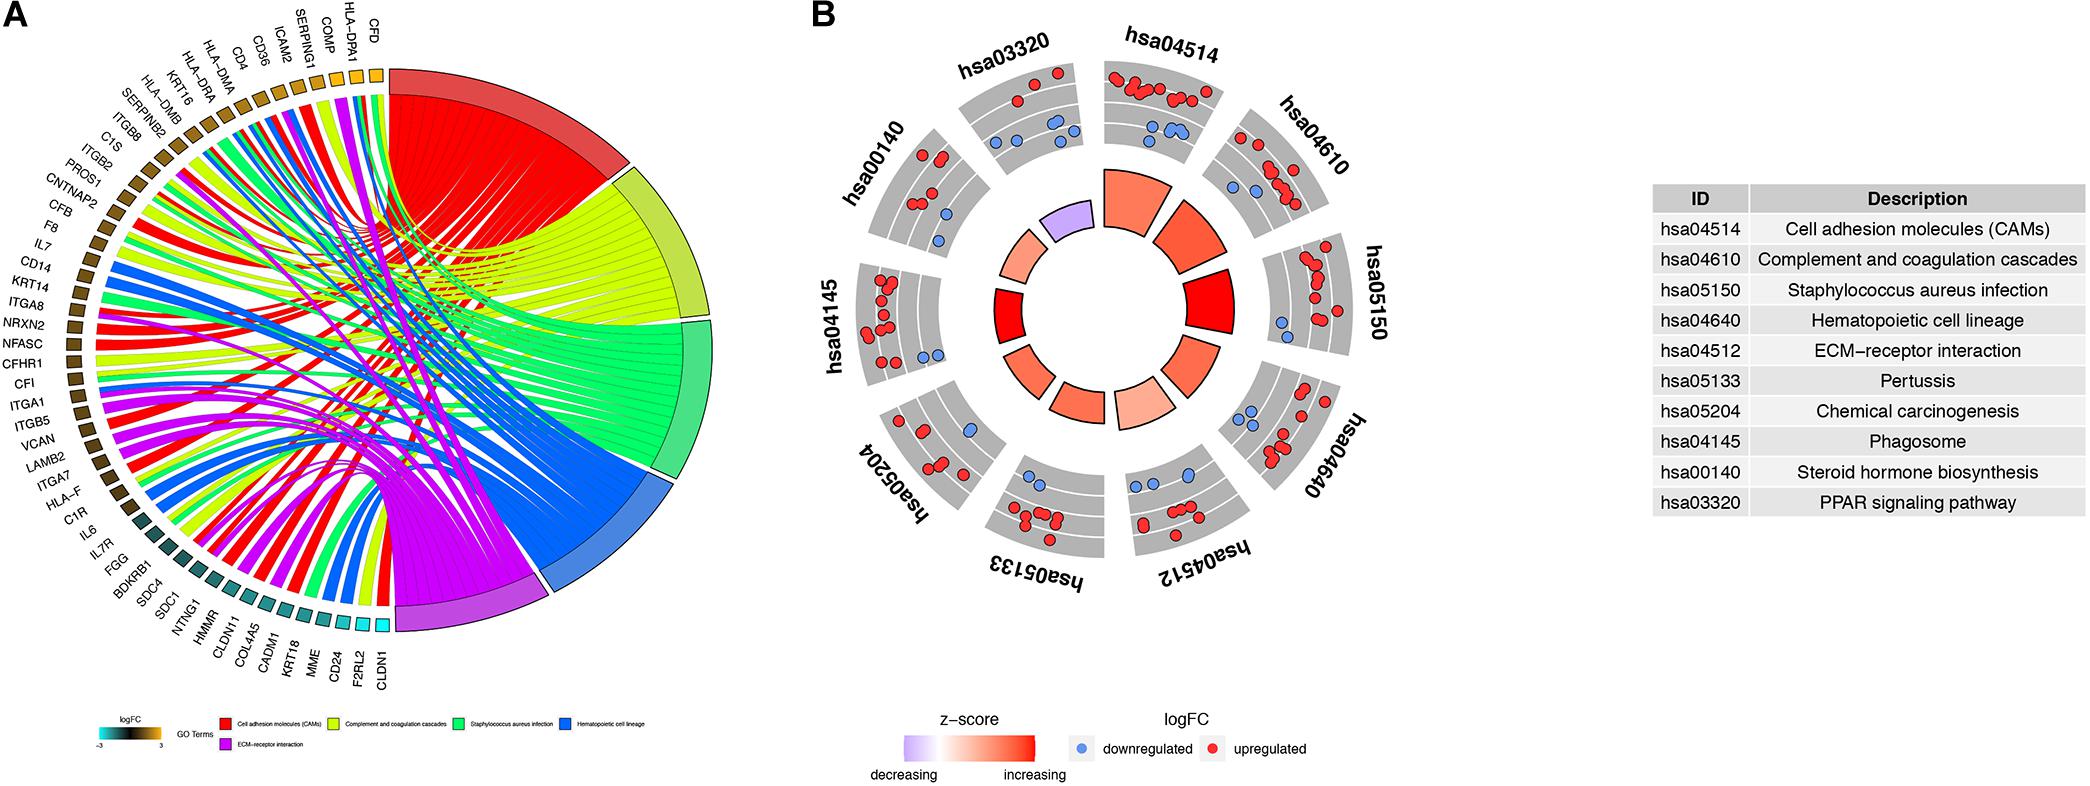
Figure 5. Kyoto Encyclopedia of Genes and Genomes (KEGG) analysis of robust DEGs. Chord plot (A) and circle plot (B) show the relationship between genes and KEGG pathways. (A) Chord plot depicting the relationship between genes and the top five KEGG pathways. (B) Circle plot depicting the distribution of genes in the top 10 KEGG pathways.
The PPI network established by the most robust DEGs (P < 0.001) contained 144 nodes and 291 edges. We screened four hub genes, considering the degree (DC) and betweenness (BC) centrality (Figures 6A,B). Among them, MYC (DC = 26, BC = 9816.96488) and KIF20A (DC = 17, BC = 4690.54753) were up-regulated in the fMSC group, and HLA-DRA (DC = 11, BC = 2105.09486) and HLA-DPA1 (DC = 11, BC = 2105.09486) were up-regulated in the aMSC group. We then selected their first neighbors and structured the respective sub-networks. As shown in Figures 7A–C, there were 26 nodes and 63 edges in the sub-network of MYC; and 18 nodes and 89 edges in the sub-network of KIF20A. Both HLA-DRA and HLA-DPA1 were part of the same network, which included 12 nodes and 34 edges.
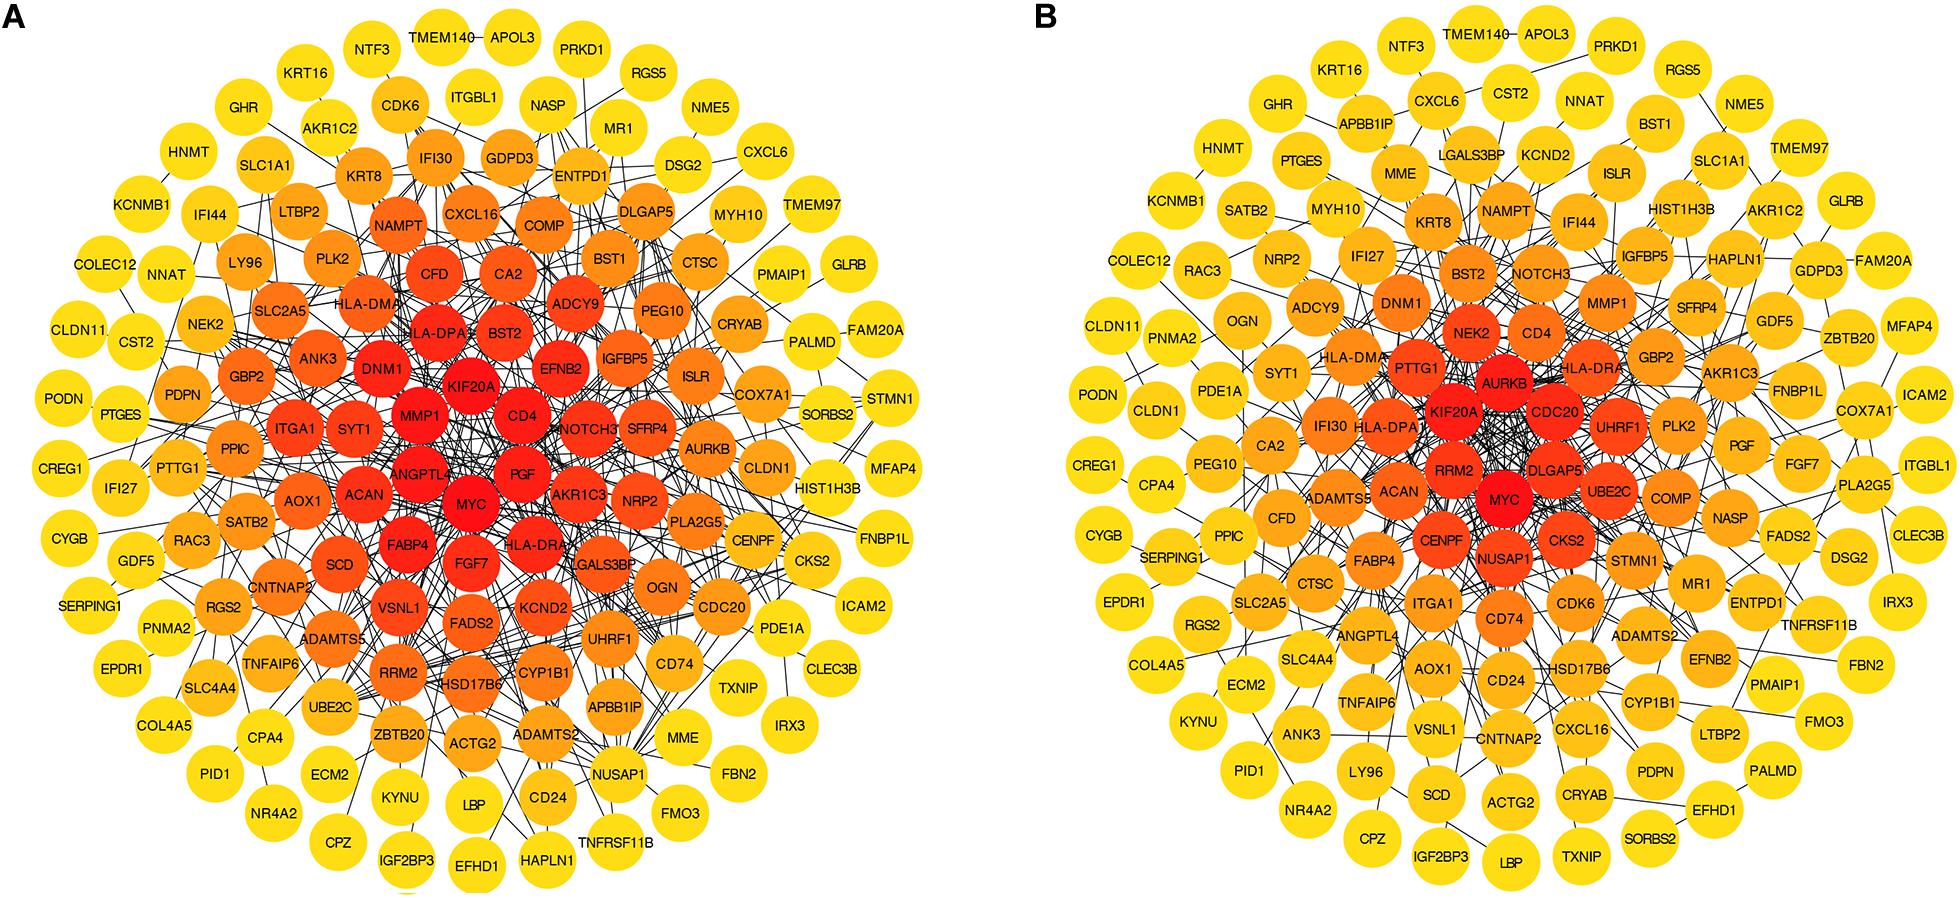
Figure 6. DEGs with a P-value < 0.001 ranked by betweenness (A) and degree (B) methods using cytoHubba in Cytoscape. The change of color from orange red to yellow represents the change of centrality score from high to low.
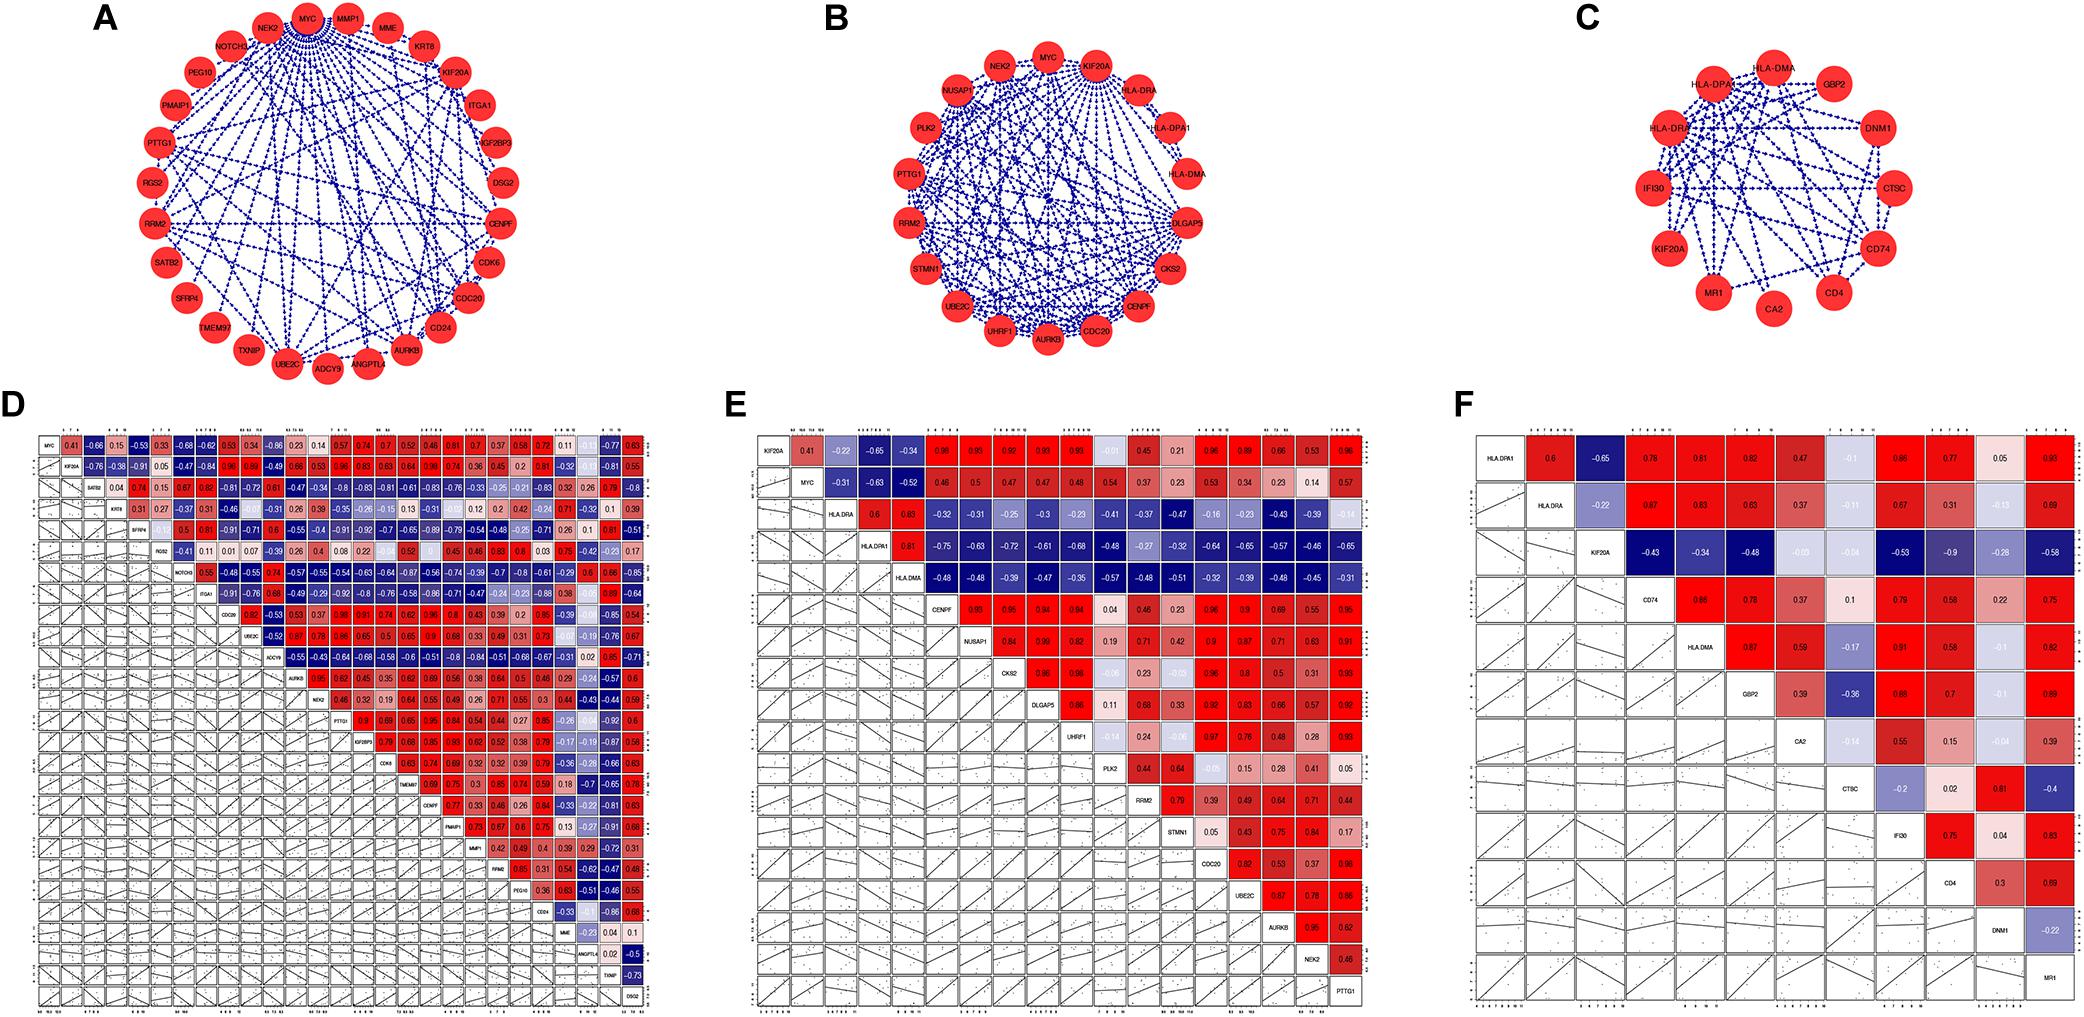
Figure 7. Sub-networks (A–C) and correlation matrixes (D–F) of hub genes and their first neighbors: (A,D) MYC; (B,E) KIF20A; (C,F) HLA-DRA and HLA-DPA1.
We analyzed gene-gene expression correlation coefficients for genes in sub-networks (Figures 7D–F) and filtered out genes with a Pearson correlation coefficient > 0.5. Correlation coefficient, P-values, and coefficient of variation for all the genes included in the correlation analysis are shown in Supplementary Tables S4, S5. Some interesting examples are shown in Supplementary Figure S1. The GO and KEGG pathway analyses were also performed for these genes (Figures 8A–F). For MYC, we observed that both MYC and TXNIP, a gene up-regulated in aMSCs, were involved in negative regulation of cell division. The KEGG analysis showed that the cell cycle, breast cancer, oocyte meiosis, and human T-cell leukemia virus 1 infection were enriched. Several biological processes and GO terms, such as miotic nuclear division, mitotic sister chromatid segregation, and nuclear division, were abundant in KIF20A-related genes. Pathways implicated with these genes were similar to MYC and its closely related neighbors. For HLA-DRA and HLA-DPA1, GO terms such as antigen processing and presentation of peptide antigen, and the interferon gamma mediated signaling pathway were enriched; and KEGG pathways associated with antigen processing and presentation, hematopoietic cell lineage, and Th cell differentiation were enriched.
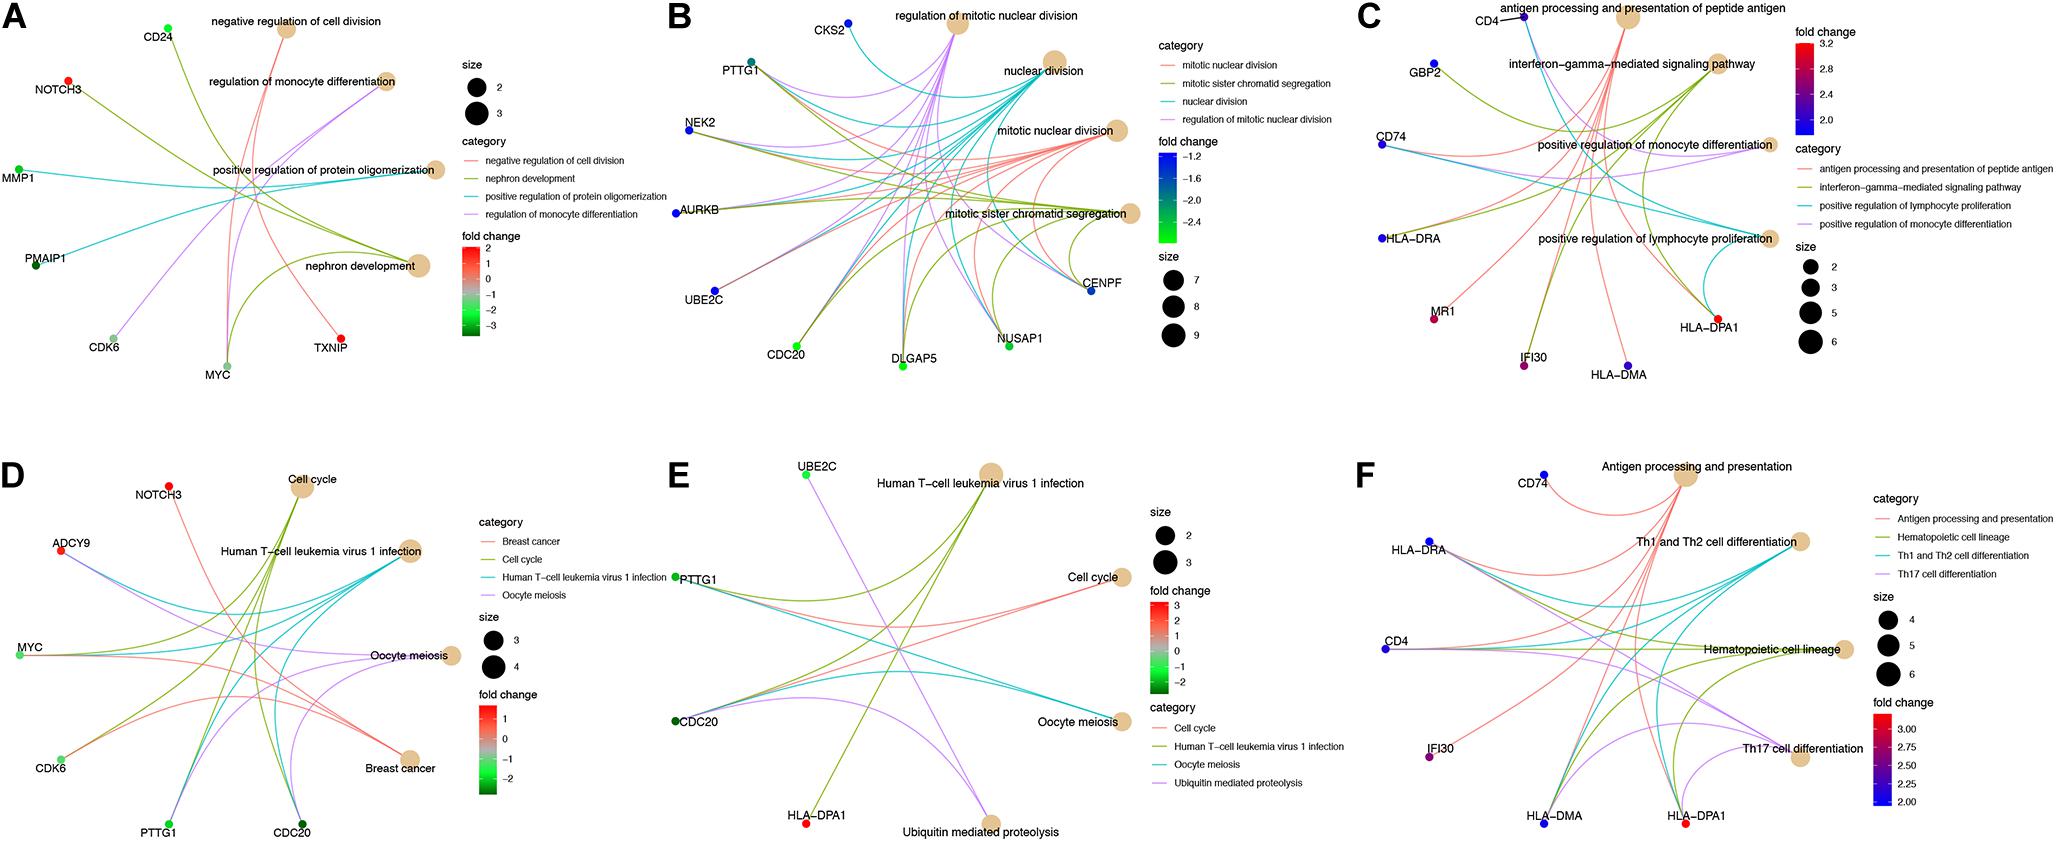
Figure 8. Interactive genes of hub-genes were filtered by a Pearson correlation coefficient > 0.5 and GO (A–C) and KEGG pathway (D–E) analyses were performed for these genes. GO and KEGG analyses for (A,D) interactive genes of MYC; (B,E) interactive genes of KIF20A; (C,F) interactive genes of HLA-DRA and HLA-DPA1. Cut off = adjust P < 0.05, the top four are shown in plot.
Human BM-MSCs (hBM-MSCs) are promising sources for tissue engineering and regenerative medicine. Human fetal MSCs (hf-MSCs) have more primitive expression profiles and greater proliferative capacity than their adult counterparts (Spitzhorn et al., 2019). These cells can more readily expand in vitro and senesce later in culture. Both aMSCs and fMSCs harbor immunomodulatory capacity and are non-immunogenic, even though some differences have been reported (Götherström et al., 2005; Chang et al., 2006; Chen et al., 2011; Andrzejewska et al., 2019). The underlying molecular mechanisms for these differences are still not fully understood.
In this study, we used bioinformatics to mine the underlying molecular mechanisms that explain the difference between aMSCs and fMSCs. To our best knowledge, this is the first study to use the RRA method to analyze the difference between aMSC and fMSC sources in human bone marrow. Götherström et al. (2005) explored the gene expression profile of MSCs derived from the fetal liver and adult bone marrow. Other studies have shown that MSCs derived from different sources possess distinct biological properties (Berebichez-Fridman and Montero-Olvera, 2018; Kozlowska et al., 2019).
Only two datasets in the GEO database, GSE97311 and GSE 68374, met our experimental requirements. We performed robust differential expression profiling analysis using the two existing GEO datasets and obtained 677 robust DEGs, including 388 up-regulated and 289 down-regulated DEGs in aMSCs compared with fMSCs. The most significantly up-regulated gene in aMSCs was AKR1C3. This gene may play an important role in the pathogenesis of allergic diseases such asthma and may have a role in controlling cell growth or differentiation. The most significantly up-regulated gene in fMSCs was FBN2, which regulates the early processes of elastic fiber assembly and osteoblast maturation.
The GSEA was conducted for all DEGs in the final robust rank list. Gene sets abundant in fMSCs, such as those associated with the cell cycle, E2F targets, and MYC targets, were all related to proliferation. These results further support the notion that fMSCs have greater self-renewal abilities than aMSCs and are consistent with earlier observations (Chen et al., 2011). One unexpected finding was the up-regulated immune response in aMSCs. We found all of the most significantly enriched gene sets in aMSCs involved in the immune response. Several reports have shown that aging leads to the pro-inflammatory phenotype, with activated innate immune responses (Danilova, 2006; Salminen et al., 2008). The chronic low-grade inflammatory state of elderly donors may be the reason for the heightened immune response of aMSCs.
As previous studies have shown, IL-6 is a reliable aging parameter and senescent MSCs release excess IL-6 (Salminen et al., 2008; Suvakov et al., 2019). Thus, we conducted GSEA on interesting biological processes, including IL-6 production, telomerase activity, oxidative stress, and stem cell self-renewal. The results showed enrichment of IL-6 production and oxidative stress in aMSCs; and enrichment of telomerase activity and stem cell proliferation related gene sets in fMSCs. These results further suggest that MSCs derived from elderly adults possess age-related characteristics. The disadvantages of aMSCs could be partially attributed to these intrinsic age-related drawbacks.
Consistent with published data, robust DEGs enriched in several KEGG pathways, such as cell adhesion and ECM-receptor, which also participate in the immune response, are reportedly down-regulated pluripotency markers that inhibit mouse embryonic stem cell self-renewal (Taleahmad et al., 2015). The PPAR pathway is down-regulated in aMSCs; and this might be explained by reduced PPAR activity related to increased inflammation levels in old age (Michalik and Wahli, 2008). Regarding GO annotation, the up-regulated DEGs in adults compared with those in fetuses were involved in the immune response, and cell–cell and cell–ECM contact; whereas down-regulated expression was observed in aMSCs compared with fMSCs in cell cycle progression and development.
The PPI network was then constructed by the most robust DEGs with P-values < 0.001 and |logFC| > 1, to evaluate the relationship between these genes and identify hub genes. We detected four hub genes: MYC, KIF20A, HLA-DRA, and HLA-DPA1 according to BC and DC.
Prior studies have noted the important role of MYC in a range of cellular processes, including proliferation, the cell cycle, and pluripotency maintenance in stem cells (Lüscher, 2001; Kumamoto et al., 2009; Chen et al., 2018). Furthermore, c-MYC can inhibit replicative senescence caused by telomere damage by promoting the expression of human telomerase reverse transcriptase (hTERT), a catalytic subunit of telomerase (Xu et al., 2001). Past research has revealed that high expression of c-MYC is associated with increased self-renewal and differentiation, which is regulated by Sox2 (Park et al., 2012). A recent study showed that the proliferative capacity of human MSCs derived from bone marrow is linked to c-MYC expression (Melnik et al., 2019). Sufficient c-MYC expression may be essential to maintain high proliferative rates and an undifferentiated state of MSCs during ex vivo expansion.
In the present study, MYC as a hub gene was up-regulated in fetal BM-MSCs. We found a negative correlation between the expression of MYC and TXNIP (correlation coefficient = −0.77). Oberacker et al. (2018) showed that TXNIP plays a crucial role in aging processes. Age-related up-regulation of TXNIP results in reduced resistance to oxidative stress, and thereby accelerates aging. The present study reveals that fMSCs with high expression of MYC and low expression TXNIP may explain why fMSCs possess greater proliferative capacity and are more resistant to aging. The negative correlation between MYC and TXNIP in BM-MSCs warrants further research. Nevertheless, we must also acknowledge that high levels of c-MYC increase the risk of oncogenesis (Kozlowska et al., 2019).
The mitotic kinesin, KIF20A, is essential for central spindle organization at anaphase as well as cytokinesis regulation (Zhang et al., 2019). It is supposedly a key factor in cell proliferation and invasion in many cancers (Sheng et al., 2018; Zhang et al., 2019). A recent study showed that KIF20A could reportedly be regulated by MYC (Pan et al., 2020). There is currently no data regarding the function of KIF20A in adult stem cells, and the relationship between MYC and KIF20A is unclear. Our findings suggest that KIF20A is extensively linked with the cell cycle in BM-MSCs, and is moderately correlated (correlation coefficient = 0.41) with MYC.
Another major difference was observed in immunoregulatory function. Both HLA-DRA and HLA-DPA1 belong to the major histocompatibility complex class II, are up-regulated in aMSCs, and mainly involved in antigen procession and presentation. The aMSCs express intermediate levels of HLA class I and low levels of HLA class II, while fMSCs express no HLA class II (Gotherstrom et al., 2003; O’Donoghue and Fisk, 2004). Previous reports have shown that adult MSCs contain intracellular deposits of class II alloantigen, and their surface expression can be induced under inflammatory conditions, such as in the presence of INFγ (Gotherstrom et al., 2003; Ryan et al., 2005). The BM-MSCs can therefore be recognized by allogeneic lymphocytes, possess immunomodulatory properties in vitro, and suppress the proliferation of activated lymphocytes (Ryan et al., 2005; Chen et al., 2011). However, Gallipeau and colleagues proposed discrepancies in the immune-suppressive activities of MSCs arising from intrinsic variability of each donor source, with an average age > 65 years (Romieu-Mourez et al., 2012). Furthermore, the immunomodulation of MSCs can be regulated by inflammatory conditions; in low-level inflammatory microenvironments, BM-MSCs promote inflammation and act as antigen-presenting cells (Betancourt, 2013). The BM-MSCs from elderly donors in this study seemed to have a pro-inflammatory phenotype, which may be due to the chronic low-grade inflammatory conditions of aged donors.
As for cancerous condition, there is a growing body of evidence suggests that it plays a key role in the maintenance and progression of tumor. Fernando et al. highlight the importance of tumor microenvironment, especially for MSC, in multiple myeloma (MM) (Fernando et al., 2019). The telomeric length of MM – MSC is more lower and genes, such as CDC20, CDC6, involved in cell cycle are decrease in expression, which exhibit similar down-regulated in aMSCs. However, immune response related genes, for instance, HLA-DRA, are also down-regulated in MM – MSC, which is up-regulated in aMSCs.
Through data mining and network analysis, we detected four hub genes, MYC, KIF20A, HLA-DRA, and HLA-DPA1. Expression of the MYC gene was negatively correlated with that of TXNIP, a known senescence-associated gene. Furthermore, KIF20A is extensively linked with the cell cycle. The other two core genes, HLA-DRA and HLA-DPA1, are implicated in the immune response and may be induced by age-related inflammatory conditions. We infer that BM-MSCs derived from elderly donors may have age-related drawbacks. These cells show lower proliferative capacity and a pro-inflammatory phenotype. More experiments are required for further verification of these findings.
The original contributions presented in the study are included in the article/Supplementary Material. Further inquiries can be directed to the corresponding author/s.
XYL conceived and designed the research, performed analysis, and wrote the majority of the manuscript. BZ, YL, HJ, and ZL supervised the research. MY, XPL, JD, KZ, XZ, LL, and JW contributed to data collation. All authors read and approved the final manuscript.
This work was supported by the National Natural Science Foundation of China (Grant Nos. 81870736, 81801040, 81500816, and 81570951).
The authors declare that the research was conducted in the absence of any commercial or financial relationships that could be construed as a potential conflict of interest.
The Supplementary Material for this article can be found online at: https://www.frontiersin.org/articles/10.3389/fgene.2020.573877/full#supplementary-material
Supplementary Figure 1 | The correlation profiles of (A) MYC and TXNIP; (B) KIF20A and CDC20; (C) HLA-DPA1 and MR1; (D) HLA-DRA and CD74.
Supplementary Table 1 | The full list of up- and down-regulated genes integrated by RRA method.
Supplementary Table 2 | The details of all the robust DEGs.
Supplementary Table 3 | The list of DEGs ranked by log FC from large to small.
Supplementary Table 4 | Correlation coefficient and P-values for the correlation between genes in sub-network and hub genes.
Supplementary Table 5 | Coefficient of variation for all the genes included in the correlation analysis.
Andrzejewska, A., Lukomska, B., and Janowski, M. (2019). Concise review: mesenchymal stem cells: from roots to boost. Stem Cells 37, 855–864. doi: 10.1002/stem.3016
Berebichez-Fridman, R., and Montero-Olvera, P. R. (2018). Sources and clinical applications of mesenchymal stem cells: state-of-the-art review. Sultan Qaboos Univ. Med. J. 18, e264–e277. doi: 10.18295/squmj.2018.18.03.002
Betancourt, A. M. (2013). New cell-based therapy paradigm: induction of bone marrow-derived multipotent mesenchymal stromal cells into pro-inflammatory MSC1 and Anti-inflammatory MSC2 Phenotypes. Adv. Biochem. Eng./Biotechnol. 130, 163–197. doi: 10.1007/10_2012_141
Campagnoli, C., Roberts, I. A., Kumar, S., Bennett, P. R., Bellantuono, I., and Fisk, N. M. (2001). Identification of mesenchymal stem/progenitor cells in human first-trimester fetal blood, liver, and bone marrow. Blood 98, 2396–2402. doi: 10.1182/blood.v98.8.2396
Castagnini, F., Pellegrini, C., Perazzo, L., Vannini, F., and Buda, R. (2016). Joint sparing treatments in early ankle osteoarthritis: current procedures and future perspectives. J. Exp. Orthop. 3:3. doi: 10.1186/s40634-016-0038-34
Chang, C. J., Yen, M. L., Chen, Y. C., Chien, C. C., Huang, H. I., Bai, C. H., et al. (2006). Placenta-derived multipotent cells exhibit immunosuppressive properties that are enhanced in the presence of interferon-gamma. Stem Cells 24, 2466–2477. doi: 10.1634/stemcells.2006-2071
Chen, B., Yu, J., Wang, Q., Zhao, Y., Sun, L., Xu, C., et al. (2018). Human bone marrow mesenchymal stem cells promote gastric cancer growth via regulating c-Myc. Stem Cells Int. 2018:9501747. doi: 10.1155/2018/9501747
Chen, P. M., Yen, M. L., Liu, K. J., Sytwu, H. K., and Yen, B. L. (2011). Immunomodulatory properties of human adult and fetal multipotent mesenchymal stem cells. J. Biomed. Sci. 18:49. doi: 10.1186/1423-0127-18-49
Chin, C. H., Chen, S. H., Wu, H. H., Ho, C. W., Ko, M. T., and Lin, C. Y. (2014). cytoHubba: identifying hub objects and sub-networks from complex interactome. BMC Syst Biol. 8(Suppl. 4):S11. doi: 10.1186/1752-0509-8-S4-S11
Danilova, N. (2006). The evolution of immune mechanisms. J. Exp. Zool. B Mol. Dev. Evol. 306, 496–520. doi: 10.1002/jez.b.21102
Dexheimer, V., Mueller, S., Braatz, F., and Richter, W. (2011). Reduced reactivation from dormancy but maintained lineage choice of human mesenchymal stem cells with donor age. PLoS One 6:e22980. doi: 10.1371/journal.pone.0022980
Ding, D. C., Shyu, W. C., and Lin, S. Z. (2011). Mesenchymal stem cells. Cell Transplant 20, 5–14. doi: 10.3727/096368910X
Dogan, A., Demirci, S., Bayir, Y., Halici, Z., Karakus, E., Aydin, A., et al. (2014). Boron containing poly-(lactide-co-glycolide) (PLGA) scaffolds for bone tissue engineering. Mater. Sci. Eng. C Mater. Biol. Appl. 44, 246–253. doi: 10.1016/j.msec.2014.08.035
Fernando, R. C., Mazzotti, D. R., Azevedo, H., Sandes, A. F., Rizzatti, E. G., de Oliveira, M. B., et al. (2019). Transcriptome analysis of mesenchymal stem cells from multiple myeloma patients reveals downregulation of genes involved in cell cycle progression, immune response, and bone metabolism. Sci. Rep. 9:1056. doi: 10.1038/s41598-018-38314-8
Friedenstein, A. J., Chailakhyan, R. K., and Gerasimov, U. V. (1987). Bone marrow osteogenic stem cells: in vitro cultivation and transplantation in diffusion chambers. Cell Tissue Kinet. 20, 263–272. doi: 10.1111/j.1365-2184.1987.tb01309.x
Gotherstrom, C., Ringden, O., Westgren, M., Tammik, C., and Le Blanc, K. (2003). Immunomodulatory effects of human foetal liver-derived mesenchymal stem cells. Bone Marrow Transplant 32, 265–272. doi: 10.1038/sj.bmt.1704111
Götherström, C., West, A., Liden, J., Uzunel, M., Lahesmaa, R., and Le, Blanc K (2005). Difference in gene expression between human fetal liver and adult bone marrow mesenchymal stem cells. Haematologica 90, 1017–1026.
Guillot, P. V., Gotherstrom, C., Chan, J., Kurata, H., and Fisk, N. M. (2007). Human first-trimester fetal MSC express pluripotency markers and grow faster and have longer telomeres than adult MSC. Stem Cells 25, 646–654. doi: 10.1634/stemcells.2006-2208
Hayflick, L. (2000). The illusion of cell immortality. Br. J. Cancer 83, 841–846. doi: 10.1054/bjoc.2000.1296
Ito, K., and Murphy, D. (2013). Application of ggplot2 to pharmacometric graphics. CPT Pharmacometrics Syst Pharmacol. 2:e79. doi: 10.1038/psp.2013.56
Kolf, C. M., Cho, E., and Tuan, R. S. (2007). Mesenchymal stromal cells. Biology of adult mesenchymal stem cells: regulation of niche, self-renewal and differentiation. Arthritis. Res. Ther. 9:204. doi: 10.1186/ar2116
Kozlowska, U., Krawczenko, A., Futoma, K., Jurek, T., Rorat, M., Patrzalek, D., et al. (2019). Similarities and differences between mesenchymal stem/progenitor cells derived from various human tissues. World J. Stem Cells 11, 347–374. doi: 10.4252/wjsc.v11.i6.347
Kumamoto, M., Nishiwaki, T., Matsuo, N., Kimura, H., and Matsushima, K. (2009). Minimally cultured bone marrow mesenchymal stem cells ameliorate fibrotic lung injury. Eur. Respir. J. 34, 740–748. doi: 10.1183/09031936.00128508
Li, W. (2012). Volcano plots in analyzing differential expressions with mRNA microarrays. J. Bioinform. Comput. Biol. 10:1231003. doi: 10.1142/S0219720012310038
Liu, X., Wu, J., Zhang, D., Bing, Z., Tian, J., Ni, M., et al. (2018). Identification of potential key genes associated with the pathogenesis and prognosis of gastric cancer based on integrated bioinformatics analysis. Front. Genet. 9:265. doi: 10.3389/fgene.2018.00265
Lüscher, B. (2001). Function and regulation of the transcription factors of the Myc/Max/Mad network. Gene 277, 1–14. doi: 10.1016/s0378-1119(01)00697-697
Lv, F. J., Tuan, R. S., Cheung, K. M., and Leung, V. Y. (2014). Concise review: the surface markers and identity of human mesenchymal stem cells. Stem Cells 32, 1408–1419. doi: 10.1002/stem.1681
Maere, S., Heymans, K., and Kuiper, M. (2005). BiNGO: a cytoscape plugin to assess overrepresentation of gene ontology categories in biological networks. Bioinformatics 21, 3448–3449. doi: 10.1093/bioinformatics/bti551
Mehrabani, D., Mojtahed, J. F., Zakerinia, M., Hadianfard, M. J. J., Tanideh, R. N., et al. (2016). The healing effect of bone marrow-derived stem cells in knee osteoarthritis: a case report. World J. plastic Surg. 5, 168–174.
Melnik, S., Werth, N., Boeuf, S., Hahn, E. M., Gotterbarm, T., Anton, M., et al. (2019). Impact of c-MYC expression on proliferation, differentiation, and risk of neoplastic transformation of human mesenchymal stromal cells. Stem Cell Res. Ther. 10:73. doi: 10.1186/s13287-019-1187-z
Michalik, L., and Wahli, W. (2008). PPARs mediate lipid signaling in inflammation and cancer. PPAR Res. 2008:134059. doi: 10.1155/2008/134059
Oberacker, T., Bajorat, J., Ziola, S., Schroeder, A., Roth, D., Kastl, L., et al. (2018). Enhanced expression of thioredoxin-interacting-protein regulates oxidative DNA damage and aging. FEBS Lett. 592, 2297–2307. doi: 10.1002/1873-3468.13156
O’Donoghue, K., and Fisk, N. M. (2004). Fetal stem cells. Best Pract. Res. Clin. Obstet Gynaecol. 18, 853–875. doi: 10.1016/j.bpobgyn.2004.06.010
Paciejewska, M. M., Maijenburg, M. W., Gilissen, C., Kleijer, M., Vermeul, K., Weijer, K., et al. (2016). Different balance of wnt signaling in adult and fetal bone marrow-derived mesenchymal stromal cells. Stem Cells Dev. 25, 934–947. doi: 10.1089/scd.2015.0263
Pan, X., Liu, W., Chai, Y., Hu, L., Wang, J., and Zhang, Y. (2020). Identification of hub genes in atypical teratoid/rhabdoid tumor by bioinformatics analyses. J. Mol. Neurosci. 70, 1906–1913. doi: 10.1007/s12031-020-01587-1588
Park, S. B., Seo, K. W., So, A. Y., Seo, M. S., Yu, K. R., Kang, S. K., et al. (2012). SOX2 has a crucial role in the lineage determination and proliferation of mesenchymal stem cells through Dickkopf-1 and c-MYC. Cell Death Differ. 19, 534–545. doi: 10.1038/cdd.2011.137
Reimand, J., Vaquerizas, J. M., Todd, A. E., Vilo, J., and Luscombe, N. M. (2010). Comprehensive reanalysis of transcription factor knockout expression data in Saccharomyces cerevisiae reveals many new targets. Nucleic Acids Res. 38, 4768–4777. doi: 10.1093/nar/gkq232
Ritchie, M. E., Phipson, B., Wu, D., Hu, Y., Law, C. W., Shi, W., et al. (2015). limma powers differential expression analyses for RNA-sequencing and microarray studies. Nucleic Acids Res. 43:e47. doi: 10.1093/nar/gkv007
Romieu-Mourez, R., Coutu, D. L., and Galipeau, J. (2012). The immune plasticity of mesenchymal stromal cells from mice and men: concordances and discrepancies. Front. Biosci. (Elite edition) 4, 824–837. doi: 10.2741/e422
Ryan, J. M., Barry, F. P., Murphy, J. M., and Mahon, B. P. (2005). Mesenchymal stem cells avoid allogeneic rejection. J. Inflamm. (Lond) 2:8. doi: 10.1186/1476-9255-2-8
Salminen, A., Huuskonen, J., Ojala, J., Kauppinen, A., Kaarniranta, K., and Suuronen, T. (2008). Activation of innate immunity system during aging: NF-kB signaling is the molecular culprit of inflamm-aging. Ageing Res. Rev. 7, 83–105. doi: 10.1016/j.arr.2007.09.002
Schober, P., Boer, C., and Schwarte, L. A. (2018). Correlation coefficients: appropriate use and interpretation. Anesth Analg. 126, 1763–1768. doi: 10.1213/ANE.0000000000002864
Sheng, Y., Wang, W., Hong, B., Jiang, X., Sun, R., Yan, Q., et al. (2018). Upregulation of KIF20A correlates with poor prognosis in gastric cancer. Cancer Manag. Res. 10, 6205–6216. doi: 10.2147/CMAR.S176147
Spitzhorn, L. S., Megges, M., Wruck, W., Rahman, M. S., Otte, J., Degistirici, O., et al. (2019). Human iPSC-derived MSCs (iMSCs) from aged individuals acquire a rejuvenation signature. Stem Cell Res. Ther. 10:100. doi: 10.1186/s13287-019-1209-x
Suvakov, S., Cubro, H., White, W. M., Butler Tobah, Y. S., Weissgerber, T. L., Jordan, K. L., et al. (2019). Targeting senescence improves angiogenic potential of adipose-derived mesenchymal stem cells in patients with preeclampsia. Biol. Sex Differ. 10:49. doi: 10.1186/s13293-019-0263-265
Szklarczyk, D., Morris, J. H., Cook, H., Kuhn, M., Wyder, S., Simonovic, M., et al. (2017). The STRING database in 2017: quality-controlled protein-protein association networks, made broadly accessible. Nucleic Acids Res. 45, D362–D368. doi: 10.1093/nar/gkw937
Taleahmad, S., Mirzaei, M., Parker, L. M., Hassani, S. N., Mollamohammadi, S., Sharifi-Zarchi, A., et al. (2015). Proteome analysis of ground state pluripotency. Sci. Rep. 5:17985. doi: 10.1038/srep17985
Turinetto, V., Vitale, E., and Giachino, C. (2016). Senescence in human mesenchymal stem cells: functional changes and implications in stem cell-based therapy. Int. J. Mol. Sci. 17:1164. doi: 10.3390/ijms17071164
Verfaillie, C. M., Pera, M. F., and Lansdorp, P. M. (2002). Stem cells: hype and reality. Hematol. Am. Soc. Hematol. Educ. Prog. 2002, 369–391. doi: 10.1182/asheducation-2002.1.369
Walter, W., Sanchez-Cabo, F., and Ricote, M. (2015). GOplot: an R package for visually combining expression data with functional analysis. Bioinformatics 31, 2912–2914. doi: 10.1093/bioinformatics/btv300
Wei, B., Yao, Q., Guo, Y., Mao, F., Liu, S., Xu, Y., et al. (2015). Three-dimensional polycaprolactone-hydroxyapatite scaffolds combined with bone marrow cells for cartilage tissue engineering. J. Biomater. Appl. 30, 160–170. doi: 10.1177/0885328215575762
Xu, D., Popov, N., Hou, M., Wang, Q., Björkholm, M., Gruber, A., et al. (2001). Switch from Myc/Max to Mad1/Max binding and decrease in histone acetylation at the telomerase reverse transcriptase promoter during differentiation of HL60 cells. Proc. Natl. Acad. Sci. U S A. 98, 3826–3831. doi: 10.1073/071043198
Xu, J., Wang, B., Sun, Y., Wu, T., Liu, Y., Zhang, J., et al. (2016). Human fetal mesenchymal stem cell secretome enhances bone consolidation in distraction osteogenesis. Stem Cell Res. Ther. 7:134. doi: 10.1186/s13287-016-0392-392
Yu, G., Wang, L. G., Han, Y., and He, Q. Y. (2012). clusterProfiler: an R package for comparing biological themes among gene clusters. OMICS 16, 284–287. doi: 10.1089/omi.2011.0118
Keywords: bone marrow mesenchymal stem cell, fetal stem cell, adult setm cell, robust rank aggregation, hub genes
Citation: Liu X, Yin M, Liu X, Da J, Zhang K, Zhang X, Liu L, Wang J, Jin H, Liu Z, Zhang B and Li Y (2020) Analysis of Hub Genes Involved in Distinction Between Aged and Fetal Bone Marrow Mesenchymal Stem Cells by Robust Rank Aggregation and Multiple Functional Annotation Methods. Front. Genet. 11:573877. doi: 10.3389/fgene.2020.573877
Received: 18 June 2020; Accepted: 24 November 2020;
Published: 14 December 2020.
Edited by:
Shuai Cheng Li, City University of Hong Kong, Hong KongReviewed by:
Bhanwar Lal Puniya, University of Nebraska-Lincoln, United StatesCopyright © 2020 Liu, Yin, Liu, Da, Zhang, Zhang, Liu, Wang, Jin, Liu, Zhang and Li. This is an open-access article distributed under the terms of the Creative Commons Attribution License (CC BY). The use, distribution or reproduction in other forums is permitted, provided the original author(s) and the copyright owner(s) are credited and that the original publication in this journal is cited, in accordance with accepted academic practice. No use, distribution or reproduction is permitted which does not comply with these terms.
*Correspondence: Bin Zhang, emhhbmdiaW5AaHJibXUuZWR1LmNu; Ying Li, bGl5aW5nQGhyYm11LmVkdS5jbg==
Disclaimer: All claims expressed in this article are solely those of the authors and do not necessarily represent those of their affiliated organizations, or those of the publisher, the editors and the reviewers. Any product that may be evaluated in this article or claim that may be made by its manufacturer is not guaranteed or endorsed by the publisher.
Research integrity at Frontiers
Learn more about the work of our research integrity team to safeguard the quality of each article we publish.