 Jingjing Jin
 Dan Liu3,4†
 Jun Ma
- 1College of Plant Protection, Hebei Agricultural University, Baoding, China
- 2State Key Laboratory of North China Crop Improvement and Regulation, Baoding, China
- 3Neijiang Academy of Agricultural Sciences, Neijiang, China
- 4School of Life Sciences and Engineering, Southwest University of Science and Technology, Mianyang, China
- 5College of Agronomy and Biotechnology, China Agricultural University, Beijing, China
- 6College of Agronomy, Hebei Agricultural University, Baoding, China
Flag leaves, plant height (PH), and spike-related traits are key determinants contributing to yield potential in wheat. In this study, we developed a recombinant inbred line (RIL) population with 94 lines derived from the cross between ‘AS985472’ and ‘Sumai 3.’ A genetic map spanned 3553.69 cM in length were constructed using 1978 DArT markers. Severn traits including flag leaf width (FLW), flag leaf length (FLL), PH, anthesis date (AD), spike length (SL), spikelet number spike (SNS), and spike density (SD) were evaluated against this RIL population under three different environments. Combined phenotypic data and genetic map, we identified quantitative trait loci (QTL) for each trait. A total of four major and stably expressed QTLs for FLW, PH, and SD were detected on chromosomes 2D and 4B. Of them, the major QTLs individually explained 10.10 – 30.68% of the phenotypic variation. QTLs with pleiotropic effects were identified on chromosomes 4A and 6D as well. Furthermore, the genetic relationships between seven yield-related traits were detected and discussed. A few genes related to leaf growth and development at the interval of a major locus for FLW on chromosome 2D were predicated. Overall, the present study provided useful information for understanding the genetic basis of yield-related traits and will be useful for marker-assisted selection in wheat breeding.
Introduction
Ninety-five percent of the energy in nature comes from photosynthesis(Zhai et al., 2002) and the leaves are the major photosynthetic organ in plants. Flag leaf, the first leaf under the spike of wheat (Triticum aestivum L.), contributes to photosynthesis and provides water and nutrients to the spikes for grain filling (Yang et al., 2016). Other agronomic traits like anthesis date (AD), spike length (SL), spikelet number per spike (SNS), and spike density (SD) are also key determinants of the plant architecture and yield potential. It is known that grain yield is closely correlated with AD (Woodruff and Tonks, 1983), plant height (PH) (Hedden, 2003), SL (Liu et al., 2018b), SNS (Hai et al., 2008), and SD (Li et al., 2016). Thus, a comprehensive understanding of the genetic mechanism for flag leaf width (FLW), flag leaf length (FLL), PH and spike-related traits is critical for increasing grain yield.
Agronomic traits are usually controlled by multiple genes and numerous quantitative trait loci (QTL) for them have been reported on A, B, and D genomes in wheat. For instance, in hexaploid wheat, major QTLs for FLL, FLW, flag leaf area (FLA), the ratio of length/width of flag leaf (FLR), flag leaf angle (FLANG), fag leaf opening angle (FLOA) and fag leaf bend angle (FLBA) were mapped to chromosomes 2D, 5B, 4B (Ma et al., 2020). Liu et al. (2018c) detected QTLs for FLL, FLW, FLA and FLANG on chromosomes 1B, 2B, 3A, 3D, 4B, 5A, 6B, 7B, and 7D using a recombinant inbred line (RIL) population derived from ‘ND3331’ and ‘Zang1817.’ Hu et al. (2020) identified 161 QTLs for yield-related traits including grain yield per plant (GYP), spike number per plant (SN), kernel number per spike (KPS), SL, SNS, FLL, FLW, FLA, PH, AD and heading date (HD) on 21 chromosomes except 2D, 3D, and 6D. Although studies on traits related to flag leaf and spike have made great progress, there are still many novel loci that can be excavated and utilized from different germplasm resources.
Significant correlations between agronomic traits of wheat were observed in numerous studies. For example, a study of phenotypic correlations showed that SNS was significantly and positively correlated with SL, AD, and KPS (Ma et al., 2019a). Furthermore, QTLs or genes with pleiotropic effects on agronomic traits in wheat have been previously verified. For example, QTLs with pleiotropic effects to SN, SL, and KPS were identified on chromosomes 1B, 4B, and 5A (Deng et al., 2011). Similarly, Ma et al. (2020) detected two pleiotropic QTLs associated with FLL and FLR on chromosomes 5B, two pleiotropic QTLs for FLOA and FLBA on chromosomes 2D, and three pleiotropic QTLs for FLL, FLW and FLA on chromosomes 2D, and they shared the same or overlapped physical intervals on ‘Chinese Spring’ (CS) genomes. Additionally, these pleiotropic QTLs exhibited significant associations in Pearson correlation analysis. Thus, pleiotropic or linked loci could benefit improving breeding efficiency for multiple elite traits.
The present study focused on detecting QTLs controlling flag leaf traits including FLL and FLW, and spike-related traits including SNS, SL and SD, and AD and PH in a RIL population developed from the cross between ‘AS985472’ and ‘Sumai 3,’ and evaluating their genetic correlations. This study will provide valuable information to understand the genetic basis of yield-related traits and help to accelerate molecular assisted breeding in wheat.
Materials and Methods
Plant Materials
A total of 94 F8 RILs generated from the cross of ‘AS985472’/‘Sumai 3’ (AS) were used in the present study. ‘AS985472’ is an advance wheat line; ‘Sumai 3’ is an excellent germplasm resource with high resistance to Fusarium head blight (Xie et al., 2007).
Field Trials and Phenotypic Evaluation
From 2017 to 2019, 94 AS RILs and the two parents were planted at Chongzhou (CZ, 103° 38′ E, 30° 32′ N) of Sichuan Province with a random block design. Each line was in a single 1.5-m row with 30-cm apart between rows, and 15 seeds were planted in each row with 10-cm space between individuals.
Anthesis date (d) was calculated from the sowing date to date when more than 50% of the plants of a line flowered. After anthesis, FLW (cm) was determined by the widest section of the flag leaf, FLL (cm) was measured as the length from the base to the top of the flag leaf. The measurements of PH (cm), SL (cm), SNS and SD were carried out as described by Ma et al. (2019a). PH was obtained by measuring the height from the base to the top of the main spike excluding the awns. SL was the length of the main spike of an individual plant (excluding awns). SNS was determined by the number of spikelets of the spike for the main tiller and SD was SNS divided by SL.
Statistical Analysis and QTLs Detection
Data obtained from 2017 to 2019 in CZ were subjected to combined analysis. The mean values and the Student’s t-test (P < 0.05) of the parental lines were calculated. For each RIL, the maximum and minimum values, mean values and standard deviation were analyzed using the SPSS Statistic 25 (IBM SPSS, Armonk, NY, United States).
To estimate random effects in statistics, the best linear unbiased prediction (BLUP) for seven yield-related traits in different environments were calculated using SAS version 8.0 (SAS Institute, Cary, NC, United States). The BLUP for the phenotypic values were calculated according to the model: Yi = Xif+ ai + ei, where f = a vector of fixed effects, Xi = an incidence vector, ei = the environmental deviation, and ai = the phenotypic value (Goddard, 1992). The broad-sense heritability (H2) was estimated using the following formula: H2 = VG/(VG + VGE/r + VE). Where VG = genetic variance, VGE = genotype × environment variance, r = the number of replicates, and VE = environ mental variance (Smith et al., 1998).
The genetic linkage map was constructed according to a previous study (Liu et al., submitted). To retain high confidence markers, minor allele frequency (<0.3) of the markers were excluded using the BIN function of Icimapping 4.1 and the linkage group for AS population was integrated using the software Joinmap 4.0 according to Liu et al. (2018a). The linkage map was 3553.69 cM in length containing 31 linkage groups and 1978 DArT markers (Liu et al., submitted). Then, the putative QTLs were detected with a minimum LOD (log-of-odds) value of 2.5 by the BIP (Biparental Populations) module (Lin et al., 1996) and ICIM (inclusive composite interval mapping) method from Icimapping 4.1. Among the detected QTLs, those with >10% of phenotypic variation and could be detected in at least two tested environments as well as the BLUP dataset were treated as major stable QTLs and those with a common flanking marker were considered as a single QTL.
Comparison of QTLs Related to FLW on 2D
The physical positions of the major QTLs on the genome assembly of T. aestivum cv. Chinese Spring or CS (IWGSC RefSeq v1.0)1 (The International Wheat Genome Sequencing Consortium, 2018), Ae. tauschii (Aet V4.02) (Luo et al., 2017), and T. turgidum3 (Avni et al., 2017) and the analysis of candidate genes within the interval between the flanking markers on CS genome were obtained according to previous studies (Ma et al., 2020). Additionally, the physical positions of the major loci detected in the present study were compared with the reported QTLs or genes.
Results
Phenotypic Performance of the ES RILs
The analyses of phenotypic variation showed that significant differences existed between ‘AS985472’ and ‘Sumai 3’ (P < 0.05, Table 1 and Figure 1). ‘Sumai 3’ had wider FLW, longer FLL, higher PH, more SNS, longer spike but lower SD, later AD than ‘AS985472.’ In addition, the continuous distributions with ranges from 1.52 to 2.90 cm in FLW, 19.41 to 31.05 cm for FLL, 136 to 162 d for AD, 61.67 to 131.17 cm for PH, 8.2 to 15.63 cm for SL, 17 to 25 for SNS and 1.37 to 2.15 for SD (Table 1) and transgressive segregation across all environments as well as in the BLUP datasets (Figure 2) indicated that the RILs were suitable for QTL analysis. The estimated H2 of FLW, FLL, AD, PH, SL, SNS, and SD for ES RILs were ranged from 0.75 to 0.97, SL had the highest H2 (0.97), followed by PH (0.95), and SD had the lowest H2 (0.75), implicating that these traits were mainly controlled by genetic factors.
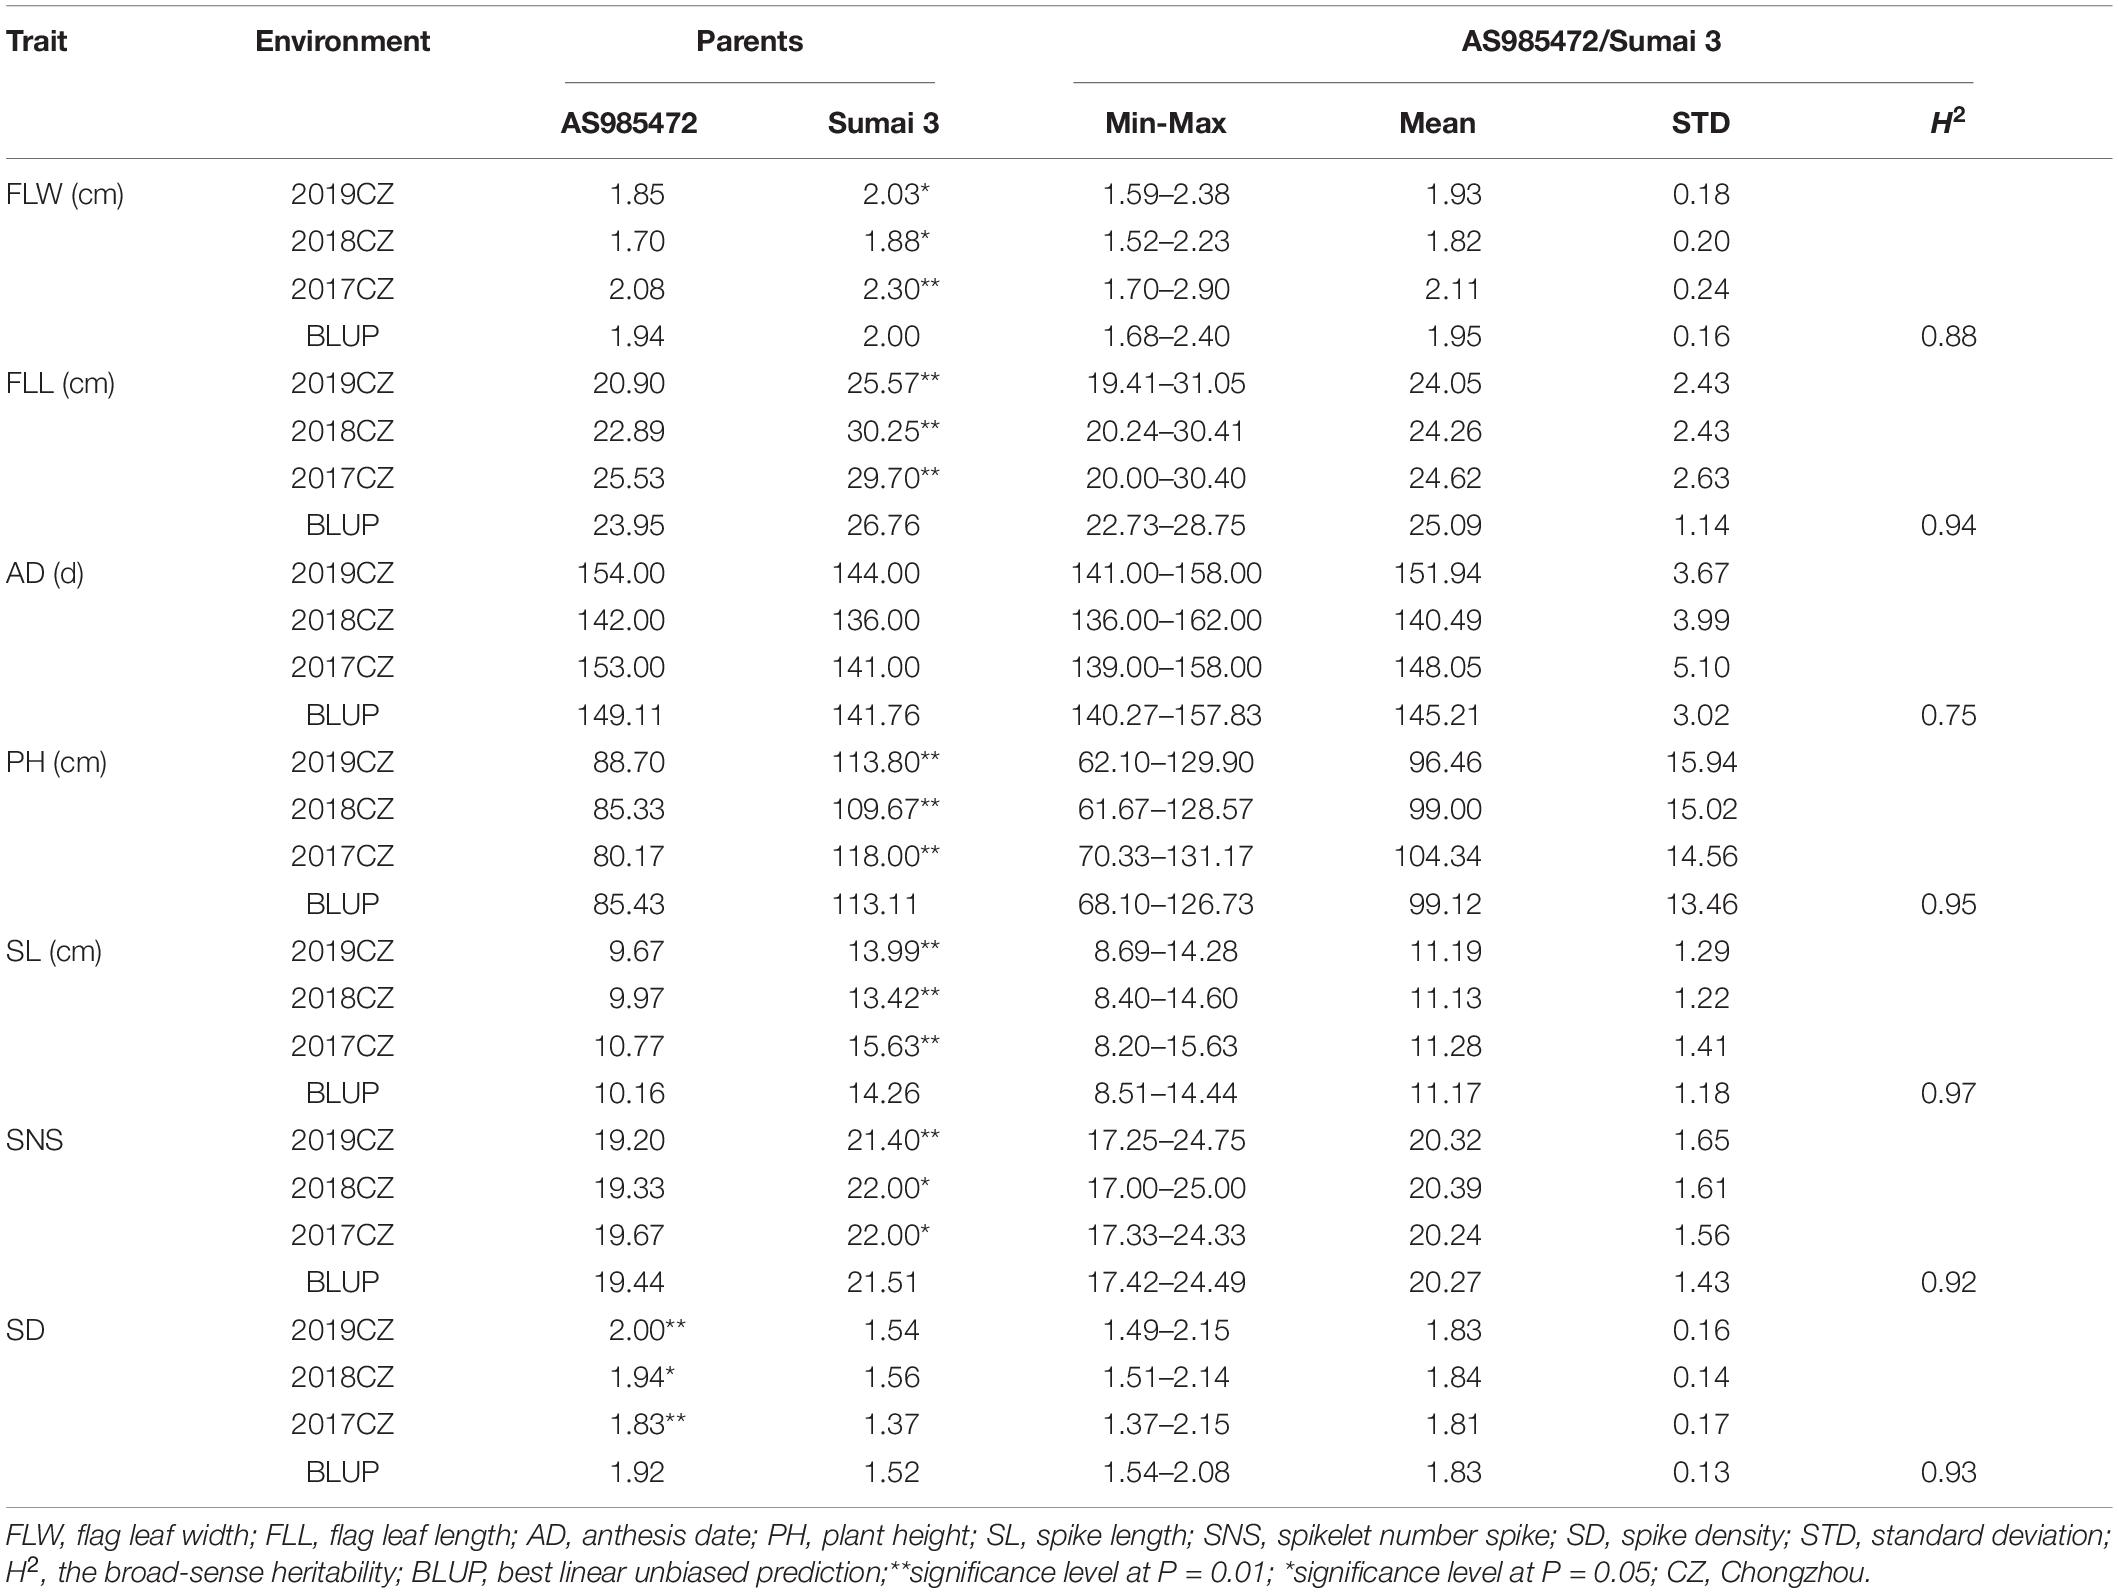
Table 1. Phenotypic variation and heritability (H2) for seven yield-related traits of the ‘AS985472’/ ‘Sumai 3’ (AS) population in different environments.
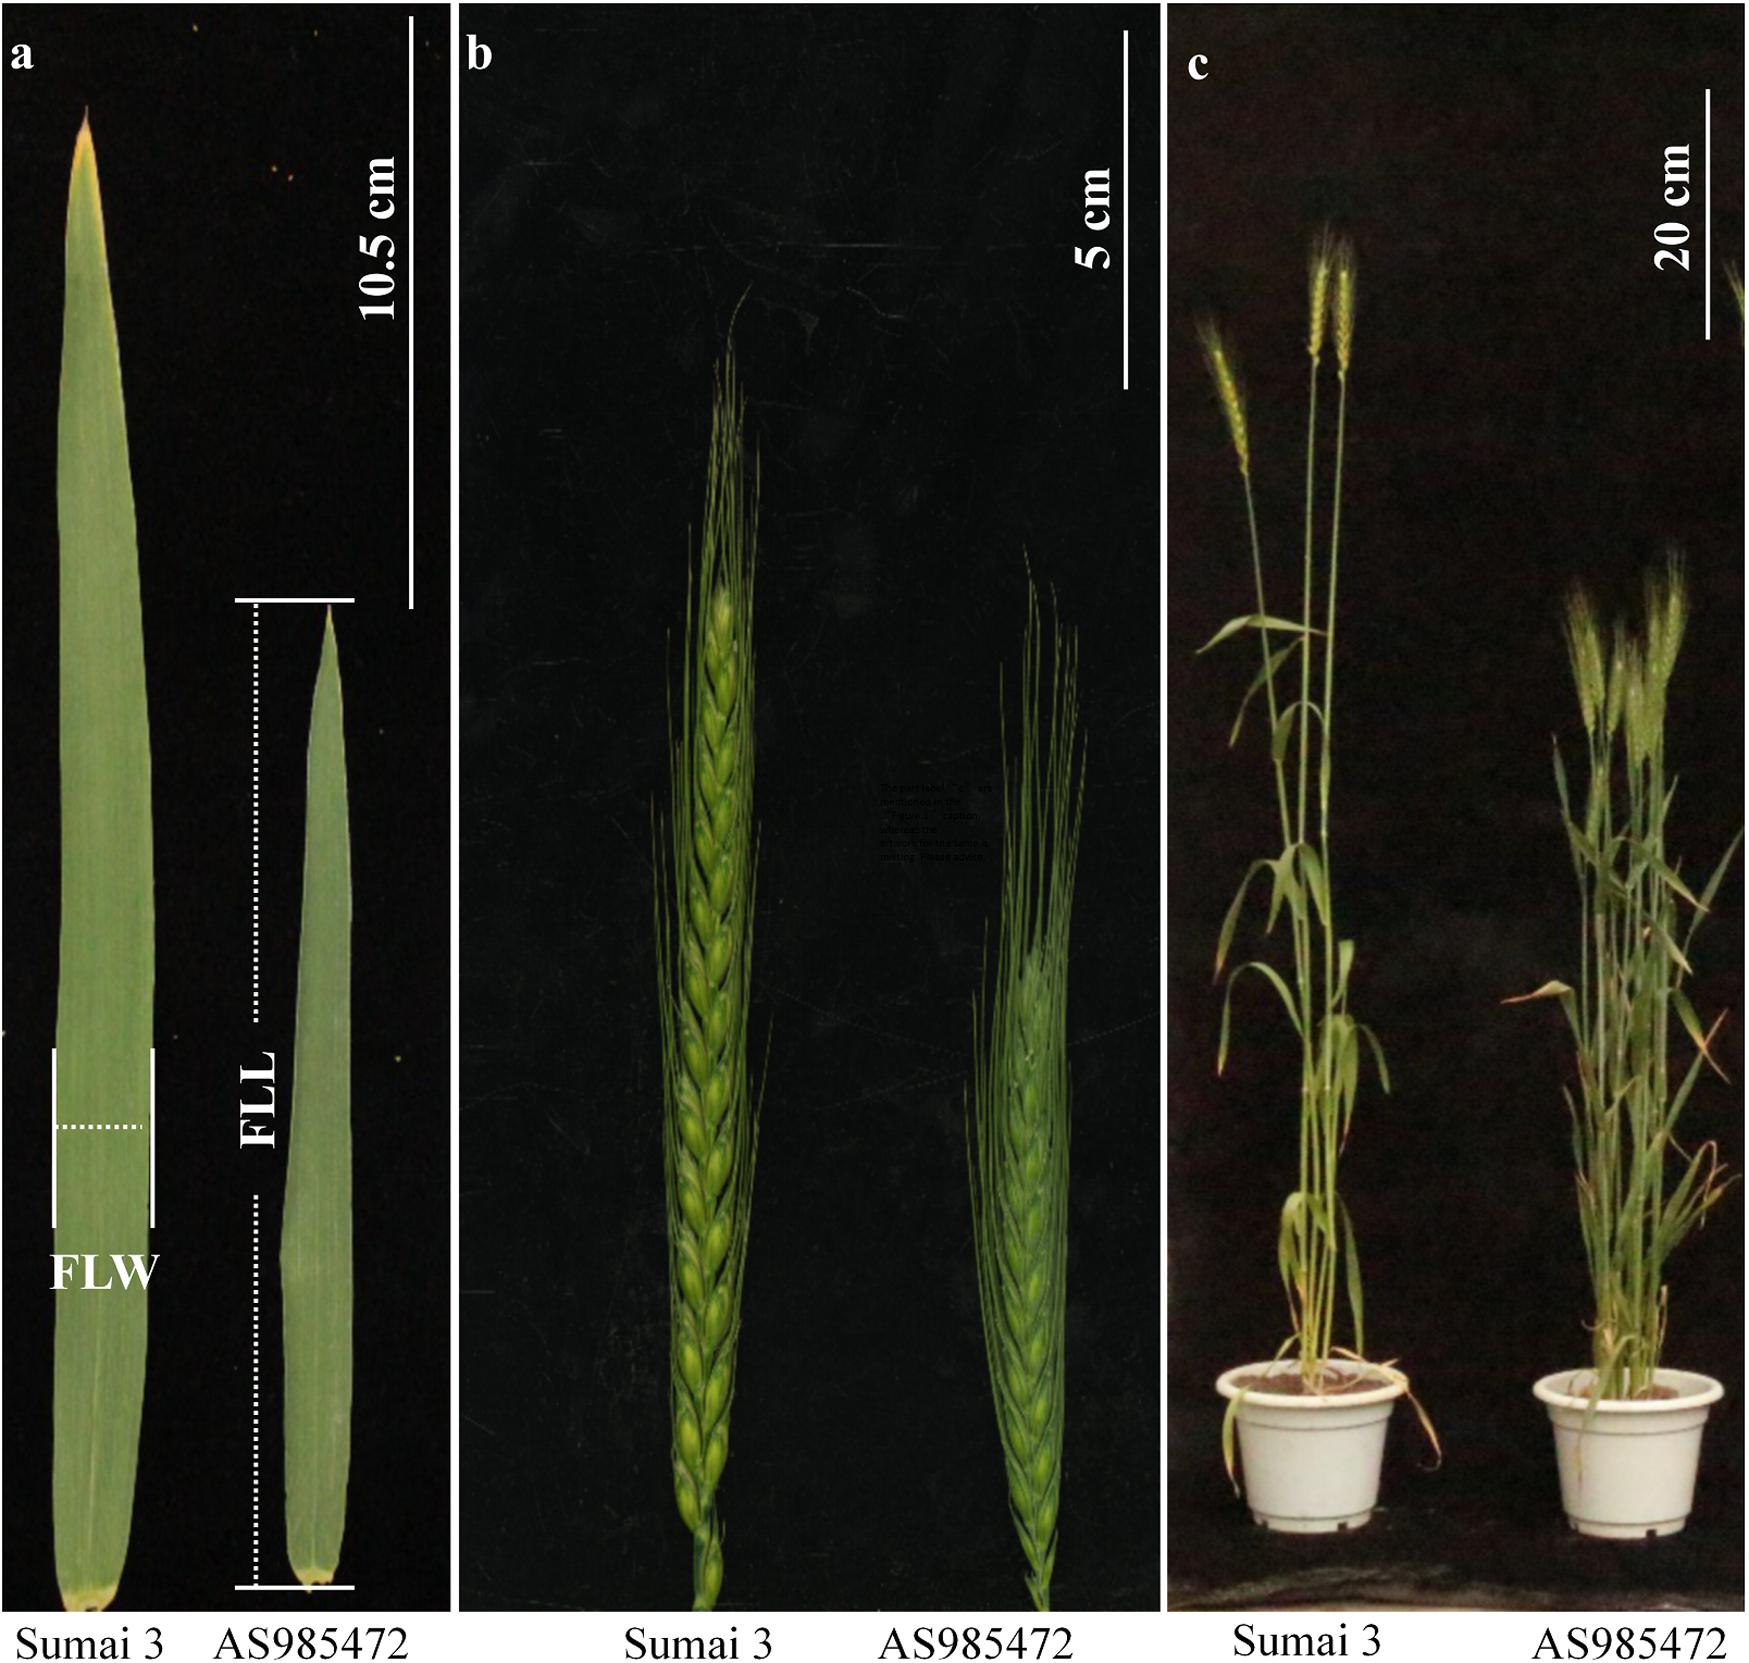
Figure 1. Morphology of the flag leaf (a), spike (b), and plant architecture (c) of ‘Sumai 3’ and ‘AS985472’. (Scale bar = 10.5, 5, and 20 cm, respectively).
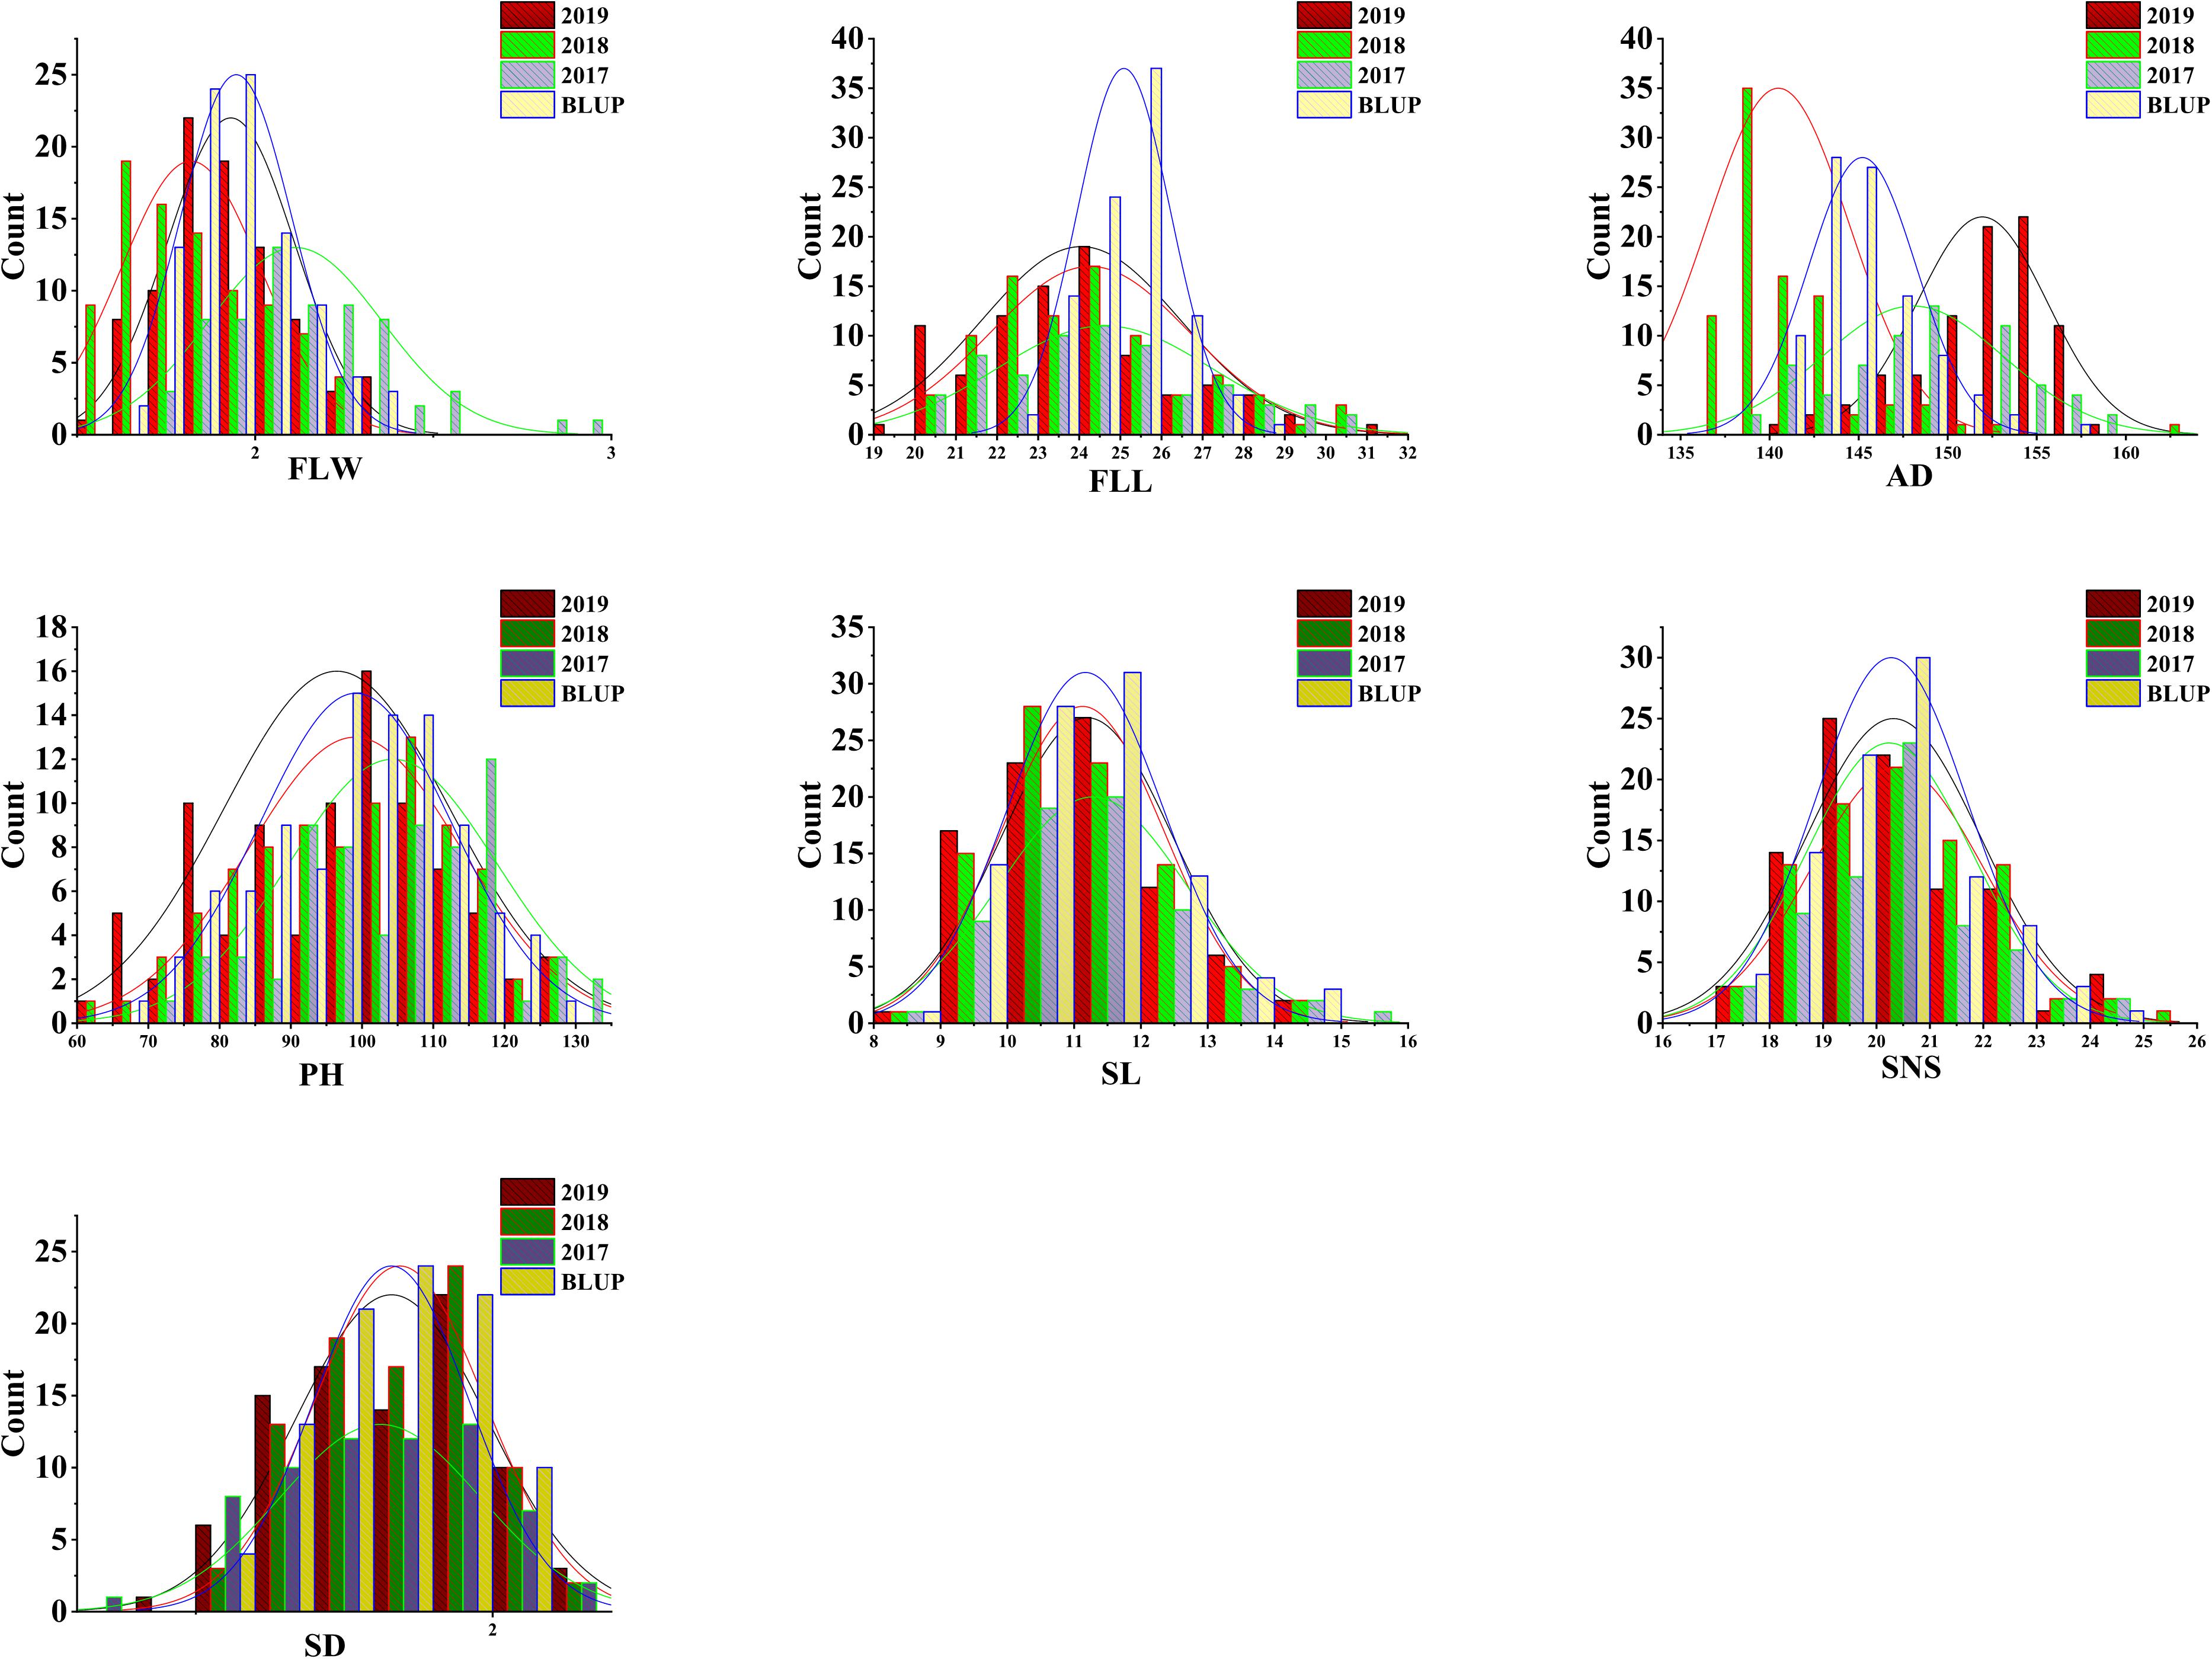
Figure 2. Phenotypic distribution of wheat flag leaf width (FLW), flag leaf length (FLL), anthesis date (AD), plant height (PH), spike length (SL), spikelet number per spike (SNS) and spike density (SD) in the ‘AS985472’/‘Sumai 3’ or AS recombinant inbred population.
Relationships Among Seven Agronomic Traits
In the three environments as well as the BLUP dataset, for FLW, AD, FLL, PH, SL, SNS, and SD, significant correlations with coefficients ranging from 0.444 to 0.978 were detected (P < 0.05; Table 2). Correlation coefficients between seven agronomic traits using the BLUP dataset were presented in Table 3. FLW was significantly correlated to SNS (r = 0.230, P < 0.05), whereas there were no significant differences between FLW and other yield-related traits. For AD, positive and significant relationships (0.269 ≤ r ≤ 0.446, P < 0.01) between AD and FLL, SL and SNS were observed. FLL was significantly associated with AD, SL, and SNS (0.269 ≤ r ≤ 0.455, P < 0.01). PH was positively and significantly associated with SL and SNS (0.237 ≤ r ≤ 0.446, P < 0.05). Regarding SL, positive and significant correlations between SL and AD, FLL, PH and SNS were detected (0.446 ≤ r ≤ 0.668, P < 0.01). SNS was positively and significantly correlated with AD, FLW, FLL, PH, and SL (0.230 ≤ r ≤ 0.668, P < 0.05). For SD, SD was negatively and significantly related to AD, FLL, PH and SL (−0.724 ≤ r ≤ −0.229, P < 0.05).
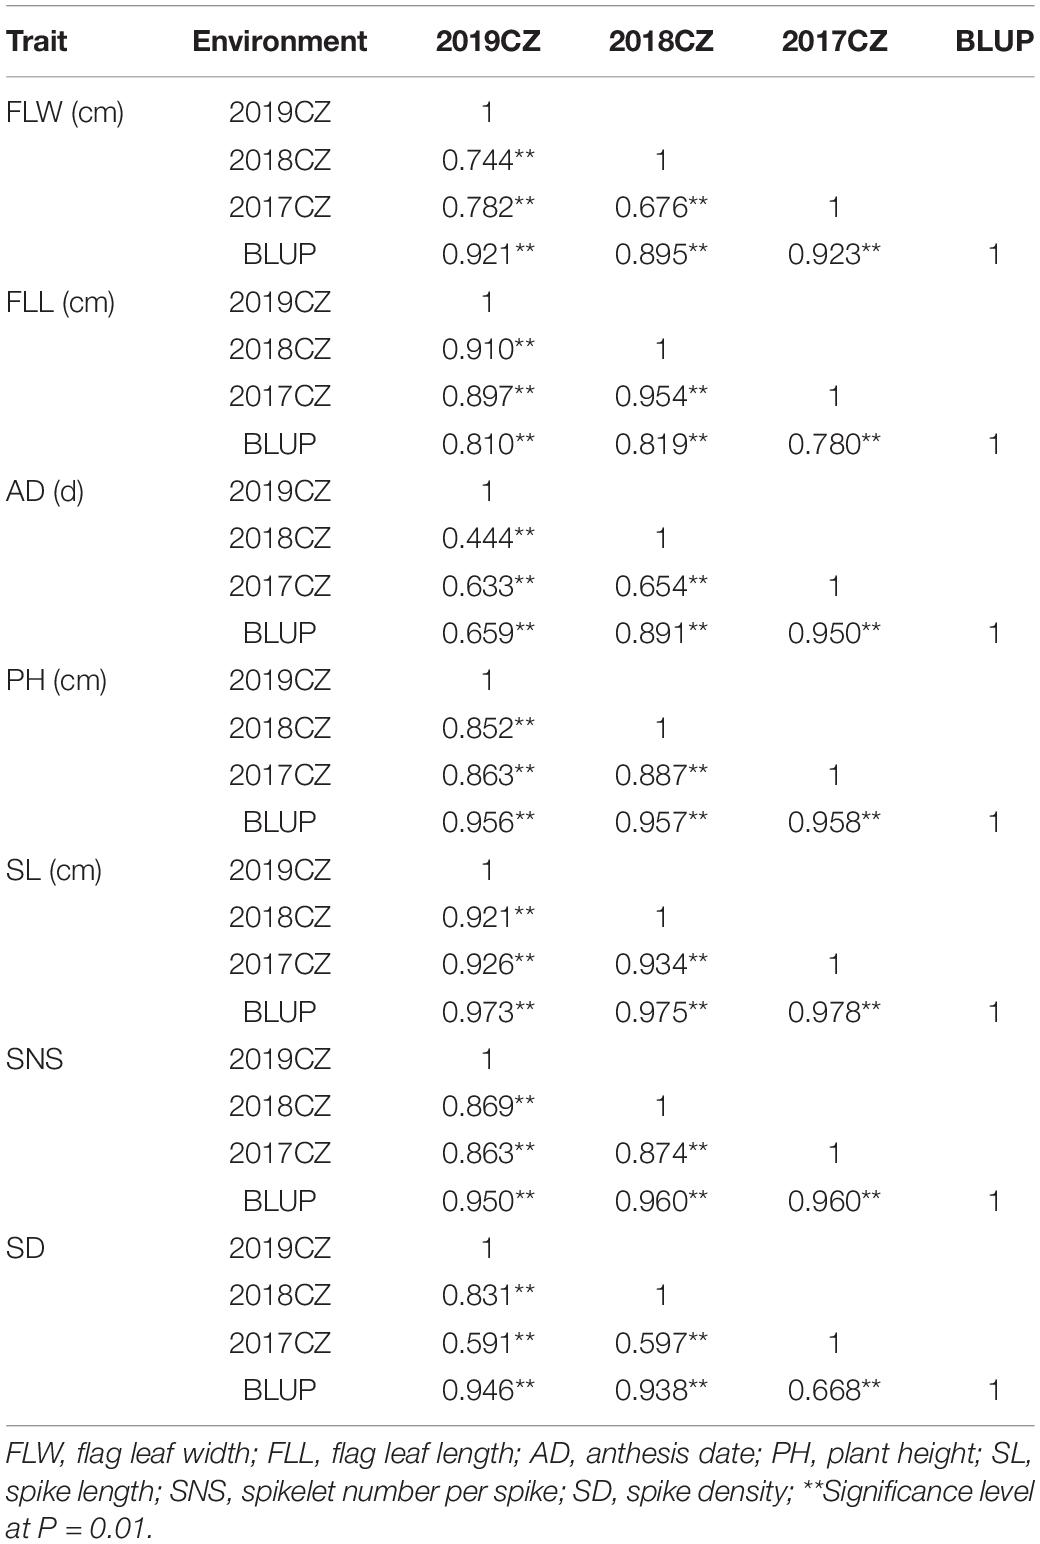
Table 2. Phenotypic correlations of seven yield-related traits in different environments.
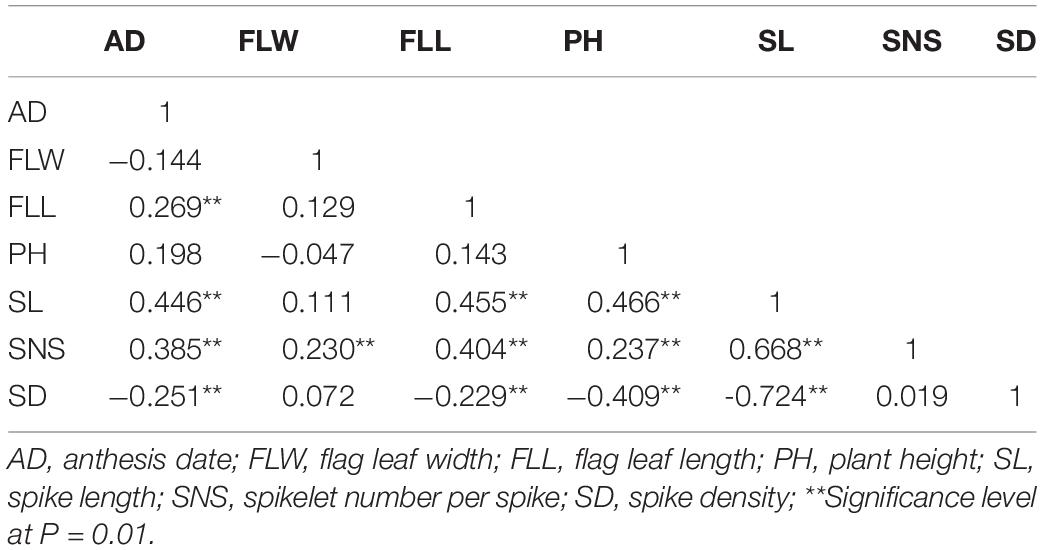
Table 3. Phenotypic correlations between seven yield-related traits with BLUP data in ‘AS985472’/‘Sumai 3’ (AS) population.
QTLs Analysis
QTLs conferring FLW, FLL, AD, PH, SL, SNS, and SD were detected in the AS population (Table 4). A total of two putative FLW QTLs (QFlw.hebau-2D and QFlw.hebau-3D) were identified on chromosomes 2D and 3D which individually explained 19.30 – 24.88% and 15.58% of the phenotypic variance, respectively; and the positive alleles of both were contributed by ‘Sumai 3’. Among them, QFlw.hebau-2D, a major stable QTL flanked by 1128324| F| 0 and 1081989| F| 0 (Table 4 and Figure 3), was detected in three environments and was confirmed by the BLUP dataset. For FLL, only a minor QTL (QFll.hebau-5A-1) was detected. With respect to AD, three QTLs with > 10% of the phenotypic variance were identified on chromosomes 2A and 2D, while they were detected in only one environment. For PH, six putative QTLs were mapped to chromosomes 2D, 4A, 4B and 6A. Two major and stable QTLs (QPh.hebau-2D.1, and QPh.hebau-4B) controlling PH accounted for the phenotypic variance up to 12.69 and 30.68%, and they were flanked by 1116536| F| 0 – 2247268| F| 0, and 1123959| F| 0 - 1123635| F| 0, respectively. ‘AS985472’ contributed the major alleles for increased PH at QPh.hebau-2D.1, and ‘Sumai 3’ contributed alleles for increased PH at QPh.hebau-4B. For SL, we detected eight loci, and two of the QTLs were co-localized with the major QTLs for SNS (QSns.hebau-4A) and for SD (QSd.hebau-6D.1). For SNS, seven QTLs with the 7.55 – 20.96% of the phenotypic variance were identified on chromosomes 2D, 3B, 4A, 5A, 5D, 7A, and 7B. Five QTLs for SD were mapped to chromosomes 2D, 3D, 4B, and 6D, of these, the major and stably expressed QTL QSd.hebau-2D accounted for 10.19–14.91% of the phenotypic variance and ‘Sumai 3’ contributed the major alleles at this locus.
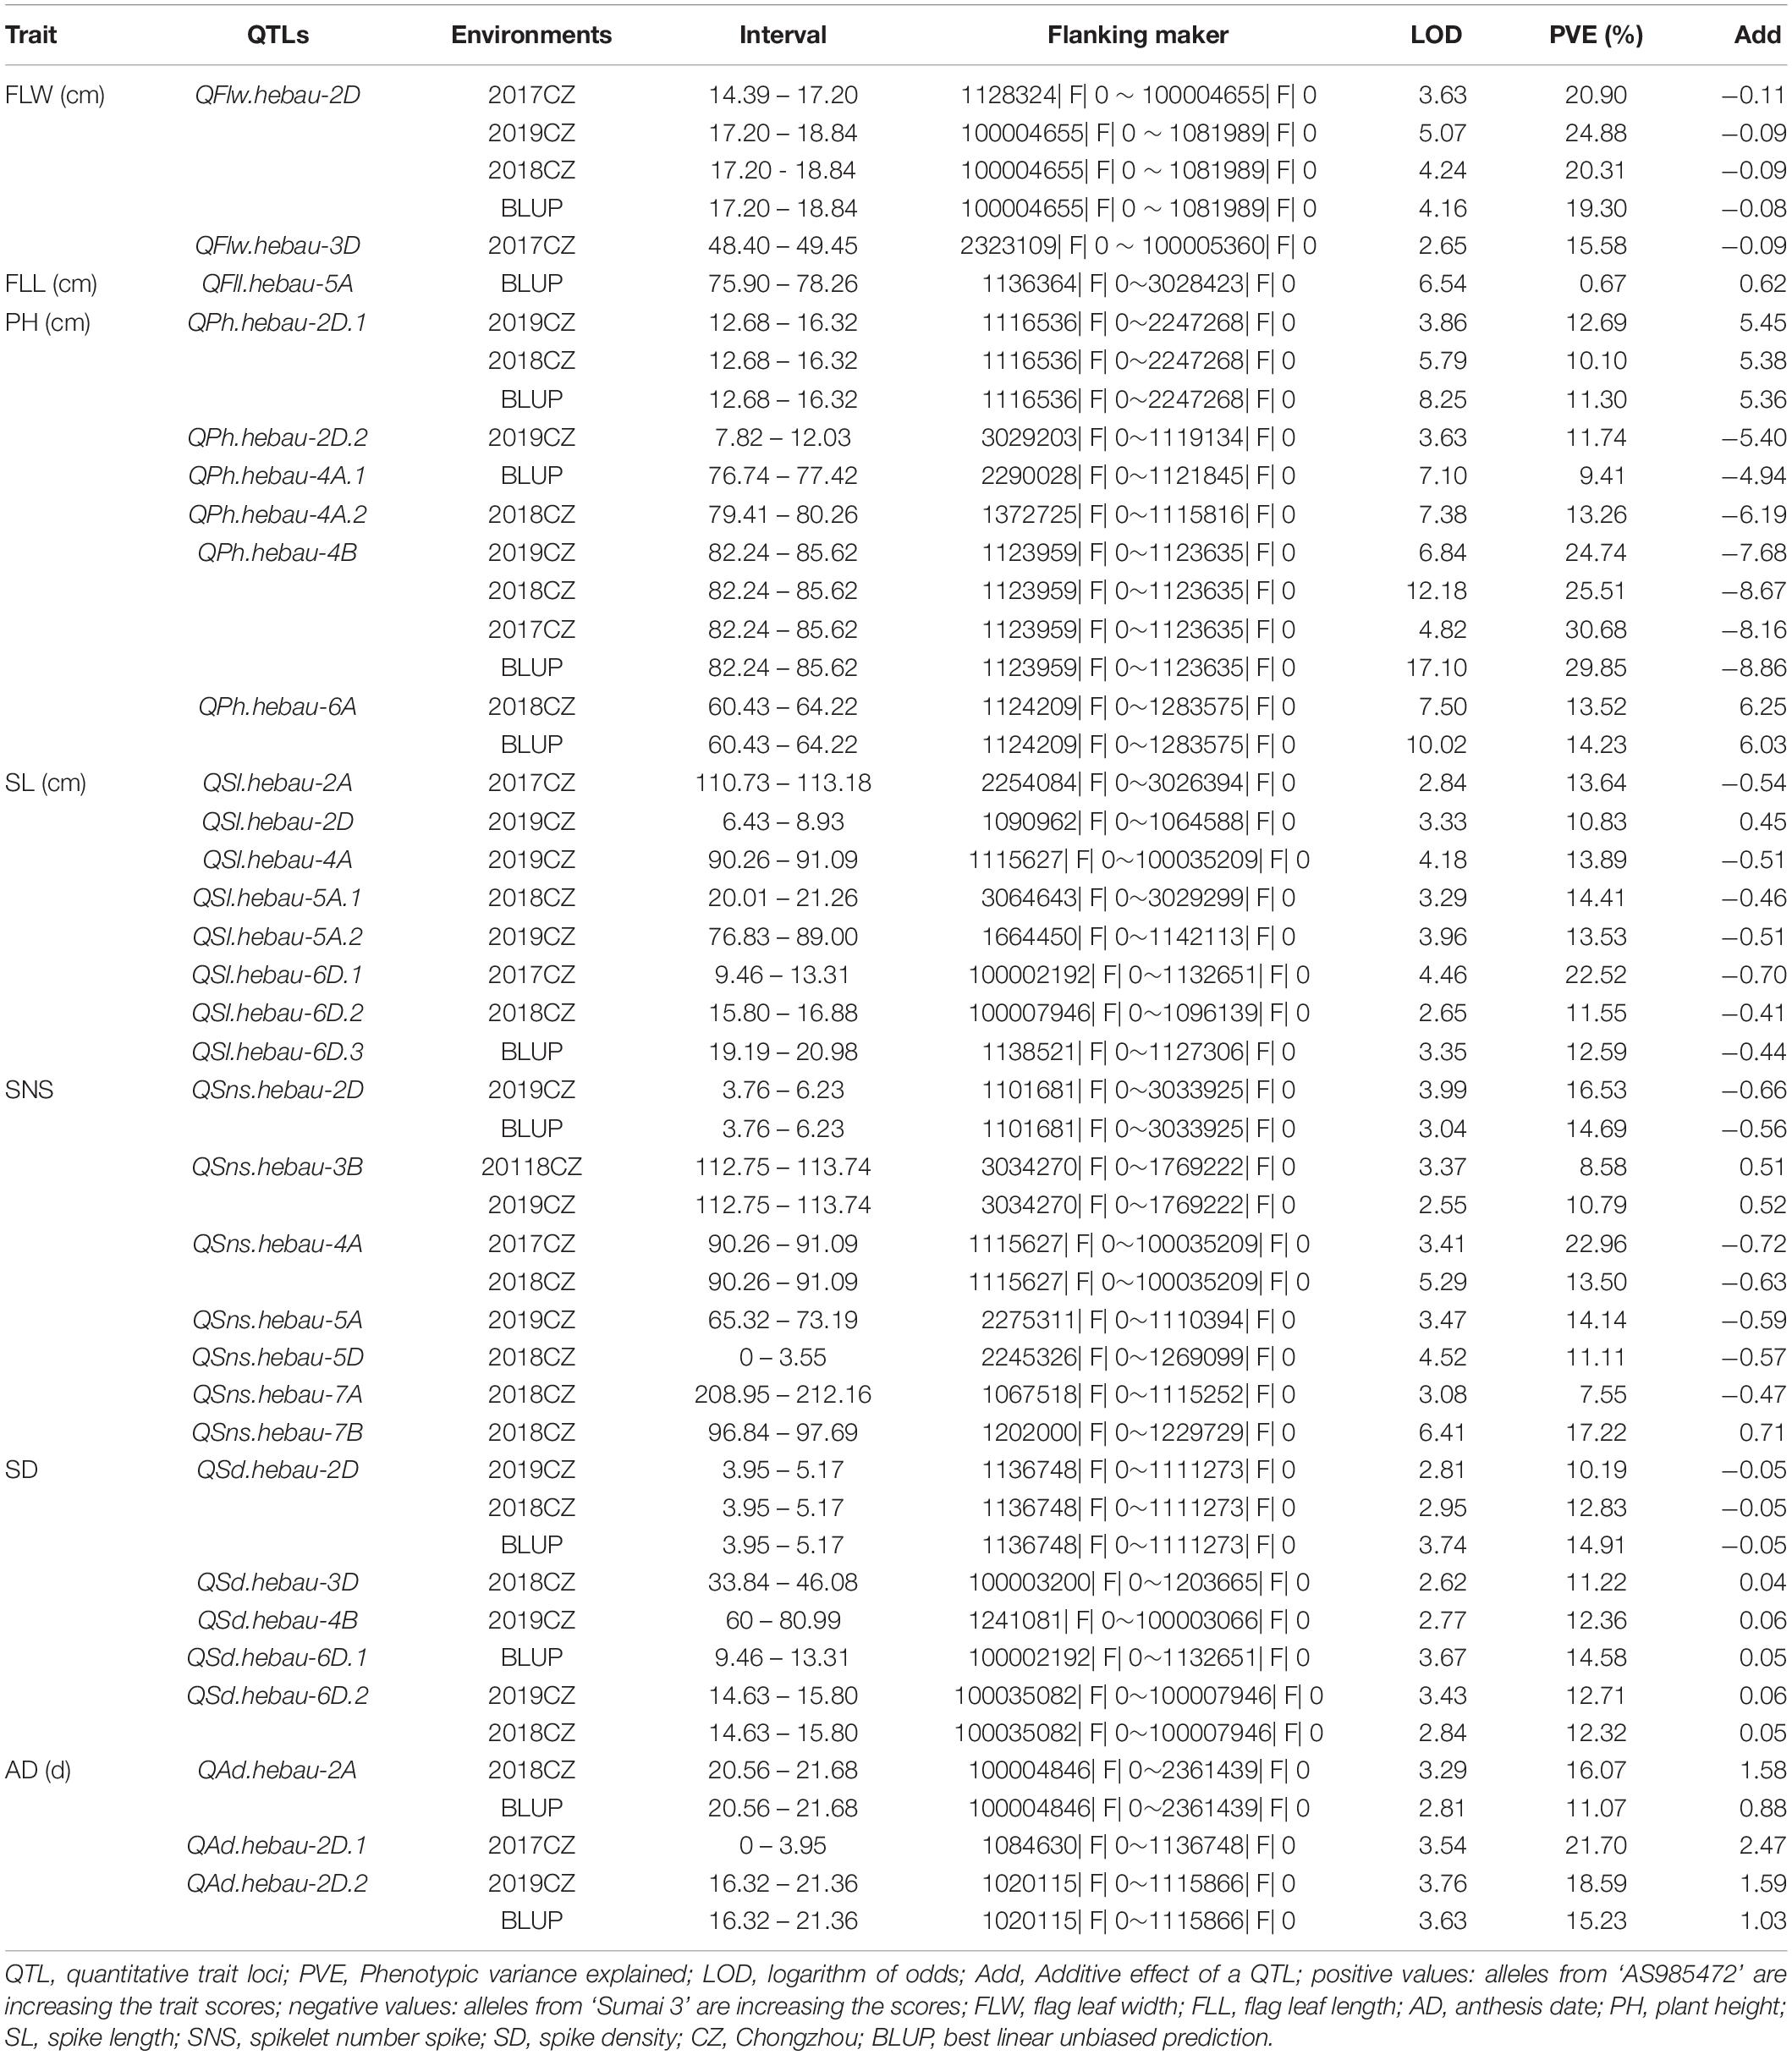
Table 4. Quantitative trait loci (QTL) analysis for seven yield-related traits with single environment method and BLUP data.
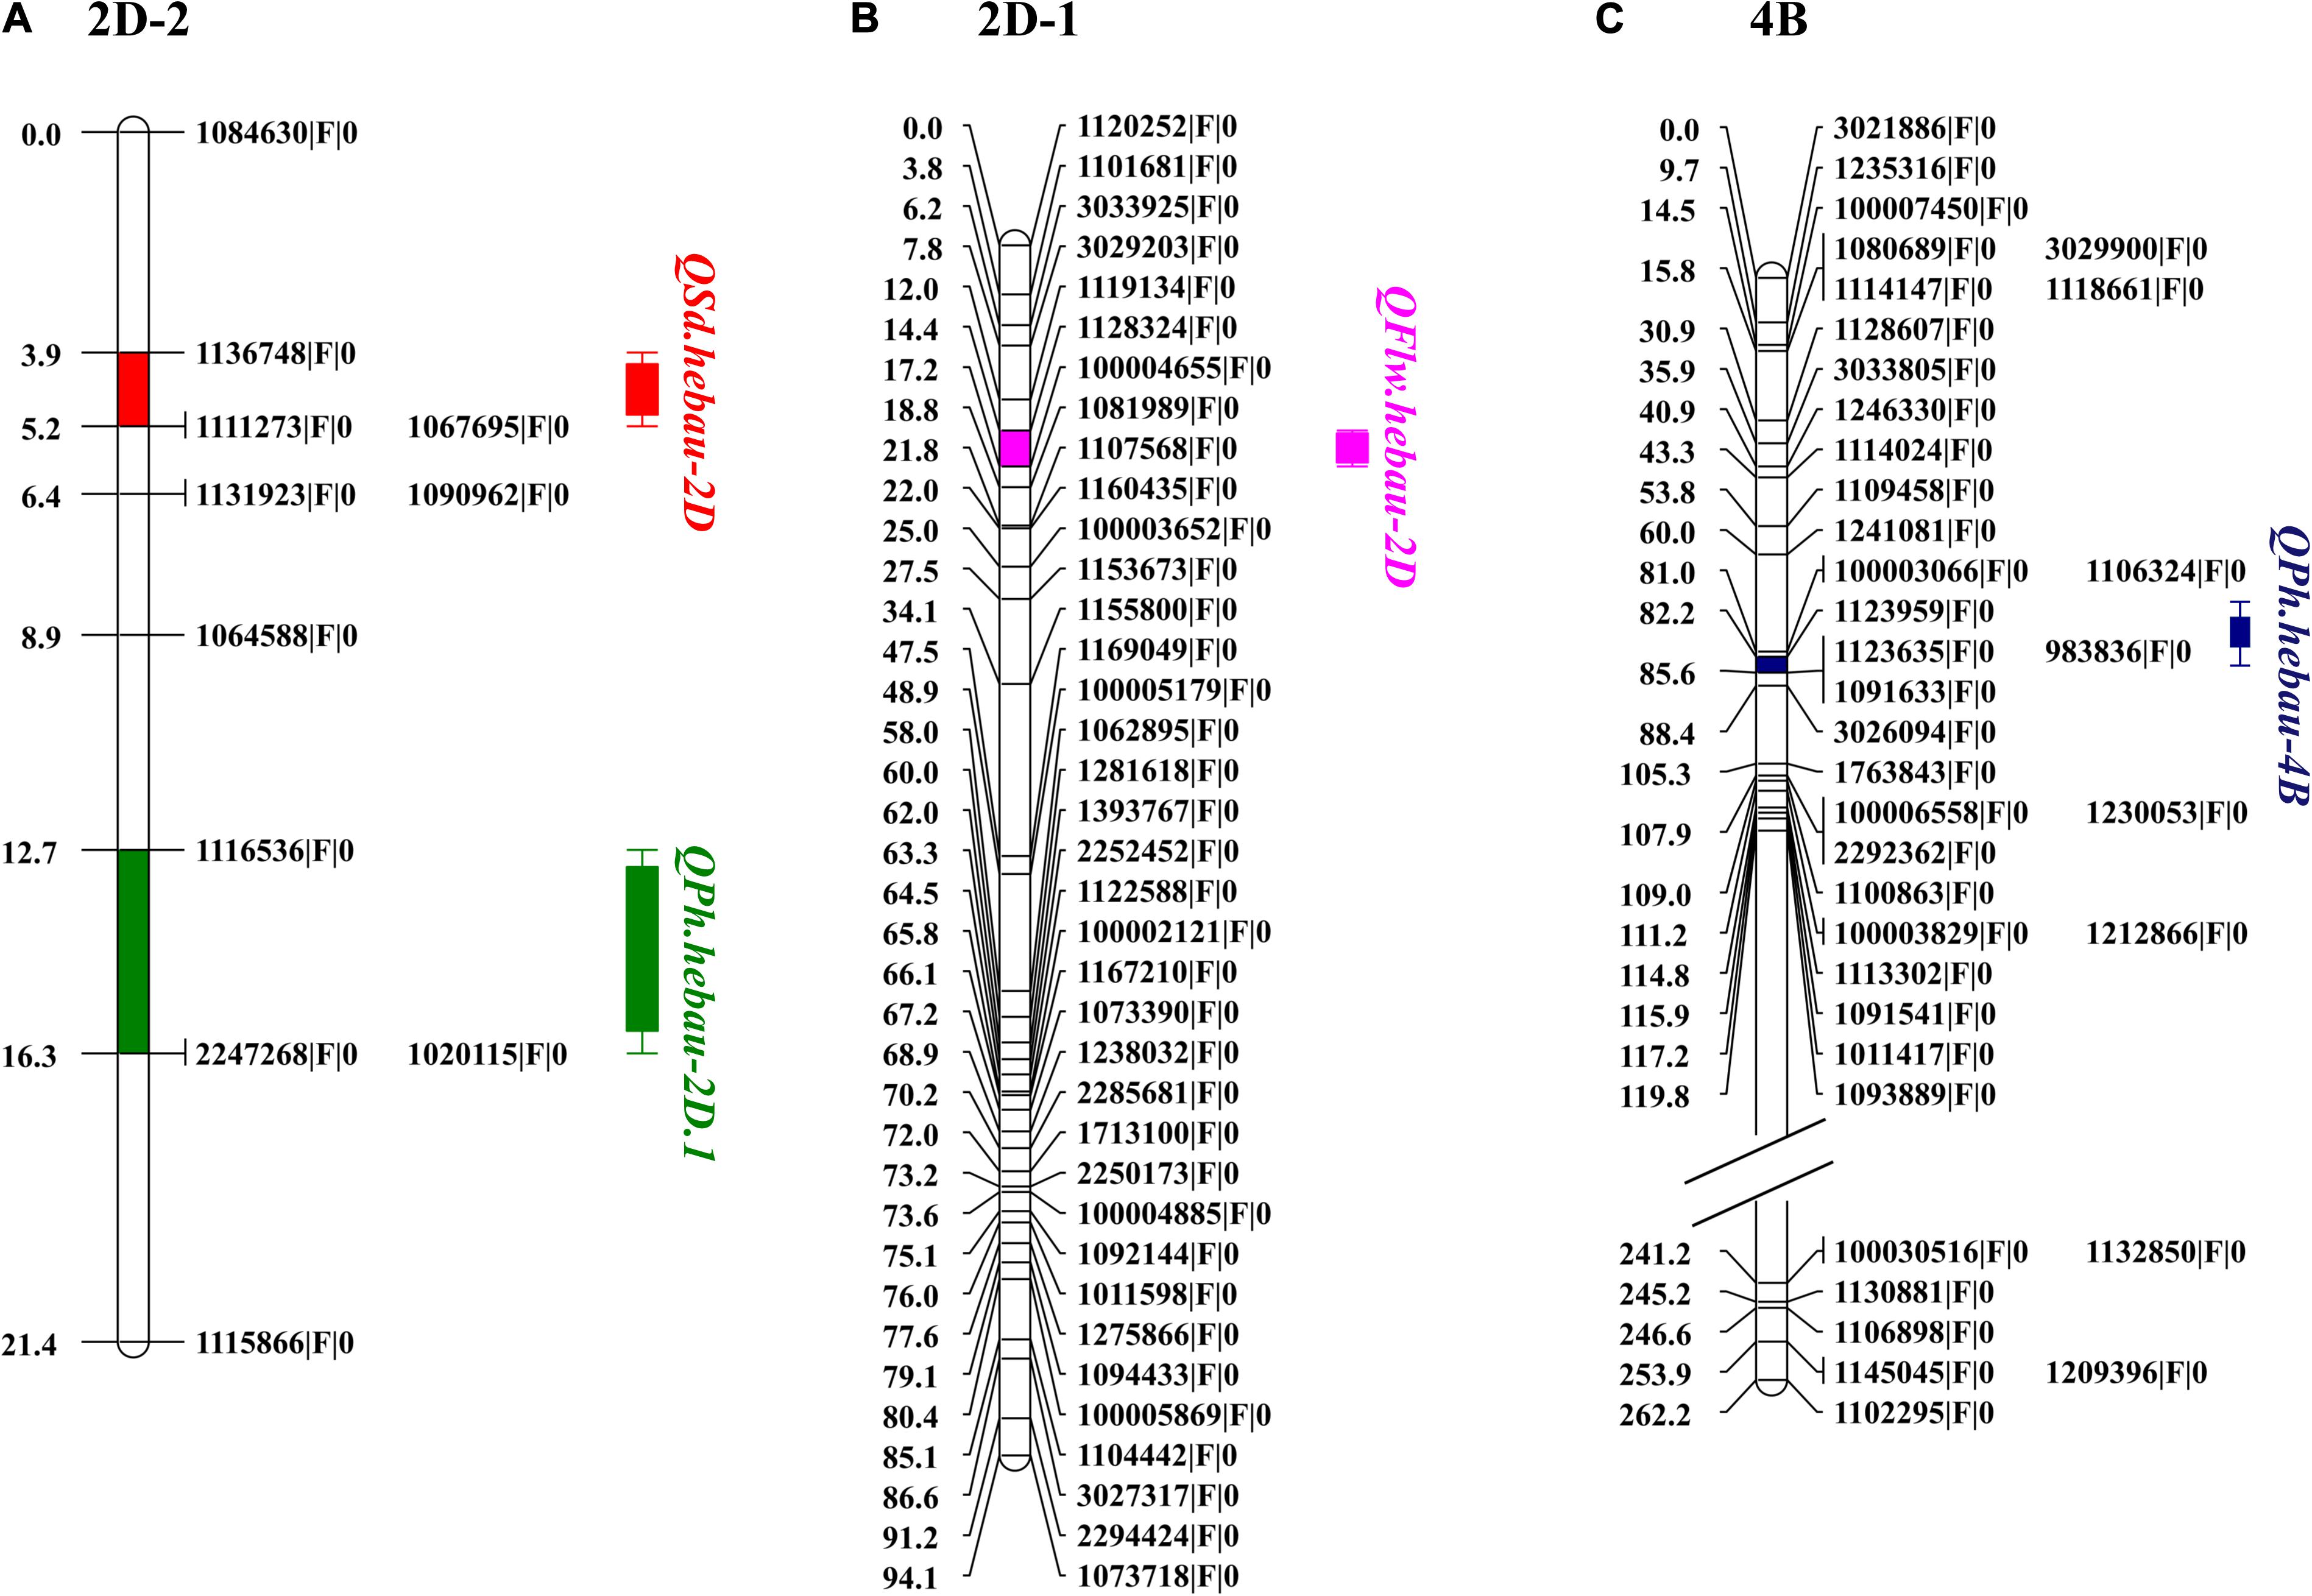
Figure 3. Distributions of QSd.hebau-2D, QPh.hebau-2D.1 (A), QFlw.hebau-2D (B), and QPh.hebau-4B (C) on the linkage map chromosome 2D and 4B, respectively.
The 94 AS RILs were divided into two groups according to the genotypes of the two flanking markers for major loci QFlw.hebau-2D, QPh.hebau-2D.1, QPh.hebau-4B, and QSd.hebau-2D. Student’s t-test showed that RILs with the increased alleles from ‘Sumai 3’ significantly increased FLW in different environments as well as the BLUP dataset (P < 0.01, Figure 4A); and the lines with the positive alleles at QPh.hebau-2D from ‘AS985472’ were higher (P < 0.05, Figure 4B) than those from ‘Sumai 3’ in all environments except 2017CZ. In contrast, the lines with the increased alleles at QPh.hebau-4B from ‘Sumai 3’ were significantly (P < 0.01, Figure 4C) higher than those without major alleles. However, there were no differences between the lines with and without increasing alleles from QSd.hebau-2D (Figure 4D).
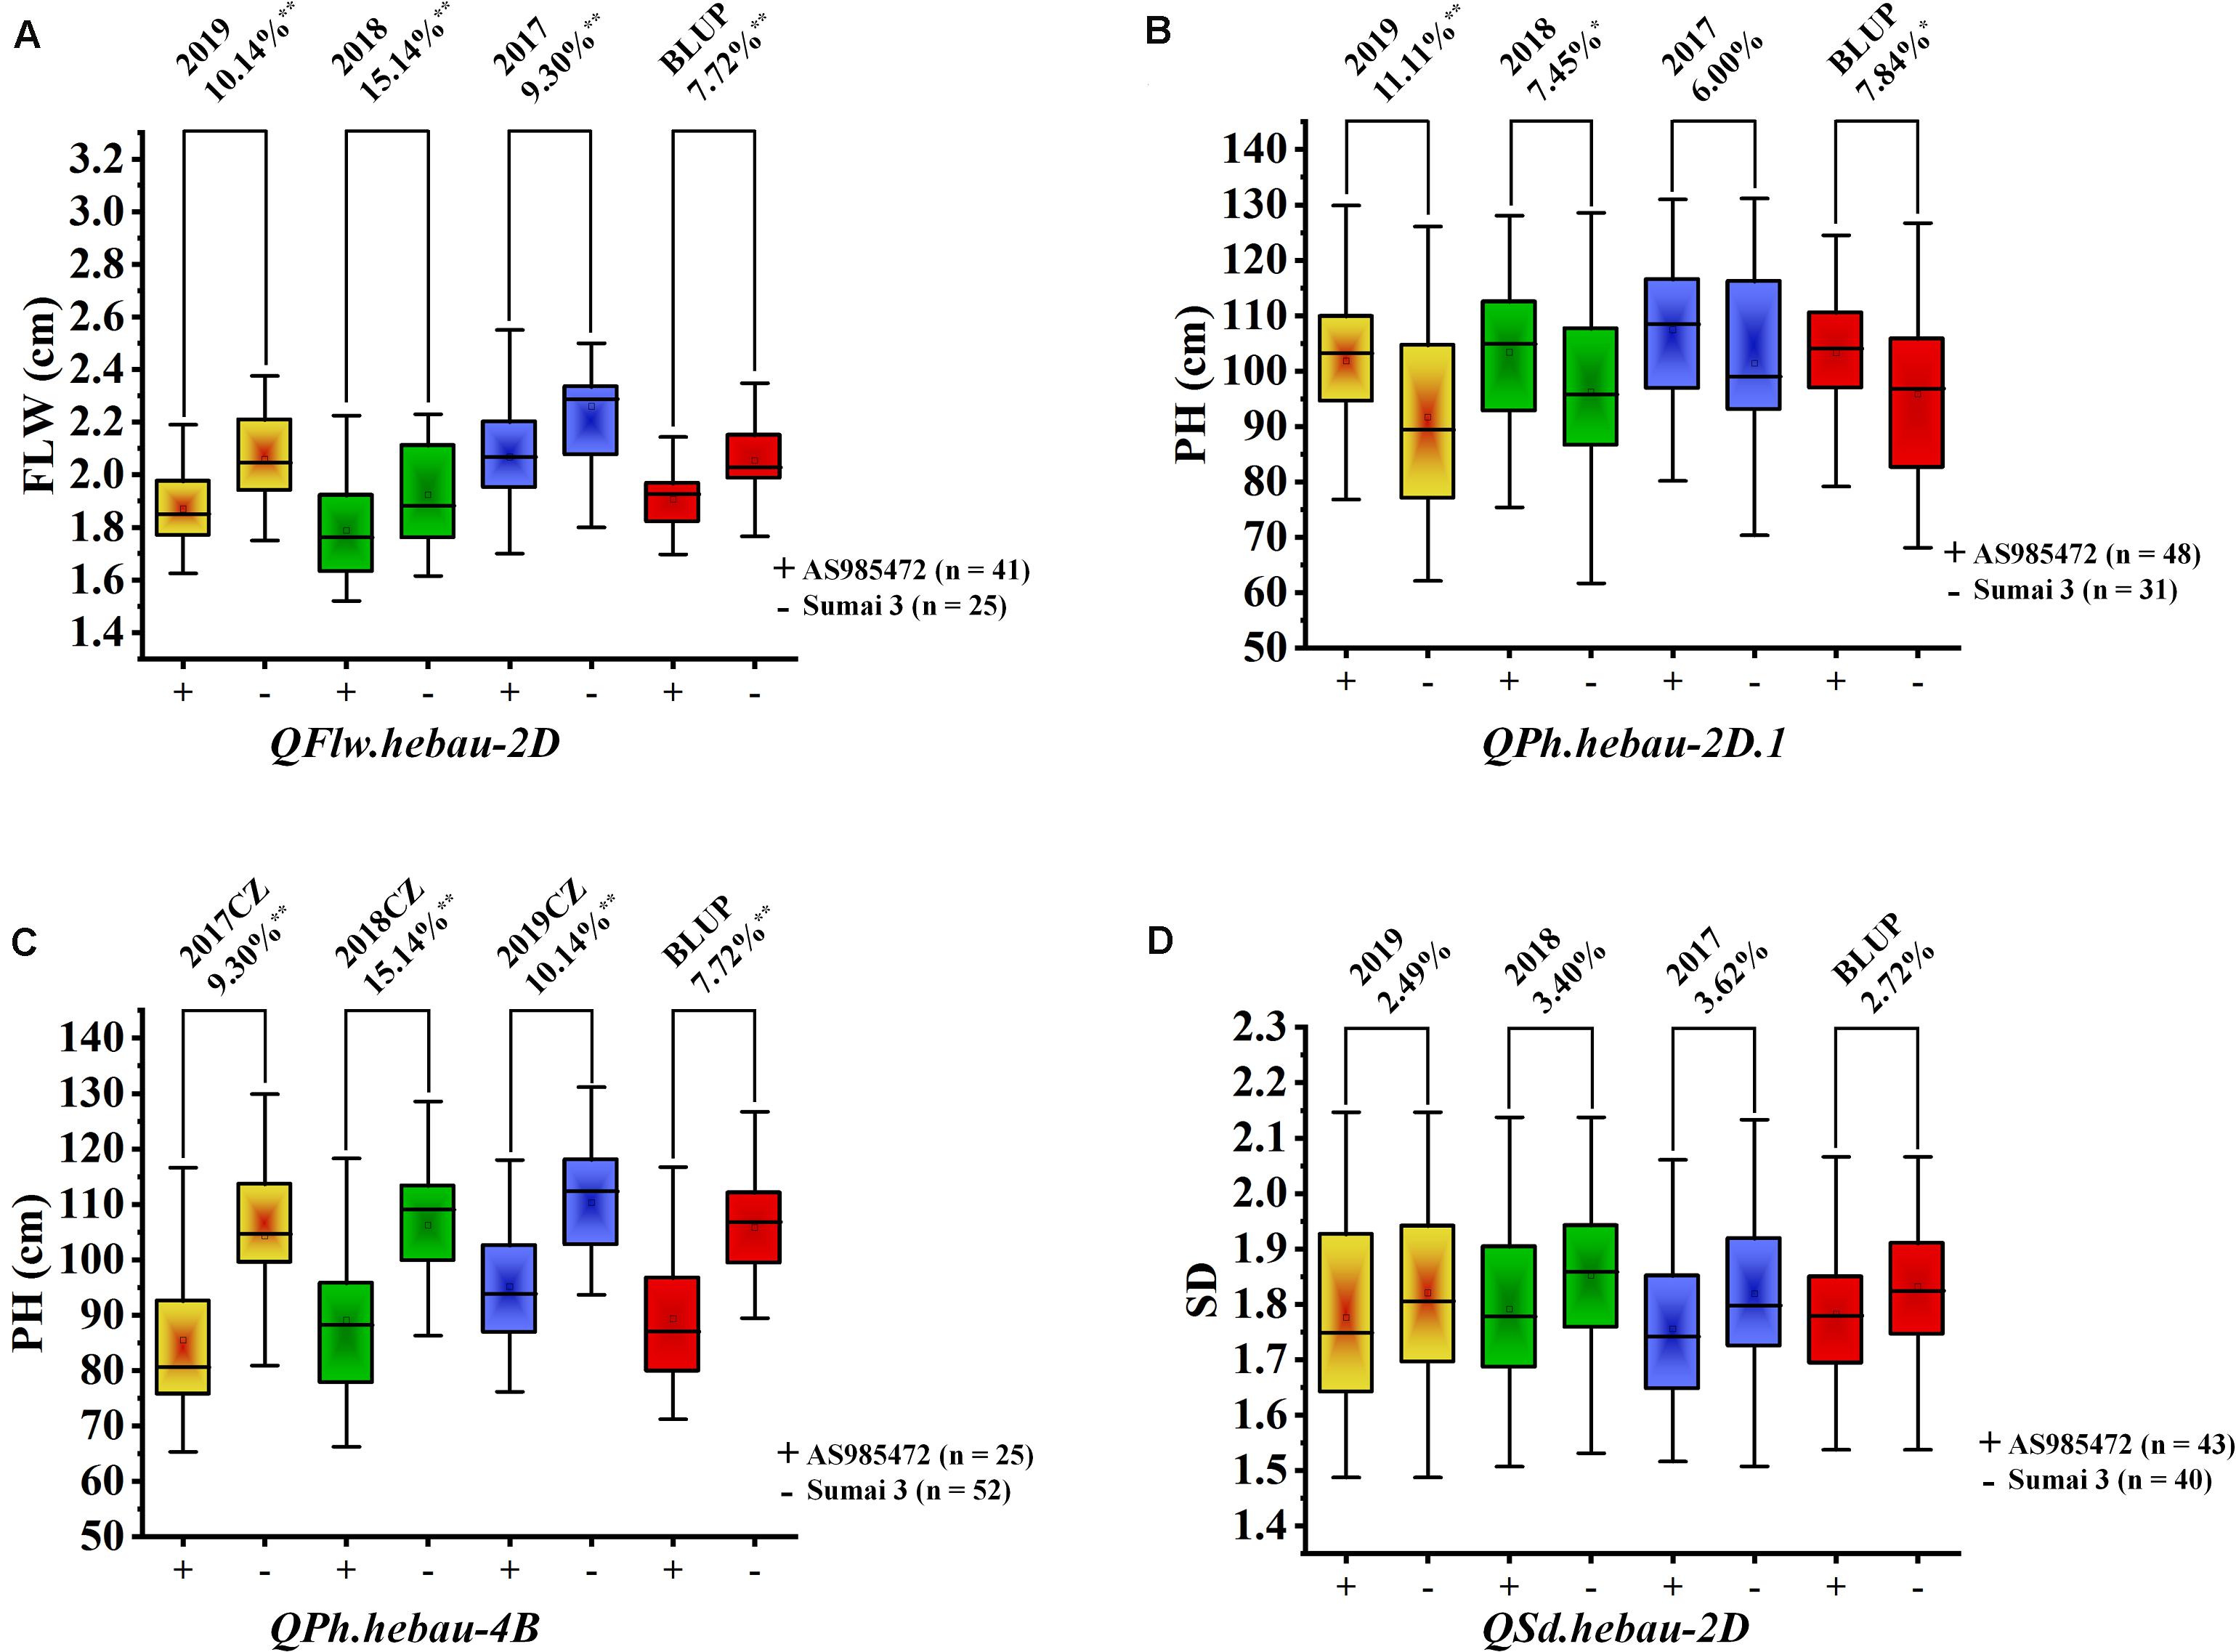
Figure 4. The effects of the QTL QFlw.hebau-2D on flag leaf width (A), QPh.hebau-2D.1 on plant height (B), QPh.hebau-4B on plant height (C) and QSd.hebau-2D on spike density (D). Box plots represent RILs with and without major alleles which are grouped according to the flanking markers of the major QTLs. ‘+’ indicates the homozygous lines from ‘AS985472’ and ‘–’ indicates the homozygous lines from ‘Sumai 3’. **Significant at P = 0.01, *Significant at P = 0.05.
Discussion
Many QTL identified in this study were closely located to the chromosome region of known QTL. For example, QPh.hebau-2D.1 for PH in the present study were located at 19.04 – 20.35 Mbp on CS 2DS and 19.80 – 21.14 Mbp on Ae. tauschii 2DS (Figure 5A), whereas QPh.hebau-4B located within the interval of 291.95 – 607.04 Mbp on CS 4BL and 276.11 – 586.46 Mbp on wild emmer 4BL (Figure 5B). The location of QPh.hebau-4B (291.95 – 607.04 Mbp) is far from RhtB1 (30.861–30.863 Mbp). These two QTL were physically located at the similar or overlapped positions as those reported previously by Wu et al. (2010) and Zhai et al. (2016), respectively. It is interesting that the height reducing allele of QPh.hebau-2D.1 came from the tall parent Sumai 3. This result suggested that genotypes with a relatively poorer performance on height may still carry the beneficial allele that can be used for genetic improvement of the trait. Similar results was obtained in previous study. It has been shown that susceptible parent contributed the resistance alleles to various wheat diseases (Poole et al., 2012; Ma et al., 2019b). In addition to height QTL, a major and stably expressed QTL conferring SD designated as QSd.hebau-2D, which was located at 16.16 – 17.82 Mbp on CS and 16.39 – 18.36 Mbp on Ae. tauschii 2DS (Figure 5A), was in the overlapped physical region as the QTL reported by Heidari et al. (2011). The stable expression of these height and SD QTL under multiple genetic backgrounds in different studies emphasized their value for further fine mapping studies.
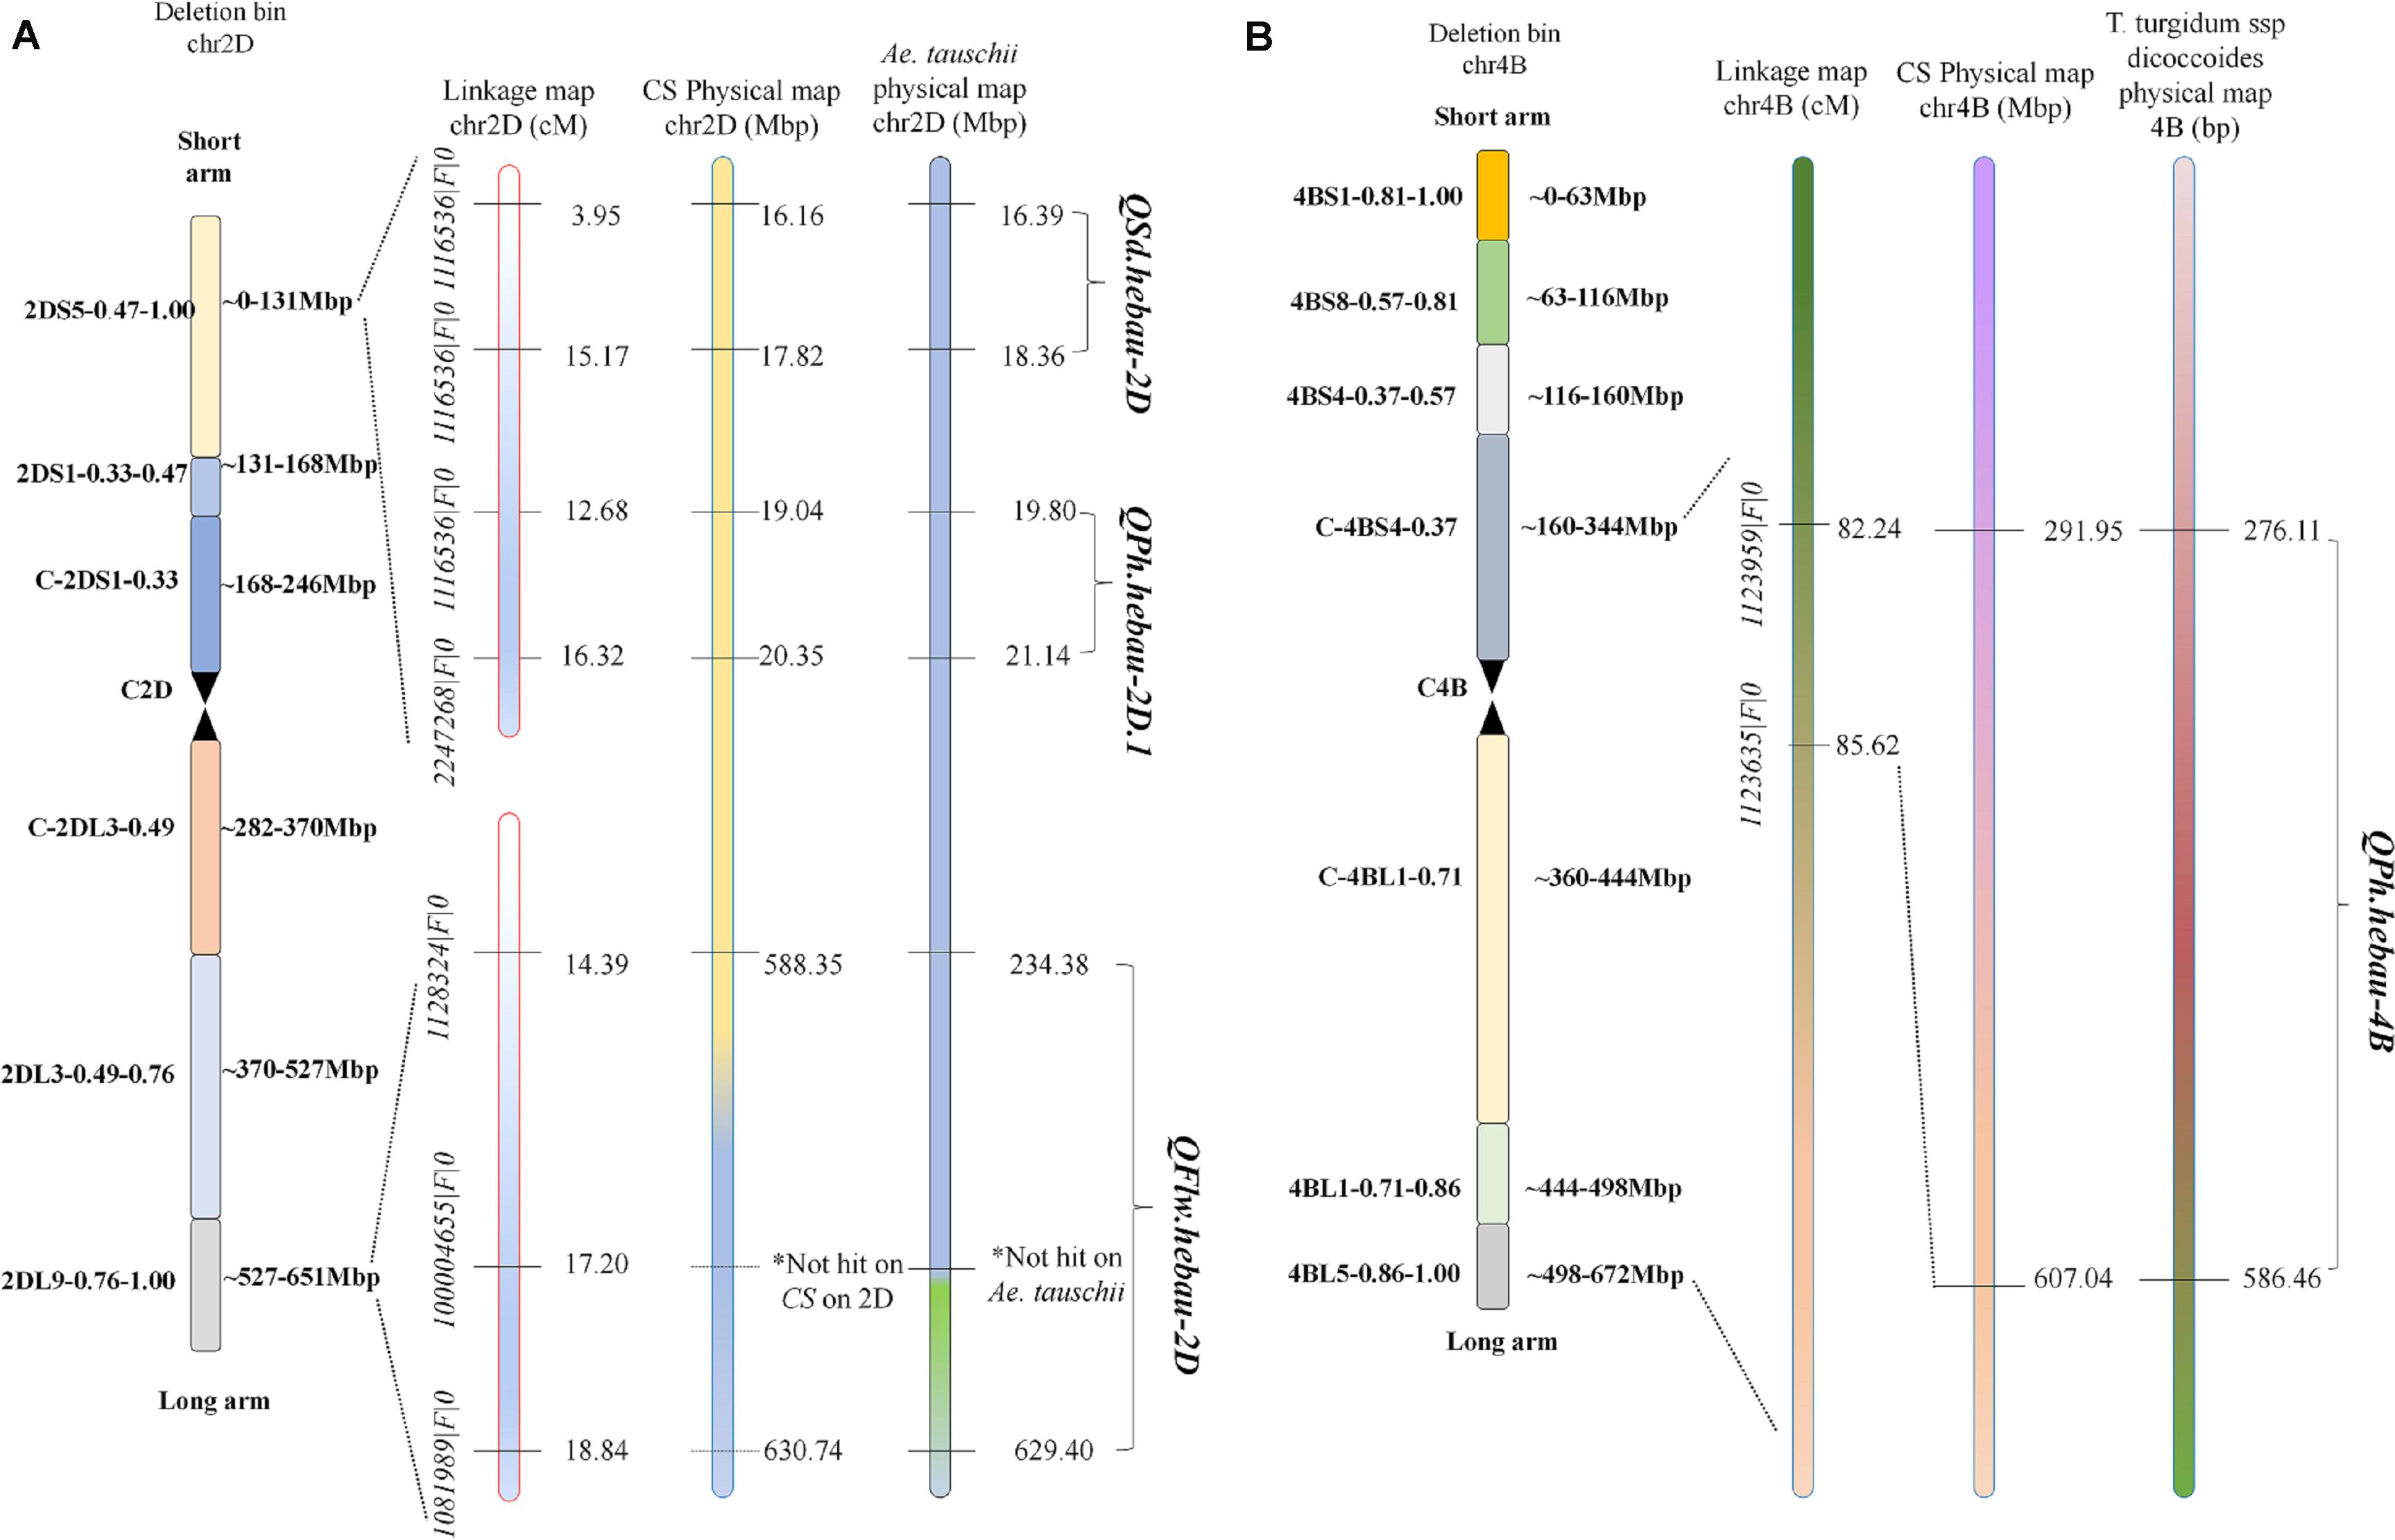
Figure 5. The maps of QFlw.hebau-2D/QPh.hebau-2D.1/QSd.hebau-2D (A) and QPh.hebau-4B (B).
Two putative QTLs for FLW were detected on chromosomes 2D and 3D including QFlw.hebau-2D and QFlw.hebau-3D. QFlw.hebau-2D, located in the interval of 1128324| F| 0 – 1081989| F| 0, was the major and stable locus identified in the present study. For chromosome 2D, numerous putative loci for flag-related traits and yield-related traits in wheat were identified (Fan et al., 2015; Ma et al., 2019a, 2020). In the present study, QFlw.hebau-2D was located in a 4.45 cM interval and physically mapped between 588.35 and 630.74 Mbp on CS 2DL and 234.38 and 629.40 Mbp on Ae. tauschii 2DL (Figure 5A). Combined with the results from Ma et al. (2020), we reviewed the recently published articles related to FLW loci and compared the major FLW QTL detected in the present study with previous studies. Comparison analysis showed that it was overlapped with qFlw-2D.2 (Fan et al., 2015) that was detected in an individual environment with minor effect. The large PVE (24.88) and LD (5.07) of QFlw.hebau-2D in our study suggested that value of this locus for FLW improvement.
Six hundred and eighty-nine putative candidate genes on CS genome were predicted at the interval of QFlw.hebau-2D (Supplementary Table S1). The results of the annotation indicated that several genes associated with plant growth and development. Additionally, there are numerous genes encoding the same protein. For example, auxin response factors, encoded by TraesCS2D01G491200 and TraesCS2D01G548900, bind to TGTCTC auxin response elements in promoters of early auxin response genes (Tiwari et al., 2003), and thus regulating the development of plant tissues and organs. Twenty-two candidate genes including TraesCS2D01G524300 encode an F-box protein which regulates floral development and the F-box protein TIR1 is an auxin receptor that mediates Aux/IAA degradation and auxin-regulated transcription (Dharmasiri et al., 2005). Flowering Locus T-like protein, encoded by TraesCS2D01G538000 and TraesCS2D01G538100, is involved in the switch to flowering and thus aiding in grain set and dispersal.
MADS-box transcription factors are involved in various processes of plant growth and development (Ma et al., 2017). TraesCS2D01G529700 encodes MADS-box transcription factor 8. Twelve genes encode SAUR-like auxin-responsive family proteins, which regulate cell expansion or division thus leading to leaf growth (Ren and Gray, 2015). These results showed that some of the putative candidate genes analyzed in the present study have key importance in understanding the genetic mechanism of flag leaf growth and development in wheat.
Significant genetic associations among seven yield-related traits were detected. SD was determined by the SNS divided by SL, thus SD was positively related with SNS and negatively related with SL, which was consistent with the phenotypic correlations in this study (Table 3). Significantly, several QTLs for SL with pleiotropic effects to SNS and SD that are the key components of grain yield in wheat were identified on chromosomes 4A and 6D, indicating that these traits may be controlled by the same locus. Major loci QSd.hebau-2D and QPh.hebau-2D.1 were physically located at 16.16–17.82 Mbp and 19.04–20.35 Mbp, respectively, suggesting the intrinsic correlations may exist between SD and PH. Similarly, it is previously reported that various yield-related traits like biomass and SD (Kirigwi et al., 2007), SD and SL (Heidari et al., 2011), are controlled by the same QTLs or genes. The pleiotropic effects of these loci further indicated their potential value for further researches and application in wheat breeding programs.
Data Availability Statement
All datasets presented in this study are included in the article/Supplementary Material.
Author Contributions
JM and WZ designed the research. JJ, DL, and YQ performed the experiments. JJ and DL analyzed the data and wrote the manuscript. JM and JJ revised the manuscript. All authors read and approved the manuscript.
Funding
This research was supported by the National Key Research and Development Program of China (2017YFD0300906 and 2018YFD0300501) and State Key Laboratory of North China Crop Improvement and Regulation.
Conflict of Interest
The authors declare that the research was conducted in the absence of any commercial or financial relationships that could be construed as a potential conflict of interest.
Supplementary Material
The Supplementary Material for this article can be found online at: https://www.frontiersin.org/articles/10.3389/fgene.2020.01012/full#supplementary-material
TABLE S1 | Predicated genes in the interval of the major QTL QFlw.hebau-2D.
Footnotes
- ^ https://urgi.versailles.inra.fr/download/iwgsc/
- ^ https://www.ncbi.nlm.nih.gov/assembly/GCA_002575655.1/#/def_asm_Primary_Assembly
- ^ https://www.dropbox.com/sh/3dm05grokhl0nbv/AAC3wvlYmAher8fY0srX3gX9a?dl=0%2
References
Avni, R., Nave, M., Barad, O., Baruch, K., Twardziok, S., Gundlach, H., et al. (2017). Wild emmer genome architecture and diversity elucidate wheat evolution and domestication. Science 357, 93–97. doi: 10.1126/science.aan0032
Deng, S. M., Wu, X. Y., Wu, Y. Y., Zhou, R. H., Wang, H. G., Jia, J. Z., et al. (2011). Characterization and precise mapping of a QTL increasing spike number with pleiotropic effects in wheat. Theor. Appl. Genet. 122, 281–289. doi: 10.1007/s00122-010-1443-1
Dharmasiri, N., Dharmasiri, S., and Estelle, M. (2005). The F-box protein TIR1 is an auxin receptor. Nature 435, 441–445. doi: 10.1038/nature03543
Fan, X. L., Cui, F., Zhao, C. H., Zhang, W., Yang, L. J., Zhao, X. Q., et al. (2015). QTLs for flag leaf size and their influence on yield-related traits in wheat (Triticum aestivum L.). Mol. Breed. 35:24. doi: 10.1007/s11032-015-0205-9
Goddard, M. E. (1992). A mixed model for analyses of data on multiple genetic markers. Theor. Appl. Genet. 83, 878–886. doi: 10.1007/BF00226711
Hai, L., Guo, H. J., Wagner, C., Xiao, S. H., and Friedt, W. (2008). Genomic regions for yield and yield parameters in Chinese winter wheat (Triticum aestivum L.) genotypes tested under varying environments correspond to QTL in widely different wheat materials. Plant Sci. 175, 226–232. doi: 10.1016/j.plantsci.2008.03.006
Hedden, P. (2003). The genes of the green revolution. Trends Genet. 19, 5–9. doi: 10.1016/s0168-9525(02)00009-4
Heidari, B., Sayedtabatabaei, B. E., Saeidi, G., Kearsey, M. J., and Suenaga, K. (2011). Mapping QTL for grain yield, yield components, and spike features in a doubled haploid population of bread wheat. Genome 54, 517–527. doi: 10.1139/g11-017
Hu, J. M., Wang, X. Q., Zhang, G. X., Jiang, P., Chen, W. Y., Hao, Y. C., et al. (2020). QTL mapping for yield-related traits in wheat based on four RIL populations. Theor. Appl. Genet. 133, 917–933. doi: 10.1007/s00122-019-03515-w
Kirigwi, F. M., Van Ginkel, M., Brownguedira, G., Gill, B. S., Paulsen, G. M., and Fritz, A. K. (2007). Markers associated with a QTL for grain yield in wheat under drought. Mol. Breed. 20, 401–413. doi: 10.1007/s11032-007-9100-3
Li, C. L., Bai, G. H., Carver, B. F., Chao, S., and Wang, Z. L. (2016). Mapping quantitative trait loci for plant adaptation and morphology traits in wheat using single nucleotide polymorphisms. Euphytica 208, 299–312. doi: 10.1007/s10681-015-1594-x
Lin, H. X., Qian, H. R., Zhuang, J. Y., Lu, J., Min, S., Xiong, Z., et al. (1996). RFLP mapping of QTLs for yield and related characters in rice (Oryza sativa L.). Theor. Appl. Genet. 92, 920–927. doi: 10.1007/BF00224031
Liu, J. J., Luo, W., Qin, N. N., Ding, P. Y., Zhang, H., Yang, C. C., et al. (2018a). A 55 K SNP array-based genetic map and its utilization in QTL mapping for productive tiller number in common wheat. Theor. Appl. Genet. 131, 2439–2450. doi: 10.1007/s00122-018-3164-9
Liu, K., Sun, X. X., Ning, T. Y., Duan, X. X., Wang, Q. L., Liu, T. T., et al. (2018b). Genetic dissection of wheat panicle traits using linkage analysis and a genome-wide association study. Theor. Appl. Genet. 131, 1073–1090. doi: 10.1007/s00122-018-3059-9
Liu, K., Xu, H., Liu, G., Guan, P., Zhou, X., Peng, H., et al. (2018c). QTL mapping of flag leaf-related traits in wheat (Triticum aestivum L.). Theor. Appl. Genet. 131, 839–849. doi: 10.1007/s00122-017-3040-z
Luo, M. C., Gu, Y. Q., Puiu, D., Wang, H., Twardziok, S., Deal, K. R., et al. (2017). Genome sequence of the progenitor of the wheat D genome Aegilops tauschii. Nature 551, 498–502. doi: 10.1038/nature24486
Ma, J., Ding, P. Y., Liu, J. J., Li, T., Zou, Y. Y., Habib, A., et al. (2019a). Identification and validation of a major and stably expressed QTL for spikelet number per spike in bread wheat. Theor. Appl. Genet. 132, 3155–3167. doi: 10.1007/s00122-019-03415-z
Ma, J., Qin, N. N., Cai, B., Chen, G. Y., Ding, P. Y., Zhang, H., et al. (2019b). Identification validation of a novel major QTL for all-stage stripe rust resistance on 1BL in the winter wheat line 20828. Theor. Appl. Genet. 132, 1363–1373. doi: 10.1007/s00122-019-03283-7
Ma, J., Tu, Y., Zhu, J., Luo, W., Liu, H., Li, C., et al. (2020). Flag leaf size and posture of bread wheat: genetic dissection, QTL validation and their relationships with yield-related traits. Theor. Appl. Genet. 133, 297–315. doi: 10.1007/s00122-019-03458-2
Ma, J., Yang, Y. J., Luo, W., Yang, C. C., Ding, P. Y., Liu, Y. X., et al. (2017). Genome-wide identification and analysis of the MADS-box gene family in bread wheat (Triticum aestivum L.). PLoS One 12:e0181443. doi: 10.1371/journal.pone.0181443
Poole, G. J., Smiley, R. W., Paulitz, T. C., Walker, C. A., Carter, A. H., See, D. R., et al. (2012). Identification of quantitative trait loci (QTL) for resistance to fusarium crown rot (Fusarium pseudograminearum) in multiple assay environments in the pacific northwestern us. Theor. Appl. Genet. 125, 91–107. doi: 10.1007/s00122-012-1818-6
Ren, H., and Gray, W. M. (2015). SAUR proteins as effectors of hormonal and environmental signals in plant growth. Mol. Plant 8, 1153–1164. doi: 10.1016/j.molp.2015.05.003
Smith, S. E., Kuehl, R. O., Ray, I. M., Hui, R., and Soleri, D. (1998). Evaluation of simple methods for estimating broad-sense heritability in stands of randomly planted genotypes. Crop Sci. 38, 1125–1129. doi: 10.2135/cropsci1998.0011183X003800050003x
The International Wheat Genome Sequencing Consortium [IWGSC] (2018). Shifting the limits in wheat research and breeding using a fully annotated reference genome. Science 361:eaar7191. doi: 10.1126/science.aar7191
Tiwari, S. B., Hagen, G., and Guilfoyle, T. J. (2003). The roles of auxin response factor domains in auxin-responsive transcription. Plant Cell 15, 533–543. doi: 10.1105/tpc.008417
Woodruff, D. R., and Tonks, J. (1983). Relationship between time of anthesis and grain yield of wheat genotypes with differing developmental pattern. Crop Pasture Sci. 34, 1–11. doi: 10.1071/ar9830001
Wu, X. S., Wang, Z. H., Chang, X. P., and Jing, R. L. (2010). Genetic dissection of the developmental behaviours of plant height in wheat under diverse water regimes. J. Exp. Bot. 61, 2923–2937. doi: 10.1093/jxb/erq117
Xie, G. Q., Zhang, M. C., Chakraborty, S., and Liu, C. (2007). The effect of 3BS locus of Sumai 3 on fusarium head blight resistance in Australian wheats. Aust. J. Exp. Agri. 47, 603–607. doi: 10.1071/EA05250
Yang, D. L., Liu, Y., Cheng, H. B., Chang, L., Chen, J. J., Chai, S. X., et al. (2016). Genetic dissection of flag leaf morphology in wheat (Triticum aestivum L.) under diverse water regimes. BMC Genet. 17:94. doi: 10.1186/s12863-016-0399-9
Zhai, H. J., Feng, Z. Y., Li, J., Liu, X. Y., Xiao, S. H., Ni, Z. F., et al. (2016). QTL analysis of spike morphological traits and plant height in winter wheat (Triticum aestivum L.) using a high-density SNP and SSR-based linkage map. Front. Plant Sci. 7:1617. doi: 10.3389/fpls.2016.01617
Keywords: wheat, recombinant inbred line, yield-related traits, quantitative trait loci, candidate genes
Citation: Jin J, Liu D, Qi Y, Ma J and Zhen W (2020) Major QTL for Seven Yield-Related Traits in Common Wheat (Triticum aestivum L.). Front. Genet. 11:1012. doi: 10.3389/fgene.2020.01012
Received: 26 July 2020; Accepted: 10 August 2020;
Published: 28 August 2020.
Edited by:
Jian Ma, Sichuan Agricultural University, ChinaReviewed by:
Linyi Qiao, Shanxi Agricultural University, ChinaFeng Wang, University of Helsinki, Finland
Copyright © 2020 Jin, Liu, Qi, Ma and Zhen. This is an open-access article distributed under the terms of the Creative Commons Attribution License (CC BY). The use, distribution or reproduction in other forums is permitted, provided the original author(s) and the copyright owner(s) are credited and that the original publication in this journal is cited, in accordance with accepted academic practice. No use, distribution or reproduction is permitted which does not comply with these terms.
*Correspondence: Jun Ma, SnVubWFAY2F1LmVkdS5jbg==; Wenchao Zhen, d2VuY2hhb0BoZWJhdS5lZHUuY24=
†These authors share first authorship