
94% of researchers rate our articles as excellent or good
Learn more about the work of our research integrity team to safeguard the quality of each article we publish.
Find out more
ORIGINAL RESEARCH article
Front. Genet. , 20 December 2019
Sec. Livestock Genomics
Volume 10 - 2019 | https://doi.org/10.3389/fgene.2019.01248
 Emhimad E. A. Abdalla1*Flavio S. Schenkel1Hakimeh Emamgholi Begli1Owen W. Willems2Pieter van As3Ryley Vanderhout1Benjamin J. Wood1,2,4†Christine F. Baes1,5†
Genomic information can contribute significantly to the increase in accuracy of genetic predictions compared to using pedigree relationships alone. The main objective of this study was to compare the prediction ability of pedigree-based best linear unbiased prediction (PBLUP) and single-step genomic BLUP (ssGBLUP) models. Turkey records of feed conversion ratio, residual feed intake, body weight, breast meat yield, and walking ability were provided by Hybrid Turkeys, Kitchener, Canada. This data was analyzed using pedigree-based and single-step genomic models. The genomic relationship matrix was calculated either using observed allele frequencies, all allele frequencies equal to 0.5 or with a different scaling. To avoid potential problems with inversion, three different weighting factors were applied to combine the genomic and pedigree matrices. Across the studied traits, ssGBLUP had higher heritability estimates and significantly outperformed PBLUP in terms of accuracy. Walking ability was genetically negatively correlated to body weight and breast meat yield; however, it was not correlated to feed conversion ratio (FCR) or residual feed intake (RFI). Body weight showed a moderate positive genetic correlation to feed conversion ratio, residual feed intake and breast meat yield. Feed conversion ratio was strongly correlated to residual feed intake (0.68 ± 0.06). There was almost no genetic correlation between breast meat yield and feed efficiency traits. Larger differences in accuracy between PBLUP and ssGBLUP were observed for traits with lower heritability. Results of the three weighting factors showed only slight differences and an increase in accuracy of prediction compared to PBLUP. Slightly different levels of bias were observed across the models, but were higher among the traits; BMY was the only trait that had a regression coefficient higher than 1 (1.38 to 1.41). We show that incorporating genomic information increases the prediction accuracy for preselection of young candidate turkeys for the five traits investigated. Single-step genomic prediction showed substantially higher accuracy estimates than the pedigree-based model, and only slight differences in bias were observed across the alternate models.
The traditional mixed model equations (Henderson, 1975) are a versatile approach in animal breeding for fitting a variety of models and have been successful for many decades. In such models, genetic effects are estimated based on the covariance structure proportional to the relationship matrix based on pedigree information. This method provides predictions for all animals in the pedigree by adjusting for fixed and random non-genetic effects. Studies have shown that genomic selection, based on information from high-density single nucleotide polymorphism (SNP) markers, accelerates genetic gain by increasing the accuracy of prediction, shortening generation intervals, and improving control of inbreeding (Meuwissen et al., 2001; VanRaden et al., 2009; Verbyla et al., 2009).
Incorporating genomic information in genetic evaluations was initially based on the two-step technique (e.g., VanRaden et al., 2009; Hayes et al., 2009a). This technique includes defining a response variable (e.g., de-regressed estimated breeding values; Garrick et al., 2009) for the genotyped animals, training the markers effects and applying a genomic prediction procedure based on the estimated marker effects for genotyped animals, usually the selection candidates. This analysis is advantageous for providing predictions for genotyped animals, however, obtaining predictions for non-genotyped animals is not straight forward (Aguilar et al., 2010; Christensen and Lund, 2010; Fragomeni et al., 2015). Additional methods have been developed, for example, blending genomic and pedigree information and using other techniques such as correlated traits, selection index and external expected progeny differences; however, each of these methods has its own disadvantages (Garrick and Fernando, 2014). Additional downsides of the two-step approach are that finding a suitable response variable, such as deregressed proofs, as well as an appropriate statistical modeling approach, such as Bayes A, can be challenging (Garrick et al., 2009; Gianola et al., 2009). In addition, the omission of information from non-genotyped animals and selection bias based on availability of genomic information may affect the analyses (Misztal et al., 2009).
Alternatively, a single-step method that combines genomic and pedigree data in a unified analysis has been introduced in the last decade (Legarra et al., 2009; Misztal et al., 2009; Aguilar et al., 2010). This single-step GBLUP closely resembles the traditional genetic evaluation approach based on linear mixed model analyses, and can readily use the available linear algebra machinery and software. In order to be integrated into one single matrix with the numerator relationship matrix (A), the genomic relationship matrix (G) should be positive definite. Condensing the G matrix to remove duplicate rows and columns (e.g. as in Baes and Reinsch, 2007) can be considered to make G invertible if the number of markers is higher than the number of individuals. VanRaden, (2008) suggested an improved non-singular matrix (Gw) that can be obtained as wG + (1 - w)A22, where A22 is the numerator relationship matrix among genotyped individuals. Such adjustment can be interpreted as the relative weight on the polygenic effect (Christensen and Lund, 2010). In addition to facilitating inversion, values for w between 0.90 and 1 showed changes in accuracy of predictions (VanRaden, 2008). Christensen and Lund (2010) reported negligible differences in estimated breeding values when w ranged between 0.95 and 0.98.
Genomic selection has been widely adopted in various livestock species (e.g., Hayes et al., 2009b; Wolc et al., 2016; Abdalla et al., 2019). Incorporating genomic information into turkey breeding programs is expected to increase the accuracy of prediction and outperform the pedigree-based method. Genomic-based selection programs reduce the exclusive reliance on the phenotypic, pedigree, and progeny information (Dekkers, 2004; Bolormaa et al., 2013). Moreover, direct selection can be applied to phenotypes that are expensive to measure (e.g., feed efficiency), only expressed late in life (e.g., walking score) and can only be collected once the animal is dead (e.g., breast meat yield). It is also important to determine the possibility of performing simultaneous selection for genetically correlated traits and understanding the response that will occur in each individual trait. The aim of this study was to estimate heritability and genetic correlations for 5 economically important traits measured in turkeys (two feed efficiency traits, body weight, breast meat yield, and walking ability), and to contrast single-step genomic and pedigree-based models in terms of prediction ability using those traits.
The data used in this study was provided by Hybrid Turkeys, Kitchener, Canada and consisted of 5,619 records on feed conversion ratio (FCR) and residual feed intake (RFI) in males; 170,844 records of body weight (BW) and walking score (WS) at 20 weeks for males (71,012) and 18 weeks for females (99,832); 9,634 records for breast meat yield (BMY) in males as shown in Table 1. These records were collected for 10 generations on birds hatched between 2009 and 2017. The birds were reared under a standard feeding system with group housing and shared feeders and drinkers until 15 weeks of age. From 15 weeks of age until 19 to 20 weeks of age, a real-time automated system was used to monitor individual feed intake. This monitoring system consisted of hardware and software subsystems. The bird identification numbers were automatically scanned to detect their identification in each time they entered the feed station and the feeder weight and body weight were recorded using a scale throughout this period (Tu et al., 2011). The FCR was calculated as total feed intake divided by weight gain. To calculate RFI, expected feed intake was obtained as a multiple regression of observed feed intake on metabolic mid-weight, body weight gain and hatch week (Case et al., 2012). At 18 and 20 weeks of age, females and males, respectively, were given a WS between 1 and 6 based on their walking ability, such that animals with a higher walking score had stronger legs and better walking ability. Finally, BMY was taken after slaughtering the males at 21 or 22 weeks and was calculated as:
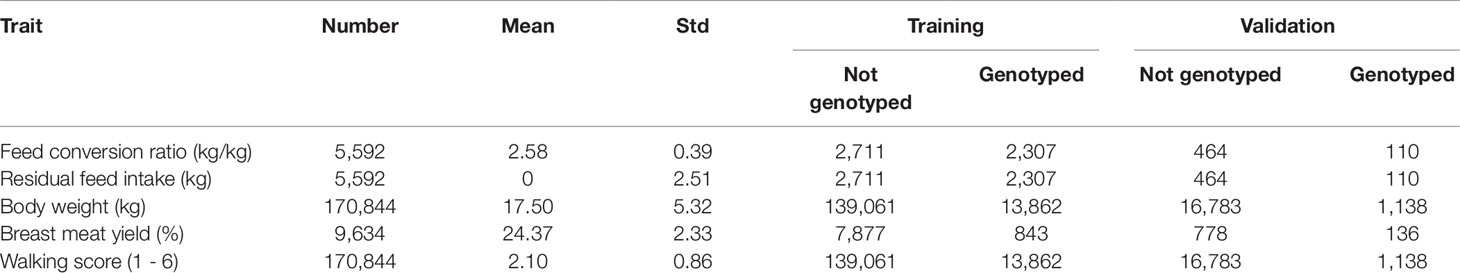
Table 1 Descriptive statistics of the analyzed data set, including the number of records, mean and standard deviation of the traits and number of records in the training and validation subsets.
A subset of animals in this population were genotyped using a proprietary 65K single nucleotide polymorphisms (SNP) panel (65,000 SNP; Illumina, Inc.) as shown in Table 1. In addition, a pedigree of 783,298 animals was available for analysis. The data was not imputed and as a quality control, SNP markers were excluded if they significantly deviated from Hardy Weinberg proportions (P<1×10⁻⁸), had minor allele frequency lower than 5%, call rate lower than 90%, or were located in non-autosomal regions. After editing, the number of markers remaining for subsequent genomic analysis was 53,455. All animals had a call rate higher than 90%.
A traditional animal model procedure based on BLUP was used to obtain estimated breeding values for all animals in the pedigree across all traits. The following multi-trait model was used to estimate genetic parameters:
where y is a vector of observations of FCR, RFI, BMY, BW, and WS sorted within animals; b is a vector with the fixed effects of hatch week-year and sex for BW and WS and only hatch week-year for FCR, RFI and BMY; u is a vector of additive genetic effects (i.e., breeding values), distributed as u ∼N(0, A⊗R), where A is the numerator relationship matrix including the inbreeding coefficients and R is the additive genetic variance-covariance matrix among traits; e is a vector of residual effects, distributed as e~N(0,∑+iEiy)e~N(0,∑+iEiy) where Eiy indicates a mi×mi matrix corresponding to the traits that were present for animal i, and mi is the number of traits present for animal i; X and Z are incidence matrices for the respective fixed and random effects. Variance components and genetic correlations among the traits were estimated by restricted maximum likelihood (REML) and the procedure was carried out using the BLUPF90 family of programs (Misztal et al., 2014). Inbreeding coefficients were included in REML and BLUP for both pedigree-based and single-step analyses.
A combined pedigree and genomic relationship matrix (H; Misztal et al., 2009; Aguilar et al., 2010) was created to replace the pedigree-derived relationship matrix (A) in the traditional animal model described above and the variance components were estimated based on the H matrix, which was created as follows:
In the above, w is a constant denoted as a weighting factor in this study as described later, G is the genomic relationship matrix, which was calculated as described in VanRaden (2008):
where M is the matrix of genotypes, with columns representing markers and rows representing individuals. Each element in Mij was coded as 0, 1 or 2 if the genotype of individual i for SNP j was homozygous for the first allele, heterozygous, or homozygous for the second allele, respectively. P is a matrix with average allele frequencies calculated as 2(pi − 0.5), where pi is the frequency of the second allele at locus (column) i. If allele frequencies are not properly estimated, biased relationships and consequently biased genomic estimated breeding values (GEBV) may result (Aguilar et al., 2010; Christensen and Lund, 2010). In this sense, allele frequencies need to be estimated from the unselected base population. Since this historical data was not available in the present study, approximations were used. Different allele frequency scenarios were considered. First, allele frequencies were all assumed equal to 0.5 (G0.5F). Second, average allele frequencies calculated from the observed genotype data were used (GObsF). Finally, using observed allele frequencies with different scaling (GSca), following Gianola et al. (2009)
where p0=α/(α+β) is the expected allele frequency, q0=(1-p0), α and β are parameters of the beta distribution fitting the allelic frequency, and m is the number of markers. The two unknown parameters α and β were estimated using the method of moments (Johnson et al., 1994) as follows:
In the above, ˉx and ˉv are the mean and the variance of allele frequencies, respectively. To avoid potential problems with inversion and to account for the relative weight of the polygenic effect needed to explain the total additive variance, three different values (0.95, 0.90 and 0.85) have been considered for w in this study. These three alternative values for w are denoted as ssGBLUP_0.95, ssGBLUP_0.90 and ssGBLUP_0.85, respectively.
The following technique was used to compare prediction ability of the PBLUP and the ssGBLUP models. First, adjusted phenotypes corrected for fixed effects were obtained (adjusted phenotypes) for all animals based on the PBLUP model (PBLUP full model). Second, approximately 10% of the youngest, phenotyped birds had their records set to missing (PBLUP reduced model). The estimated breeding values (EBV) for this 10% of animals were then estimated based on their parent average and comprised the validation group as shown in Table 1. Next, the accuracy of the PBLUP model was calculated as the Pearson correlation coefficient between the adjusted phenotypes of the animals in the validation group from the PBLUP full model and their corresponding EBV obtained from the PBLUP reduced model. The same procedure and validation data set used to validate the PBLUP was used for ssGBLUP, but the accuracy was calculated as the Pearson correlation coefficient between the adjusted phenotypes of the animals in the validation group from the PBLUP full model and their corresponding (G)EBV obtained from the ssGBLUP reduced model.
For PBLUP, the bias of predictions and their associated standard errors were assessed by the regression of each adjusted phenotype from the full PBLUP model in the validation subset on the corresponding EBV from the reduced PBLUP model. For ssGBLUP, the bias was evaluated as the regression of the adjusted phenotype from the full PBLUP model on the corresponding (G)EBV obtained from the reduced ssGBLUP model. Slope coefficients from the linear regression with values closer to one are preferred, as slope coefficients notably less than or higher than 1 reflect inflation and deflation, respectively (Su et al., 2012; González-Recio et al., 2014).
The three different allele frequency approximations (i.e., G0.5F, GObsF, and GSca) showed similar results in terms of accuracy and bias and hence the observed allele frequencies (GObsF) were considered for subsequent analyses.
Estimates of heritability from multi-trait PBLUP and alternatively weighted ssGBLUP are shown in Table 2. Based on pedigree, the heritability estimate for body weight was 0.35 ± 0.06. Similar results of body weight heritability in turkey have been reported (e.g., Nestor et al., 1999; Aslam et al., 2011). The heritability for BMY was 0.27 ± 0.04 and slightly lower than the estimates reported by Aslam et al. (2011) and Le Bihan-Duval et al. (2008) in turkeys (0.30 ± 0.10) and chicken (0.30 ± 0.04), respectively. The heritability estimate for FCR (0.14 ± 0.02) was similar to those reported by Case et al. (2012) (0.16 ± 0.02) and for RFI (0.12 ± 0.02) was lower than the value reported by Case et al. (2012) (0.21 ± 0.02). Across all traits, ssGBLUP had higher heritability estimates than PBLUP. The heritabilities for FCR, RFI, BW, BM and WS were 0.17 ± 0.03, 0.15 ± 0.02, 0.41 ± 0.06, 0.30 ± 0.05, and 0.26 ± 0.04 for ssGBLUP_0.90 model, respectively, while the estimates were 0.14 ± 0.02, 0.14 ± 0.02, 0.35 ± 0.06, 0.27 ± 0.04, and 0.24 ± 0.04 for the PBLUP model.
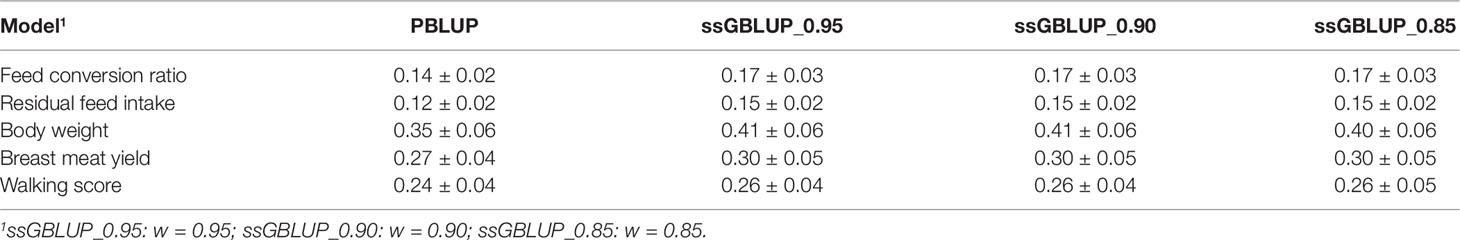
Table 2 Heritability estimates ± standard errors for the studied traits based on the pedigree-based best linear unbiased prediction (PBLUP) and the single-step genomic best linear unbiased prediction blending (ssGBLUP) with three different combinations of blending weights (w) for genomic (G) and pedigree (A22) relationship matrices.
Accurate estimation of genetic correlations among traits is imperative for any breeding program (Pantelić et al., 2011). Genetic and residual correlations given by the overall most accurate method (ssGBLUP_0.90, see next sections) are shown in Table 3. The genetic correlations between BW and FCR (0.19 ± 0.07), RFI (0.13 ± 0.08) and BMY (0.16 ± 0.06) were all positive and weak, but BW was moderately negatively correlated to WS (-0.47 ± 0.02). Low or no genetic correlation was observed between BMY and FCR (-0.05 ± 0.01); WS and FCR (-0.09 ± 0.07); RFI and BMY (0.09 ± 0.01). Walking ability was also moderately negatively correlated to BMY (-0.35 ± 0.05) and lowly correlated to RFI (0.08 ± 0.01). The two feed efficiency traits were highly positively correlated (0.68 ± 0.06). The residual correlation of BW was negative with FCR (-0.39 ± 0.01) and with RFI (-0.17 ± 0.03), but positive with BMY (0.19 ± 0.02). Walking ability, on the other hand, had negative correlation (-0.15 ± 0.01) with BW and approximately zero residual correlations with all other studied traits. BMY showed low negative residual correlation with FCR (-0.10 ± 0.01) and RFI (-0.07 ± 0.03), and a positive moderate (0.23 ± 0.09) residual correlation was found between FCR and RFI.
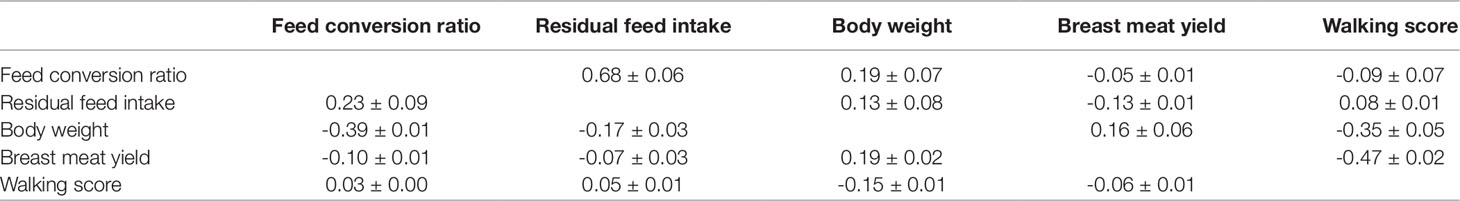
Table 3 Genetic (above diagonal) and residual (below diagonal) correlations ± standard errors for the studied traits based on the single-step genomic best linear unbiased prediction (ssGBLUP_0.90).
These results indicate a moderate and unfavorable genetic correlation between WS with both BW and BMY, meaning that selection for increased BW and BMY may also increase leg problems. The genetic increase in body weight of turkeys starting at age 16 weeks was previously found associated with frequency of leg abnormalities (Nestor, 1984). The main cause for this issue is that the direct selection for increased BMY and the overall BW had led to a relatively faster increase in these parts of the body than the muscles and bones of the legs (Nestor et al., 1987). Since the estimated unfavorable genetic correlations are only moderate, it would be desirable to further investigate these traits to detect quantitative trait loci/genes that may enhance both BW/BMY and walking ability. This could be performed in the context of genome-wide association analysis with multiple traits using, for example, structural equation modeling approaches (Rosa et al., 2011). Conversely, BW was positively correlated to feed efficiency traits as well as to BMY, indicating that selection for higher BW could indirectly increase these two traits. The genetic correlations between feed efficiency traits and walking ability were close to zero. No previous studies were available to compare these results. The high genetic correlation between FCR and RFI is expected and agrees with previous estimates in the turkey (Case et al., 2012), beef (Schenkel et al., 2004) and pigs (Hoque et al., 2007).
Across the studied traits, the ssGBLUP model outperformed PBLUP (shown in Table 4). Accuracies of PBLUP ranged from 0.21 to 0.36 and those for ssGBLUP ranged from 0.26 to 0.40 with lower heritability traits showing a higher increase in accuracy between PBLUP and ssGBLUP. Results of the ssGBLUP_90 showed an increase in accuracy of 31%, 29%, 12%, 23%, and 16% for FCR, RFI, BW, BMY, and WS, respectively. In general, marker-based EBV have shown higher predictive ability than those estimates using pedigree relationships (e.g., Daetwyler et al., 2007; Hayes et al., 2010). The results of this study indicate that incorporating genomic data (ssGBLUP blending) in the prediction of the traits investigated here produces more accurate predictions, which will lead to an improved genetic gain in turkey breeding.
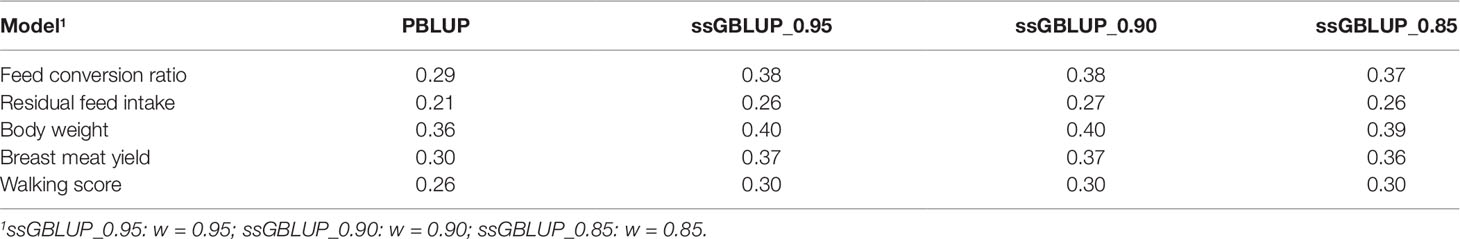
Table 4 Accuracy (Pearson correlation coefficient) of estimated breeding values for the studied traits based on the pedigree-based best linear unbiased prediction (PBLUP) and the single-step genomic best linear unbiased prediction prediction (ssGBLUP) with three different combinations of blending weights (w) for genomic (G) and pedigree (A22) relationship matrices.
In practice, there could be a number of issues with single-step prediction. The genomic matrix can be singular if there are more genotyped animals than markers, or in the presence of clones (Misztal et al., 2009; Aguilar et al., 2010; Forni et al., 2011). More generally, collinearity between variables and low rank (row or column, equivalently) of the matrix are reasons that make the inversion of a matrix difficult or not possible. To avoid the potential problems with inversion and to account for the relative weight of the polygenic effect needed to explain the total additive variance, different scenarios were applied to scale the genomic matrix to the pedigree matrix. As shown in Table 4, the three weights applied to the ssGBLUP model in the present study showed comparable prediction abilities. Using simulated data, Vitezica et al. (2010) reported that the single-step method showed less bias and more accurate prediction when the genomic relationship matrix was adjusted by a constant. Similar results were reported by Chen et al. (2011) and by Forni et al. (2011) using chicken and pig data, respectively. Although the differences between the weightings applied in this study were not large, the weighting factors of 0.95 and 0.90 could be the optimal choices to improve breast meat yield and the other four traits, respectively.
In addition to the accuracy of prediction, it is important to examine potential bias when establishing a breeding program or comparing models. Although it does not change the ranking of animals from the same generation, systematic over- or under-estimation of genetic merit leads to consistent biases (González-Recio et al., 2014). Hence, the predicted performance of the selection candidates could be over- or under-estimated. The regression coefficients for all traits across the different models considered in this study are shown in Table 5. A regression coefficient less or greater than one indicates an overestimation (inflation) or underestimation (deflation), respectively. In general, bias estimates were quite similar among models, but varied among trait, and the bias estimates ranged between 0.73 ± 0.04 and 1.41 ± 0.21. Except for BMY, all traits had regression coefficients lower than one. Among the models, PBLUP showed the highest deflation for breast meat yield (1.41 ± 0.21), which could be due to the small number of animals with both genotypes and phenotypes for this trait. PBLUP also showed the lowest deflation for feed conversion ratio (0.94 ± 0.17) and for WS (0.73 ± 0.04), however compared to ssBLUP_95 (ssGBLUP_0.95; 0.95 ± 0.17 and 0.75 ± 0.17, respectively), the differences were negligible. The differences among the three ssGBLUP models were also small with some slight changes in bias for individual traits. The BMY had a regression coefficient higher than one and the three ssGBLUP models showed similar but slightly lower inflation (1.38 ± 0.21). Despite the accuracy of any prediction procedure, it is worthwhile to pay attention to bias and apply appropriate bias correction methods, such as including a genomic pseudo-performance based on GEBV for all the selection candidates (Patry and Ducrocq, 2011). This is important if proven and young candidates are expected to be simultaneously selected. The dataset used in this study, particularly the genotyped population for BMY, is small. Hence, with a larger training population, prediction accuracy could be enhanced and bias could be reduced.
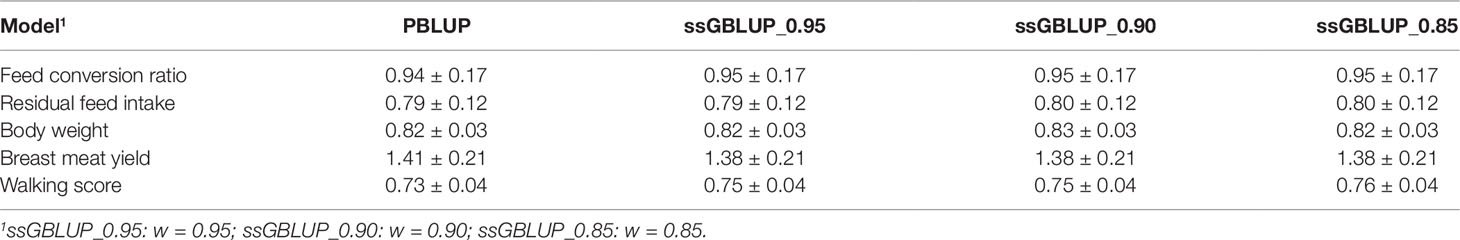
Table 5 Regression coefficients of estimated breeding values from the full PBLUP model on their corresponding EBV from the reduced PBLUP model and on their corresponding GEBV from the reduced ssGBLUP model with three different combinations of blending weights (w) for genomic (G) and pedigree (A22) relationship matrices.
In this study, we estimated heritability, genetic correlations and contrasted single-step genomic and pedigree-based models in terms of prediction ability using two feed efficiency traits, body weight, breast meat yield, and walking ability in turkeys. We showed that incorporating genomic information into breeding programs increased prediction accuracy for the five traits investigated. Single-step genomic prediction showed substantially higher accuracy estimates than the pedigree-based model. Slightly different levels of bias were observed across the alternate models, but a high variation in bias was observed across the traits. The five traits investigated are expensive to measure, therefore the use of genomic selection has strong potential to reduce the cost of turkey breeding programs, as the reliance on phenotypic, pedigree, and progeny information is reduced.
Data that support the findings of this study are available from Hybrid Turkeys upon reasonable request, but restrictions apply to the availability of these data, which were used under a license of a material transfer agreement for the current study, and thus are not publicly available.
This study was carried out in accordance with the principles of the Canadian Council on Animal Care, the Hendrix Genetics Animal Welfare Policy, and the University of Guelph Animal Care Committee. The protocol was approved by the University of Guelph Animal Care Committee (Animal Use Protocol #3782).
The author(s) have made the following declarations about their contributions: Conceived and designed the experiments: EA, FS, CB. Analyzed the data: EA, FS. Interpreted results: EA, CB, HE, FS, BW, OW, PV. Wrote the paper: EA, CB, FS, RV, BW.
This study was conducted as part of the project entitled ‘Application of genomic selection in turkeys for health, welfare, efficiency and production traits’. This Project was funded by the Government of Canada through Genome Canada and the Ontario Genomics Institute (OGI-133) through the Genome Canada Genomic Application Partnership Program [recipients: CB (Academic), BW (Industry)]. This study was also financially supported by Hybrid Turkeys (Kitchener, Canada). The authors declare that this study received funding from Hybrid Turkeys. The funder was involved in providing datasets used in this study.
BW and OW are employed by Hybrid Turkeys, Kitchener Canada. PV is employed by Hendrix Genetics, Boxmeer, Netherlands.
The remaining authors declare that the research was conducted in the absence of any commercial or financial relationships that could be construed as a potential conflict of interest.
The authors extend their gratitude to Jeff Mohr and personnel of the Hybrid Turkeys pedigree farm (Kitchener, Canada) for collecting and providing data used in this study.
Abdalla, E. A., Lopes, F. B., Byrem, T. M., Weigel, K. A., Rosa, G. J. M. (2019). Genomic prediction of bovine leukosis incidence in a US Holstein population. Livest. Sci. 225, 73–77. doi: 10.1016/j.livsci.2019.05.004
Aguilar, I., Misztal, I., Johnson, D. L., Legarra, A., Tsuruta, S., Lawlor, T. J. (2010). Hot topic: a unified approach to utilize phenotypic, full pedigree, and genomic information for genetic evaluation of Holstein final score1. J. Dairy Sci. 93, 743–752. doi: 10.3168/jds.2009-2730
Aslam, M. L., Bastiaansen, J. W. M., Crooijmans, R. P. M. A., Ducro, B. J., Vereijken, A., Groenen, M. A. M. (2011). Genetic variances, heritabilities and maternal effects on body weight, breast meat yield, meat quality traits and the shape of the growth curve in turkey birds. BMC Genet. 12, 14. doi: 10.1186/1471-2156-12-14
Baes, C., Reinsch, N. (2007). Computing the condensed conditional gametic QTL relationship matrix and its inverse. Arch. Anim. Breed. 50, 294–308. doi: 10.5194/aab-50-294-2007
Bolormaa, S., Pryce, J. E., Kemper, K., Savin, K., Hayes, B. J., Barendse, W., et al. (2013) Accuracy of prediction of genomic breeding values for residual feed intake and carcass and meat quality traits in Bos taurus, Bos indicus, and composite beef cattle1. J. Anim. Sci. 91, 3088–3104. doi: 10.2527/jas.2012-5827
Case, L. A., Wood, B. J., Miller, S. P. (2012). The genetic parameters of feed efficiency and its component traits in the turkey (Meleagris gallopavo). Genet. Sel. Evol. 44, 2. doi: 10.1186/1297-9686-44-2
Chen, C. Y., Misztal, I., Aguilar, I., Legarra, A., Muir, W. M. (2011). Effect of different genomic relationship matrices on accuracy and scale. J. Anim. Sci. 89, 2673–2679. doi: 10.2527/jas.2010-3555
Christensen, O. F., Lund, M. S. (2010). Genomic prediction when some animals are not genotyped. Genet. Sel. Evol. 42, 1–8. doi: 10.1186/1297-9686-42-2
Daetwyler, H. D., Villanueva, B., Bijma, P., Woolliams, J. A. (2007). Inbreeding in genome-wide selection. J. Anim. Breed. Genet. 124, 369–376. doi: 10.1111/j.1439-0388.2007.00693.x
Dekkers, J. C. M. (2004). Commercial application of marker-and gene-assisted selection in livestock: strategies and lessons. J. Anim. Sci. 82, E313–E328. doi: 10.2527/2004.8213_supplE313x
Forni, S., Aguilar, I., Misztal, I. (2011). Different genomic relationship matrices for single-step analysis using phenotypic, pedigree and genomic information. Genet. Sel. Evol. 43, 1–7. doi: 10.1186/1297-9686-43-1
Fragomeni, B. O., Lourenco, D. A. L., Tsuruta, S., Masuda, Y., Aguilar, I., Legarra, A., et al. (2015). Hot topic: Use of genomic recursions in single-step genomic best linear unbiased predictor (BLUP) with a large number of genotypes. J. Dairy Sci. 98, 4090–4094. doi: 10.3168/jds.2014-9125
Garrick, D. J., Fernando, R. L. (2014). Genomic prediction and genome-wide association studies in beef and dairy cattle. 2nd ed. Eds. D. J. Garrick, and A. Ruvinsky (Wallingford, UK: CABI Publishing).
Garrick, D. J., Taylor, J. F., Fernando, R. L. (2009). Deregressing estimated breeding values and weighting information for genomic regression analyses. Genet. Sel. Evol. 41, 1–8. doi: 10.1186/1297-9686-41-55
Gianola, D., de los Campos, G., Hill, W. G., Manfredi, E., Fernando, R. (2009). Additive genetic variability and the Bayesian alphabet. Genetics 183, 347–363. doi: 10.1534/genetics.109.103952
González-Recio, O., Rosa, G. J. M., Gianola, D. (2014). Machine learning methods and predictive ability metrics for genome-wide prediction of complex traits. Livest. Sci. 166, 217–231. doi: 10.1016/j.livsci.2014.05.036
Hayes, B. J., Bowman, P. J., Chamberlain, A. C., Verbyla, K., Goddard, M. E. (2009a). Accuracy of genomic breeding values in multi-breed dairy cattle populations. Genet. Sel. Evol. 41, 1–9. doi: 10.1186/1297-9686-41-1
Hayes, B. J., Chamberlain, A. J., Bowman, P. J., Goddard, M. E. (2009b). Invited review: genomic selection in dairy cattle: progress and challenges. J. Dairy Sci. 92, 433–443. doi: 10.3168/jds.2008-1646
Hayes, B. J., Pryce, J., Chamberlain, A. J., Bowman, P. J., Goddard, M. E. (2010). Genetic architecture of complex traits and accuracy of genomic prediction: coat colour, milk-fat percentage, and type in Holstein cattle as contrasting model traits. PloS Genet. 6, e1001139. doi: 10.1371/journal.pgen.1001139
Henderson, C. R. (1975). Best linear unbiased estimation and prediction under a selection model. Biometrics 31, 423–447. doi: 10.2307/2529430
Hoque, M. A., Kadowaki, H., Shibata, T., Oikawa, T., Suzuki, K. (2007). Genetic parameters for measures of the efficiency of gain of boars and the genetic relationships with its component traits in Duroc pigs1. J. Anim. Sci. 85, 1873–1879. doi: 10.2527/jas.2006-730
Johnson, N. L., Kotz, S., Balakrishnan, N. (1994). “Chapter 21: Beta Distributions,” in Continuous univariate distributions, 2nd ed. (New York U. S. A.: Wiley).
Le Bihan-Duval, E., Debut, M., Berri, C. M., Sellier, N., Santé-Lhoutellier, V., Jégo, Y., et al. (2008). Chicken meat quality: genetic variability and relationship with growth and muscle characteristics. BMC Genet. 9, 1–6. doi: 10.1186/1471-2156-9-53
Legarra, A., Aguilar, I., Misztal, I. (2009). A relationship matrix including full pedigree and genomic information. J. Dairy Sci. 92, 4656–4663. doi: 10.3168/jds.2009-2061
Meuwissen, T. H., Hayes, B. J., Goddard, M. E. (2001). Prediction of total genetic value using genome-wide dense marker maps. Genetics 157, 1819–1829.
Misztal, I., Legarra, A., Aguilar, I. (2009). Computing procedures for genetic evaluation including phenotypic, full pedigree, and genomic information. J. Dairy Sci. 92, 4648–4655.
Misztal, I., Tsuruta, S., Lourenco, D., Aguilar, I., Legarra, A., Vitezica, Z. (2014). Manual for BLUPF90 family of programs. Athens Univ. Georg. U. S. A.125.
Nestor, K. E., Bacon, W. L., Moorhead, P. D., Saif, Y. M., Havenstein, G. B., Renner, P. A. (1987). Comparison of bone and muscle growth in Turkey lines selected for increased body weight and increased shank width. Poult. Sci. 66, 1421–1428. doi: 10.3382/ps.0661421
Nestor, K. E., Anderson, J. W., Patterson, R. A. (1999). Genetics of growth and reproduction in the Turkey. 14. Changes in genetic parameters over thirty generations of selection for increased body weight. Poult. Sci. 56, 337–347. doi: 10.3382/ps.0560337
Nestor, K. E. (1984). Genetics of growth and reproduction in the Turkey.: 9. Long-term selection for increased 16-week body weight. Poult. Sci. 63, 2114–2122. doi: 10.3382/ps.0632114
Pantelić, V., Sretenović, L., Ostojić-Andrić, D., Trivunović, S., Petrović, M. M., Aleksić, S., et al. (2011) Heritability and genetic correlation of production and reproduction traits of Simmental cows. Afr. J. Biotechnol. 10, 7117–7121.
Patry, C., Ducrocq, V. (2011). Accounting for genomic pre-selection in national BLUP evaluations in dairy cattle. Genet. Sel. Evol. 43, 30. doi: 10.1186/1297-9686-43-30
Rosa, G. J. M., Valente, B. D., de los Campos, G., Wu, X.-L., Gianola, D., Silva, M. A. (2011). Inferring causal phenotype networks using structural equation models. Genet. Sel. Evol. 43, 6. doi: 10.1186/1297-9686-43-6
Schenkel, F. S., Miller, S. P., Wilton, J. W. (2004). Genetic parameters and breed differences for feed efficiency, growth, and body composition traits of young beef bulls. Can. J. Anim. Sci. 84, 177–185. doi: 10.4141/A03-085
Su, G., Madsen, P., Nielsen, U. S., Mäntysaari, E. A., Aamand, G. P., Christensen, O. F., et al. (2012). Genomic prediction for Nordic Red Cattle using one-step and selection index blending. J. Dairy Sci. 95, 909–917. doi: 10.3168/jds.2011-4804
Tu, X., Du, S., Tang, L., Xin, H., Wood, B. (2011). A real-time automated system for monitoring individual feed intake and body weight of group housed turkeys. Comput. Electron. Agric. 75, 313–320. doi: 10.1016/j.compag.2010.12.007
VanRaden, P. M., Van Tassell, C. P., Wiggans, G. R., Sonstegard, T. S., Schnabel, R. D., Taylor, J. F., et al. (2009). Invited review: reliability of genomic predictions for North American Holstein bulls. J. Dairy Sci. 92, 16–24. doi: 10.3168/jds.2008-1514
VanRaden, P. M. (2008). Efficient methods to compute genomic predictions. J. Dairy Sci. 91, 4414–4423. doi: 10.3168/jds.2007-0980
Verbyla, K. L., Hayes, B. J., Bowman, P. J., Goddard, M. E. (2009). Accuracy of genomic selection using stochastic search variable selection in Australian Holstein Friesian dairy cattle. Genet. Res. (Camb.) 91, 307. doi: 10.1017/S0016672309990243
Vitezica, Z. G., Aguilar, I., Legarra, A. (2010). “One-step vs. multi-step methods for genomic prediction in presence of selection,” in Proceedings of the world congress on genetics applied to livestock production, volume genetic improvement programmes: selection using molecular information - lecture sessions, 1–6.
Keywords: single-step blending, genomic selection, pedigree best linear unbiased prediction, genetic correlation, accuracy, bias
Citation: Abdalla EEA, Schenkel FS, Emamgholi Begli H, Willems OW, van As P, Vanderhout R, Wood BJ and Baes CF (2019) Single-Step Methodology for Genomic Evaluation in Turkeys (Meleagris gallopavo). Front. Genet. 10:1248. doi: 10.3389/fgene.2019.01248
Received: 23 May 2019; Accepted: 13 November 2019;
Published: 20 December 2019.
Edited by:
Rohan Luigi Fernando, Iowa State University, United StatesReviewed by:
Ismo Strandén, Natural Resources Institute Finland (Luke), FinlandCopyright © 2019 Abdalla, Schenkel, Emamgholi Begli, Willems, van As, Vanderhout, Wood and Baes. This is an open-access article distributed under the terms of the Creative Commons Attribution License (CC BY). The use, distribution or reproduction in other forums is permitted, provided the original author(s) and the copyright owner(s) are credited and that the original publication in this journal is cited, in accordance with accepted academic practice. No use, distribution or reproduction is permitted which does not comply with these terms.
*Correspondence: Emhimad E. A. Abdalla, eabdalla@uoguelph.ca
†These authors have contributed equally to this work
Disclaimer: All claims expressed in this article are solely those of the authors and do not necessarily represent those of their affiliated organizations, or those of the publisher, the editors and the reviewers. Any product that may be evaluated in this article or claim that may be made by its manufacturer is not guaranteed or endorsed by the publisher.
Research integrity at Frontiers
Learn more about the work of our research integrity team to safeguard the quality of each article we publish.