 Dengqiang Lin1†
 Jinglai Lin1†Xiaoxia Li2†Jianping Zhang1Peng Lai1Zhifeng Mao1Li Zhang1Yu Zhu3*Yujun Liu1*
- 1Department of Urology, Xiamen Hospital of Zhongshan Hospital, Fudan University, Xiamen, China
- 2Department of Radiology, Xiamen Hospital of Zhongshan Hospital, Fudan University, Xiamen, China
- 3Department of Urology, Ruijin Hospital, Medical School of Shanghai Jiaotong University, Shanghai, China
Malignant pheochromocytoma (PHEO) can only be fully diagnosed when metastatic foci develop. However, at this point in time, patients gain little benefit from traditional therapeutic methods. Methylation plays an important role in the pathogenesis of PHEO. The aim of this research was to use integrated bioinformatics analysis to identify differentially expressed genes (DEGs) showing aberrant methylation patterns in PHEO and therefore provide further understanding of the molecular mechanisms underlying this condition. Aberrantly methylated DEGs were first identified by using R software (version 3.6) to combine gene expression microarray data (GSE19422) with gene methylation microarray data (GSE43293). An online bioinformatics database (DAVID) was then used to identify all overlapping DEGs showing aberrant methylation; these were annotated and then functional enrichment was ascertained by gene ontology (GO) analysis. The online STRING tool was then used to analyze interactions between all overlapping DEGs showing aberrant methylation; these results were then visualized by Cytoscape (version 3.61). Next, using the cytoHubba plugin within Cytoscape, we identified the top 10 hub genes and found that these were predominantly enriched in pathways related to cancer. Reference to The Cancer Genome Atlas (TCGA) further confirmed our results and further identified an upregulated hypomethylated gene (SCN2A) and a downregulated hypermethylated gene (KCNQ1). Logistic regression analysis and receiver operating characteristic (ROC) curve analysis indicated that KCNQ1 and SCN2A represent promising differential diagnostic biomarkers between benign and malignant PHEO. Finally, clinical data showed that there were significant differences in the concentrations of potassium and sodium when compared between pre-surgery and post-surgery day 1. These suggest that KCNQ1 and SCN2A, genes that encode potassium and sodium channels, respectively, may serve as putative diagnostic targets for the diagnosis and prognosis of PHEO and therefore facilitate the clinical management of PHEO.
Introduction
Pheochromocytoma (PHEO) arises from the extra-adrenal sympathetic and parasympathetic ganglia (also referred to as the paraganglioma), as well as the intra-adrenal medulla. This tumor is rare, with a reported incidence of 1 in 300,000 (Else et al., 1993; Lefebvre and Foulkes 2014; Lenders et al., 2014). However, PHEO is a frequent cause of secondary hypertension, a potentially life-threatening cardiovascular complication (Zelinka et al., 2012; Prejbisz et al., 2013). Clinical reports show that up to 36% of patients develop malignancy (Pacak et al., 2007). On the other hand, reports from autopsy research estimate that 0.05–0.1% of cases remain undiagnosed (Jain et al., 2019). Current guidelines for the early treatment of PHEO recommend radical surgical resection. The 5-year survival rate post-surgery in benign cases of PHEO ranges from 84% to 96%, but is less than 50% in malignant cases; the recurrence rate can be as high as 65.45 within 5 years (Schurmeyer et al., 1988; Walther et al., 1999; Kopf et al., 2001; Edstrom Elder et al., 2003). Once PHEO enters an advanced stage, effective treatment modalities are limited, but include radionuclide therapy (131I-MIBG) (van Hulsteijn et al., 2014), chemotherapy (a combination of cyclophosphamide, vincristine, and dacarbazine) (Vogel et al., 2014), and external beam radiation therapy (Vogel et al., 2014). However, patients suffering from the advanced stages of PHEO gain little benefit from such treatment modalities. Therefore, there is an urgent need to investigate the key genes involved in the progression of this disease. The identification of new biomarkers could help us to improve the prognosis of patients and facilitate clinical management.
Research studies have identified germline mutations in around one third of patients with PHEO (Lenders and Eisenhofer, 2017) and have identified a range of susceptibility genes, including RET, HIF2A, VHL, NF1, SDHx (SDHA, SDHB, SDHC, SDHD, SDHAF2), FH, TMEM127, and MAX (Wallace et al., 1990; Latif et al., 1993; Mulligan et al., 1993; Baysal et al., 2000; Niemann and Muller, 2000; Astuti et al., 2001; Hao et al., 2009; Burnichon et al., 2010; Qin et al., 2010; Comino-Mendez et al., 2011; Castro-Vega et al., 2014). Although genomic variation appears to occur more commonly in PHEO than in any other human tumors (Karagiannis et al., 2007; Fishbein and Nathanson, 2012), research has failed to identify specific genes related to carcinogenesis. Over recent years, the use of microarrays and sequencing has become a promising and effective technique with which to screen hub disease-causing genes and identify biomarkers of diagnostic, prognostic, and therapeutic value. To our knowledge, a complete bioinformatic analysis of PHEO, using the Gene Expression Omnibus (GEO) database and The Cancer Genome Atlas (TCGA), has yet to be carried out, particularly with regards to gene expression and methylation.
In this study, we first identified and screened differentially expressed genes (DEGs) showing aberrant methylation in PHEO by combining gene expression microarray data (GSE19422) and gene methylation microarray data (GSE43293). We then identified 10 core genes showing differential expression and aberrant methylation to act as suitable candidates for further interaction network analysis. TCGA was then used to verify the expression of these core genes and investigate their prognostic value. Our overall goal was to explore new genetic targets that may help us to improve patient outcomes.
Materials and Methods
Microarray Data
Two gene expression profiles were downloaded from GEO (www.ncbi.nlm.nih.gov/geo/): platform GPL6480—Agilent-014850 Whole Human Genome Microarray 4x44K G4112F (GSE19422, including 84 PHEO tissues and six normal adrenal tissues); and the gene methylation dataset—Illumina HumanMethylation450 arrays (GSE43293, including 22 PHEO tissues and two normal adrenal tissues).
Data Processing
All aberrantly methylated DEGs were analyzed with R software (version 3.6) (www.r-project.org/). For DEGS, we used a |log(fold change [FC])| value >1 and an adjusted P value <0.05 as cutoff criteria following normalization and background correction with the affyPLM package in R. Data relating to aberrantly methylated genes were first normalized using the beta-mixture quantile dilation (BMIQ) method in the R wateRmelon package. We then used a β value >0.2 and an adjusted P value <0.05 as cutoff standards.
Gene Ontology Functional Enrichment Analysis
An online bioinformatics database (DAVID, Database for Annotation, Visualization, and Integrated Discovery, https://david.ncifcrf.gov/) was used to identify all overlapping DEGs showing aberrant methylation. These were annotated and then functional enrichment was ascertained by gene ontology (GO) analysis, including biological processes (BP), molecular function (MF), and cellular component (CC) (Consortium, 2006; Huang da et al., 2009). The GO functional enrichment results were visualized using the ggplot2 package in R.
Protein–Protein Interaction Network and Module Analysis
The online STRING tool (http://string-db.org) (Park et al., 2009) was used to search for potential correlations among the overlapping DEGs showing aberrant methylation. Cytoscape software (version 3.61; https://cytoscape.org) (Haffner et al., 2017) was then used to build a protein–protein interaction (PPI) network and analyze potential interactions. The cytoHubba plugin and the maximal clique centrality (MCC) method were then used to identify the top 10 hub genes. We then used the MCODE plugin to screen core modules of the PPI network with a standard degree cutoff of 2, a node score cutoff of 0.2, a k-core of 2, and a maximum depth of 100.
Expression Analysis of Candidate Genes in TCGA
The cBioPortal (www.cbioportal.org/) and UCSC Xena (http://xena.ucsc.edu/welcome-to-ucsc-xena/) platforms, in combination with the TCGA database (TCGA-PCPG), were used to analyze genetic alterations, gene expression levels, and the relationship between expression and methylation. In total, TCGA featured 184 datasets that were available for methylation and expression analysis. We also used the Human Protein Atlas (HPA) database to investigate the expression levels of candidate genes in normal adrenal tissues.
Kaplan–Meier Survival Analysis for Candidate Genes in TCGA
The Kaplan–Meier plotter (www.kmplot.com/) was used to determine the prognostic value of candidate genes in TCGA. P values <0.05 were considered to be statistically significant.
Clinical Information
With the approval of our institutional ethics review board, we collected clinical information, including tumor size and biochemical data, from 136 patients who underwent adrenalectomy and were subsequently diagnosed with PHEO following surgery. The clinical data (Supplementary Table 1) were collected between January 2016 and May 2019 from the Department of Urology in Ruijin Hospital affiliated to the Medical School of Shanghai Jiaotong University in China.
Statistical Analysis
All data are presented as means ± standard deviation. Statistical analyses were performed with SPSS software (version 23.0;IBM). Bar graphs and scatter diagrams were created by GraphPad Prism 7 software. Data analysis and correlation were carried out using paired t tests and either Pearson’s or Spearman’s correlation analysis, as well as line regression analysis. Outliers were analyzed using Spearman’s correlation analysis. We then created a logistic model featuring two selected variables, the expression levels of KCNQ1 and SCN2A, to act as a test for differential diagnosis. Finally, a receiver operating characteristic (ROC) curve was drawn to evaluate the effect of this differential diagnostic test. P values <0.05 were considered to be statistically significant.
Results
The Identification of Aberrantly Methylated DEGs in PHEO
In order to identify genes that were differentially expressed in PHEO and normal tissues, we first downloaded the gene expression profile dataset GSE19422 (84 PHEO tissues and six normal tissues) from the NCBI GEO database. Analysis of GSE19422 led to the identification of 1,935 significant DEGs (948 upregulated and 987 downregulated) for further study (Figures 1A, B). Methylated data were then standardized in the GSE43293 dataset to further identify 3,444 hypermethylated and 5,660 hypomethylated genes (Figure 1C). To identify DEGs showing aberrant methylation, all 948 upregulated genes and 5,660 hypomethylated genes were imported collectively into a Venn diagram. This led to the identification of 412 hypomethylated and highly expressed genes for further analysis (Figure 2A). Analysis also identified 148 hypermethylated genes with low expression levels (Figure 2B).
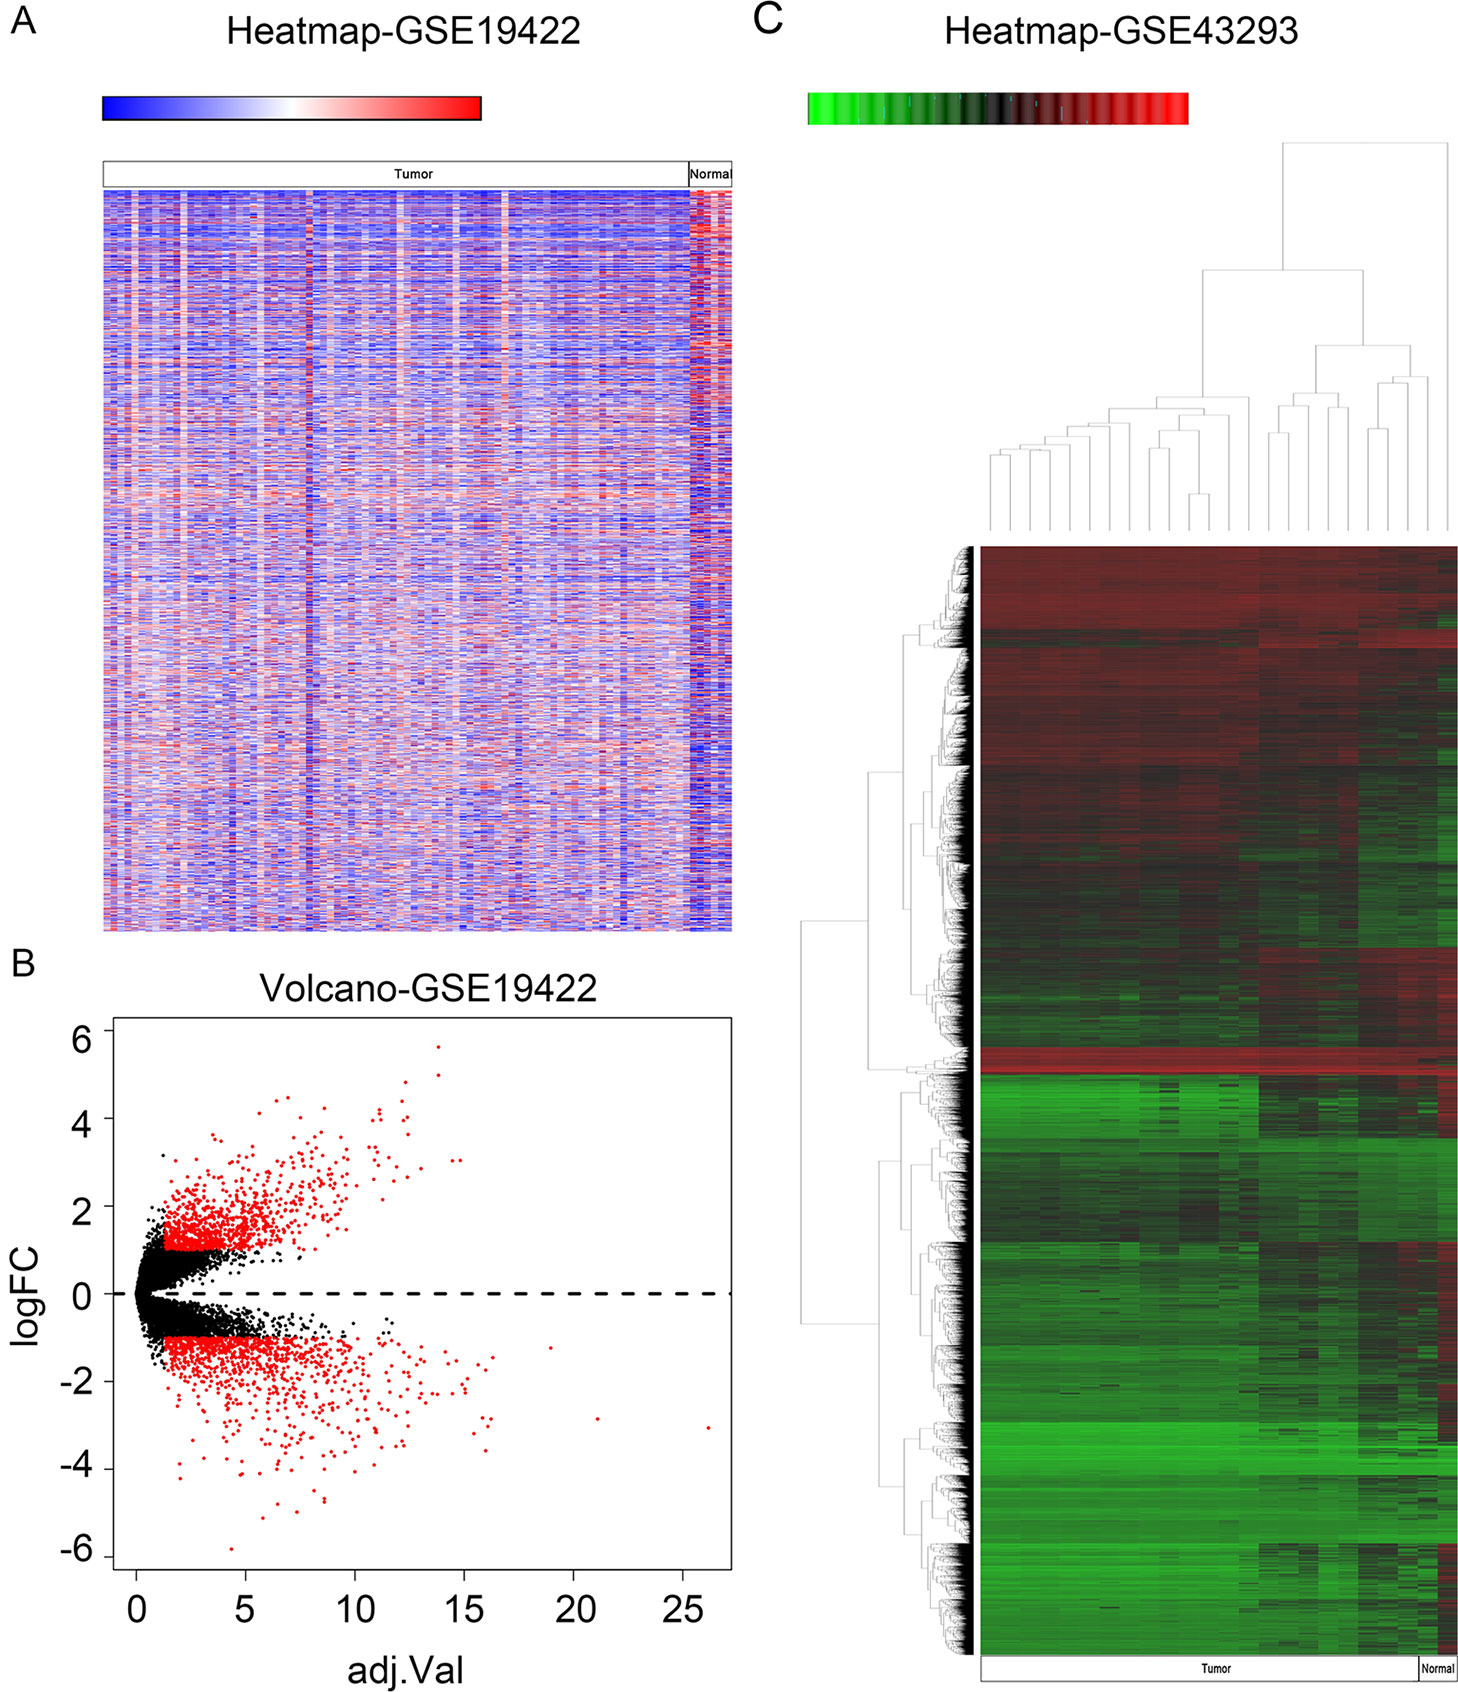
Figure 1 Identification of differentially expressed genes (DEGs) and differentially methylated genes. (A) Heat map of DEGs in GSE19422. Red, upregulated genes; blue, downregulated genes. (B) Volcano plot of DEGs in GSE19422 (red dots). (C) Heat map of DEGs in GSE43293. Red, hypermethylated genes; green, hypomethylated genes.
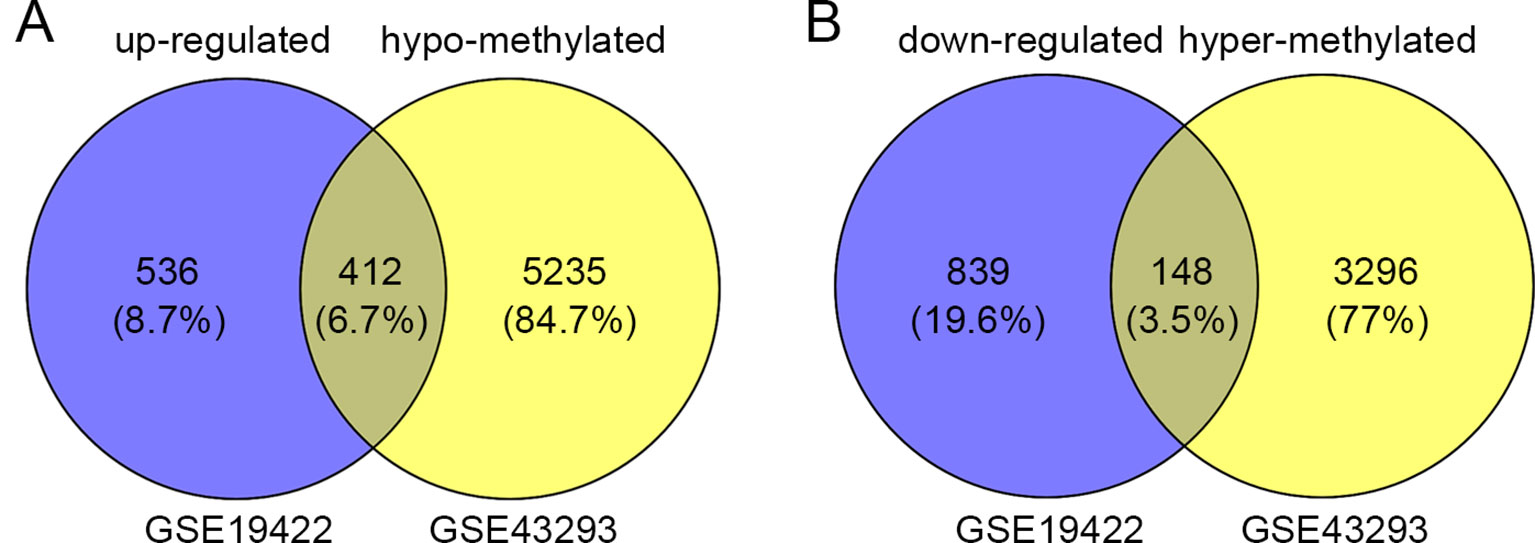
Figure 2 Identification of aberrantly methylated differentially expressed genes (DEGs). (A) 412 upregulated and hypomethylated genes were identified. (B) 148 downregulated and hypermethylated genes were identified.
GO Enrichment Analysis of Aberrantly Methylated DEGs by DAVID 6.8
Next, we attempted to identify the biological function of the 560 aberrantly methylated DEGs. To do this, we used the DAVID 6.8 online tool to carry out GO functional enrichment analysis. As shown in Figure 3, the top 5 functions for BP were as follows: development of the nervous system, the positive regulation of GTPase activity, homophilic cell adhesion via plasma membrane adhesion molecules, axonal guidance, and signal transduction. The top 5 functions for MF were as follows: enriched in hydrolase activity, acting on carbon–nitrogen (but not peptide) bonds, Ras guanyl-nucleotide exchange factor activity, microtubule binding, transcriptional repressor activity, RNA polymerase II core promoter proximal region sequence-specific binding, and structural constituent of cytoskeleton. The top 5 locations for CC were plasma membrane, cell junction, postsynaptic membrane, postsynaptic density, and axon.
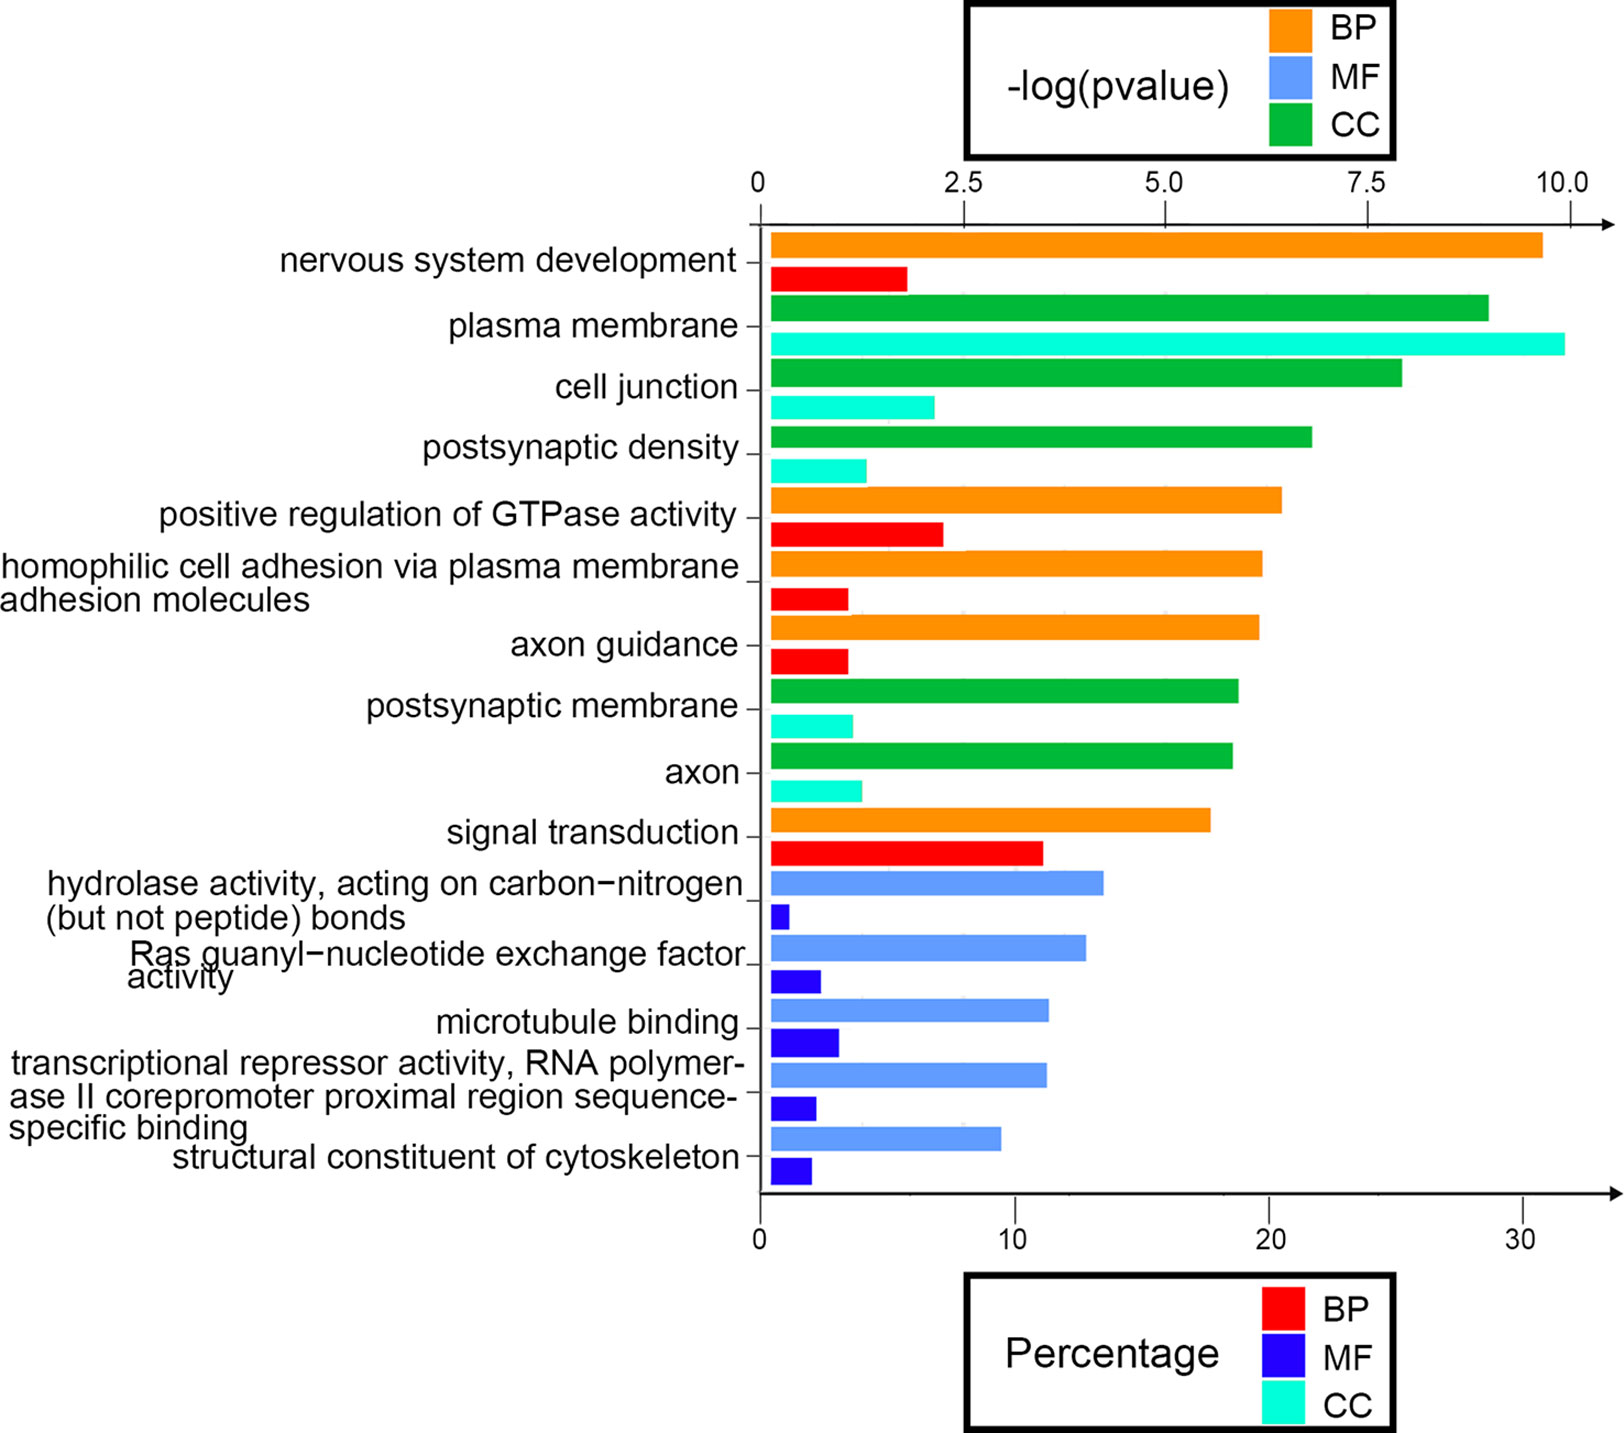
Figure 3 Enrichment analysis of aberrantly methylated differentially expressed genes (DEGs). BP, biological processes; MF, molecular function; CC, cellular component.
The Identification of Hub Genes by Protein–Protein Interaction Analysis Using STRING and Cytoscape 3.61
Next, we attempted to identify hub genes among the 560 aberrantly methylated DEGs. To do this, we used PPI analysis and the online STRING platform to examine protein interaction effects among aberrantly methylated DEGs. As illustrated in Figure 4A, the PPI network included a total of 550 nodes and 1,463 edges (PPI enrichment P < 1.0 × 10⁻¹⁶); these results were imported into Cytoscape 3.61 software for visual analysis. Using the cytoHubba plugin and the MCC method, we identified the top 10 hub genes: CALM1, CACNA1C, KCNH2, KCNQ2, KCNMA1, KCNN2, GRIA2, KCNQ1, KCNN3, and SCN2A (Figure 2B). The MCODE plugin of Cytoscape 3.61 was then used to analyze the whole network; this identified 13 sub-networks (Figure 2C). Of these, module 1 achieved the highest score (score: 6.667), while module 2 featured the most hub genes (five in total: KCNH2, KCNMA1, KCNN2, GRIA2, KCNQ1, and KCNN3). Core module analysis indicated that hub genes may play roles in pathways related to cancer, such as the phospholipase D signaling, cAMP signaling, IL-17 signaling, Toll-like receptor signaling, TNF signaling, and MAPK signaling (Figure 5). Consequently, these 10 candidate hub genes were selected for further analysis.
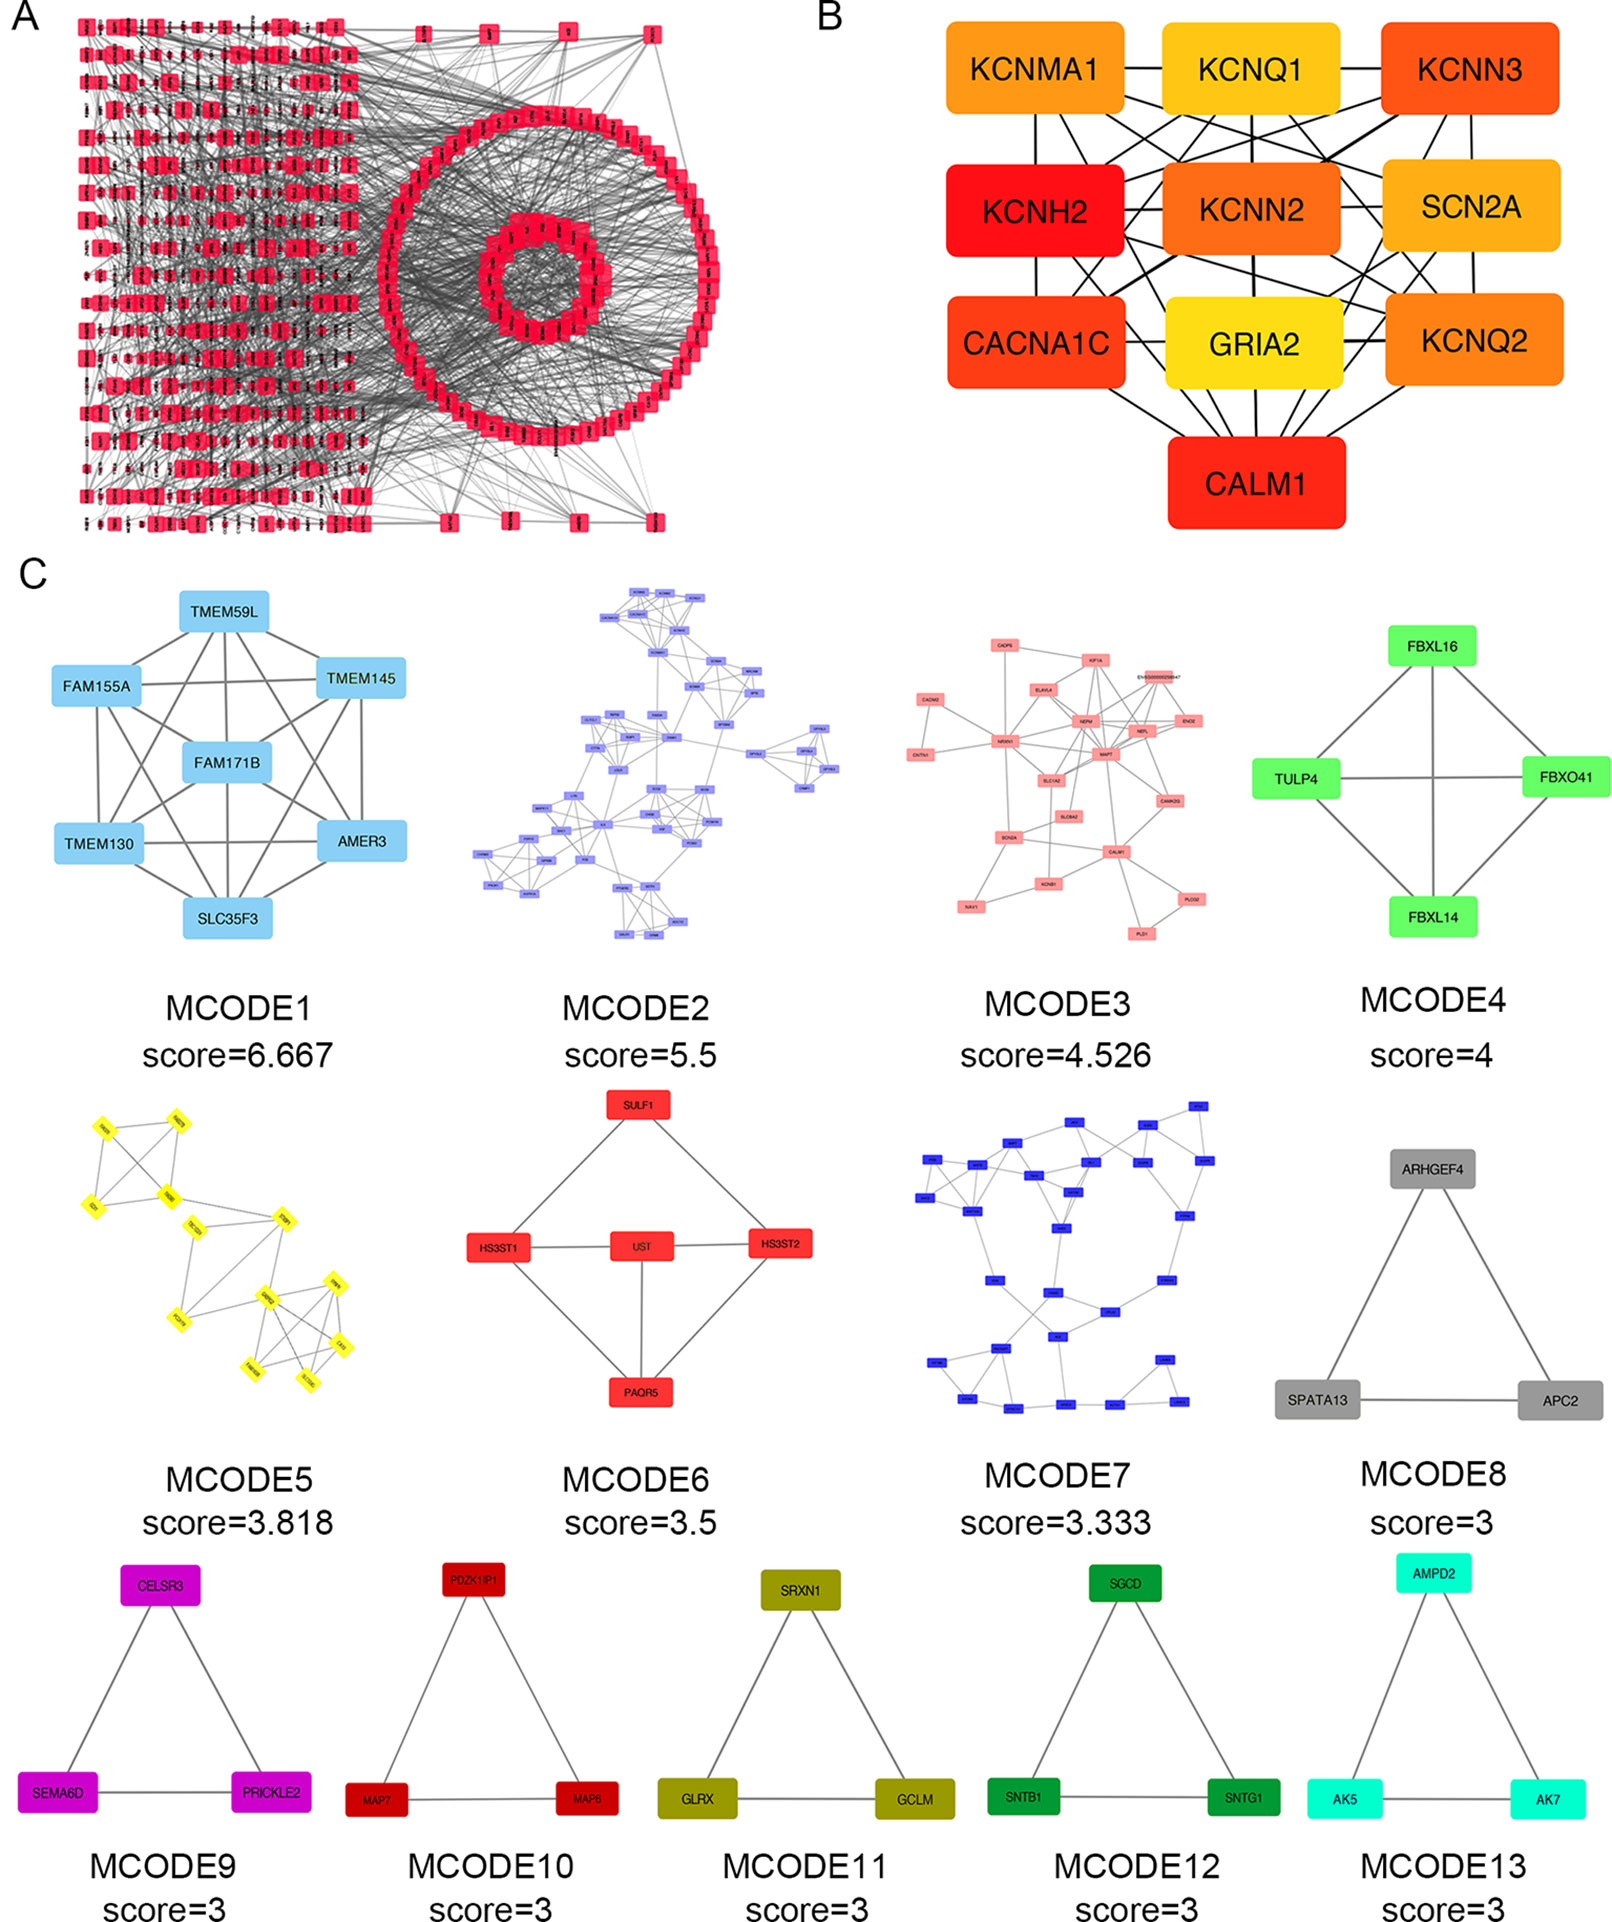
Figure 4 Protein–protein interaction (PPI) network analysis and the identification of hub genes for the aberrantly methylated genes. (A) The PPI network included a total of 550 nodes and 1,463 edges. (B) The top 10 hub genes were evaluated using the maximal clique centrality method. (C) Module analysis for aberrantly methylated DEGs.
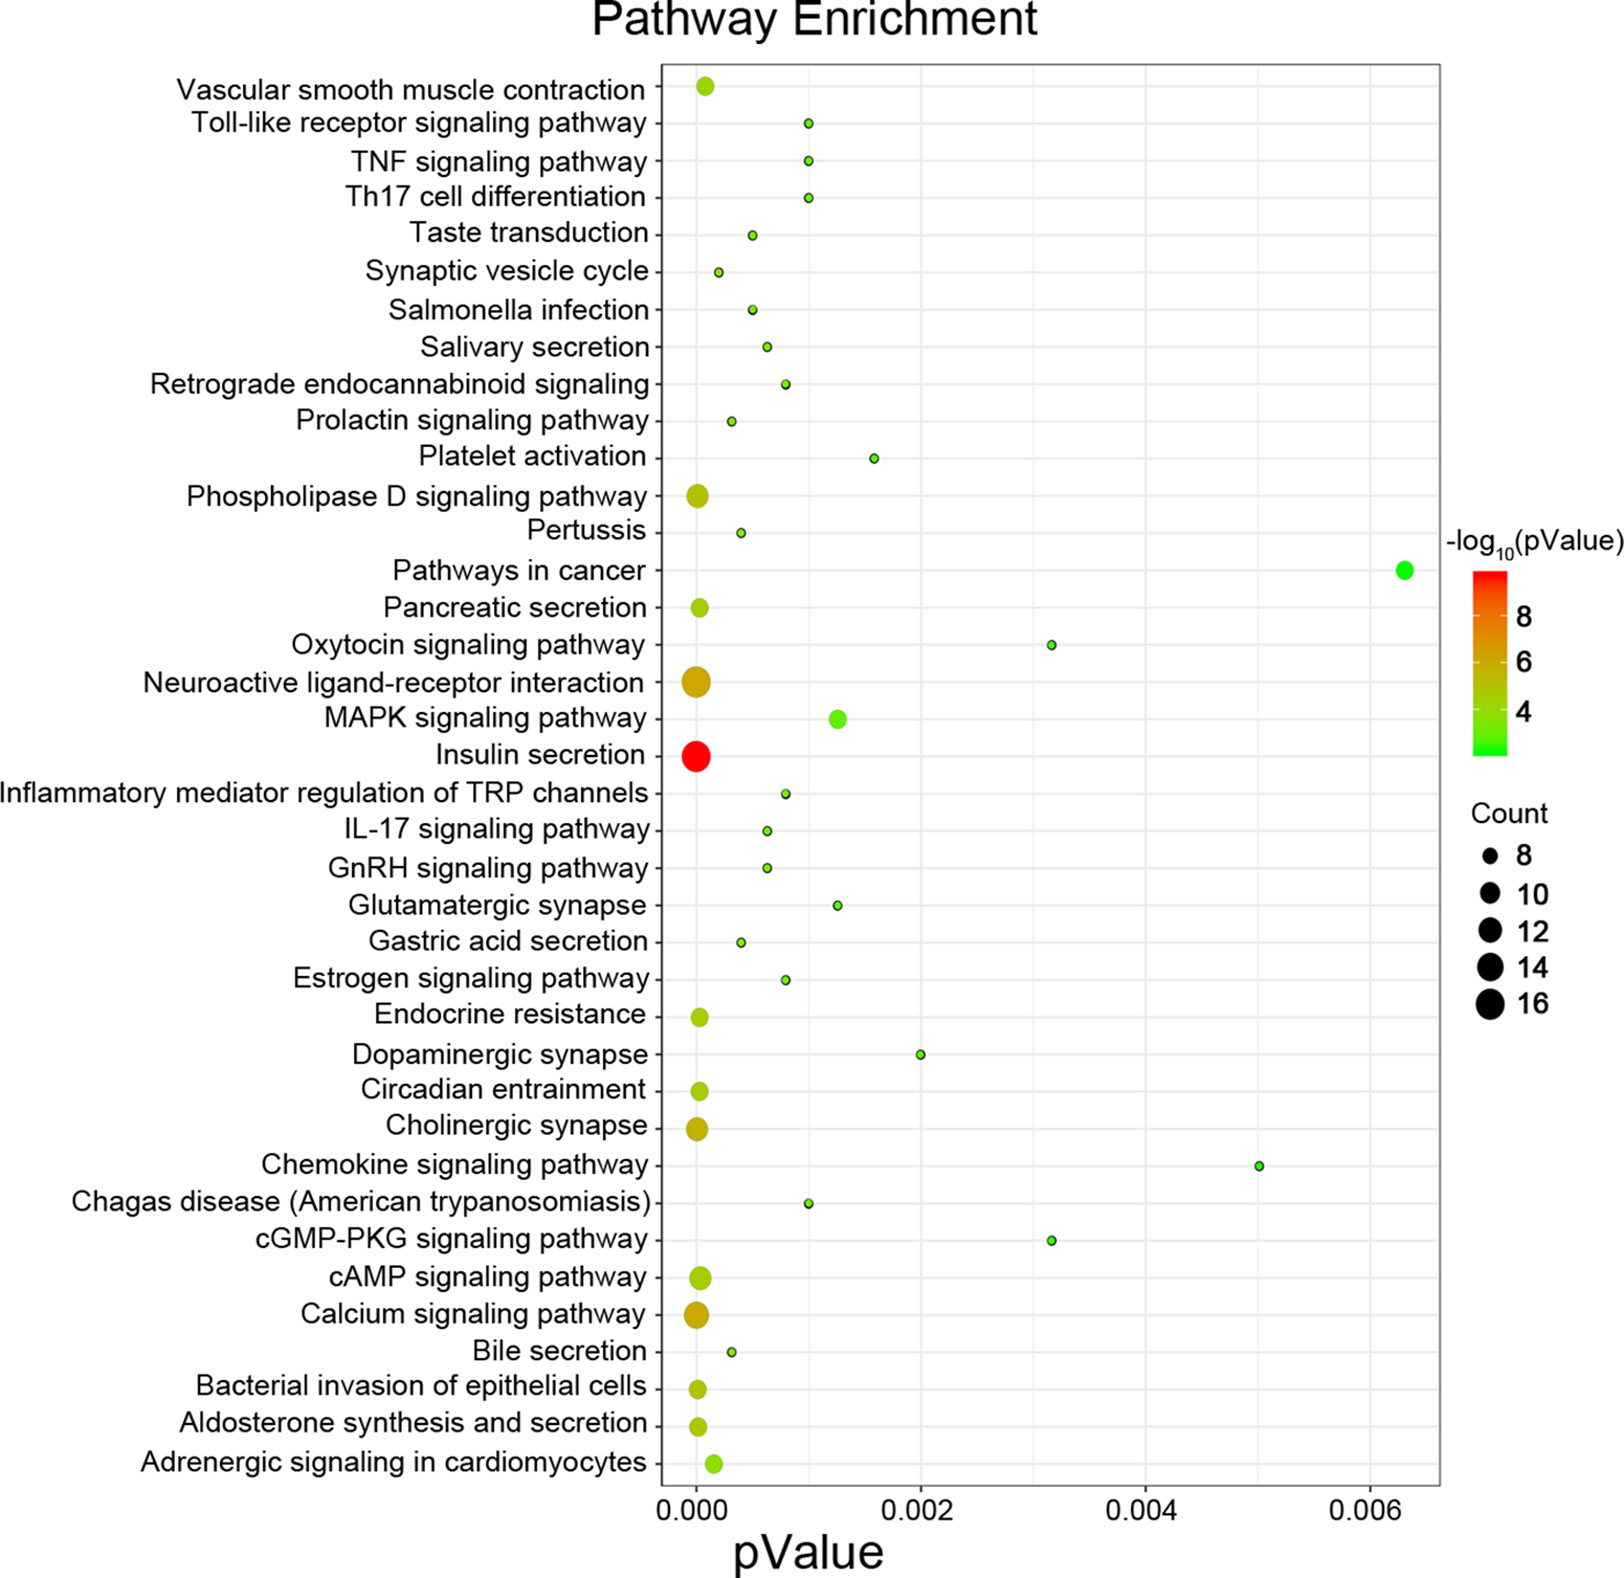
Figure 5 Pathway enrichment analysis for the genes from a core module MCODE 2.
Expression Levels of Candidate Hub Genes in TCGA
The TCGA database was used to further verify our selection of key hub genes. Analysis showed that the 10 hub genes in PHEO tissues showed similar expression levels when compared between the TCGA and the GSE19422 dataset (Figure 6A) and similar methylation patterns (Figure 6B). As shown in Figures 7A, B, these hub genes showed alterations in 44.57% of the 184 cases, including mutation (3.26%) and amplification (4.89%). In addition, we found that the mRNA expression levels of the 10 hub genes showed a significant and negative relationship to the levels of DNA methylation (Figure 7C). Collectively, these findings indicated that DNA methylation exerts a significant effect on the progression of PHEO progression by influencing the expression of hub genes.
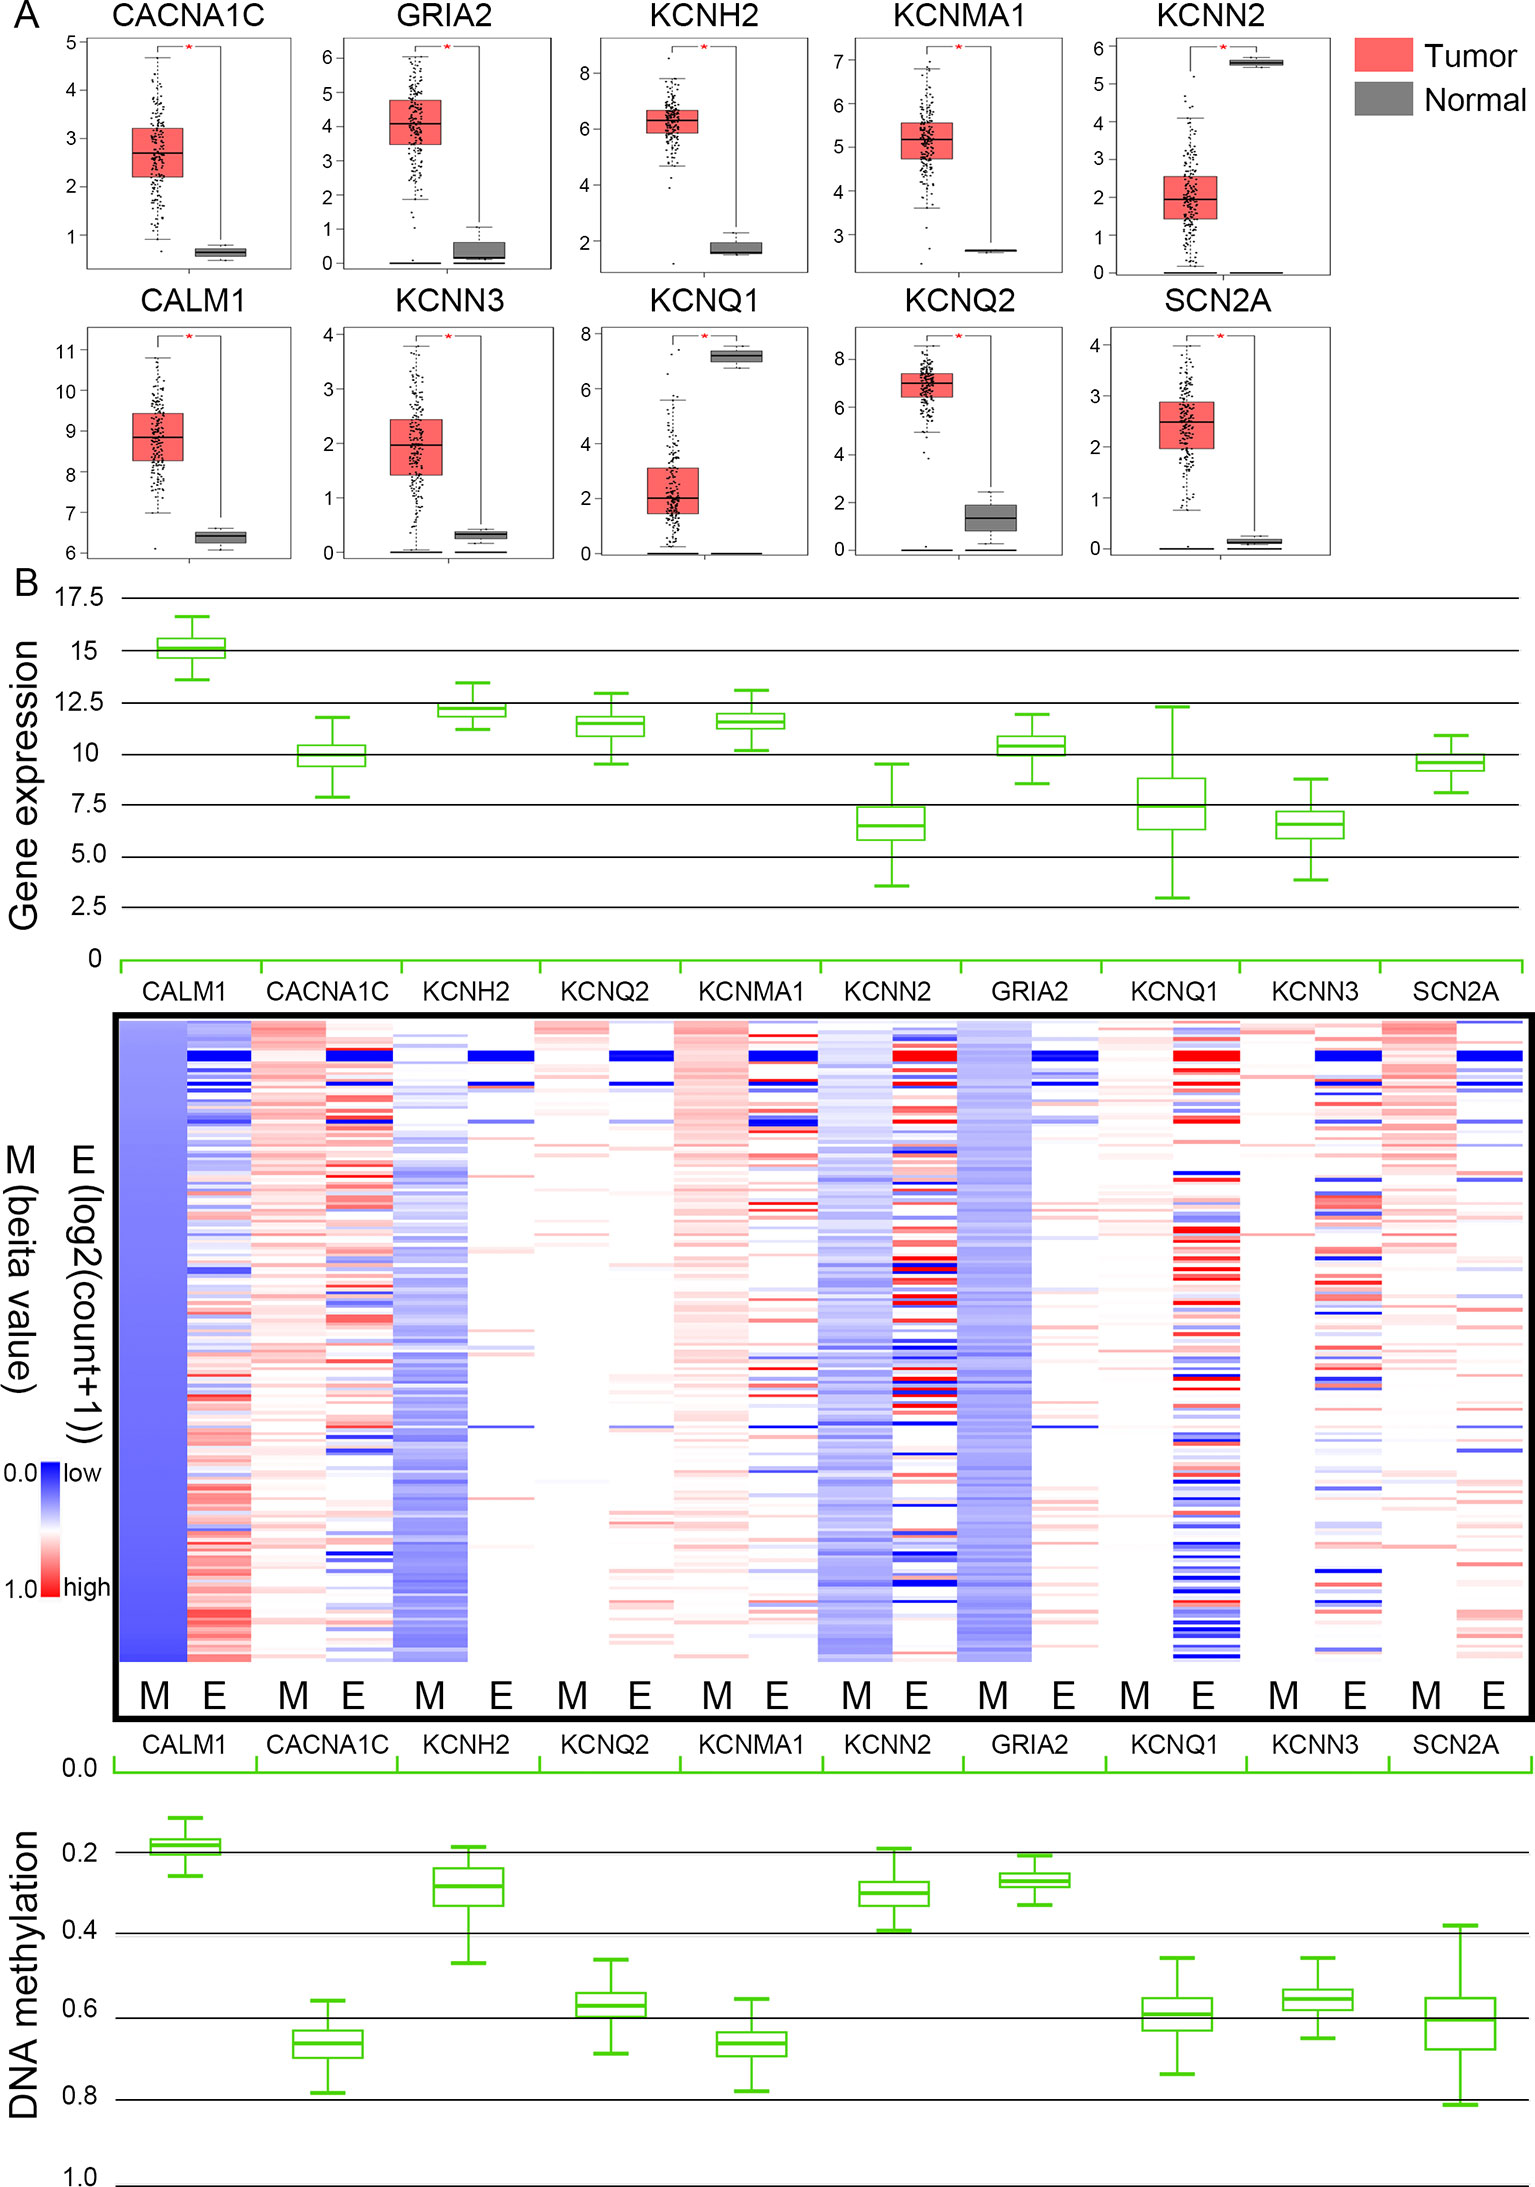
Figure 6 Expression and methylation of 10 hub genes in The Cancer Genome Atlas (TCGA) database. (A) Box plots showing 10 hub genes at the mRNA expression level using data from the TCGA database and the GEPIA tool. (B) Heat map showing the correlation between the mRNA expression and DNA methylation of the 10 hub genes with the UCSC Xena platform. M DNA methylation, E mRNA expression. Red, upregulated genes in E or hypermethylated genes in M; blue, downregulated genes in E or hypomethylated genes in M.
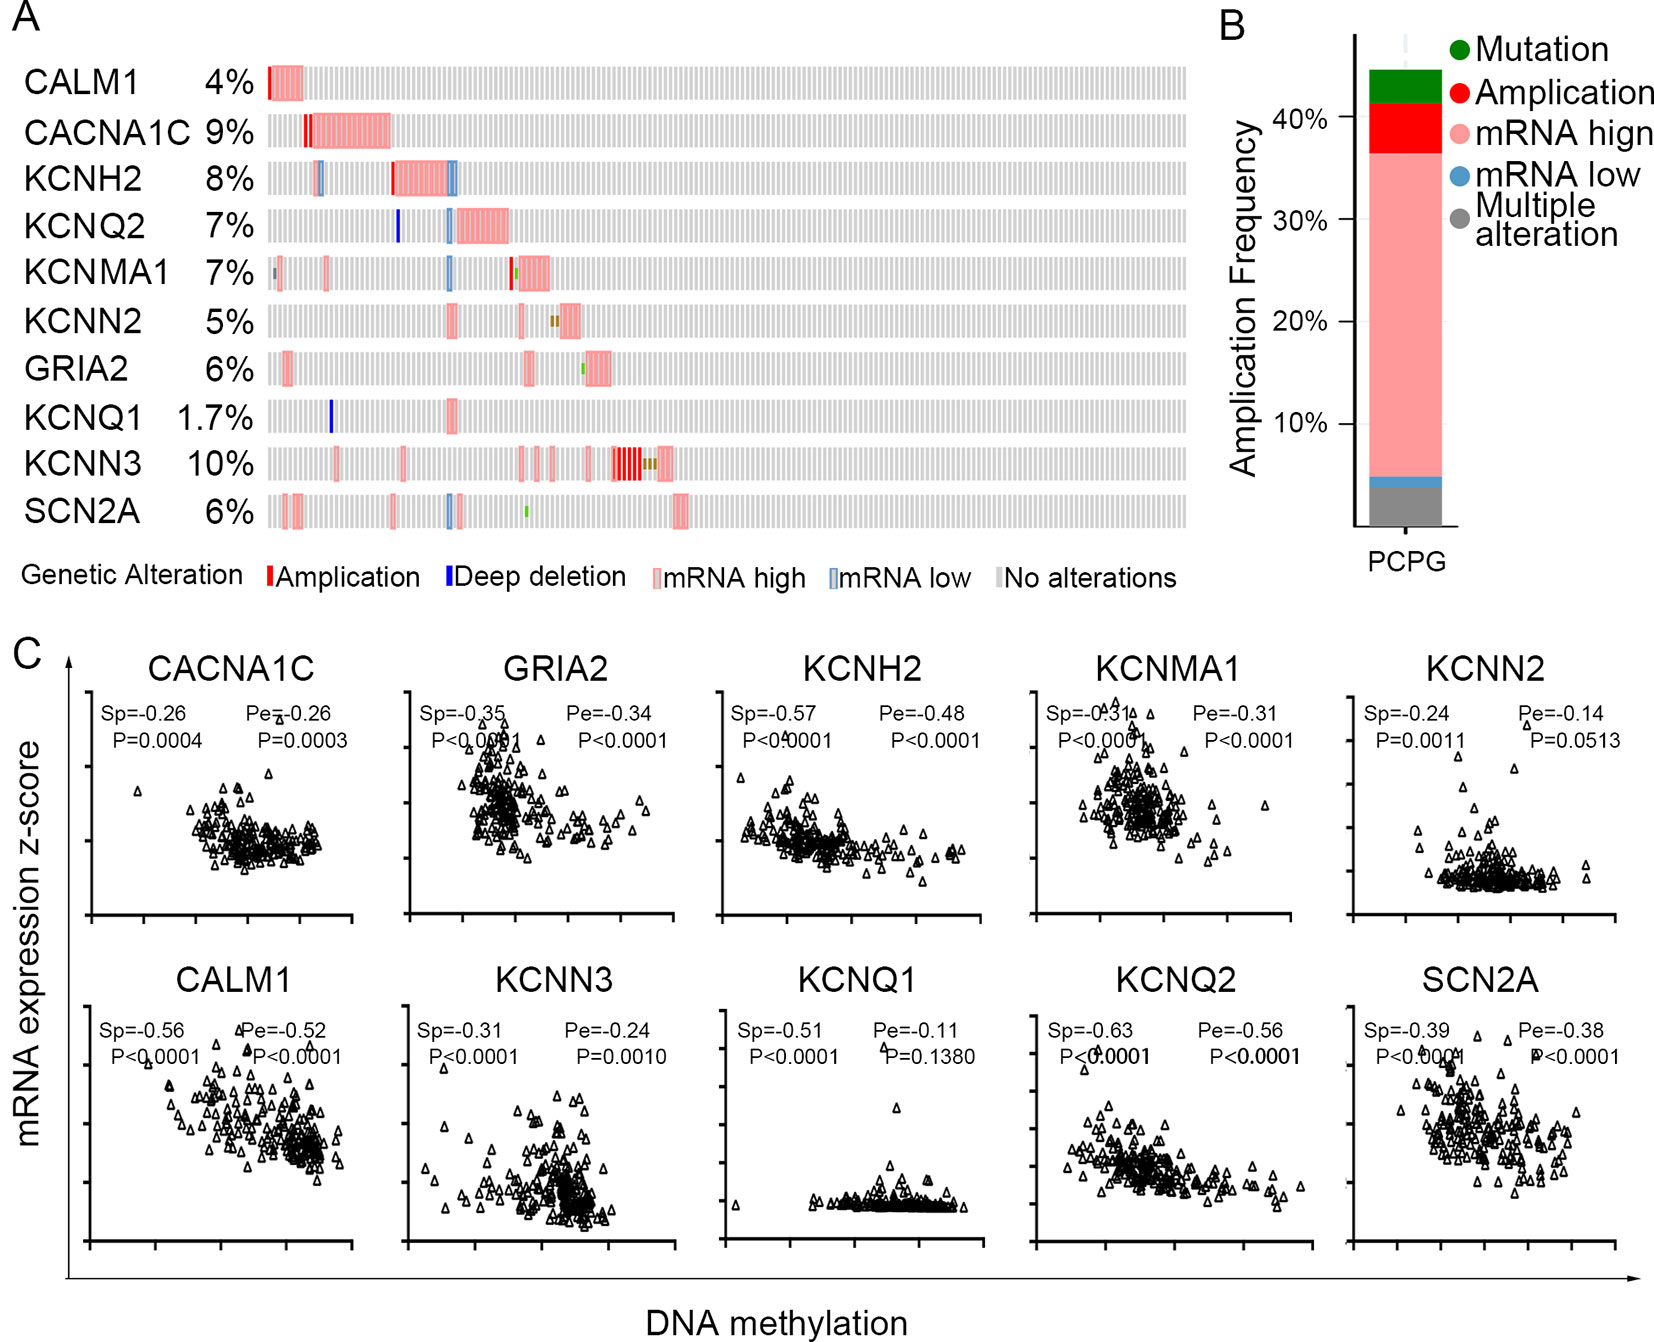
Figure 7 Use of the TCGA database to validate the 10 hub genes. (A) Genetic alterations in the 10 hub genes. (B) An overview of genetic alteration in the 10 hub genes. (C) Correlation between mRNA expression and DNA methylation for the 10 hub genes. Sp Spearman correlation analysis, Pe: Pearson’s correlation analysis.
The Clinical Value of Candidate Hub Genes in PHEO
To evaluate the prognostic value of the candidate hub genes, we performed survival analysis using the online Kaplan–Meier plotter. Figure 8A shows that the overexpression of KCNH2, KCNQ2, and KCNQ1 was significantly associated with a good prognosis; in contrast, the overexpression of SCN2A was significantly associated with a poor prognosis. Because of the overexpression of KCNH2 and KCNQ2 in PHEO when compared with normal tissues, we eliminated these genes in our subsequent analysis (Figure 8A). Immunohistochemical staining results from the Human Protein Atlas database indicated that KCNQ1 showed strong expression levels in normal adrenal tissue (Figure 8B); in contrast, SCN2A was only expressed in very small levels in normal adrenal tissue (Figure 8C). Therefore, we investigated KCNQ1 and SCN2A further to identify their potential therapeutic value. As depicted in Figure 9A, the expression levels of KCNQ1 in PHEO tissues were negatively associated (Spearman’s r = −0.46, P < 0.0001, and line regression coefficient = −0.4018, P < 0.0001) with the expression levels of SCN2A, suggesting that patients with PHEO may benefit from interventions targeting one of them. To this end, we established a relationship network (Figure 9B), including KCNQ1 and SCN2A, as well as the 50 most frequently altered neighboring genes. Furthermore, some cancer drugs targeted to KCNQ1 and SCN2A were included in the network, some of which are known to exhibit anti-PHEO effects, such as Propofol (Wang et al., 2018) and lidocaine (Tan et al., 2016).
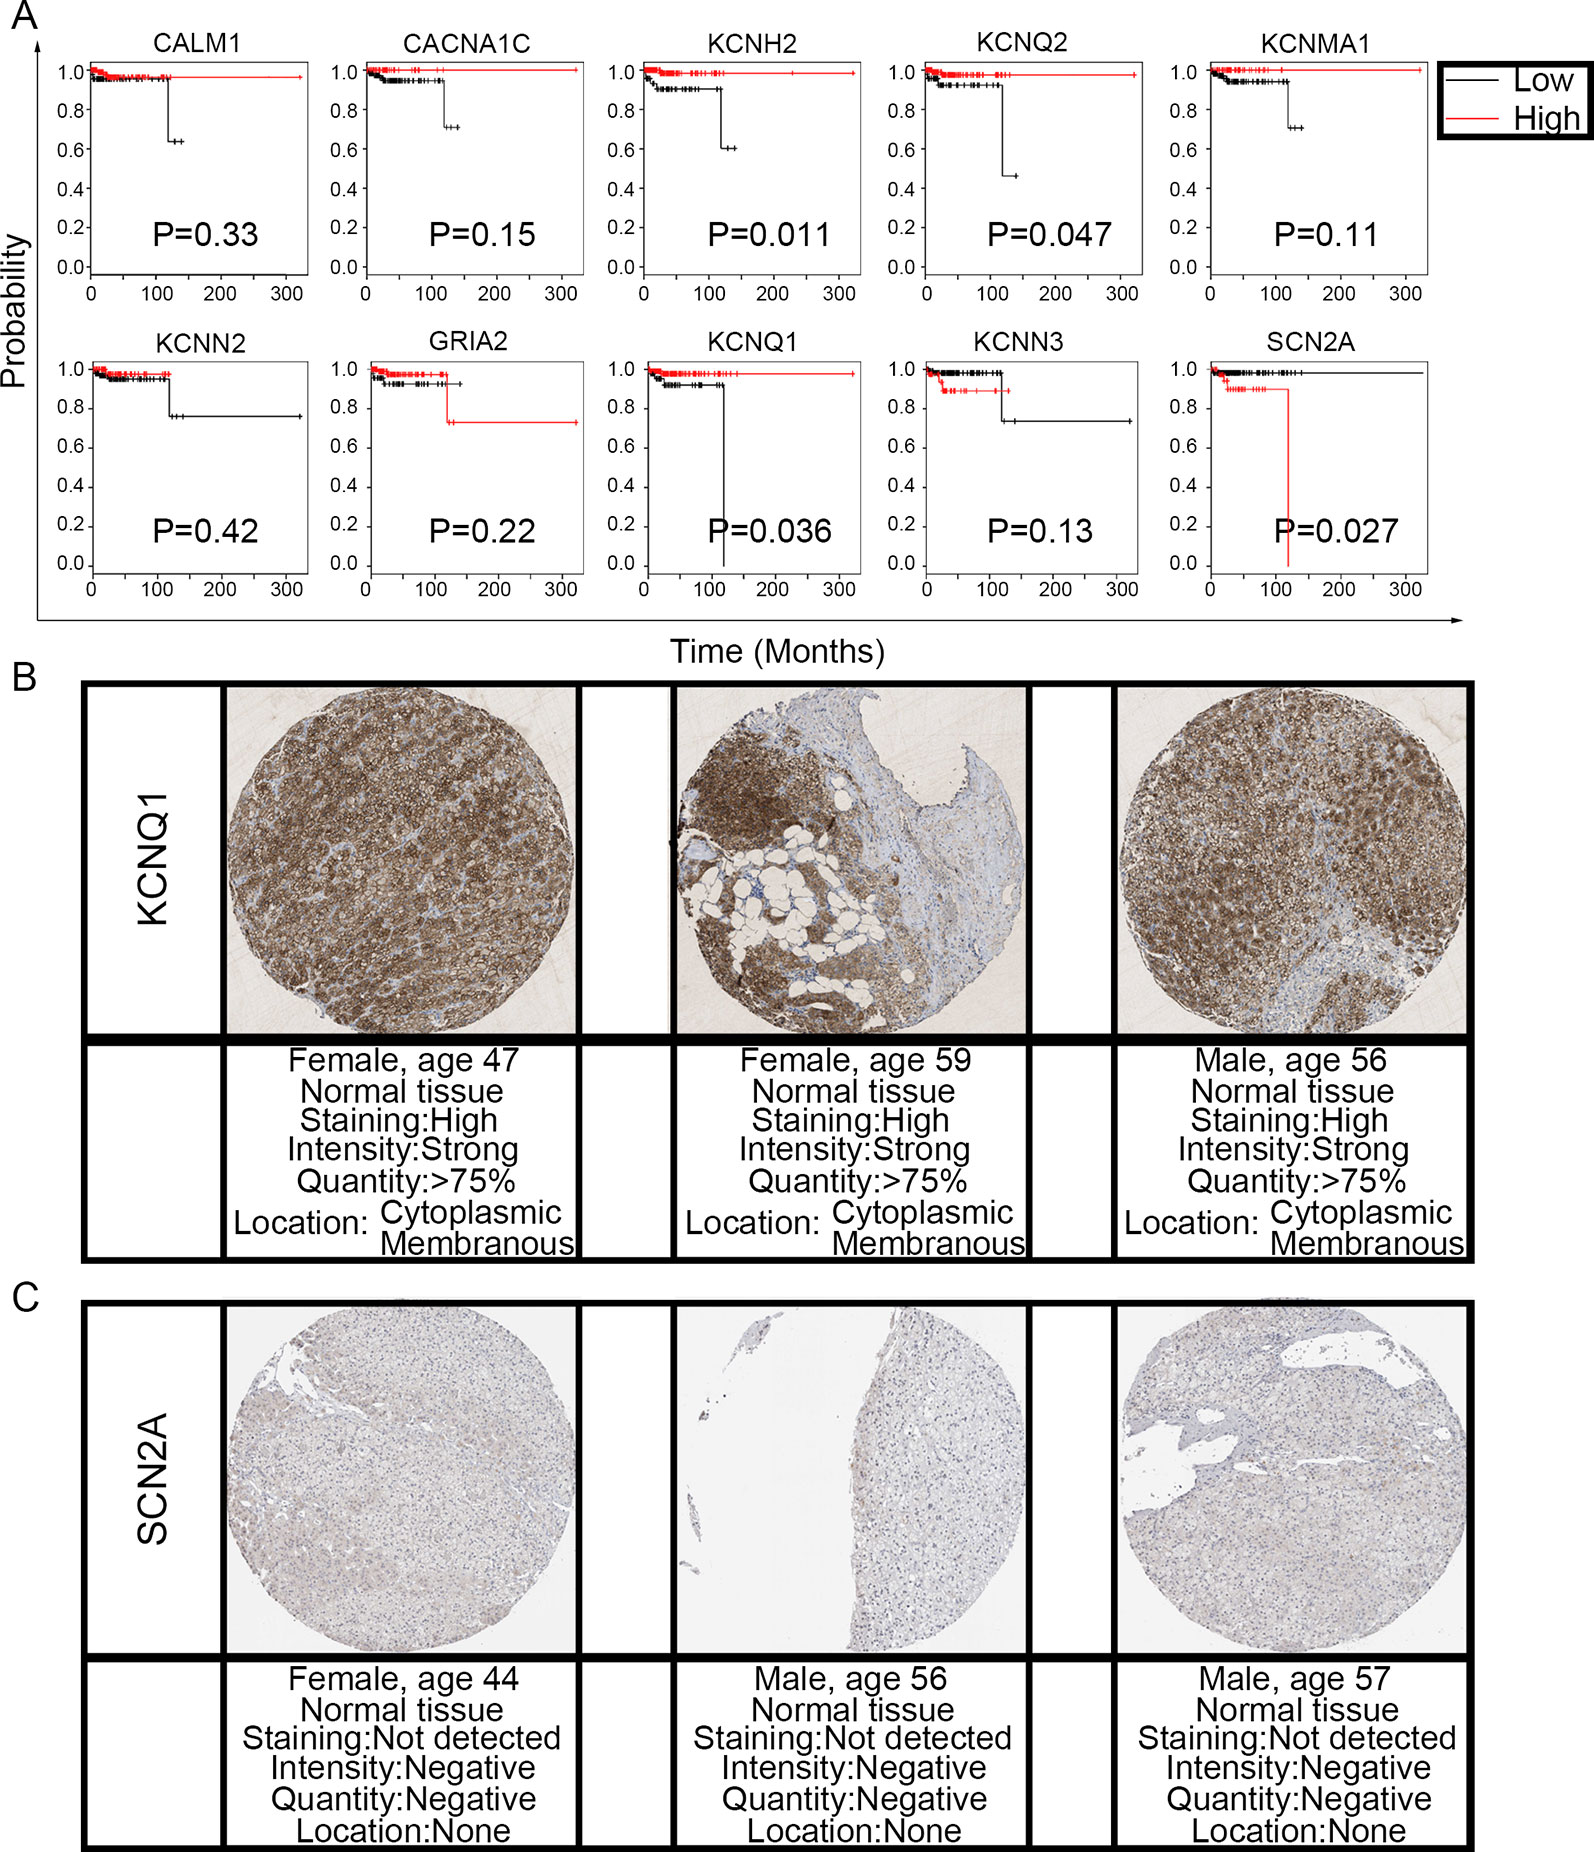
Figure 8 Prognostic value of the 10 hub genes and the expression levels of KCNQ1 and SCN2A in normal tissues. (A) Correlation between gene expression and prognosis. (B) KCNQ1 showed strong expression in normal adrenal tissue. (C) Normal adrenal tissue was negative for SCN2A immunostaining.
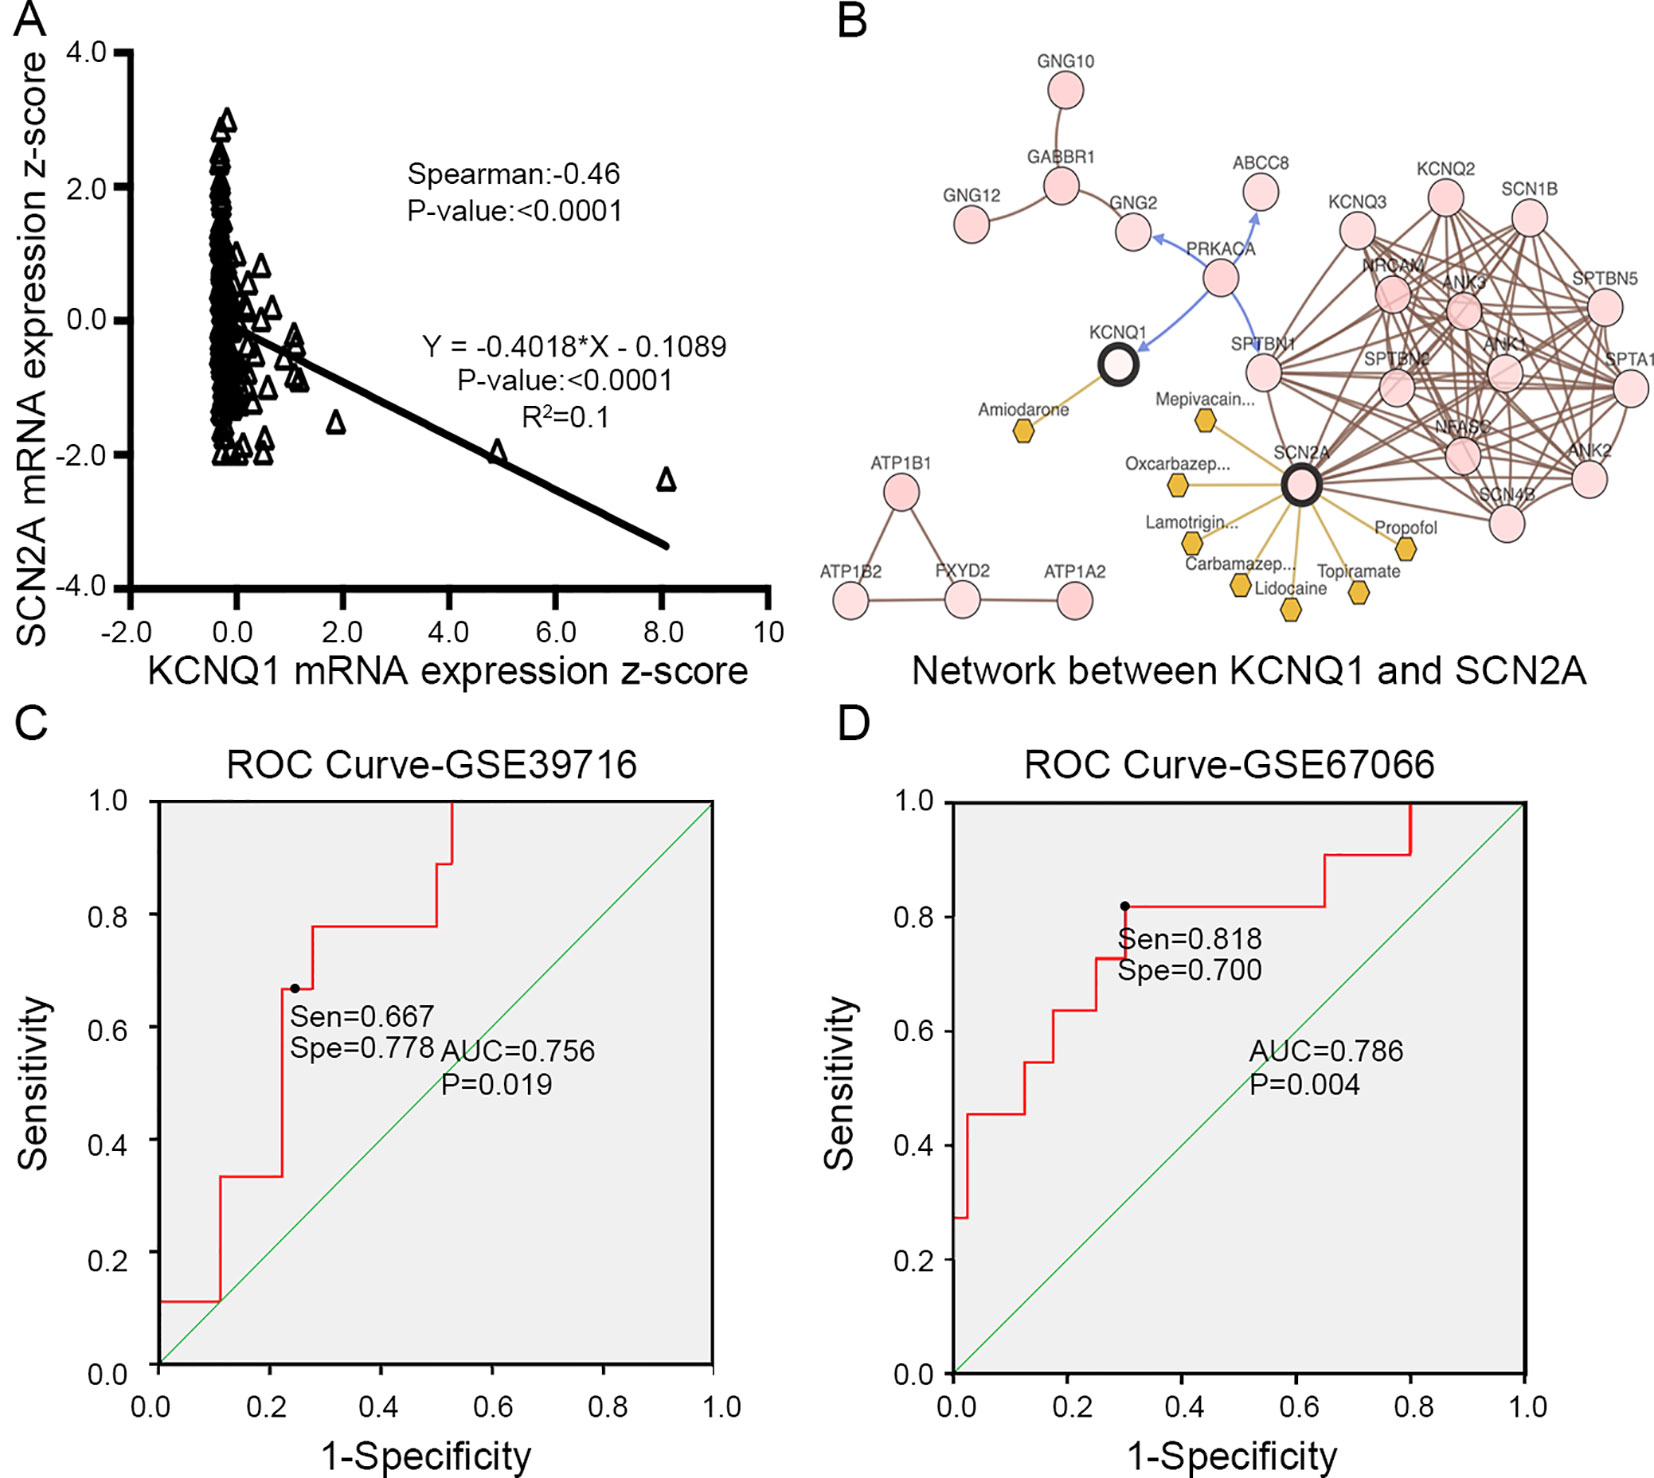
Figure 9 (A) Correlation between KCNQ1 and SCN2A expression levels by Spearman’s correlation and line regression analysis. (B) Interaction network between KCNQ1 and SCN2A, along with other cancer drugs targeted to KCNQ1 and SCN2A. (C) ROC analysis of GSE39716 to discriminate between benign and malignant PHEOs, showing the sensitivity and specificity of this test. (D) ROC analysis of GSE67066 to discriminate between benign and malignant PHEOs, showing the sensitivity and specificity of this test. Sen sensitivity, Spe specificity, AUC area under the curve, ROC receiver operating characteristic.
Due to the dilemma posed by the differential diagnosis of benign and malignant PHEOs, we performed logistic regression analysis. We attempted to improve efficiency of differential diagnosis by analyzing two gene expression datasets: GSE39716 (36 benign and nine malignant profiles) and GSE67066 (40 benign and 11 malignant profiles). Two variables, the expression levels of KCNQ1 and SCN2A, were entered into backwards stepwise logistic regression analysis (Table 1). KCNQ1 from the GSE39716 dataset showed the largest relative risk (RR) (50.562, P = 0.028), followed by SCN2A from the GSE67066 dataset (4.424, P = 0.009).
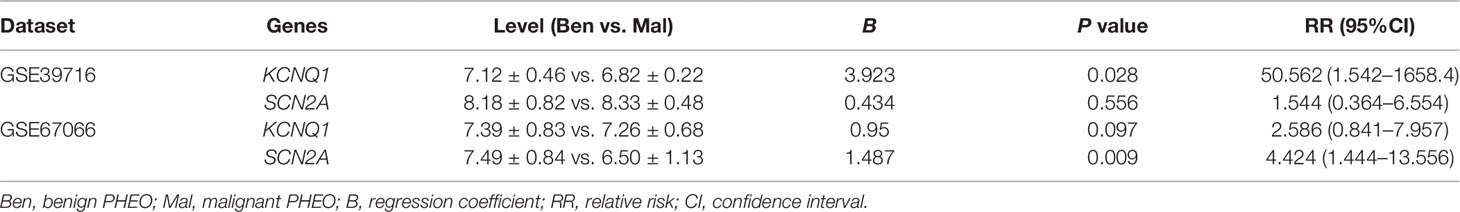
Table 1 Logistic regression analysis.
Then, we created a ROC curve to evaluate the value of this procedure for differential diagnosis. The area under the ROC curves for GSE39716 (Figure 9C) and GSE67066 (Figure 9D) were 0.756 [P = 0.019, 95% confidence interval (CI) = 0.606–0.906] and 0.786 (P = 0.004, 95% CI = 0.619–0.954), respectively. Corresponding sensitivity and specificity were 0.667 and 0.778, and 0.818 and 0.7, respectively, indicating that KCNQ1 and SCN2A may represent promising differential diagnostic biomarkers.
Finally, we found that there was significant difference between potassium concentration (3.98 ± 0.29 mmol/l vs. 3.63 ± 0.33 mmol/l, P < 0.0001) and sodium concentration (140.36 ± 2.26 mmol/l vs. 137.90 ± 3.66 mmol/l, P < 0.0001) when compared between pre-surgery and post-surgery day 1 (Figures 10A, B). However, the concentrations of potassium and sodium prior to surgery were not associated with tumor size (Figures 10C, D).
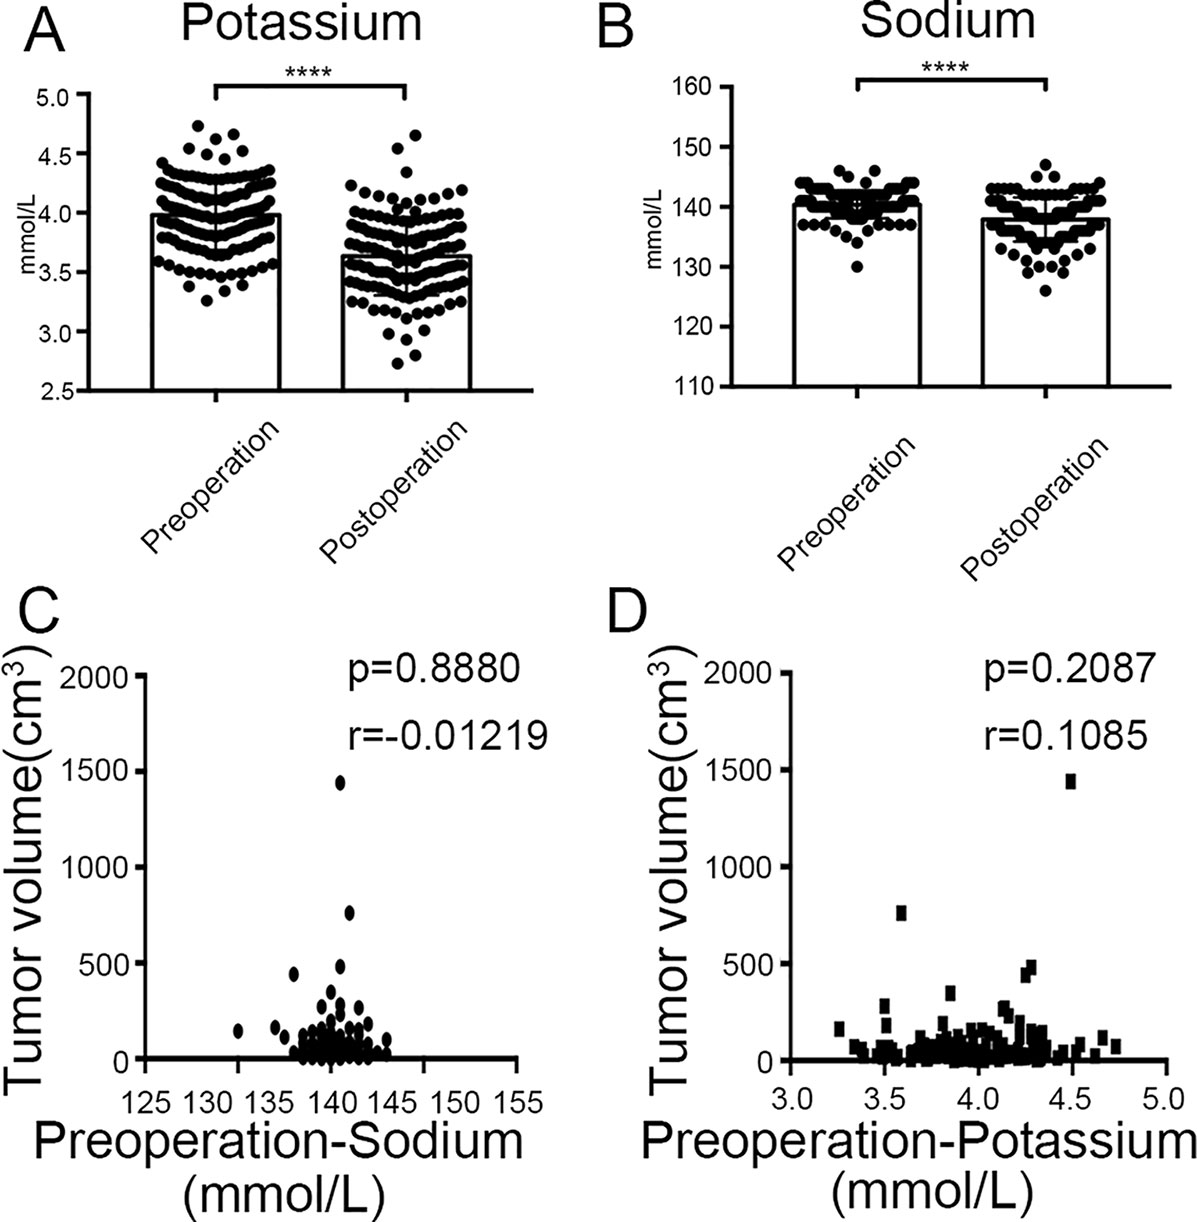
Figure 10 Clinical values of KCNQ1 and SCN2A. (A) Histogram showing a significant difference between the pre-surgical status and post-surgery day 1 for potassium concentration. ****P < 0.0001. (B) Histogram showing a significant difference between the pre-surgical status and post-surgery day 1 for sodium concentration. ****P < 0.0001. (C) Correlation between tumor volume and pre-surgical sodium concentration. (D) Correlation between tumor volume and pre-surgical potassium concentration.
Discussion
Despite significant effort, there is still little we can do to improve the prognosis of patients with PHEO, particularly in malignant cases. Consequently, there is a clear need to explore the specific pathogenesis of this disease and identify core genes or proteins that may facilitate clinical diagnosis and treatment. As a free and commonly used resource, the NCBI GEO database features a significant body of microarray profiling and next-generation sequencing for a variety of human tumors. Using this database, we downloaded gene expression microarray data (GSE19422) and gene methylation microarray data (GSE43293) for further analysis. In particular, we screened two of the most important hub genes, a downregulated hypermethylated gene (KCNQ1) and an upregulated hypomethylated gene (SCN2A) in PHEO tissues, both of which were further validated by the TCGA database. Functional enrichment results indicated that these hub genes played a role in the pathogenesis and progression of PHEO through certain pathways. We aimed to provide a new perspective for the pathogenesis, diagnosis, and treatment of PHEO, thus leading to improved patient outcomes.
Using R software, we identified a total of 560 aberrantly methylated DEGs. GO enrichment analysis further indicated that aberrantly methylated DEGs were predominantly involved in cancer-related biological processes, such as the positive regulation of GTPase activity, homophilic cell adhesion via plasma membrane adhesion molecules, axonal guidance, and signal transduction. By cycling between an inactive GDP-bound and an active GTP-bound state, the family of GTPases can act as molecular switches and are involved in a range of cellular processes, including cell proliferation, apoptosis, and migration (Olson et al., 1995; Vega and Ridley, 2008; Cherfils and Zeghouf, 2013; Croise et al., 2014; Mack and Georgiou, 2014). The relative effects of GTPases depend on whether they exert action during the initiation or progression of tumors (Ellenbroek and Collard, 2007; Orgaz et al., 2014). The most commonly investigated members of the family of GTPases are RhoA, Cdc42, and Rac1. In a previous study, Croise et al. (2016) reported that PHEO was associated with the reduced activity of Cdc42 and Rac1, and the reduced expression of two Rho-GEFs, FARP1 and ARHGEF1. Our own previous research demonstrated that it inhibited PHEO progression that promotes adhesion molecules, E-cadherin and β-catenin, translocation from cytoplasm to membrane (Lin et al., 2019).
Visualization of the PPI network using Cytoscape software identified a total of 550 nodes and 1,463 edges, thus indicating that almost all of the aberrantly methylated DEGs interacted with each other, either directly or indirectly. These data imply that by manipulating the expression of core genes, it may be possible to interfere with the initiation and progression of PHEO. To this end, we used the cytoHubba plugin to identify the top 10 key genes: CALM1, CACNA1C, KCNH2, KCNQ2, KCNMA1, KCNN2, GRIA2, KCNQ1, KCNN3, and SCN2A. Similar to the GEO database, there were similar patterns of expression and methylation for these 10 core genes in PHEO when compared with normal tissues in the TCGA database, such as the downregulated and hypermethylated genes KCNN2 and KCNQ1. In total, 44.57% of the 184 PHEO tissues showed genetic alterations in KCNN2 and KCNQ1. These results demonstrated that these 10 core genes may play important roles in the initiation and progression of PHEO. However, only two core genes, KCNQ1 and SCN2A, showed any potential prognostic value when we considered their expression patterns in PHEO.
The KCNQ1 gene is located on chromosome 11 and has 16 exons and 15 introns. This gene encodes for the pore-forming α-subunit of a voltage-gated potassium channel that allows potassium to flow out of the cell membrane following depolarization. Under physiological conditions, this process maintains homeostasis with regards to ion concentration, cell volume, and pH (Felipe et al., 2006; Huang and Jan, 2014). An increasing body of evidence now supports the essential role of potassium channels in the initiation and progression of tumors, particularly in colorectal cancer (den Uil et al., 2016; Rapetti-Mauss et al., 2017), hepatocellular carcinoma (Fan et al., 2018), and gastric cancer (Liu et al., 2015). Research carried out by Rapetti-Mauss et al. indicated that KCNQ1 is a target gene for the Wnt/β-catenin pathway and that the loss of KCNQ1 promoted the disruption of cell–cell contact, thus contributing to EMT (epithelial–mesenchymal transition), cell proliferation, and invasion in colorectal cancer (Rapetti-Mauss et al., 2017). In a previous study, we demonstrated that ApoG2, a small molecular inhibitor, could inhibit PHEO cell migration and invasion by promoting the translocation of E-cadherin and β-catenin from the cytoplasm to the membrane dependent and that this process depended on downregulation of the PI3K/AKT pathway. This suggested that the regulation of β-catenin by KCNQ1 may play a similar role in the metastasis of PHEO (Lin et al., 2019). Although the rate of KCNQ1 mutation was only 1.7% (3/179), the expression level of KCNQ1 was closely associated with the prognosis of patients with PHEO. Based on our current findings, we speculate that the methylation rate of KCNQ1 might be more relevant than the rate of DNA mutation; this requires verification by further research.
In addition, we hypothesize that KCNQ1, as a potassium channel gene, could also influence the levels of potassium. As expected, analysis of our clinical data showed a significant difference for potassium concentration when compared between the pre-surgical state and post-surgery day 1. However, it remains unknown as to whether the concentration of potassium could serve as a prognostic biomarker or not. This is because the levels of potassium can be influenced by a range of factors, including, but not limited to, the progression of PHEO. Furthermore, it is not clear whether cutoff points for potassium concentration would be instructive in clinical practice. These points need to be addressed in future research.
Voltage-gated sodium channels are transmembrane glycoprotein complexes composed of a large α-subunit with 24 transmembrane domains and one or more regulatory β-subunits. The SCN2A gene is located on chromosome 2 and has 31 exons that encode one member of the sodium channel α-subunit gene family. Several previous publications have reported an association between SCN2A gene mutation and a variety of seizure types (Liu et al., 2015). However, mutation of the gene has not been associated with pathogenesis of tumors, including PHEO. However, analysis of our clinical data revealed a significant difference for sodium concentration when compared between the pre-surgical state and post-surgery day 1, thus suggesting that the pre-surgical concentration was influenced by the tumor. Furthermore, the rate of mutation in the SCN2A gene was as high as 6% (10/179) and its expression levels were closely associated with the prognosis of patients with PHEO. Consequently, the biological role and clinical value of SCN2A in PHEO clearly warrant further investigation.
Conclusion
In summary, we used two microarray datasets (GSE19422 and GSE43293) to identify a number of important DEGs showing aberrant methylation in PHEO-related pathways. These findings may help us to develop a better understanding of how genetic alterations are involved in the initiation and progression of PHEO and identify which genes and pathways we should investigate further. Most importantly, we showed that two of the DEGs showing aberrant methylation (KCNQ1 and SCN2A) represent potential biomarkers for the prognosis of patients with PHEO and may help in differential diagnosis between benign and malignant tissues. Consequently, KCNQ1 and SCN2A represent valuable targets for the diagnosis and treatment of PHEO.
Data Availability Statement
Publicly available datasets were analyzed in this study. This data can be found here: GSE19422, GSE43293, GSE39716, GSE67066.
Author Contributions
DL, JL, and XL contributed equally to this work and should be considered as co-first authors. DL conceived and designed the study. DL and JL analyzed the data. DL and XL prepared the figures and wrote the text for the main manuscript. JZ and PL provided technical guidance. ZM and LZ revised the manuscript. YZ and YL provided funding support. All authors reviewed the manuscript and approved the final version for publication.
Funding
This study was supported by the National Natural Science Foundation of China (reference number 81272936) and the Shanghai Nature Science Foundation (no. 17ZR1417300).
Conflict of Interest
The authors declare that the research was conducted in the absence of any commercial or financial relationships that could be construed as a potential conflict of interest.
Supplementary Material
The Supplementary Material for this article can be found online at: https://www.frontiersin.org/articles/10.3389/fgene.2019.01181/full#supplementary-material
Supplementary Table 1 | Biochemical level of patients.
References
Astuti, D., Latif, F., Dallol, A., Dahia, P. L., Douglas, F., George, E. (2001). Gene mutations in the succinate dehydrogenase subunit SDHB cause susceptibility to familial pheochromocytoma and to familial paraganglioma. Am. J. Hum. Genet. 69, 49–54. doi: 10.1086/321282
Baysal, B. E., Ferrell, R. E., Willett-Brozick, J. E., Lawrence, E. C., Myssiorek, D., Bosch, A. (2000). Mutations in SDHD, a mitochondrial complex II gene, in hereditary paraganglioma. Science 287, 848–851. doi: 10.1126/science.287.5454.848
Burnichon, N., Briere, J. J., Libe, R., Vescovo, L., Riviere, J., Tissier, F. (2010). SDHA is a tumor suppressor gene causing paraganglioma. Hum. Mol. Genet. 19, 3011–3020. doi: 10.1093/hmg/ddq206
Castro-Vega, L. J., Buffet, A., De Cubas, A. A., Cascon, A., Menara, M., Khalifa, E. (2014). Germline mutations in FH confer predisposition to malignant pheochromocytomas and paragangliomas. Hum. Mol. Genet. 23, 2440–2446. doi: 10.1093/hmg/ddt639
Cherfils, J., Zeghouf, M. (2013). Regulation of small GTPases by GEFs, GAPs, and GDIs. Physiol. Rev. 93, 269–309. doi: 10.1152/physrev.00003.2012
Comino-Mendez, I., Gracia-Aznarez, F. J., Schiavi, F., Landa, I., Leandro-Garcia, L. J., Leton, R. (2011). Exome sequencing identifies MAX mutations as a cause of hereditary pheochromocytoma. Nat. Genet. 43, 663–667. doi: 10.1038/ng.861
Consortium, G. O. (2006). The Gene Ontology (GO) project in 2006. Nucleic Acids Res. 34, D322–D326. doi: 10.1093/nar/gkj021
Croise, P., Estay-Ahumada, C., Gasman, S., Ory, S. (2014). Rho GTPases, phosphoinositides, and actin: a tripartite framework for efficient vesicular trafficking. Small GTPases 5, e29469. doi: 10.4161/sgtp.29469
Croise, P., Houy, S., Gand, M., Lanoix, J., Calco, V., Toth, P. (2016). Cdc42 and Rac1 activity is reduced in human pheochromocytoma and correlates with FARP1 and ARHGEF1 expression. Endocr. Relat. Cancer 23, 281–293. doi: 10.1530/erc-15-0502
den Uil, S. H., Coupe, V. M., Linnekamp, J. F., van den Broek, E., Goos, J. A., Delis-van Diemen, P. M. (2016). Loss of KCNQ1 expression in stage II and stage III colon cancer is a strong prognostic factor for disease recurrence. Br. J. Cancer 115, 1565–1574. doi: 10.1038/bjc.2016.376
Edstrom Elder, E., Hjelm Skog, A. L., Hoog, A., Hamberger, B. (2003). The management of benign and malignant pheochromocytoma and abdominal paraganglioma. Eur. J. Surg. Oncol. 29, 278–283. doi: 10.1053/ejso.2002.1413
Ellenbroek, S. I., Collard, J. G. (2007). Rho GTPases: functions and association with cancer. Clin. Exp. Metastasis 24, 657–672. doi: 10.1007/s10585-007-9119-1
Else, T., Greenberg, S., Fishbein, L. (1993). Hereditary Paraganglioma-Pheochromocytoma Syndromes. In: GeneReviews ((R)). Seattle (WA): University of Washington, Seattle.
Fan, H., Zhang, M., Liu, W. (2018). Hypermethylated KCNQ1 acts as a tumor suppressor in hepatocellular carcinoma. Biochem. Biophys. Res. Commun. 503, 3100–3107. doi: 10.1016/j.bbrc.2018.08.099
Felipe, A., Vicente, R., Villalonga, N., Roura-Ferrer, M., Martinez-Marmol, R., Sole, L. (2006). Potassium channels: new targets in cancer therapy. Cancer Detect Prev. 30, 375–385. doi: 10.1016/j.cdp.2006.06.002
Fishbein, L., Nathanson, K. L. (2012). Pheochromocytoma and paraganglioma: understanding the complexities of the genetic background. Cancer Genet. 205, 1–11. doi: 10.1016/j.cancergen.2012.01.009
Haffner, M. C., Esopi, D. M., Chaux, A., Gurel, M., Ghosh, S., Vaghasia, A. M. (2017). AIM1 is an actin-binding protein that suppresses cell migration and micrometastatic dissemination. Nat. Commun. 8, 142. doi: 10.1038/s41467-017-00084-8
Hao, H. X., Khalimonchuk, O., Schraders, M., Dephoure, N., Bayley, J. P., Kunst, H. (2009). SDH5, a gene required for flavination of succinate dehydrogenase, is mutated in paraganglioma. Science 325, 1139–1142. doi: 10.1126/science.1175689
Huang, X., Jan, L. Y. (2014). Targeting potassium channels in cancer. J. Cell Biol. 206, 151–162. doi: 10.1083/jcb.201404136
Huang da, W., Sherman, B. T., Lempicki, R. A. (2009). Systematic and integrative analysis of large gene lists using DAVID bioinformatics resources. Nat. Protoc. 4, 44–57. doi: 10.1038/nprot.2008.211
Jain, A., Baracco, R., Kapur, G. (2019). Pheochromocytoma and paraganglioma-an update on diagnosis, evaluation, and management. Pediatr. Nephrol. doi: 10.1007/s00467-018-4181-2
Karagiannis, A., Mikhailidis, D. P., Athyros, V. G., Harsoulis, F. (2007). Pheochromocytoma: an update on genetics and management. Endocr. Relat. Cancer 14, 935–956. doi: 10.1677/erc-07-0142
Kopf, D., Goretzki, P. E., Lehnert, H. (2001). Clinical management of malignant adrenal tumors. J. Cancer Res. Clin. Oncol. 127, 143–155. doi: 10.1007/s004320000170
Latif, F., Tory, K., Gnarra, J., Yao, M., Duh, F. M., Orcutt, M. L. (1993). Identification of the von Hippel-Lindau disease tumor suppressor gene. Science 260, 1317–1320. doi: 10.1126/science.8493574
Lefebvre, M., Foulkes, W. D. (2014). Pheochromocytoma and paraganglioma syndromes: genetics and management update. Curr. Oncol. 21, e8–e17. doi: 10.3747/co.21.1579
Lenders, J. W. M., Eisenhofer, G. (2017). Update on modern management of pheochromocytoma and paraganglioma. Endocrinol. Metab. (Seoul) 32, 152–161. doi: 10.3803/EnM.2017.32.2.152
Lenders, J. W., Duh, Q. Y., Eisenhofer, G., Gimenez-Roqueplo, A. P., Grebe, S. K., Murad, M. H. (2014). Pheochromocytoma and paraganglioma: an endocrine society clinical practice guideline. J. Clin. Endocrinol. Metab. 99, 1915–1942. doi: 10.1210/jc.2014-1498
Lin, D., Wang, X., Li, X., Meng, L., Xu, F., Xu, Y. (2019). Apogossypolone acts as a metastasis inhibitor via up-regulation of E-cadherin dependent on the GSK-3/AKT complex. Am. J. Transl. Res. 11, 218–232.
Liu, X., Chen, Z., Zhao, X., Huang, M., Wang, C., Peng, W. (2015). Effects of IGF2BP2, KCNQ1 and GCKR polymorphisms on clinical outcome in metastatic gastric cancer treated with EOF regimen. Pharmacogenomics 16, 959–970. doi: 10.2217/pgs.15.49
Mack, N. A., Georgiou, M. (2014). The interdependence of the Rho GTPases and apicobasal cell polarity. Small GTPases 5, 10. doi: 10.4161/21541248.2014.973768
Mulligan, L. M., Kwok, J. B., Healey, C. S., Elsdon, M. J., Eng, C., Gardner, E. (1993). Germ-line mutations of the RET proto-oncogene in multiple endocrine neoplasia type 2A. Nature 363, 458–460. doi: 10.1038/363458a0
Niemann, S., Muller, U. (2000). Mutations in SDHC cause autosomal dominant paraganglioma, type 3. Nat. Genet. 26, 268–270. doi: 10.1038/81551
Olson, M. F., Ashworth, A., Hall, A. (1995). An essential role for Rho, Rac, and Cdc42 GTPases in cell cycle progression through G1. Science 269, 1270–1272. doi: 10.1126/science.7652575
Orgaz, J. L., Herraiz, C., Sanz-Moreno, V. (2014). Rho GTPases modulate malignant transformation of tumor cells. Small GTPases 5, e29019. doi: 10.4161/sgtp.29019
Pacak, K., Eisenhofer, G., Ahlman, H., Bornstein, S. R., Gimenez-Roqueplo, A. P., Grossman, A. B. (2007). Pheochromocytoma: recommendations for clinical practice from the First International Symposium. Nat. Clin. Pract. Endocrinol. Metab. 3, 92–102. doi: 10.1038/ncpendmet0396 October 2005.
Park, H. U., Suy, S., Danner, M., Dailey, V., Zhang, Y., Li, H. (2009). AMP-activated protein kinase promotes human prostate cancer cell growth and survival. Mol. Cancer Ther. 8, 733–741. doi: 10.1158/1535-7163.Mct-08-0631
Prejbisz, A., Lenders, J. W., Eisenhofer, G., Januszewicz, A. (2013). Mortality associated with phaeochromocytoma. Horm. Metab. Res. 45, 154–158. doi: 10.1055/s-0032-1331217
Qin, Y., Yao, L., King, E. E., Buddavarapu, K., Lenci, R. E., Chocron, E. S. (2010). Germline mutations in TMEM127 confer susceptibility to pheochromocytoma. Nat. Genet. 42, 229–233. doi: 10.1038/ng.533
Rapetti-Mauss, R., Bustos, V., Thomas, W., McBryan, J., Harvey, H., Lajczak, N. (2017). Bidirectional KCNQ1:beta-catenin interaction drives colorectal cancer cell differentiation. Proc. Natl. Acad. Sci. U. S. A. 114, 4159–4164. doi: 10.1073/pnas.1702913114
Schurmeyer, T., Dralle, H., Schuppert, F., von zur Muhlen, A. (1988). [Preoperative diagnosis of suspected pheochromocytoma–retrospective assessment of diagnostic criteria]. Acta Med. Austriaca 15, 106–108.
Tan, Y., Wang, Q., Zhao, B., She, Y., Bi, X. (2016). GNB2 is a mediator of lidocaine-induced apoptosis in rat pheochromocytoma PC12 cells. Neurotoxicology 54, 53–64. doi: 10.1016/j.neuro.2016.03.015
van Hulsteijn, L. T., Niemeijer, N. D., Dekkers, O. M., Corssmit, E. P. (2014). (131)I-MIBG therapy for malignant paraganglioma and phaeochromocytoma: systematic review and meta-analysis. Clin. Endocrinol. (Oxf) 80, 487–501. doi: 10.1111/cen.12341
Vega, F. M., Ridley, A. J. (2008). Rho GTPases in cancer cell biology. FEBS Lett. 582, 2093–2101. doi: 10.1016/j.febslet.2008.04.039
Vogel, J., Atanacio, A. S., Prodanov, T., Turkbey, B. I., Adams, K., Martucci, V. (2014). External beam radiation therapy in treatment of malignant pheochromocytoma and paraganglioma. Front. Oncol. 4, 166. doi: 10.3389/fonc.2014.00166
Wallace, M. R., Marchuk, D. A., Andersen, L. B., Letcher, R., Odeh, H. M., Saulino, A. M. (1990). Type 1 neurofibromatosis gene: identification of a large transcript disrupted in three NF1 patients. Science 249, 181–186. doi: 10.1126/science.2134734
Walther, M. M., Keiser, H. R., Linehan, W. M. (1999). Pheochromocytoma: evaluation, diagnosis, and treatment. World J. Urol. 17, 35–39.doi: 10.1007/s003450050102
Wang, H., Zhang, S., Zhang, A., Yan, C. (2018). Propofol prevents the progression of malignant pheochromocytoma in vitro and in vivo. DNA Cell Biol. 37, 308–315. doi: 10.1089/dna.2017.3972
Keywords: pheochromocytoma, bioinformatics, expression, methylation, KCNQ1, SCN2A
Citation: Lin D, Lin J, Li X, Zhang J, Lai P, Mao Z, Zhang L, Zhu Y and Liu Y (2019) The Identification of Differentially Expressed Genes Showing Aberrant Methylation Patterns in Pheochromocytoma by Integrated Bioinformatics Analysis. Front. Genet. 10:1181. doi: 10.3389/fgene.2019.01181
Received: 31 July 2019; Accepted: 24 October 2019;
Published: 15 November 2019.
Edited by:
Mattia Pelizzola, Italian Institute of Technology (IIT), ItalyReviewed by:
Nitish Kumar Mishra, University of Nebraska Medical Center, United StatesAndrew Dellinger, Elon University, United States
Copyright © 2019 Lin, Lin, Li, Zhang, Lai, Mao, Zhang, Zhu and Liu. This is an open-access article distributed under the terms of the Creative Commons Attribution License (CC BY). The use, distribution or reproduction in other forums is permitted, provided the original author(s) and the copyright owner(s) are credited and that the original publication in this journal is cited, in accordance with accepted academic practice. No use, distribution or reproduction is permitted which does not comply with these terms.
*Correspondence: Yu Zhu, emh1eXVydWlqaW5AMTYzLmNvbQ==; Yujun Liu, bGl1eWoxMjAxOEAxNjMuY29t
†These authors have contributed equally to this work and share first authorship