
95% of researchers rate our articles as excellent or good
Learn more about the work of our research integrity team to safeguard the quality of each article we publish.
Find out more
ORIGINAL RESEARCH article
Front. Genet. , 17 May 2019
Sec. Computational Genomics
Volume 10 - 2019 | https://doi.org/10.3389/fgene.2019.00468
This article is part of the Research Topic Integration of Multisource Heterogenous Omics Information in Cancer View all 12 articles
 Christina Y. Yu1,2
 Shunian Xiang3,4
 Zhi Huang2,5
 Travis S. Johnson1,2
 Xiaohui Zhan2,4
 Zhi Han2,6
 Mohammad Abu Zaid2Kun Huang2,6*
Multiple myeloma (MM) has two clinical precursor stages of disease: monoclonal gammopathy of undetermined significance (MGUS) and smoldering multiple myeloma (SMM). However, the mechanism of progression is not well understood. Because gene co-expression network analysis is a well-known method for discovering new gene functions and regulatory relationships, we utilized this framework to conduct differential co-expression analysis to identify interesting transcription factors (TFs) in two publicly available datasets. We then used copy number variation (CNV) data from a third public dataset to validate these TFs. First, we identified co-expressed gene modules in two publicly available datasets each containing three conditions: normal, MGUS, and SMM. These modules were assessed for condition-specific gene expression, and then enrichment analysis was conducted on condition-specific modules to identify their biological function and upstream TFs. TFs were assessed for differential gene expression between normal and MM precursors, then validated with CNV analysis to identify candidate genes. Functional enrichment analysis reaffirmed known functional categories in MM pathology, the main one relating to immune function. Enrichment analysis revealed a handful of differentially expressed TFs between normal and either MGUS or SMM in gene expression and/or CNV. Overall, we identified four genes of interest (MAX, TCF4, ZNF148, and ZNF281) that aid in our understanding of MM initiation and progression.
Multiple myeloma (MM) is a B-cell malignancy caused by the proliferation of aberrant clonal plasma cells that secrete monoclonal immunoglobulin protein, also known as M protein. MM is consistently preceded by a premalignant phase called monoclonal gammopathy of undetermined significance (MGUS) and clinically defined by thresholds in serum M protein and clonal bone marrow plasma cell content with the absence of hypercalcemia, renal insufficiency, anemia, and bone lesions (known as CRAB features) or amyloidosis relating to the plasma cell proliferative disorder (Landgren et al., 2009; Rajkumar et al., 2014). The risk of developing MGUS is low, thought to be around 3.2% of individuals aged 50 or older and increases to 5.3% for those aged 70 or older (Kyle et al., 2006). An individual with MGUS lives with an increased risk of developing MM at a rate of 1% per year (Kyle et al., 2002). Additionally, there is an intermediate precursor between MGUS and MM known as smoldering multiple myeloma (SMM). This phase is clinically defined by a higher threshold in M-protein or clonal bone marrow plasma cell content with the continued absence of CRAB features (Rajkumar et al., 2014). The risk of progression for SMM increases at a variable rate, as 10% per year for the first 5 years, 3% per year for the next 5 years, and 1% per year in the following 10 years (Kyle et al., 2007). Understanding the biological basis of MM progression from these precursors is still unclear.
Gene expression profiling studies have been applied to MM to identify subgroups and biomarkers in order to better understand the molecular basis of disease, improve prognostic models, and characterize features associated with a high risk of disease progression (Davies et al., 2003; Zhan et al., 2006; Chng et al., 2007a; Shaughnessy et al., 2007; Broyl et al., 2010; Dhodapkar et al., 2014; López-Corral et al., 2014; Shao et al., 2018). A few studies have analyzed the disease precursors using hierarchical clustering and differential expression analysis to identify gene signatures (Davies et al., 2003; Zhan et al., 2007; López-Corral et al., 2014). We approached gene expression profiling analysis from the transcription factor (TF) perspective, using gene co-expression networks (GCNs).
Gene co-expression networks have been widely used in discovery of new gene functions and regulatory relationships (Langfelder and Horvath, 2008; Zhang et al., 2010, 2012; Kais et al., 2011; Yin et al., 2015; Zhang and Huang, 2016; Miao et al., 2018). GCNs have been implemented in a few MM studies albeit these studies focused on differential gene expression and not co-expression (Dong et al., 2015; Wang et al., 2016; Liu et al., 2017). We applied GCN analysis on two publicly available MM datasets to identify regulatory genes specifically associated with or disrupted in MM precursors.
The GCN algorithm we employed is local maximal Quasi-Clique Merger (lmQCM) (Zhang and Huang, 2016), previously developed to mine densely correlated gene modules in weighted GCNs (Zhang et al., 2010; Zhang and Huang, 2016, 2017; Xiang et al., 2018). The advantages that lmQCM has over a similar method such as WGCNA (Langfelder and Horvath, 2008) is the ability to allow genes to belong to more than one module and the ability to produce smaller sized modules many of which are related to copy number variations (CNVs) in cancers (Han et al., 2016; Zhang and Huang, 2016; Xiang et al., 2018).
We further supported and validated our gene expression findings with CNVs from microarray technology based on single-nucleotide polymorphism (SNP) arrays. SNP arrays can be used in numerous ways to identify genomic imbalances (She et al., 2008; López-Corral et al., 2012; Johnson et al., 2016; Mitchell et al., 2016; Mikulasova et al., 2017). We surmised that some gene expression changes from normal to MM precursors can be explained by CNVs in order to better understand the genomic changes of myeloma progression.
We applied an integrative network-based approach to identify modules of co-expressed genes associated with MM precursors. MM microarray datasets GSE5900 and GSE6477 from the Gene Expression Omnibus (GEO) were obtained, annotated, and filtered using the TSUNAMI web-tool1. The web-tool retrieved the gene expression matrices via the R package GEOquery. We converted probe IDs to corresponding HGNC symbols according to GEO Platform accession number. In the case of duplicate gene symbols, we retained the one with the largest mean expression value. Probes without gene symbols were removed. We further filtered the data by removing the lowest 20% of genes quantified by absolute average value. The lowest 50% of genes quantified by variance in GSE5900 were removed, while filtering GSE6477 was accomplished by removing the lowest 10% of genes quantified by absolute average value and lowest 10% of genes quantified by variance. We applied a stricter cutoff on GSE5900 because the microarray platform had a much larger probeset than the platform in GSE6477 (54,675 vs. 22,283 probes). This was conducted in order to obtain expression sets with similar numbers of genes. The resulting datasets had 15,388 and 12,530 genes for GSE5900 and GSE6477, respectively. Normalization of the datasets was confirmed by inspecting the boxplots of the samples for consistent median values.
We obtained raw CEL files from GEO study GSE31339, sequenced on Affymetrix Genome-Wide Human SNP Array 6.0. The CEL files were analyzed by the R package Rawcopy (Mayrhofer et al., 2016) and then aggregated by the following conditions: normal (n = 10), MGUS (n = 20), and SMM (n = 19). SMM sample GSM777173 was removed from our analysis after the sample identity distogram suggested some cell or DNA contamination with other samples (Supplementary Figure S1). CNVs were detected in genomic segments using PSCBS, an enhanced method of circular binary segmentation (Bengtsson et al., 2010; Olshen et al., 2011). We used the reference data included in Rawcopy for calculating logarithm (base 2) ratios (log2 ratios) of genome segmentation. Rawcopy defined the thresholds for copy number gain as segment median log2 ratio > 0.2 and copy number losses as segment median log2 ratio < −0.3 (Mayrhofer et al., 2016). The package also annotated probes with their corresponding genes.
We separated GSE5900 into three datasets: normal (n = 22), MGUS (n = 44), and SMM (n = 12). The GSE6477 dataset was separated in the same fashion into three datasets: normal (n = 15), MGUS (n = 22), and SMM (n = 22). GCN mining was conducted using the R package lmQCM. The lmQCM algorithm has an option for normalizing the edge weights of the weighted co-expression network by setting the sums of both rows and columns of the weight matrix to be all ones similar to the weight normalization in spectral clustering (Ng et al., 2001). Another important parameter for lmQCM is gamma that controls the initiation of new gene modules in the iterative mining process. Here, we applied the edge weight normalization and also tested varying gamma values; the rest of the parameters were kept as the default. The normalization process suppresses high weights between nodes and boosts edges with relatively lower weights, which overcomes the issue of unbalanced edge weights in dense module mining algorithms (Zhang and Huang, 2016). The gamma variable ranges from 0 to 1 and controls for the number of generated modules and the maximum module size. For normalized weights, the suggested range of gamma is 0.3–0.75. A higher gamma results in more total modules with fewer genes in the largest module. A lower gamma results in less total modules with more genes in the largest module. We selected gamma values that struck a balance between these two outcomes and elected to keep the largest module under 500 genes. Different values for gamma were selected to obtain a similar number of modules between the same conditions (i.e., normal, MGUS, or SMM) in GSE5900 and GSE6477. This allows the identified modules to be more comparable between datasets of the same condition. We chose the following gamma values for GSE5900: 0.60 for normal, 0.40 for MGUS, and 0.75 for SMM. The following gamma values were chosen for GSE6477– normal: 0.65, MGUS: 0.60, and SMM: 0.55.
For comparison, we also applied the widely used weighted GCN mining algorithm WGCNA (Langfelder and Horvath, 2008) on the same datasets specifying a minimum module size of 10 and using power 5 or 6 as appropriate, leaving the rest of the settings as default. We then selected the most similar modules from lmQCM and WGCNA and calculated gene-wise Spearman correlations to quantify the co-expression density of each module. The most similar modules were determined using the Jaccard index between lmQCM and WGCNA modules in the same condition, where the Jaccard index is simply defined as the size of the intersection between two gene modules divided by the size of the union of the same two modules.
Condition-specific modules are those in which the expression profile of the genes in one module is more correlated in one condition compared to others (e.g., normal, MGUS, or SMM). We utilized a previously developed metric called Centralized Concordance Index (CCI) that evaluates the co-expression of genes within modules identified from GCN analysis (Han et al., 2016). The CCI describes how strongly genes co-express and is calculated from a subset of gene expression data containing the genes from a module and samples from a single condition. CCI values range from 0 to 1, with a higher number indicating more densely correlated genes. For each gene module identified from lmQCM, we calculated the corresponding CCI in normal, MGUS, and SMM. The CCIs for each module were then compared across the three conditions, and a difference of ∼0.2 in CCI values between MM precursors (MGUS or SMM) and normal were identified as potentially interesting.
We further reduced our modules of interest by identifying modules with similar genes between GSE5900 and GSE6477. The Jaccard index, described above in Section “Gene Co-expression Network Mining,” was used to calculate the similarity of modules in the same conditions between GSE5900 and GSE6477. This calculation was conducted between every pair of modules in each condition: normal, MGUS, and SMM. Each resulting matrix was then transformed into a z-score where the top one percentile of similar module pairs from each condition were kept to filter the list of potentially interesting modules for enrichment analysis.
We used the R package enrichR (Kuleshov et al., 2016) to conduct enrichment analysis of the genes in each module of interest. We specified the “GO Biological Process 2017b” and “KEGG 2016” databases for functional and pathway enrichment analyses. For determining the significance of GO and KEGG pathway terms, we used Bonferroni significance cutoffs of 0.05/nMods where nMods is the number of modules corresponding to the specific dataset. For instance, the p-value cutoff for GSE5900 normal-specific data is 0.05/31 = 0.00161. We took GO terms with significant p-values and summarized them using the web-tool REVIGO (Supek et al., 2011).
Using enrichR, we specified the “TRANSFAC and JASPAR PWMs” database to identify TFs that regulate the genes in our modules of interest, using a less stringent Bonferroni cutoff of 0.1/nMods. We then narrowed down the list of TFs by identifying those that were differentially expressed among the three conditions by either gene expression data or CNV segment median data by conducting Mann–Whitney tests between normal and MGUS and between normal and SMM samples.
We used Ingenuity Pathways Analysis (IPA, Qiagen) for network analysis of TFs and their targets determined from enrichR to explore possible signaling pathways. We conducted core analyses (which is a function of IPA) for each TF and its targets, using experimentally observed knowledge in the Ingenuity Knowledge Base and specifying direct and indirect gene relationships in human tissue and cell lines.
Our workflow is shown in Figure 1. After applying the lmQCM algorithm using the specified gamma values to the GSE5900 datasets, we obtained 78, 60, and 95 modules for normal, MGUS, and SMM, respectively; module sizes ranged from 10 to 400 genes. In GSE6477, using the specified gamma values, we obtained 79, 85, and 70 modules for the normal, MGUS, and SMM samples, respectively; module sizes ranged from 10 to 352 genes. Applying WGCNA to GSE5900, we obtained 40, 41, and 98 modules for normal, MGUS, and SMM, respectively; module sizes ranged from 11 to 4694 genes. In applying WGCNA to GSE6477, we obtained 34, 99, and 74 modules for normal, MGUS, and SMM, respectively; module sizes ranged from 11 to 4324 genes. Detailed breakdowns by sample type are shown in Table 1.
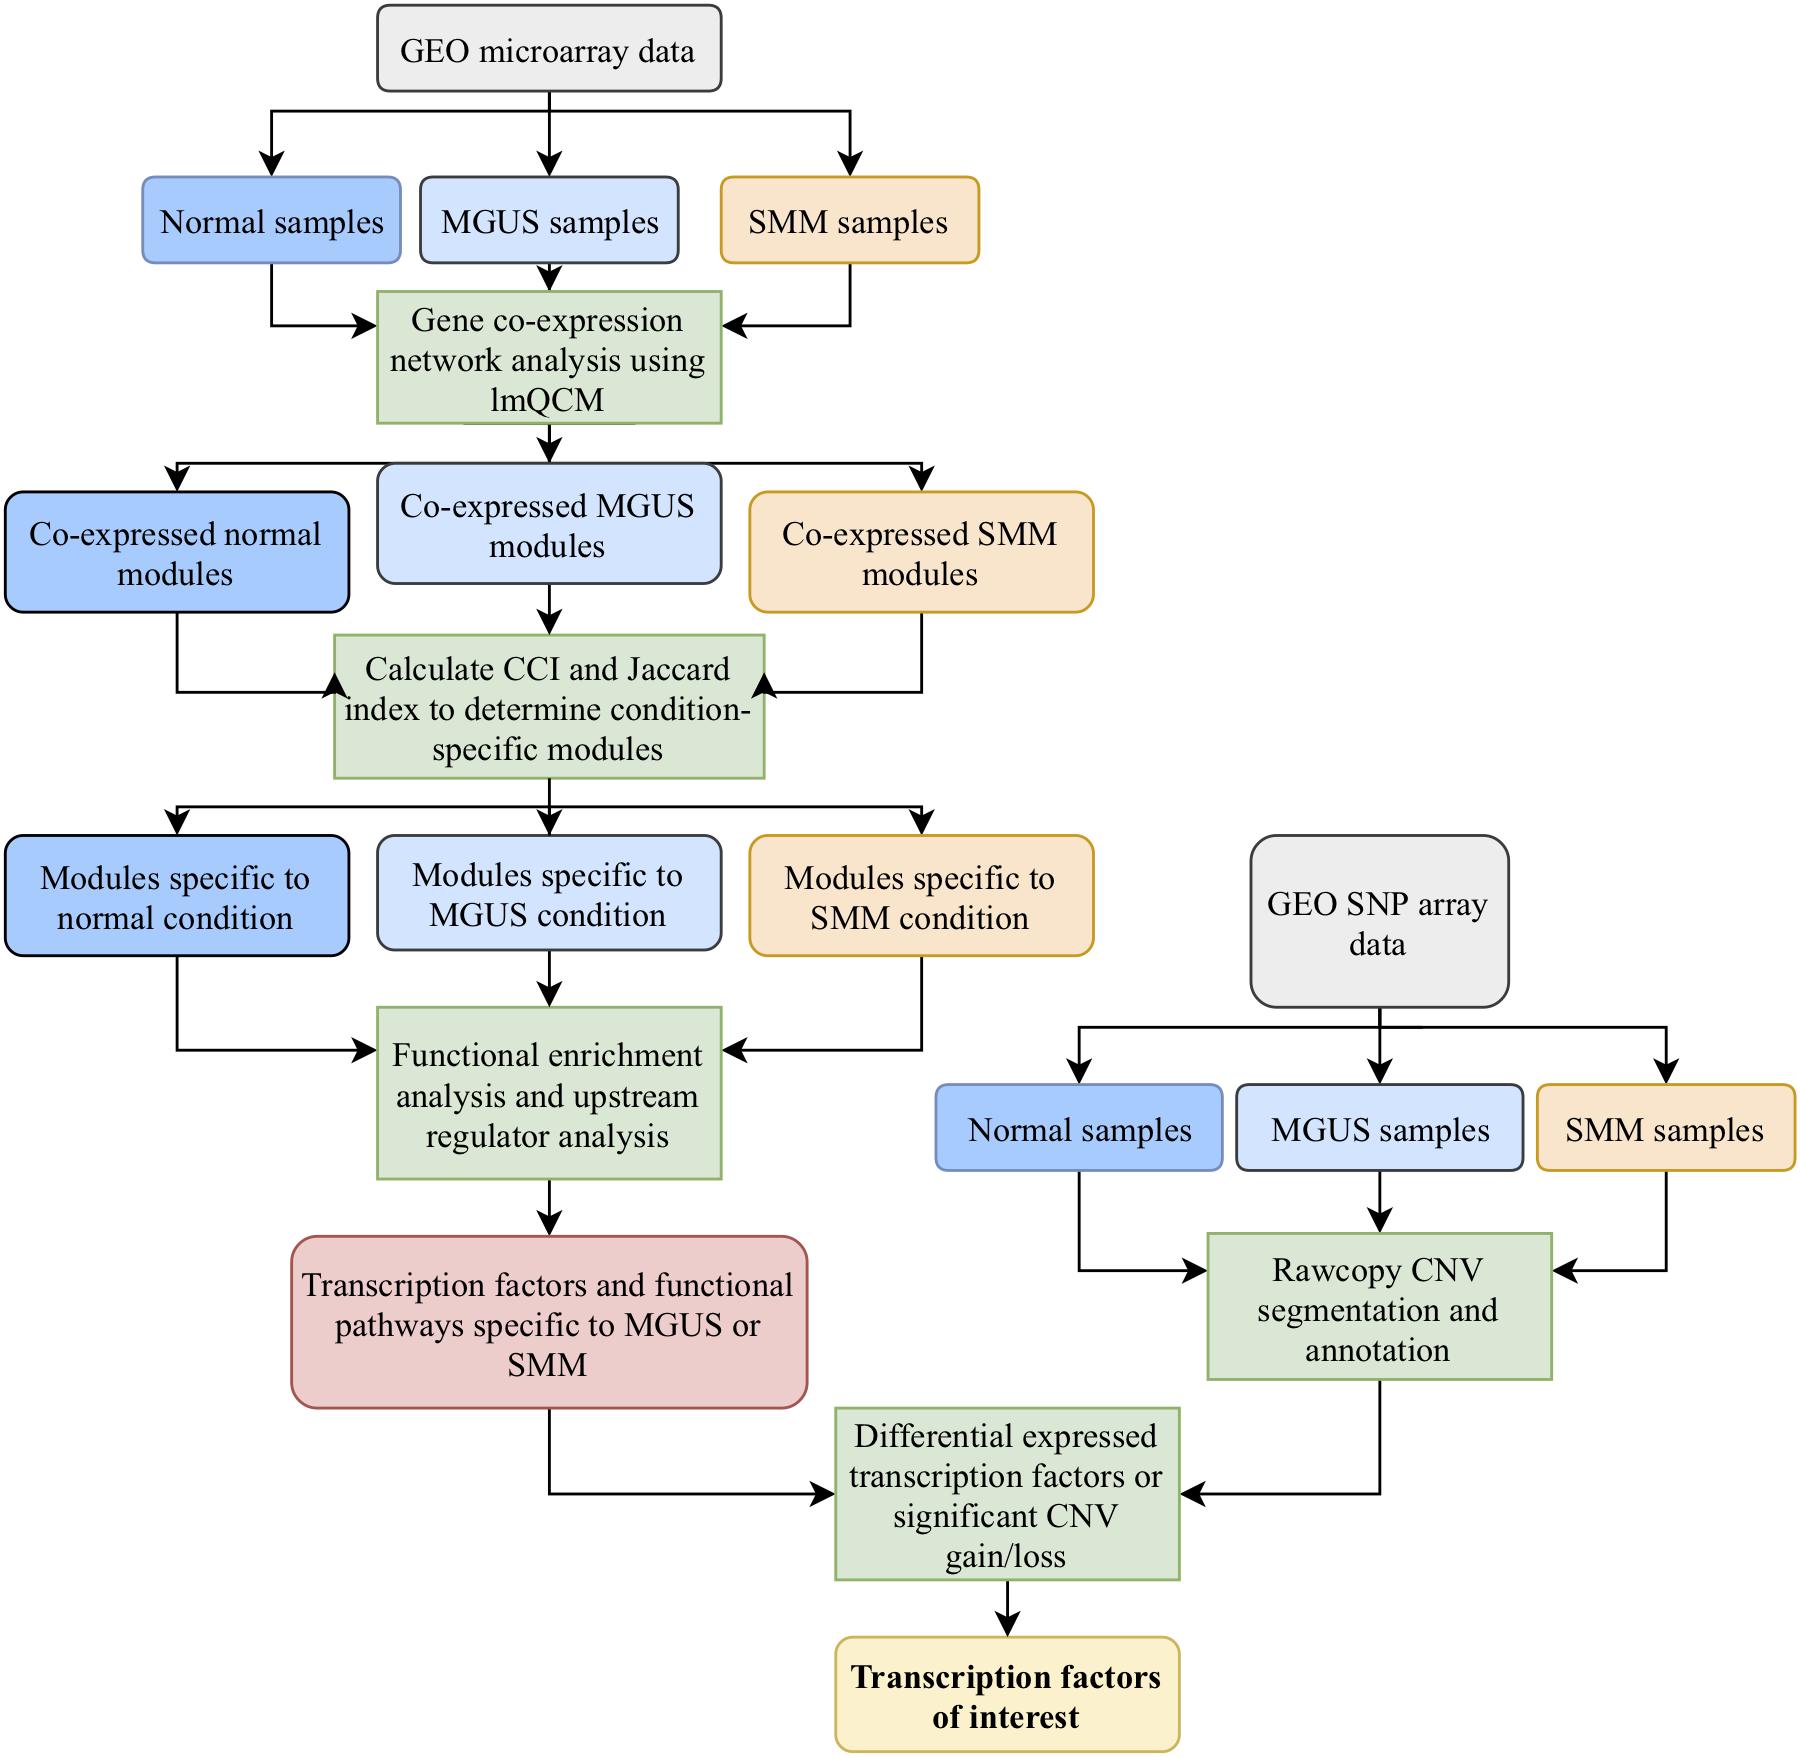
Figure 1. Workflow of the methods employed in this study.
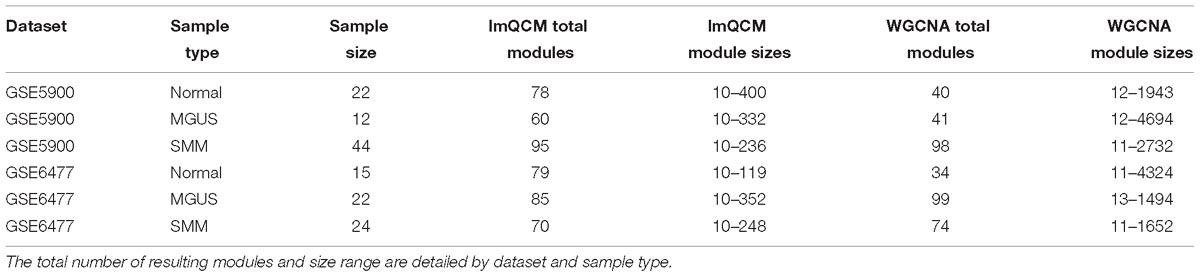
Table 1. GCN results from algorithms lmQCM and WGCNA.
The most similar gene modules were identified from two SMM modules in lmQCM and WGCNA. The lmQCM module contained 224 genes and the WGCNA module contained 393 genes. The Jaccard index was 0.396, with an overlap of 175 genes. Within each respective module, we calculated the Spearman correlation in a gene-wise manner and conducted a two-sided Mann–Whitney test between the absolute value of the correlation coefficients in each population. The correlation coefficients were significantly higher in the lmQCM module (median: 0.399) compared to the WGCNA module (median: 0.322) with a p-value of 2.2E-16 (Supplementary Figure S2).
Normal-, MGUS-, and SMM-specific modules were identified by calculating the CCI difference between normal and MGUS samples and normal and SMM samples and setting a cutoff of around 0.2 CCI difference. This resulted in 68 and 79 normal-specific modules, 45 and 72 MGUS-specific modules, 95 and 63 SMM-specific modules across GSE5900 and GSE6477 datasets, respectively. An example of a normal-specific gene module is visualized using Spearman correlation heatmaps in Supplementary Figure S3.
To further reduce modules of interest, we used Jaccard similarity. After module similarity comparison using the Jaccard index, we reduced the interesting modules to more manageable numbers than solely using CCI and were left with 31 and 39 normal-specific modules, 22 and 31 MGUS-specific modules, and 47 and 30 SMM-specific modules across GSE5900 and GSE6477 datasets, respectively. The module sizes ranged from 10 to 400 genes.
Chromosomes 2, 4, 10, 11, 12, and 21 were mostly unchanged and showed 10% or less allelic imbalance in all conditions. Chromosomes 1q, 3, 5, 6, 7, 9, 15, 18, and 19 were slightly amplified in MGUS and more amplified in SMM, with chromosomes 1q, 5, 9, and 19 showing the highest frequencies of change in SMM of around 40%. For instance, 1q had about 10% of MGUS samples amplified and around 40% of SMM samples amplified. We observed an increased frequency of deletions in chromosomes 1p, 6, 7, 8p, 10, 12p, 13, 14q, 16q, 18, 20, and 22q; the highest deletion frequency was around 25% and was observed in 8p, 13, 16q, and 22q of SMM patients. The CNV landscape across conditions is shown in Figure 2.
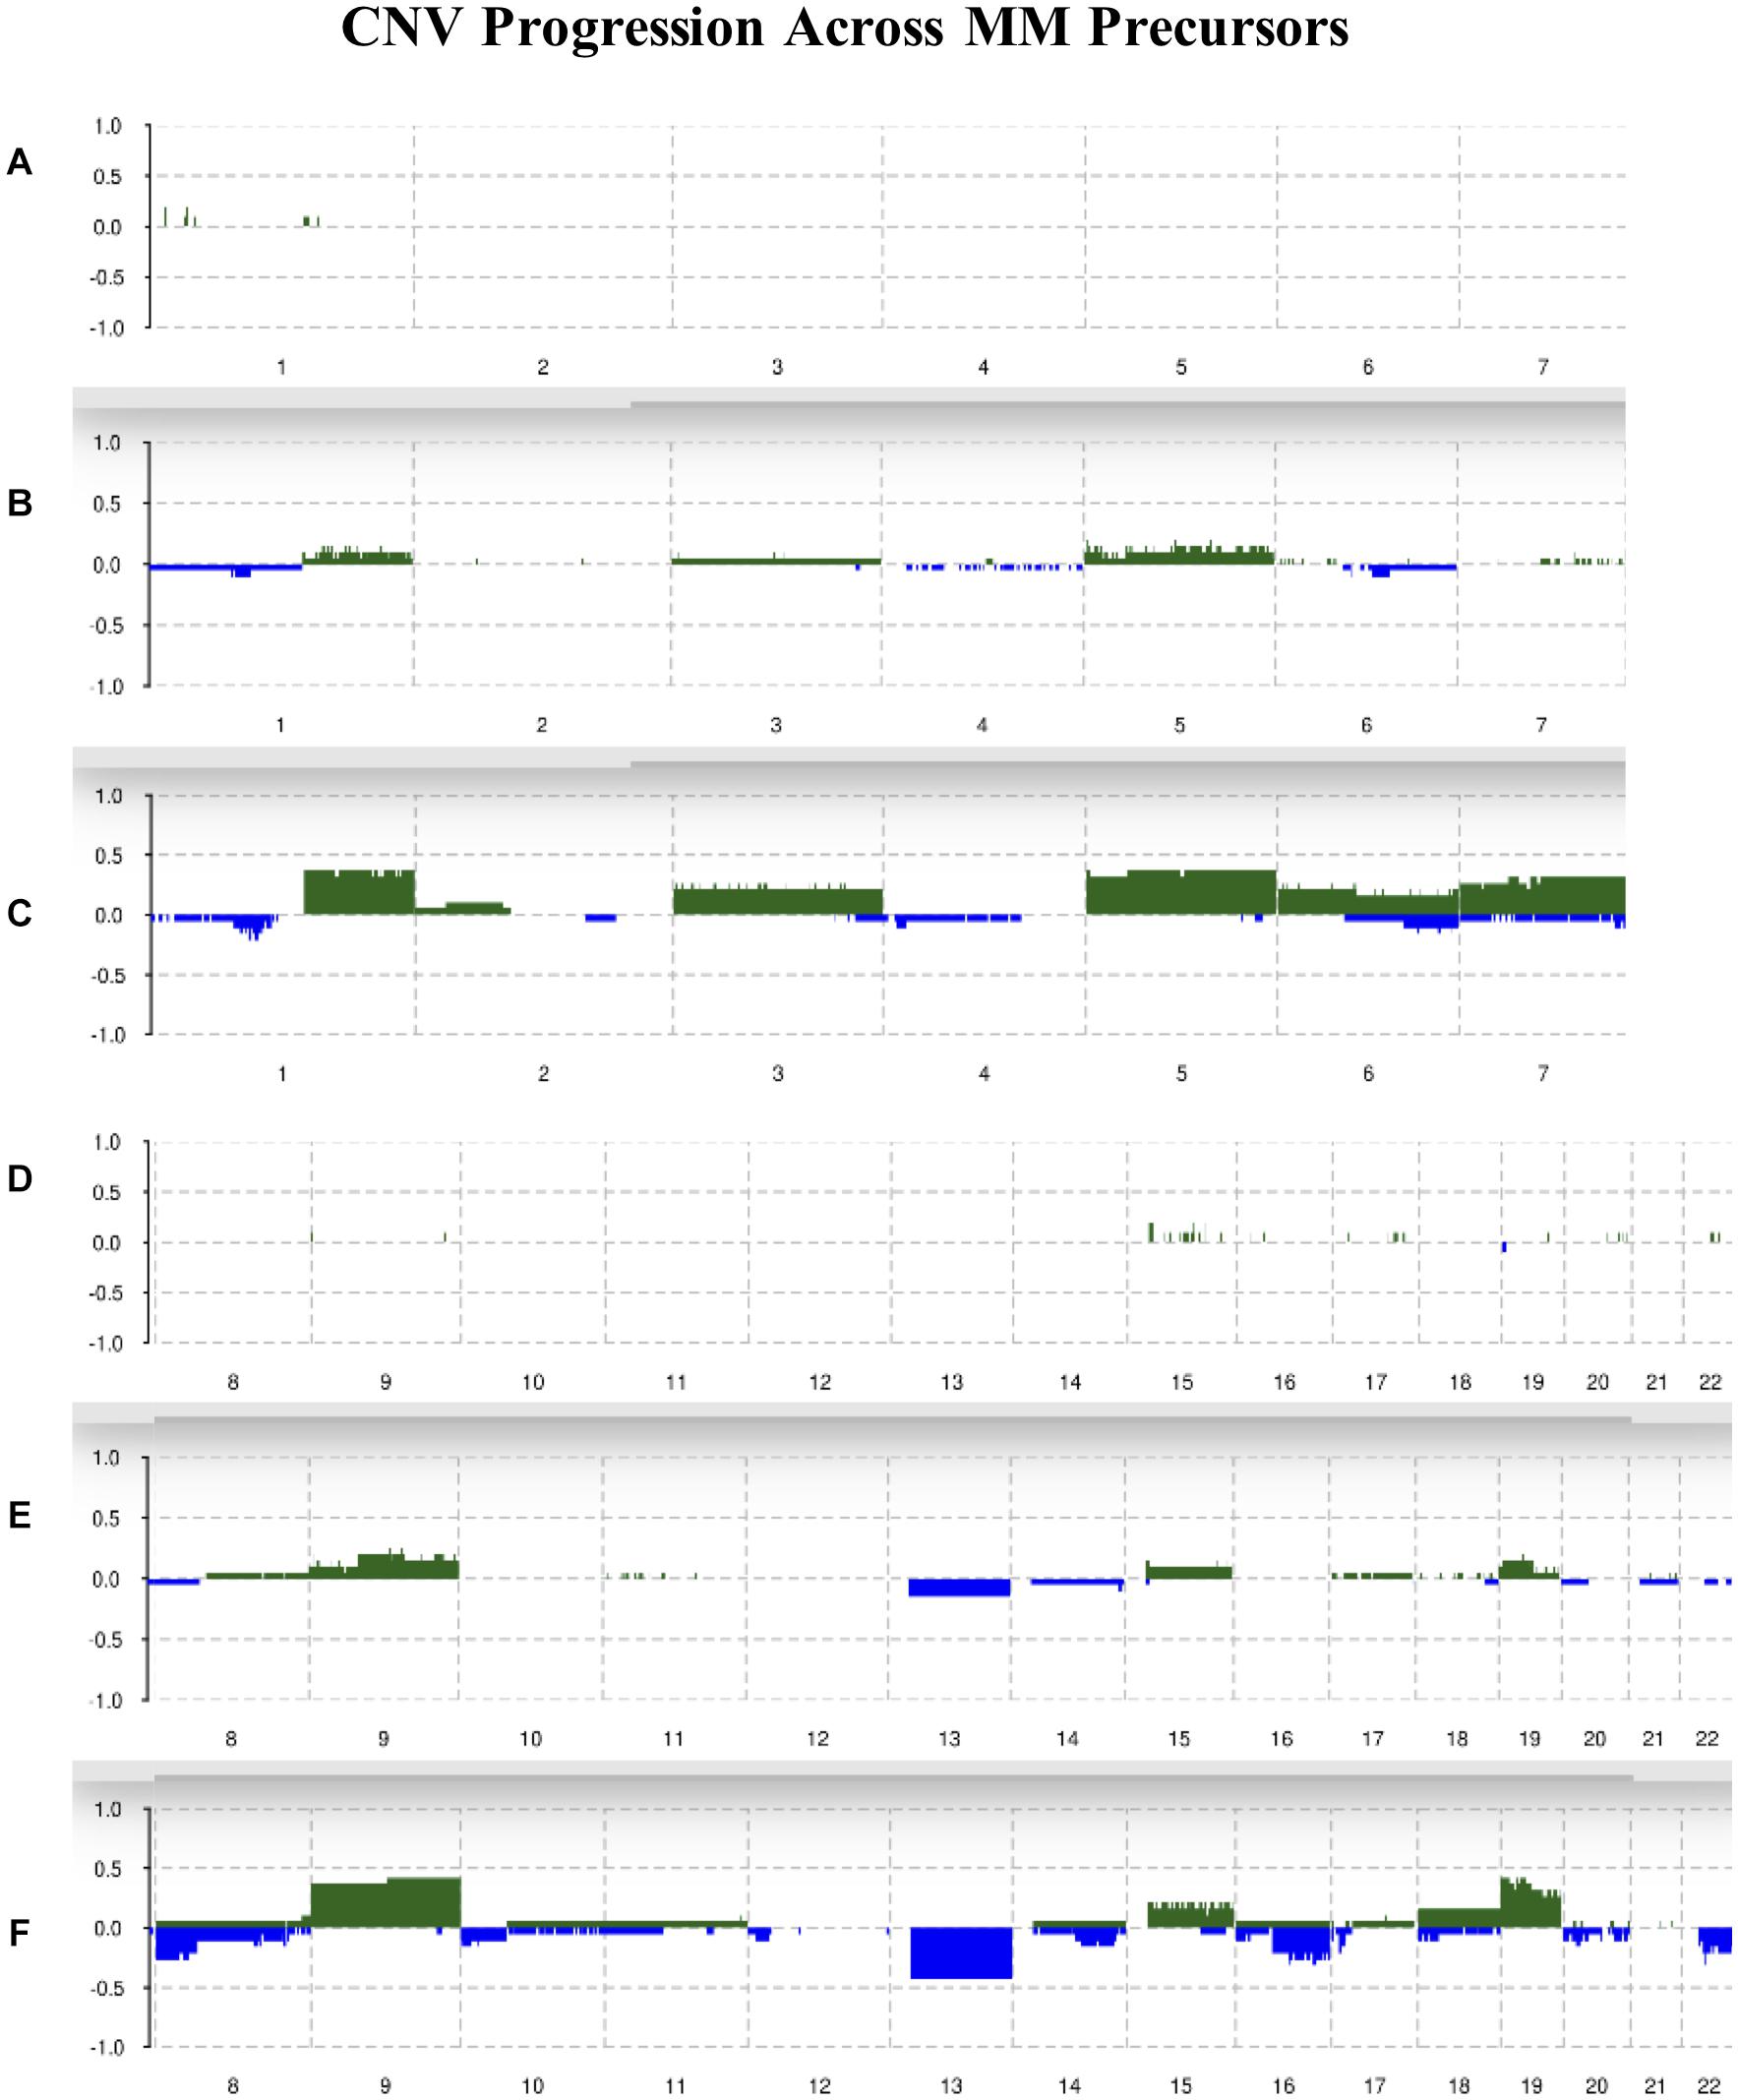
Figure 2. Summary of CNVs across the genome from chromosomes 1–7 in (A) normal, (B) MGUS, and (C) SMM samples. Summary of CNVs across the genome from chromosomes 8–22 in (D) normal, (E) MGUS, and (F) SMM samples. The y-axis indicates the frequency of the chromosomal aberration. Green indicates amplification; blue indicates deletion.
The top GO BP terms from all condition-specific modules are shown in Supplementary Table S1. In the normal-specific data, there were 95 significant GO BP terms that appeared in both GSE5900 and GSE6477, the top few being neutrophil degranulation, antigen processing and presentation of exogenous peptide antigen via MHC class II, and antifungal humoral response. These GO terms are mostly related to immune system response.
The MGUS-specific data had 40 significant GO BP terms in common from GSE5900 and GSE6477, with many immune function terms such as positive regulation of B cell activation, response to interferon-alpha, and B cell receptor signaling pathway.
The SMM-specific data shared 125 GO BP terms between GSE5900 and GSE6477 data, the most significant ones relating to the process of transcription and translation. There were also terms related to immune function such as B cell receptor signaling pathway.
We identified these TFs as interesting: MAX, TCF4, ZNF148, and ZNF281. MAX was identified from a normal-specific module, TCF4 and ZNF148 were identified from MGUS-specific modules, and ZNF281 was identified from a SMM-specific module. Three TFs (MAX, TCF4, and ZNF148) were differentially expressed between normal and a MM precursor (MGUS or SMM) in the gene expression datasets and/or the CNV dataset (Table 2). While ZNF281 was not differentially expressed, it showed an interesting increase in copy number gain from normal to MGUS and to SMM.
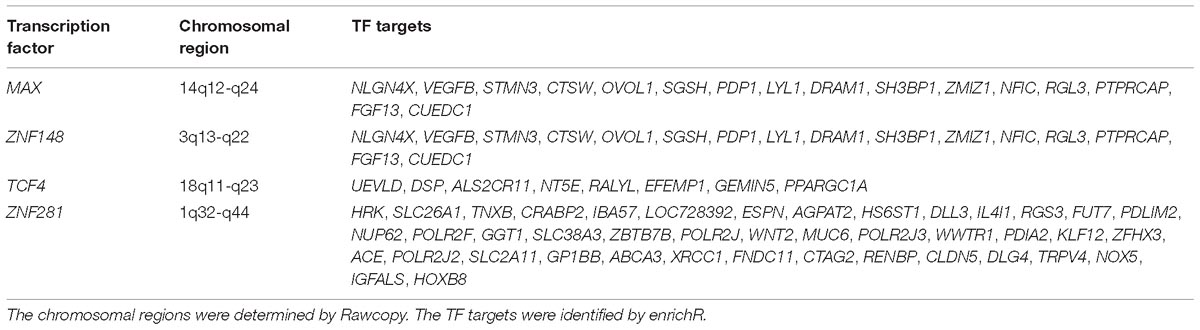
Table 2. Transcription factors of interest, identified from condition-specific modules in normal, MGUS, and SMM samples.
The gene co-expression module containing MAX was functionally enriched in bleb assembly and activation of MAPKKK activity involved in innate immune response.
The gene co-expression module containing ZNF148 was functionally enriched in antigen processing and presentation of exogenous peptide antigen via MHC class II and negative regulation of peptide hormone processing.
In the gene co-expression module containing TCF4, multiple assembly complexes containing the genes GEMIN5, PPARGC1A, and TEAD1 were significantly enriched. They include apoptosome assembly, mitotic checkpoint complex assembly, and Wnt signalosome assembly.
The gene co-expression module containing ZNF281 is functionally enriched in genes involved in transcription. These include transcription, DNA-templated, transcription from RNA polymerase II promoter, telomeric repeat-containing RNA transcription, and mRNA transcription.
The details of GO BP enrichment results (top enriched terms and p-values) for these modules with their corresponding p-values are listed in Supplementary Table S1.
MAX did not show differential gene expression; however, its copy number significantly decreased in MGUS and SMM compared to normal (p-val = 1.17E-05 and 6.10E-04, respectively, Figures 3A,B). The CNV pattern showed deletions in MGUS and amplification and deletions in SMM (Figure 3B).
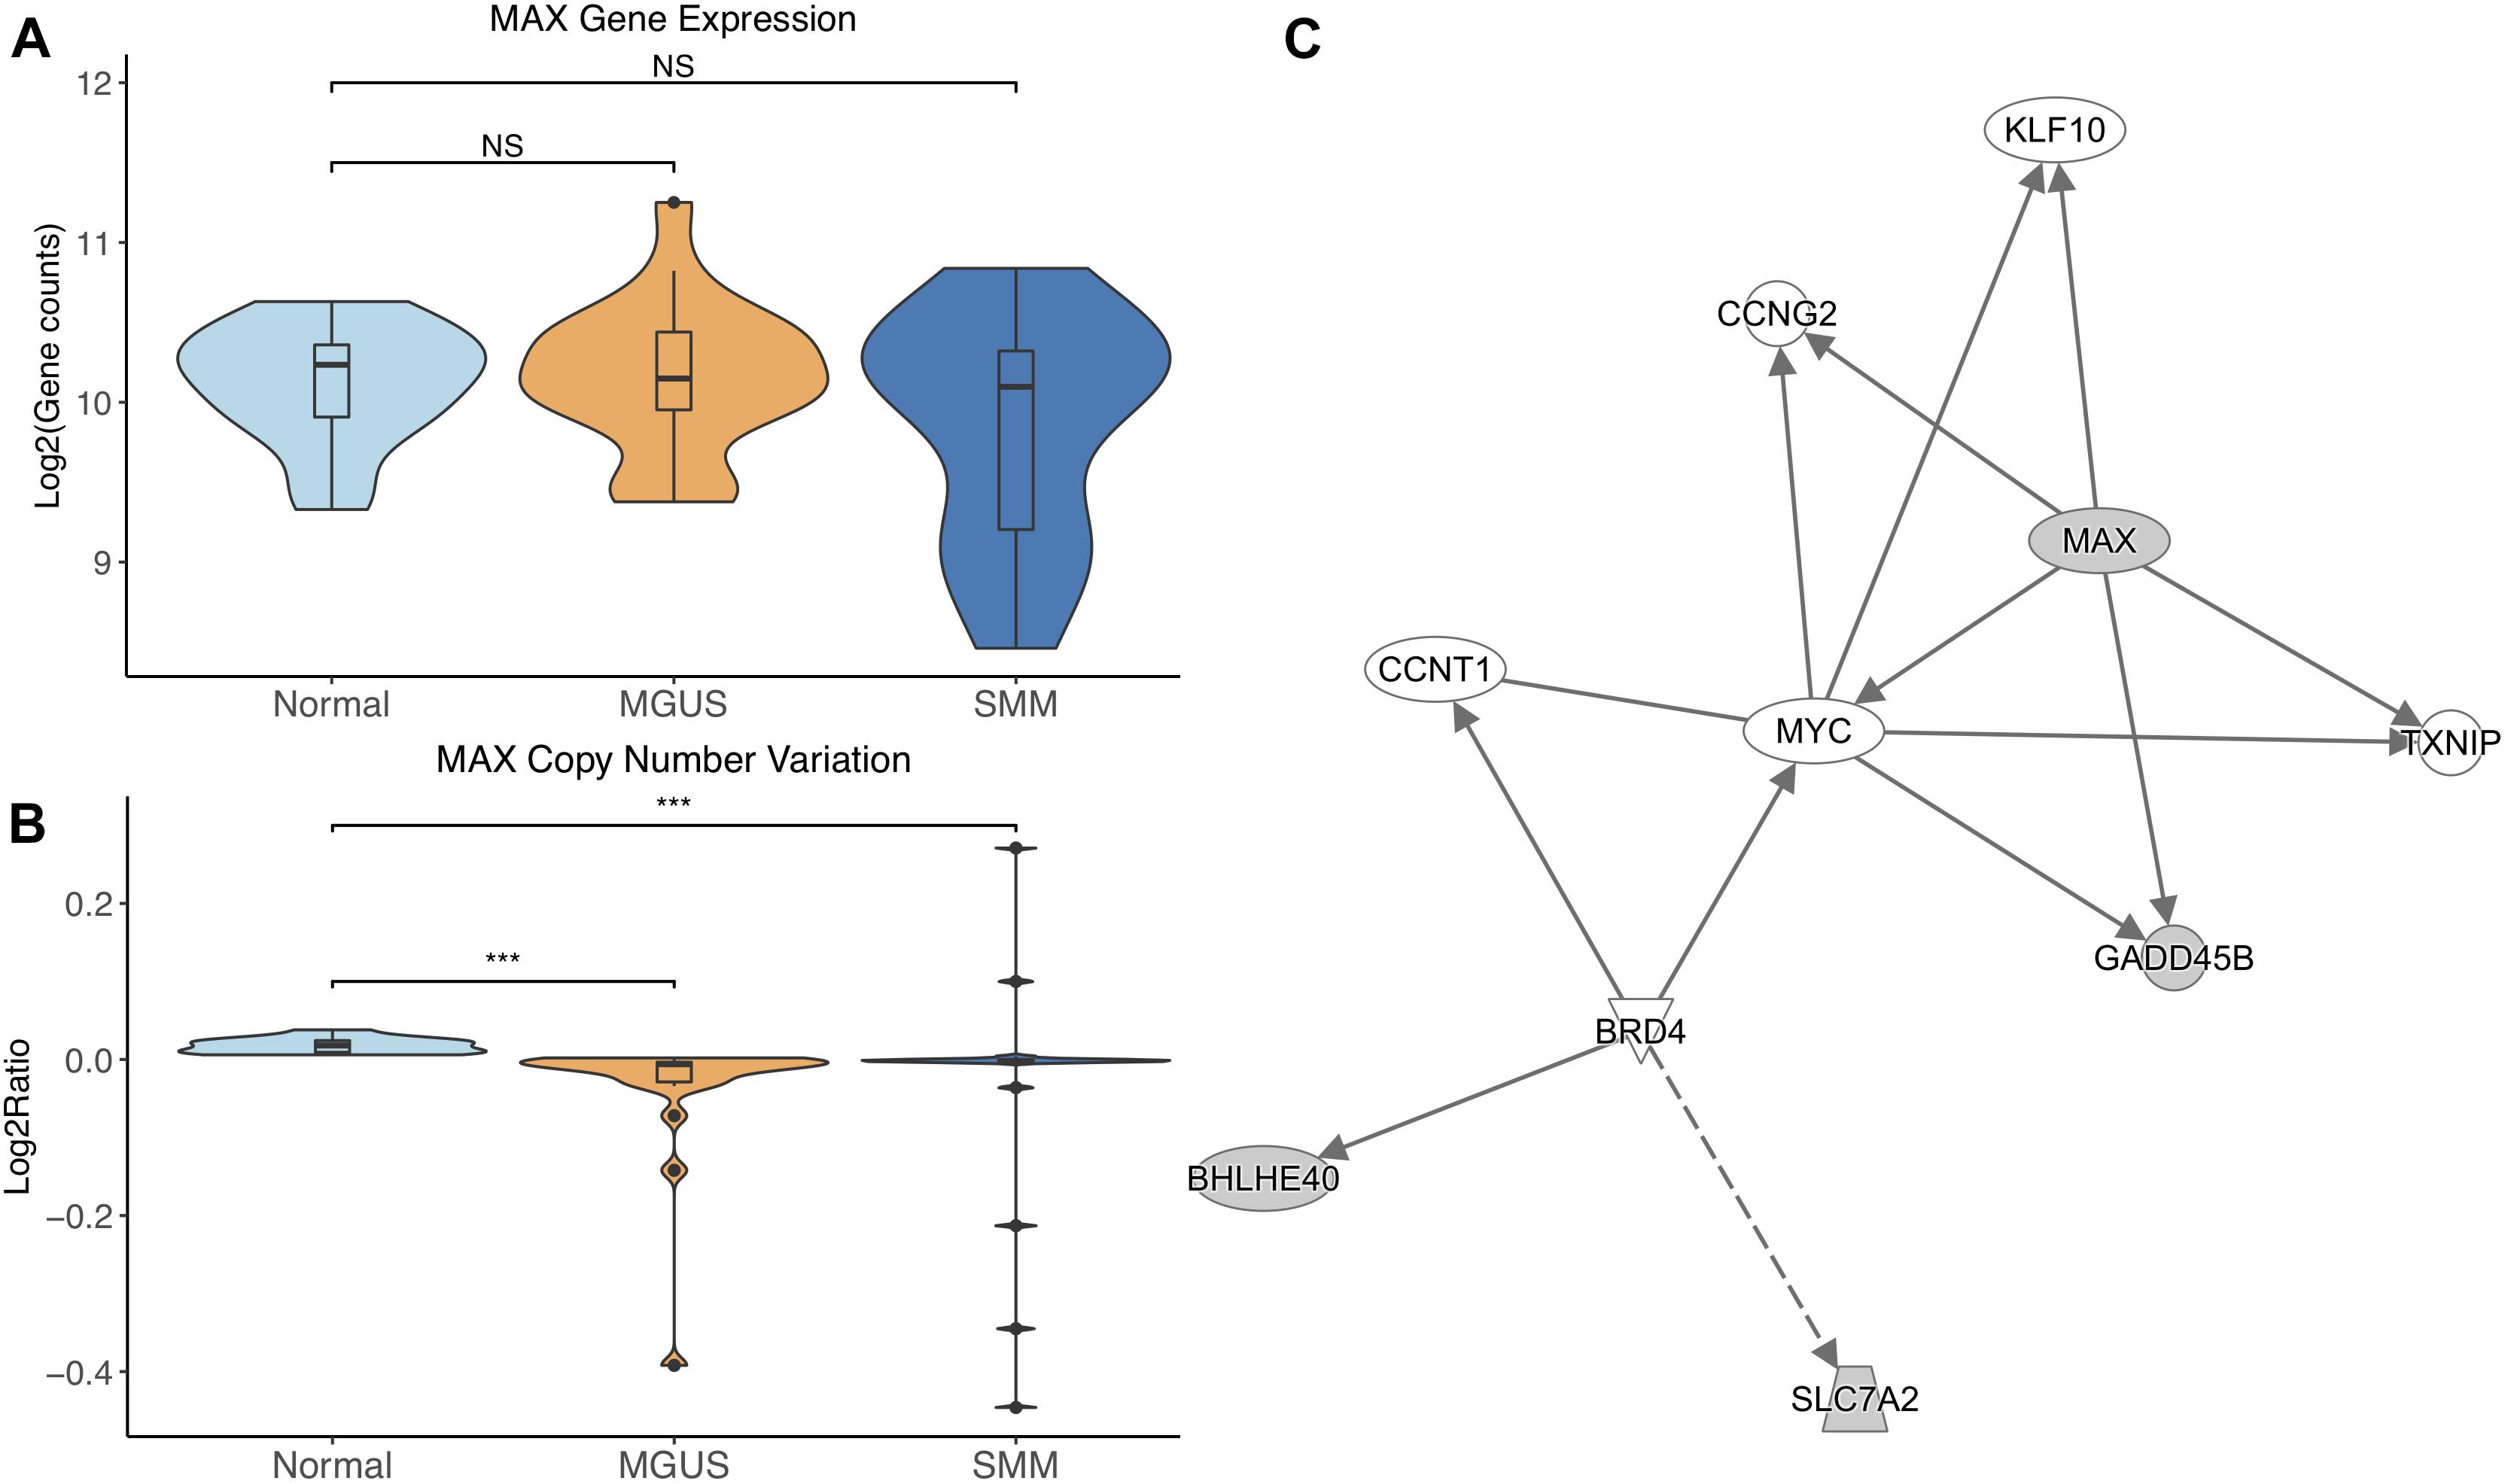
Figure 3. (A) MAX expression across sample groups. Mann–Whitney tests between groups showed no significant difference. (B) Observations of MAX copy number. Mann–Whitney tests showed significant copy number variation between Normal and MGUS (p = 1.17E-05) and between Normal and SMM (p = 6.10E-04). (C) A predicted interaction network of MAX and its downstream targets. The gray nodes indicate genes from our module and the white nodes are gene interactions defined in IPA. Solid lines between nodes indicate a direct interaction supported by the Ingenuity Knowledge Base while the dashed line indicates an indirect interaction. Significance levels: ∗p ≤ 0.05; ∗∗p ≤ 0.01; ∗∗∗p ≤ 0.001.
ZNF148 was the only TF that showed significantly different CNV aberrations and gene expression, with gene expression and copy number amplification both increasing in MGUS and SMM (p-val range: 1.75E-02–3.11E-04, Figures 4A,B).
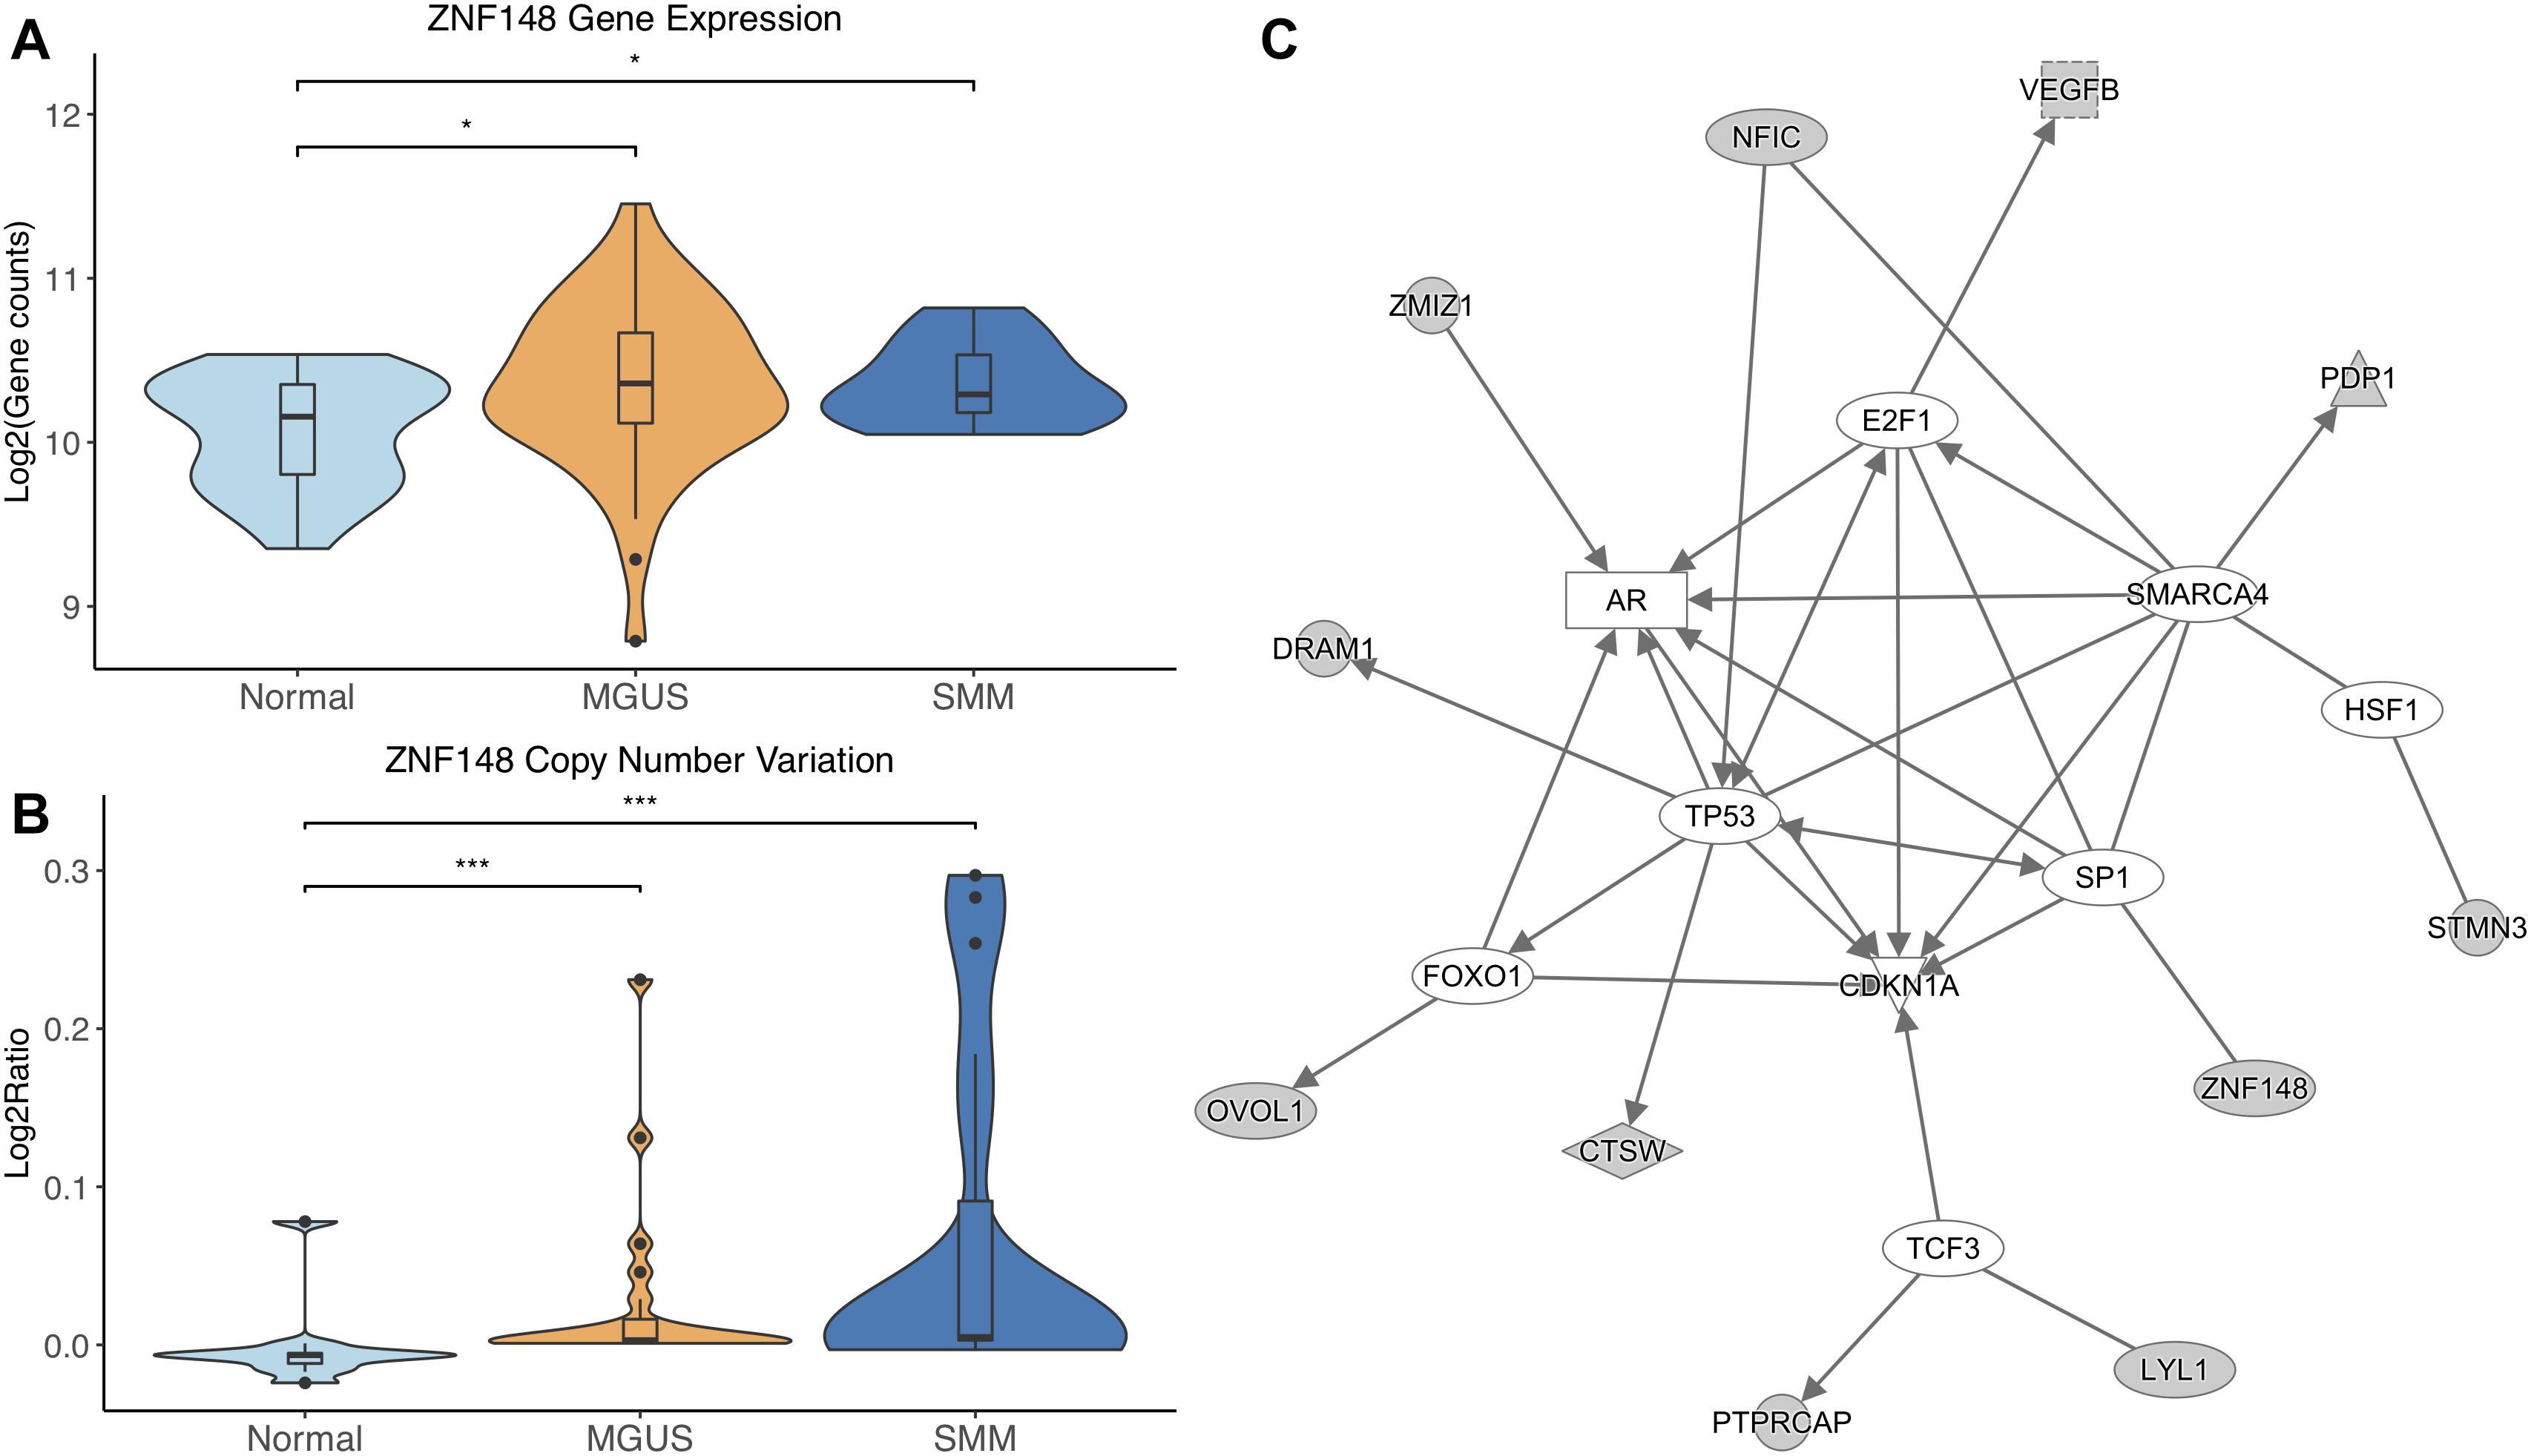
Figure 4. (A) ZNF148 expression across sample groups. Mann–Whitney tests showed significant differential expression between Normal and MGUS (p = 1.75E-02) and between Normal and SMM (p = 4.05E-02). (B) Observations of ZNF148 copy number. Mann–Whitney tests showed significant copy number variation between Normal and MGUS (p = 4.76E-04) and between Normal and SMM (p = 3.11E-04). (C) A predicted interaction network of ZNF148 and its downstream targets. The gray nodes indicate genes from our module and the white nodes are gene interactions defined in IPA. Solid lines between nodes indicate a direct interaction supported by the Ingenuity Knowledge Base. Significance levels: ∗p ≤ 0.05; ∗∗p ≤ 0.01; ∗∗∗p ≤ 0.001.
TCF4 was differentially expressed between normal/MGUS (p-val = 3.65E-03) and normal/SMM (p-val = 1.49E-02), with gene expression progressively increasing from MGUS to SMM (Figure 5A). In regard to CNVs, TCF4 exhibited amplifications in MGUS and amplifications and deletions in SMM (Figure 5B).
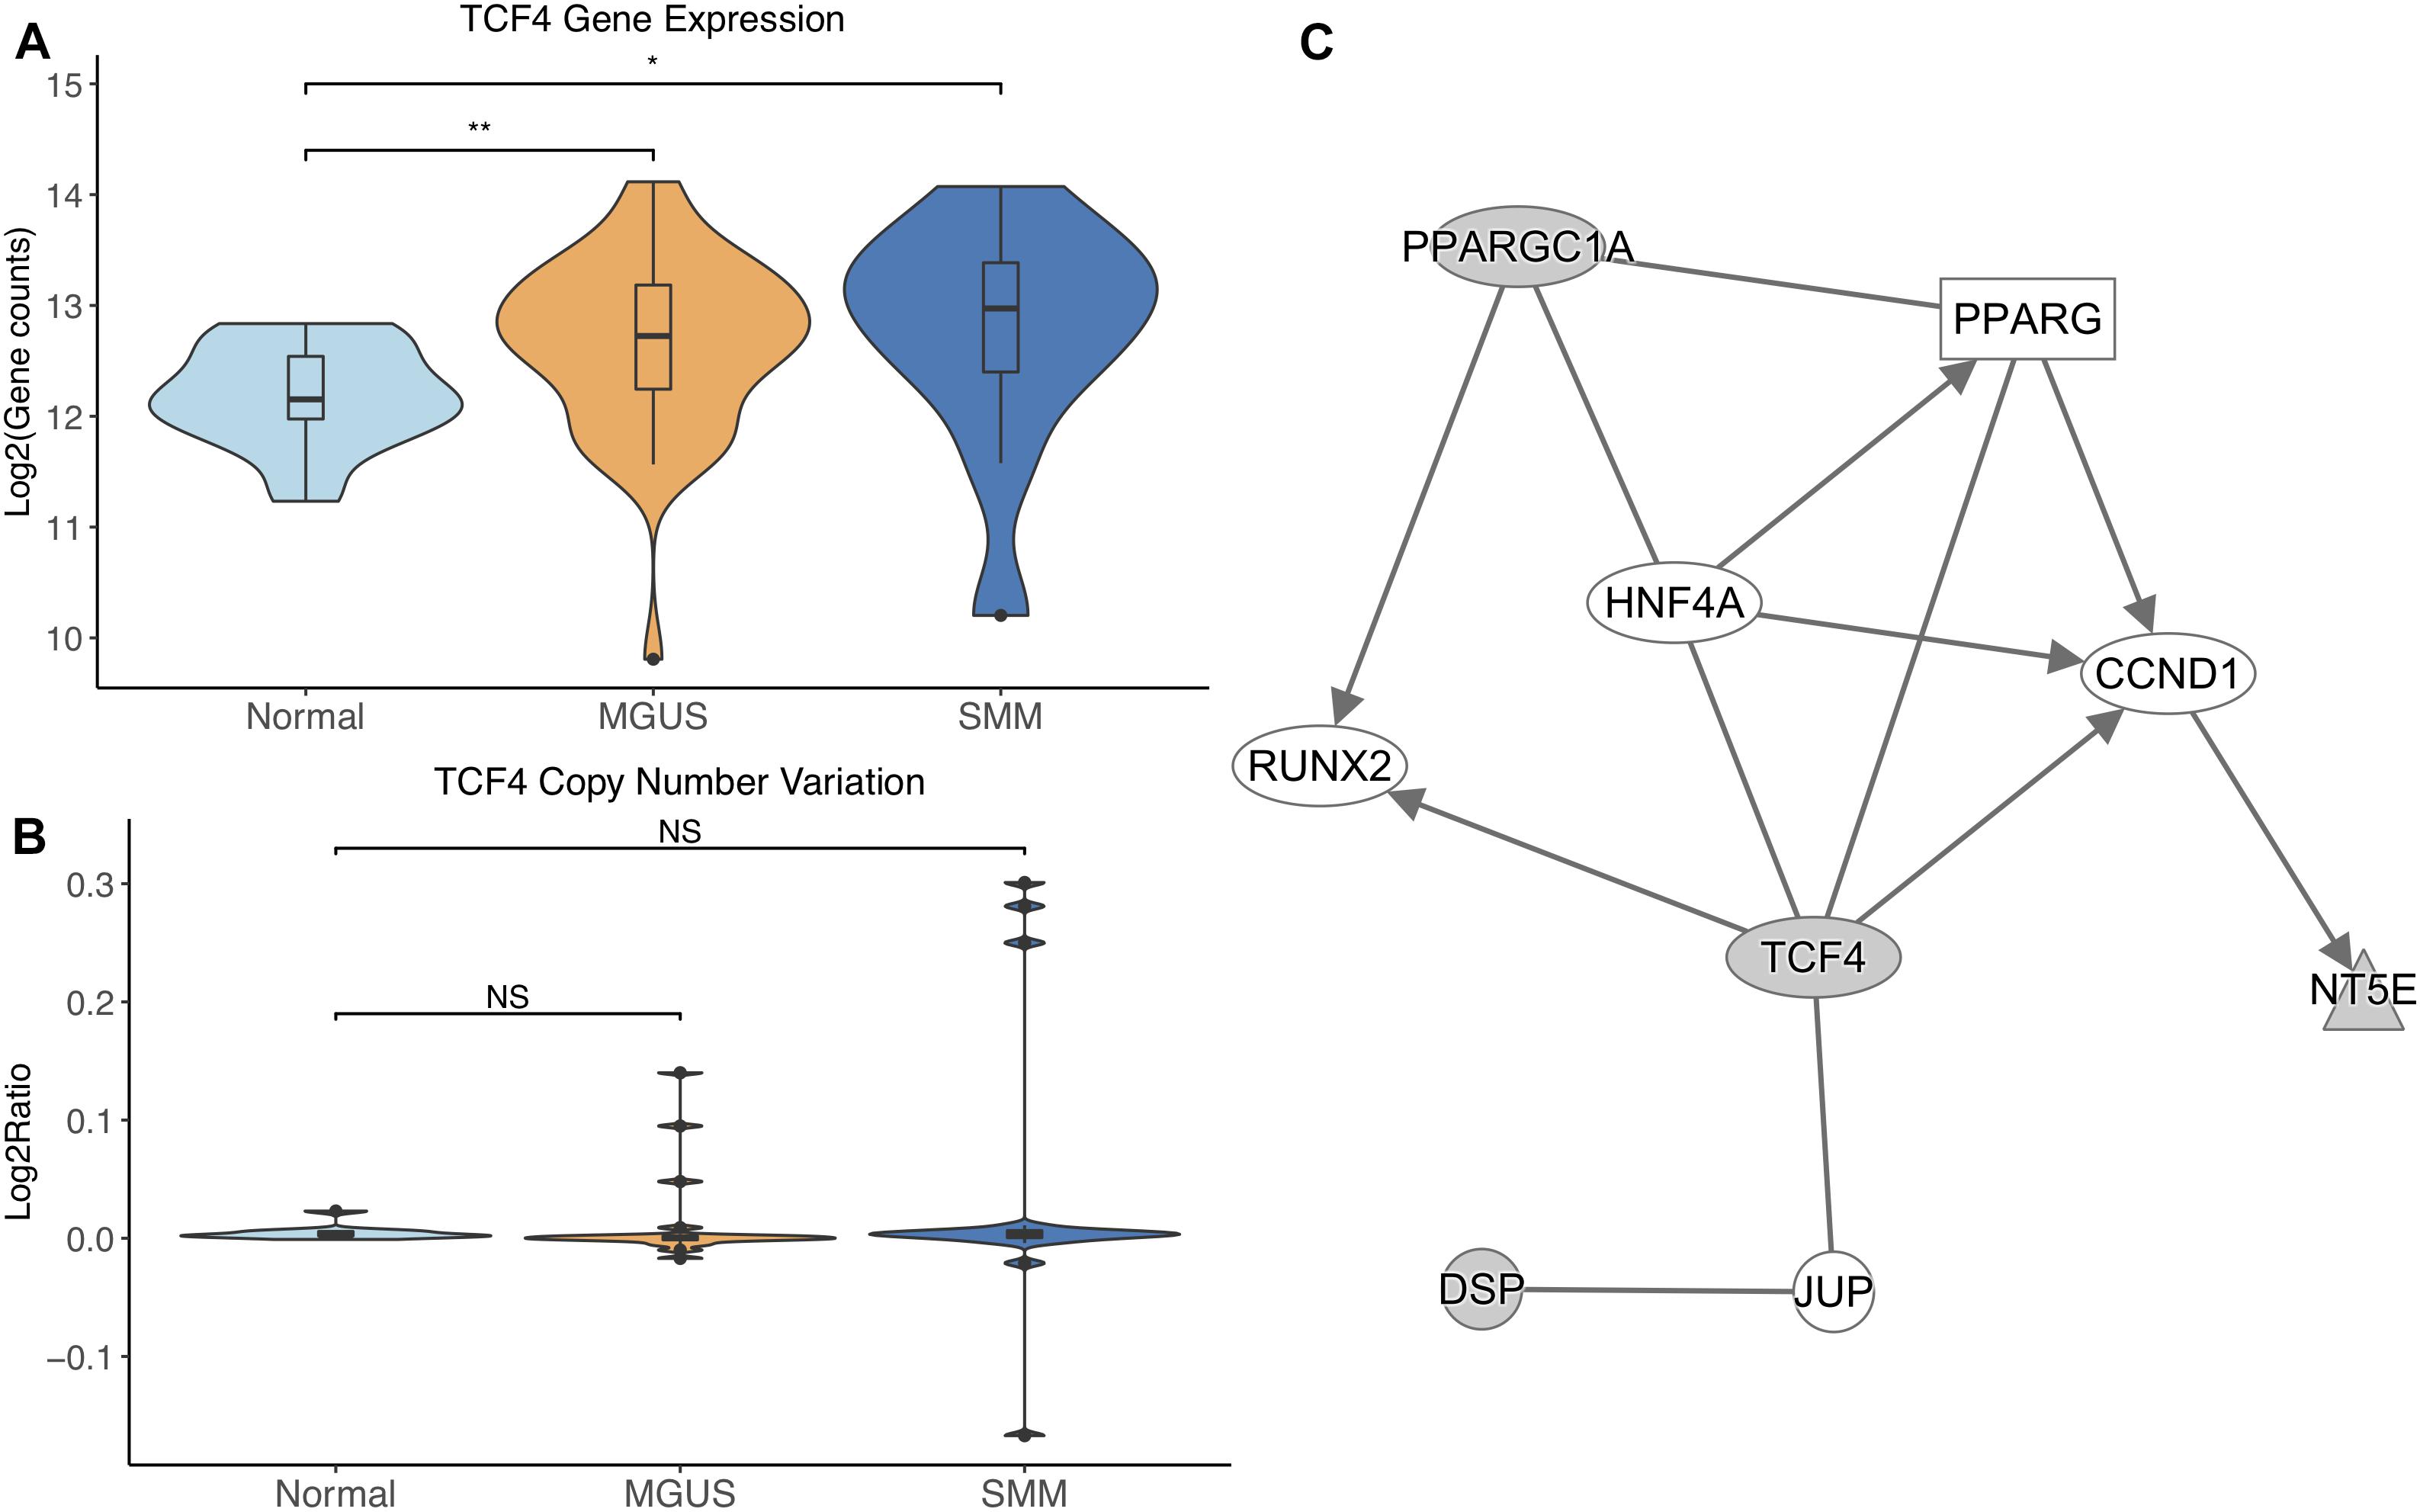
Figure 5. (A) TCF4 expression across sample groups. Mann–Whitney tests showed significant differential expression between Normal and MGUS (p = 3.65E-03) and between Normal and SMM (p = 1.49E-02). (B) Observations of TCF4 copy number. Mann–Whitney tests showed no significant differences between any groups. (C) A predicted interaction network of TCF4 and its downstream targets. The gray nodes indicate genes from our module and the white nodes are gene interactions defined in IPA. Solid lines between nodes indicate a direct interaction supported by the Ingenuity Knowledge Base. Significance levels: ∗p ≤ 0.05; ∗∗p ≤ 0.01; ∗∗∗p ≤ 0.001.
ZNF281 did not show differential gene expression (Figure 6A). ZNF281 showed increasing CNV amplifications from MGUS to SMM, but it was not considered significant by Mann–Whitney tests (Figure 6B).
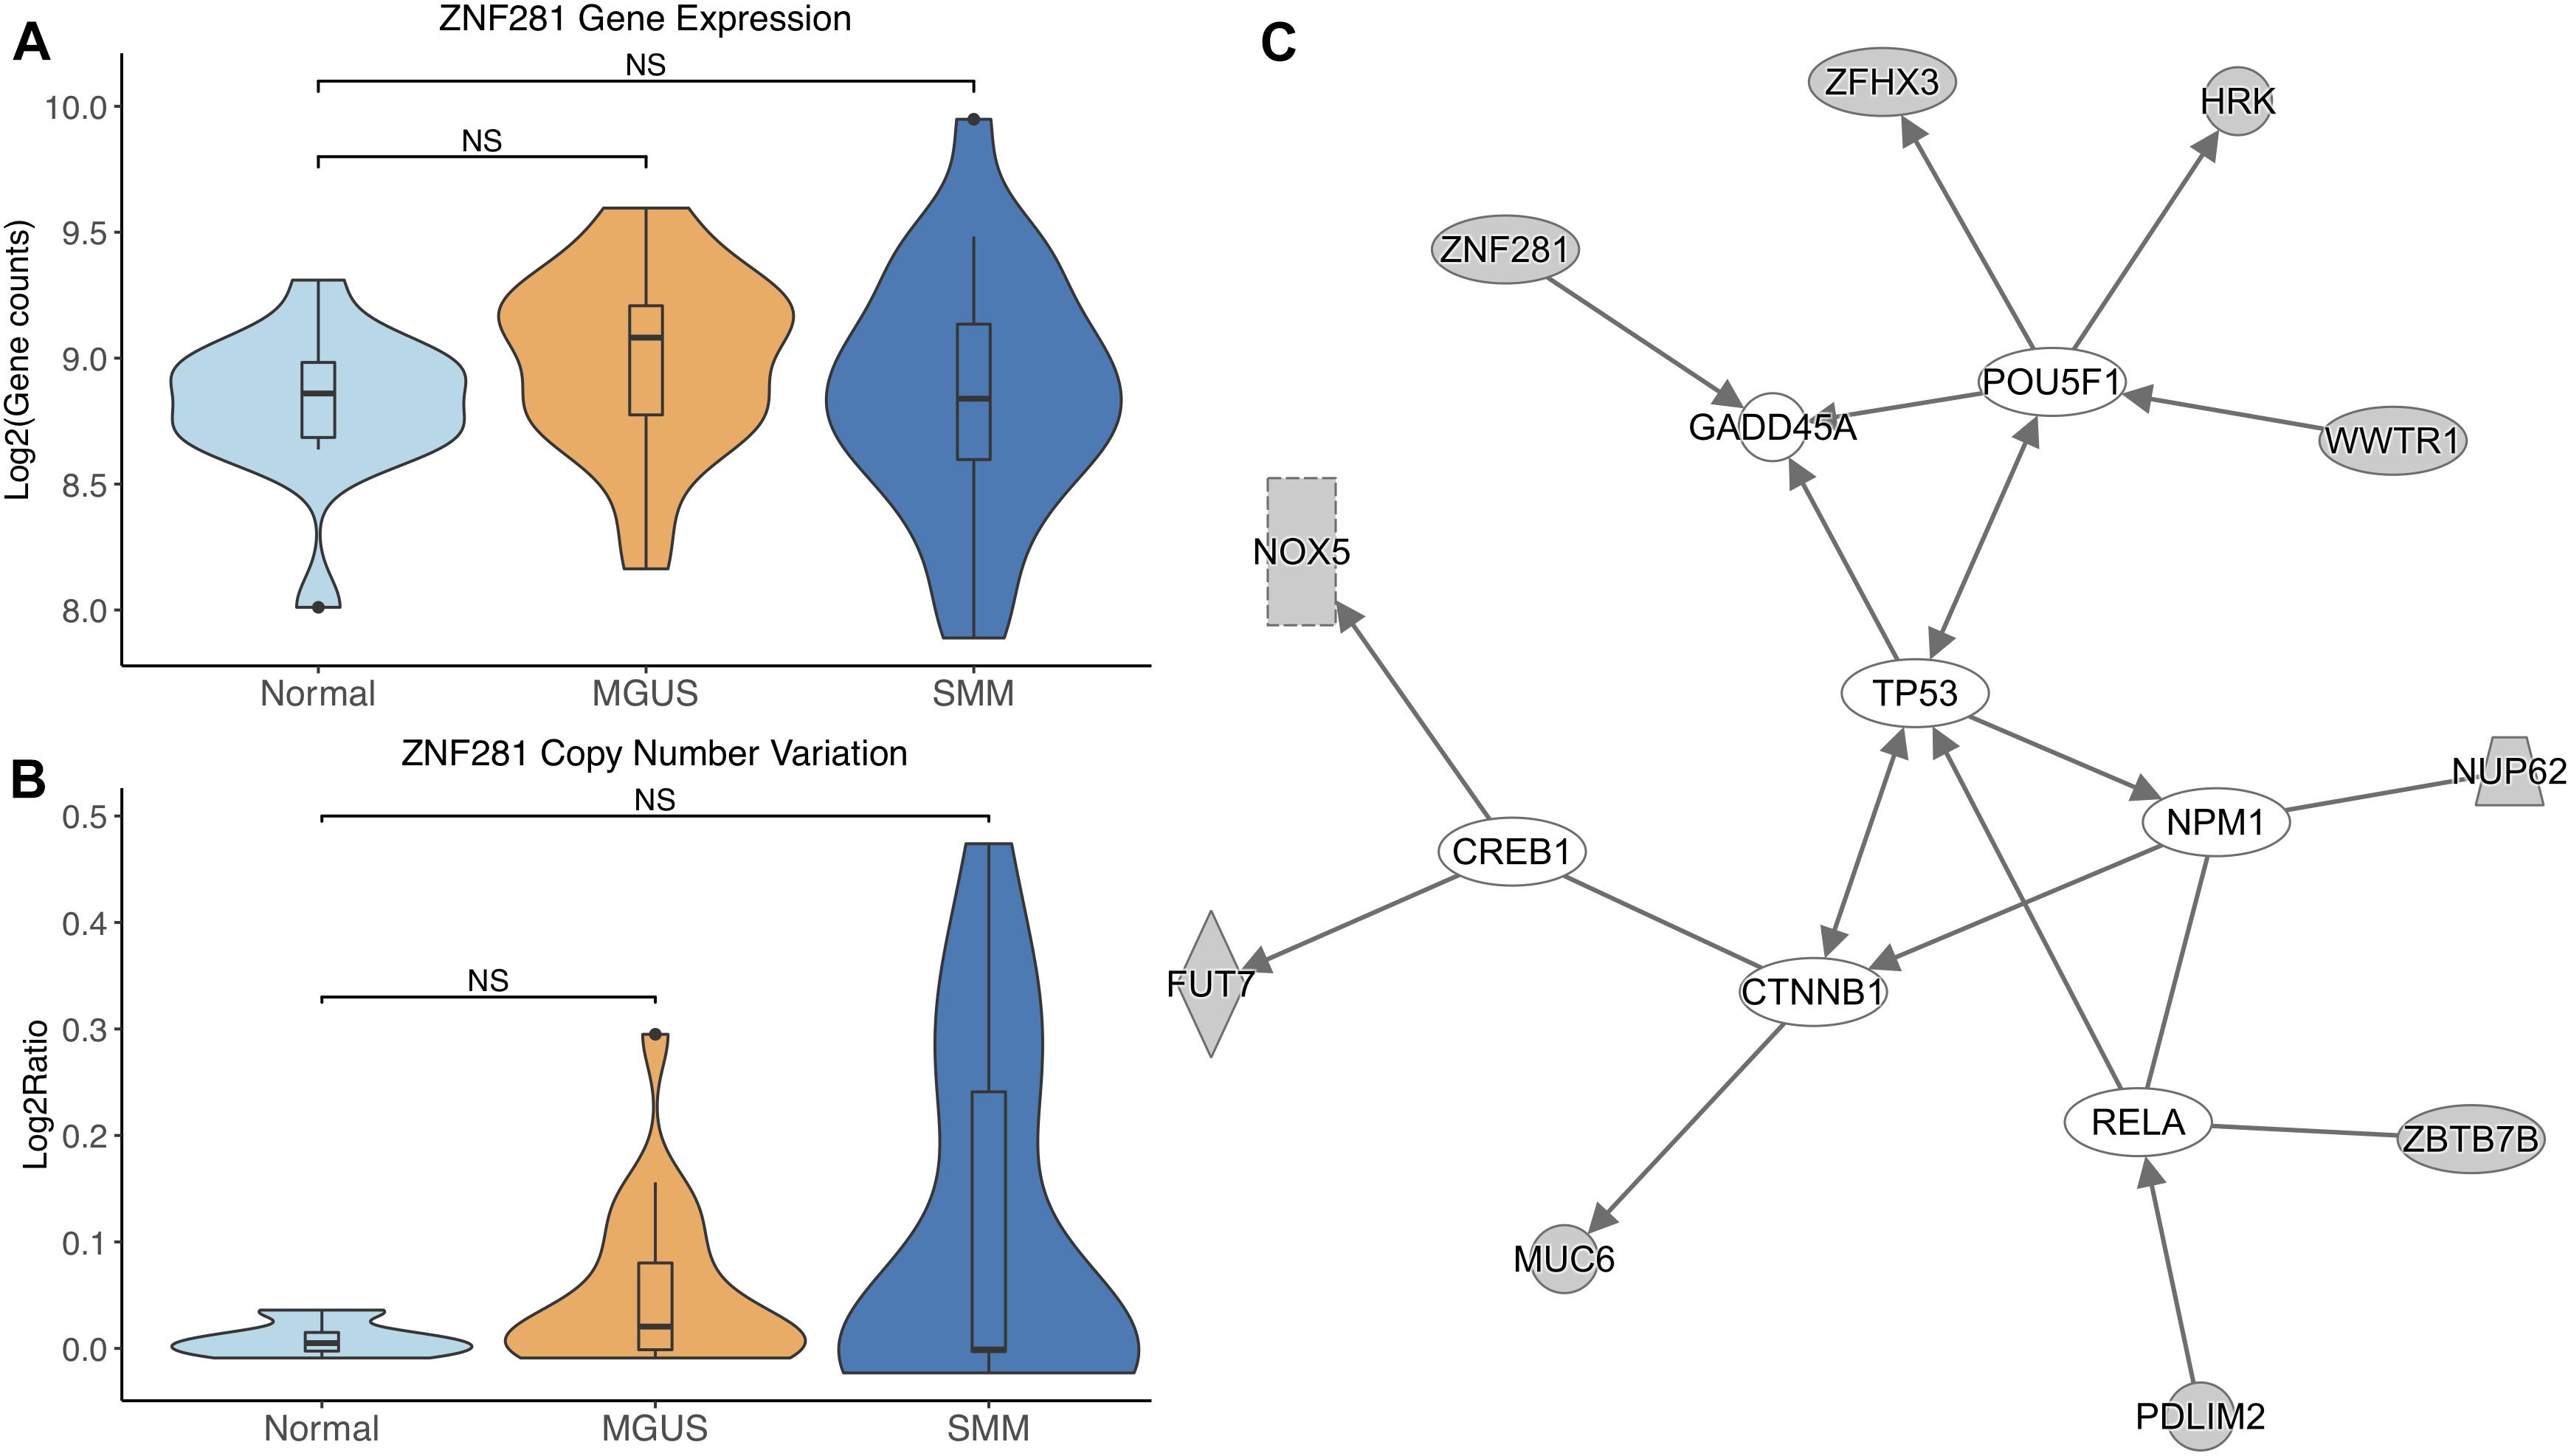
Figure 6. (A) ZNF281 expression across sample groups. Mann–Whitney tests between groups showed no significant difference. (B) Observations of ZNF281 copy number. Mann–Whitney tests showed no significant differences between any groups. (C) A predicted interaction network of ZNF281 and its downstream targets. The gray nodes indicate genes from our module and the white nodes are gene interactions defined in IPA. Solid lines between nodes indicate a direct interaction supported by the Ingenuity Knowledge Base. Significance levels: ∗p ≤ 0.05; ∗∗p ≤ 0.01; ∗∗∗p ≤ 0.001.
IPA network analysis showed MAX and its targets interact with other TFs CCNT1, KLF10, and MYC. MAX is further predicted to target CCNG2 and TXNIP. BRD4 is shown to regulate expression of BHLHE40 and SLC7A2 (Figure 3C).
ZNF148 and its targets were shown to interact with TFs TP53, FOXO1, SP1, TCF3, HSF1, SMARCA4, and E2F1. Additionally, CDKN1A was shown to be a common target of the TFs listed above (Figure 4C).
TCF4 and its targets were shown to interact with TFs RUNX2, CCND1, and HNF4A in addition to nuclear receptor PPARG and junction protein JUP (Figure 5C).
ZNF281 and its targets were shown to interact with TFs CREB1, CTNNB1, RELA, NPM1, and POU5F1. ZNF281 was shown to directly target GADD45A. TP53 was shown to be an intermediate interactor that connected each subnetwork (Figure 6C).
We conducted GCN analyses on two publicly available MM datasets and identified four TFs by a condition-specific method. This pipeline has previously not been applied to studying MM precursors. Our approach identified TFs expressed in condition-specific gene modules in publicly available MM data. We then validated our TFs with CNV data taken from a third publicly available dataset, looking for genes located on chromosomal segments that showed a consistent trend in aberration from normal to SMM and identified four TFs: MAX, ZNF148, TCF4, and ZNF281.
The gene module that MAX belongs to was determined to be condition-specific in normal samples. This means that the genes in the module were observed to be co-expressed in normal samples and less so in MGUS and SMM samples. This suggests that MAX is dysregulated in MGUS and SMM, which we observed to be true in the CNV data. MAX is known to complex with MYC to regulate transcription (Kato et al., 1992) and MYC is commonly known to be constitutively active in MM. The MAX–MYC relationship has been targeted in previous studies to inhibit c-MYC activity in MM cell lines (Holien et al., 2012). This association appears to conflict with our data, which shows the chromosomal region of MAX deleted in some MGUS and SMM samples and decreased gene expression in some SMM samples. An alternate explanation can be found in studies that show MYC can function independently of MAX in pheochromocytoma and small cell lung cancer (Ribon et al., 1994; Romero et al., 2014). MAX-independent expression of MYC in MM and its precursors requires further investigation; a recent abstract identified MAX as a tumor suppressor driver gene in MM (Garcia et al., 2017), which is a promising start.
ZNF148 has been implicated in other MM studies (Magrangeas et al., 2003; Dong et al., 2015), but to our knowledge, none have directly associated this gene with MGUS or SMM. The associated chromosomal segment of ZNF148 was progressively amplified from normal to MGUS and to SMM, corresponding with increased ZNF148 gene expression. This suggests that this TF is involved as a driver in disease progression earlier than previously thought.
TCF4 was differentially overexpressed in MGUS and SMM compared to normal. TCF4 was not significantly amplified in MGUS, although this may be due to small sample size. We suggest that copy number amplification may play a part in TCF4 dysregulation and may be involved in the initiation of MGUS but not SMM. This reasoning is due to the observation that the TCF4 region is solely amplified in MGUS whereas there is a mix of amplified and deleted regions in SMM. This is consistent with our identification of TCF4’s gene module as MGUS-specific. Module enrichment and network analysis suggest Wnt signaling through TCF4 contributes to RUNX2 and CCND1 overexpression. RUNX2 overexpression has been shown to be a driver of MM progression (Li et al., 2014; Trotter et al., 2015). CCND1 overexpression has typically been observed to occur in MM precursors with chromosomal 11 and 14 translocations (Miura et al., 2003; Zhan et al., 2006). In gastric cancer, CCND1 has been shown to directly interact with TCF4 through the Wnt signaling pathway (Zheng et al., 2018), suggesting that other mechanisms of CCND1 overexpression may also occur in MM.
ZNF281 was increasingly amplified from MGUS to SMM patients. However, this is not considered statistically significant, possibly due to small sample size. Module enrichment results suggest transcriptional genes are more active in SMM, consistent with the fact that cancer cells require continued transcription in order to grow and proliferate. Increased transcription increases the chances of mutations in the DNA, which would activate tumor suppressor p53 and lead to cell cycle arrest or apoptosis in normal functioning cells. Cancer cells commonly have mutated TP53 to avoid transcriptional control and apoptosis. However, TP53 mutations are relatively rare in newly diagnosed MM patients (Chng et al., 2007b; Abdi et al., 2017). Our IPA network analysis suggests that TP53 may be regulated by CTNNB1. A previous study showed CTNNB1 suppressed TP53 in smooth muscle cells during artery formation (Riascos-Bernal et al., 2016). Something similar may be occurring in MM.
As previously observed by the original authors (López-Corral et al., 2012), the incidence of CNVs progressively increased from normal to MGUS and to SMM. Our analysis with Rawcopy identified similar regions of amplification and deletion from normal to MGUS and from MGUS to SMM. While not all the chromosomal regions were considered statistically different in the original study, it is visually striking how the frequency of chromosomal aberrations increase in patients from MGUS to SMM. The chromosomal regions of our identified TFs exhibited copy number changes. We suggest that these copy number alterations affect gene expression to an extent. The limitation is that we cannot offer direct evidence for this, therefore we suggest further exploration of this relationship in the laboratory.
There are other limitations to our study we should acknowledge. We filtered our gene lists down to 12,000–15,000 genes out of ∼22,000 and ∼54,000 microarray probes and identified TFs that showed consistent trends across groups. We may have removed or overlooked genes that could also play a part in myelomagenesis or progression. Although we inferred potential biological mechanisms of the four TFs from literature, the clinical significance of these genes remains to be investigated. Further research can be conducted to assess the pertinence of our TFs in addition to integrating other data modalities into more analyses. Despite these drawbacks, the biological details for these genes appear to have a relevant role in MM initiation and progression.
In conclusion, we interrogated the role that TFs have in MM progression using a pipeline of GCN analysis, condition-specific gene module selection, TF enrichment analysis, and CNV analysis. We identified the TFs MAX, ZNF148, TCF4, and ZNF281 from gene expression data and validated that their CNVs change from normal to MGUS and SMM. We examined the biological relevance of these TFs in MM and suggest further study of these genes in the laboratory.
KH and CY conceptualized the study. CY analyzed and interpreted the multiple myeloma data and was the major contributor in writing the manuscript. TJ, SX, and ZHu contributed to the design of the experiments and data interpretation. MA and XZ critically reviewed the manuscript. ZHa and KH gave research direction.
The funding for this study was partially supported by the NLM grant (4 T15 LM 11270-5), Indiana University Precision Health Initiative, and NCI ITCR U01 CA188547.
The authors declare that the research was conducted in the absence of any commercial or financial relationships that could be construed as a potential conflict of interest.
The authors thank Dr. Jie Zhang for her suggestions on module analyses and Ms. Megan Metzger for proofreading the manuscript.
The Supplementary Material for this article can be found online at: https://www.frontiersin.org/articles/10.3389/fgene.2019.00468/full#supplementary-material
FIGURE S1 | Sample identity distograms of SMM samples produced by Rawcopy. (A) Distogram including GSM777173 that suggests this sample has some relatedness to other samples. (B) Distogram after removing GSM777173.
FIGURE S2 | Gene-wise correlation heatmap of the two most highly similar modules in (A) lmQCM (n = 224) and (B) WGCNA (n = 393). The correlation coefficients are the absolute value of the Spearman correlation. The median correlation coefficient is higher in lmQCM (0.403) compared to WGCNA (0.344). SCC, Spearman correlation coefficient.
FIGURE S3 | Gene-wise correlation heatmap of a normal-specific gene module. The genes in the module were identified by lmQCM in the normal samples. Gene-wise correlation coefficients are calculated from gene expression in each respective condition: (A) Normal, (B) MGUS, and (C) SMM. The correlation coefficients are the absolute value of the Spearman correlation. The genes are more correlated in normal samples and decrease in correlation in MGUS and SMM samples. The CCI values are 0.697, 0.226, and 0.252, respectively. SCC, Spearman correlation coefficient.
TABLE S1 | GO BP enrichment results identified by enrichR. The most relevant enrichment terms are included along with the enrichment size and p-value associated with the corresponding dataset.
Abdi, J., Rastgoo, N., Li, L., Chen, W., and Chang, H. (2017). Role of tumor suppressor p53 and micro-RNA interplay in multiple myeloma pathogenesis. J. Hematol. Oncol. 10:169. doi: 10.1186/s13045-017-0538-4
Bengtsson, H., Neuvial, P., and Speed, T. P. (2010). TumorBoost: normalization of allele-specific tumor copy numbers from a single pair of tumor-normal genotyping microarrays. BMC Bioinform. 11:245. doi: 10.1186/1471-2105-11-245
Broyl, A., Hose, D., Lokhorst, H., Knegt, Y., de Peeters, J., Jauch, A., et al. (2010). Gene expression profiling for molecular classification of multiple myeloma in newly diagnosed patients. Blood 116, 2543–2553. doi: 10.1182/blood-2009-12-261032
Chng, W. J., Kumar, S., VanWier, S., Ahmann, G., Price-Troska, T., Henderson, K., et al. (2007a). Molecular dissection of hyperdiploid multiple myeloma by gene expression profiling. Cancer Res. 67, 2982–2989. doi: 10.1158/0008-5472.CAN-06-4046
Chng, W. J., Price-Troska, T., Gonzalez-Paz, N., Wier, S. V., Jacobus, S., Blood, E., et al. (2007b). Clinical significance of TP53 mutation in myeloma. Leukemia 21, 582–584. doi: 10.1038/sj.leu.2404524
Davies, F. E., Dring, A. M., Li, C., Rawstron, A. C., Shammas, M. A., O’Connor, S. M., et al. (2003). Insights into the multistep transformation of MGUS to myeloma using microarray expression analysis. Blood 102, 4504–4511. doi: 10.1182/blood-2003-01-0016
Dhodapkar, M. V., Sexton, R., Waheed, S., Usmani, S., Papanikolaou, X., Nair, B., et al. (2014). Clinical, genomic, and imaging predictors of myeloma progression from asymptomatic monoclonal gammopathies (SWOG S0120). Blood 123, 78–85. doi: 10.1182/blood-2013-07-515239
Dong, L., Chen, C. Y., Ning, B., Xu, D. L., Gao, J. H., Wang, L. L., et al. (2015). Pathway-based network analysis of myeloma tumors: monoclonal gammopathy of unknown significance, smoldering multiple myeloma, and multiple myeloma. Genet. Mol. Res. 14, 9571–9584. doi: 10.4238/2015.August.14.20
Garcia, S. B., Ruiz-Heredia, Y., Via’, M. D., Gallardo, M., Garitano-Trojaola, A., Zovko, J., et al. (2017). Role of MAX as a tumor suppressor driver gene in multiple myeloma. Blood 130:4347.
Han, Z., Zhang, J., Sun, G., Liu, G., and Huang, K. (2016). A matrix rank based concordance index for evaluating and detecting conditional specific co-expressed gene modules. BMC Genom. 17:519. doi: 10.1186/s12864-016-2912-y
Holien, T., Våtsveen, T. K., Hella, H., Waage, A., and Sundan, A. (2012). Addiction to c-MYC in multiple myeloma. Blood 120, 2450–2453. doi: 10.1182/blood-2011-08-371567
Johnson, D. C., Weinhold, N., Mitchell, J. S., Chen, B., Kaiser, M., Begum, D. B., et al. (2016). Genome-wide association study identifies variation at 6q25.1 associated with survival in multiple myeloma. Nat. Commun. 7:10290. doi: 10.1038/ncomms10290
Kais, Z., Barsky, S. H., Mathsyaraja, H., Zha, A., Ransburgh, D. J. R., He, G., et al. (2011). KIAA0101 interacts with BRCA1 and regulates centrosome number. Mol. Cancer Res. 9, 1091–1099. doi: 10.1158/1541-7786.MCR-10-0503
Kato, G. J., Lee, W. M., Chen, L. L., and Dang, C. V. (1992). Max: functional domains and interaction with c-Myc. Genes Dev. 6, 81–92. doi: 10.1101/gad.6.1.81
Kuleshov, M. V., Jones, M. R., Rouillard, A. D., Fernandez, N. F., Duan, Q., Wang, Z., et al. (2016). Enrichr: a comprehensive gene set enrichment analysis web server 2016 update. Nucleic Acids Res. 44, W90–W97. doi: 10.1093/nar/gkw377
Kyle, R. A., Remstein, E. D., Therneau, T. M., Dispenzieri, A., Kurtin, P. J., Hodnefield, J. M., et al. (2007). Clinical course and prognosis of smoldering (asymptomatic) multiple myeloma. N. Engl. J. Med. 356, 2582–2590. doi: 10.1056/NEJMoa070389
Kyle, R. A., Therneau, T. M., Rajkumar, S. V., Larson, D. R., Plevak, M. F., Offord, J. R., et al. (2006). Prevalence of monoclonal gammopathy of undetermined significance. N. Engl. J. Med. 354, 1362–1369. doi: 10.1056/NEJMoa054494
Kyle, R. A., Therneau, T. M., Rajkumar, S. V., Offord, J. R., Larson, D. R., Plevak, M. F., et al. (2002). A long-term study of prognosis in monoclonal gammopathy of undetermined significance. N. Engl. J. Med. 346, 564–569. doi: 10.1056/NEJMoa01133202
Landgren, O., Kyle, R. A., Pfeiffer, R. M., Katzmann, J. A., Caporaso, N. E., Hayes, R. B., et al. (2009). Monoclonal gammopathy of undetermined significance (MGUS) consistently precedes multiple myeloma: a prospective study. Blood 113, 5412–5417. doi: 10.1182/blood-2008-12-194241
Langfelder, P., and Horvath, S. (2008). WGCNA: an R package for weighted correlation network analysis. BMC Bioinform. 9:559. doi: 10.1186/1471-2105-9-559
Li, M., Trotter, T. N., Peker, D., Rowan, P. D., Qianying, P., Larry, S. J., et al. (2014). Myeloma cell-derived Runx2 promotes myeloma progression and bone-homing. Blood 124, 724–724. doi: 10.1182/blood-2014-12-613968
Liu, Z., Huang, J., Zhong, Q., She, Y., Ou, R., Li, C., et al. (2017). Network-based analysis of the molecular mechanisms of multiple myeloma and monoclonal gammopathy of undetermined significance. Oncol. Lett. 14, 4167–4175. doi: 10.3892/ol.2017.6723
López-Corral, L., Corchete, L. A., Sarasquete, M. E., Mateos, M. V., García-Sanz, R., Fermiñán, E., et al. (2014). Transcriptome analysis reveals molecular profiles associated with evolving steps of monoclonal gammopathies. Haematologica 99, 1365–1372. doi: 10.3324/haematol.2013.087809
López-Corral, L., Sarasquete, M. E., Beà, S., García-Sanz, R., Mateos, M. V., Corchete, L. A., et al. (2012). SNP-based mapping arrays reveal high genomic complexity in monoclonal gammopathies, from MGUS to myeloma status. Leukemia 26, 2521–2529. doi: 10.1038/leu.2012.128
Magrangeas, F., Nasser, V., Avet-Loiseau, H., Loriod, B., Decaux, O., Granjeaud, S., et al. (2003). Gene expression profiling of multiple myeloma reveals molecular portraits in relation to the pathogenesis of the disease. Blood 101, 4998–5006. doi: 10.1182/blood-2002-11-3385
Mayrhofer, M., Viklund, B., and Isaksson, A. (2016). Rawcopy: improved copy number analysis with Affymetrix arrays. Sci. Rep. 6:36158. doi: 10.1038/srep36158
Miao, L., Yin, R.-X., Pan, S.-L., Yang, S., Yang, D.-Z., and Lin, W.-X. (2018). Weighted gene co-expression network analysis identifies specific modules and hub genes related to hyperlipidemia. Cell. Physiol. Biochem. 48, 1151–1163. doi: 10.1159/000491982
Mikulasova, A., Wardell, C. P., Murison, A., Boyle, E. M., Jackson, G. H., Smetana, J., et al. (2017). The spectrum of somatic mutations in monoclonal gammopathy of undetermined significance indicates a less complex genomic landscape than that in multiple myeloma. Haematologica 102, 1617–1625. doi: 10.3324/haematol.2017.163766
Mitchell, J. S., Li, N., Weinhold, N., Försti, A., Ali, M., van Duin, M., et al. (2016). Genome-wide association study identifies multiple susceptibility loci for multiple myeloma. Nat. Commun. 7:12050. doi: 10.1038/ncomms12050
Miura, K., Iida, S., Hanamura, I., Kato, M., Banno, S., Ishida, T., et al. (2003). Frequent occurrence of CCND1 deregulation in patients with early stages of plasma cell dyscrasia. Cancer Sci. 94, 350–354. doi: 10.1111/j.1349-7006.2003.tb01445.x
Ng, A. Y., Jordan, M. I., and Weiss, Y. (2001). “). On spectral clustering: analysis and an algorithm,” in Proceedings of the 14th International Conference on Neural Information Processing Systems: Natural and Synthetic NIPS’01, (Cambridge, MA: MIT Press), 849–856.
Olshen, A. B., Bengtsson, H., Neuvial, P., Spellman, P. T., Olshen, R. A., and Seshan, V. E. (2011). Parent-specific copy number in paired tumor-normal studies using circular binary segmentation. Bioinformatics 27, 2038–2046. doi: 10.1093/bioinformatics/btr329
Rajkumar, S. V., Dimopoulos, M. A., Palumbo, A., Blade, J., Merlini, G., Mateos, M.-V., et al. (2014). International myeloma working group updated criteria for the diagnosis of multiple myeloma. Lancet Oncol. 15, e538–e548. doi: 10.1016/S1470-2045(14)70442-5
Riascos-Bernal, D. F., Chinnasamy, P., Cao, L. L., Dunaway, C. M., Valenta, T., Basler, K., et al. (2016). β-Catenin C-terminal signals suppress p53 and are essential for artery formation. Nat. Commun. 7:12389. doi: 10.1038/ncomms12389
Ribon, V., Leff, T., and Saltiel, A. R. (1994). c-Myc does not require max for transcriptional activity in PC-12 cells. Mol. Cell. Neurosci. 5, 277–282. doi: 10.1006/mcne.1994.1032
Romero, O. A., Torres-Diz, M., Pros, E., Savola, S., Gomez, A., Moran, S., et al. (2014). MAX inactivation in small cell lung cancer disrupts MYC–SWI/SNF programs and is synthetic lethal with BRG1. Cancer Discov. 4, 292–303. doi: 10.1158/2159-8290.CD-13-0799
Shao, W., Cheng, J., Sun, L., Han, Z., Feng, Q., Zhang, D., et al. (2018). Ordinal Multi-modal Feature Selection for Survival Analysis of Early-Stage Renal Cancer. Cham: Springer, 648–656.
Shaughnessy, J. D., Zhan, F., Burington, B. E., Huang, Y., Colla, S., Hanamura, I., et al. (2007). A validated gene expression model of high-risk multiple myeloma is defined by deregulated expression of genes mapping to chromosome 1. Blood 109, 2276–2284. doi: 10.1182/blood-2006-07-038430
She, X., Cheng, Z., Zöllner, S., Church, D. M., and Eichler, E. E. (2008). Mouse segmental duplication and copy number variation. Nat. Genet. 40, 909–914. doi: 10.1038/ng.172
Supek, F., Bošnjak, M., Škunca, N., and Šmuc, T. (2011). REVIGO summarizes and visualizes long lists of gene ontology terms. PLoS One 6:e21800. doi: 10.1371/journal.pone.0021800
Trotter, T. N., Li, M., Pan, Q., Peker, D., Rowan, P. D., Li, J., et al. (2015). Myeloma cell–derived Runx2 promotes myeloma progression in bone. Blood 125, 3598–3608. doi: 10.1182/blood-2014-12-613968
Wang, X.-G., Peng, Y., Song, X.-L., and Lan, J.-P. (2016). Identification potential biomarkers and therapeutic agents in multiple myeloma based on bioinformatics analysis. Eur. Rev. Med. Pharmacol. Sci. 20, 810–817.
Xiang, S., Huang, Z., Wang, T., Han, Z., Yu, C. Y., Ni, D., et al. (2018). Condition-specific gene co-expression network mining identifies key pathways and regulators in the brain tissue of Alzheimer’s disease patients. BMC Med. Genom. 11:115. doi: 10.1186/s12920-018-0431-1
Yin, D.-X., Zhao, H.-M., Sun, D.-J., Yao, J., and Ding, D.-Y. (2015). Identification of candidate target genes for human peripheral arterial disease using weighted gene co-expression network analysis. Mol. Med. Rep. 12, 8107–8112. doi: 10.3892/mmr.2015.4450
Zhan, F., Barlogie, B., Arzoumanian, V., Huang, Y., Williams, D. R., Hollmig, K., et al. (2007). Gene-expression signature of benign monoclonal gammopathy evident in multiple myeloma is linked to good prognosis. Blood 109, 1692–1700. doi: 10.1182/blood-2006-07-037077
Zhan, F., Huang, Y., Colla, S., Stewart, J. P., Hanamura, I., Gupta, S., et al. (2006). The molecular classification of multiple myeloma. Blood 108, 2020–2028. doi: 10.1182/blood-2005-11-013458
Zhang, J., and Huang, K. (2016). Normalized lmQCM: an algorithm for detecting weak quasi-cliques in weighted graph with applications in gene co-expression module discovery in cancers. Cancer Inform. 13, 137–146. doi: 10.4137/CIN.S14021
Zhang, J., and Huang, K. (2017). Pan-cancer analysis of frequent DNA co-methylation patterns reveals consistent epigenetic landscape changes in multiple cancers. BMC Genom. 18:1045. doi: 10.1186/s12864-016-3259-0
Zhang, J., Lu, K., Xiang, Y., Islam, M., Kotian, S., Kais, Z., et al. (2012). Weighted frequent gene co-expression network mining to identify genes involved in genome stability. PLoS Comput. Biol. 8:e1002656. doi: 10.1371/journal.pcbi.1002656
Zhang, J., Xiang, Y., Ding, L., Keen-Circle, K., Borlawsky, T. B., Ozer, H. G., et al. (2010). Using gene co-expression network analysis to predict biomarkers for chronic lymphocytic leukemia. BMC Bioinform. 11(Suppl. 9):S5. doi: 10.1186/1471-2105-11-S9-S5
Keywords: multiple myeloma, MGUS, SMM, gene co-expression, copy number variation
Citation: Yu CY, Xiang S, Huang Z, Johnson TS, Zhan X, Han Z, Abu Zaid M and Huang K (2019) Gene Co-expression Network and Copy Number Variation Analyses Identify Transcription Factors Associated With Multiple Myeloma Progression. Front. Genet. 10:468. doi: 10.3389/fgene.2019.00468
Received: 01 December 2018; Accepted: 01 May 2019;
Published: 17 May 2019.
Edited by:
Victor Jin, The University of Texas Health Science Center at San Antonio, United StatesReviewed by:
Zhengqing Ouyang, The Jackson Laboratory for Genomic Medicine, United StatesCopyright © 2019 Yu, Xiang, Huang, Johnson, Zhan, Han, Abu Zaid and Huang. This is an open-access article distributed under the terms of the Creative Commons Attribution License (CC BY). The use, distribution or reproduction in other forums is permitted, provided the original author(s) and the copyright owner(s) are credited and that the original publication in this journal is cited, in accordance with accepted academic practice. No use, distribution or reproduction is permitted which does not comply with these terms.
*Correspondence: Kun Huang, a3VuaHVhbmdAaXUuZWR1
Disclaimer: All claims expressed in this article are solely those of the authors and do not necessarily represent those of their affiliated organizations, or those of the publisher, the editors and the reviewers. Any product that may be evaluated in this article or claim that may be made by its manufacturer is not guaranteed or endorsed by the publisher.
Research integrity at Frontiers
Learn more about the work of our research integrity team to safeguard the quality of each article we publish.