- 1Key Laboratory of Adaptation and Evolution of Plateau Biota, Northwest Institute of Plateau Biology, Chinese Academy of Sciences, Xining, China
- 2College of Life Science, University of Chinese Academy of Sciences, Beijing, China
- 3Qinghai Provincial Key Laboratory of Crop Molecular Breeding, Xining, China
Qinghai-Tibetan Plateau (QTP) is an important biodiversity hub, which is very sensitive to climate change. Here in this study, we investigated genetic diversity and past population dynamics of Lancea tibetica (Mazaceae), an endemic herb to QTP and adjacent highlands. We sequenced chloroplast and nuclear ribosomal DNA fragments for 429 individuals, collected from 29 localities, covering their major distribution range at the QTP. A total of 19 chloroplast haplotypes and 13 nuclear genotypes in two well-differentiated lineages, corresponding to populations into two groups isolated by Tanggula and Bayangela Mountains. Meanwhile, significant phylogeographical structure was detected among sampling range of L. tibetica, and 61.50% of genetic variations was partitioned between groups. Gene flow across the whole region appears to be restricted by high mountains, suggesting a significant role of geography in the genetic differences between the two groups. Divergence time between the two lineages dated to 8.63 million years ago, which corresponded to the uplifting of QTP during the late Miocene and Pliocene. Ecological differences were found between both the lineages represent species-specific characteristics, sufficient to keep the lineages separated to a high degree. The simulated distribution from the last interglacial period to the current period showed that the distribution of L. tibetica experienced shrinkage and expansion. Climate changes during the Pleistocene glacial-interglacial cycles had a dramatic effect on L. tibetica distribution ranges. Multiple refugia of L. tibetica might have remained during the species history, to south of the Tanggula and north of Bayangela Mountains, both appeared as topological barrier and contributed to restricting gene flow between the two lineages. Together, geographic isolation and climatic factors have played a fundamental role in promoting diversification and evolution of L. tibetica.
Introduction
The Qinghai-Tibetan Plateau (QTP) is one of the largest and youngest plateaus in the world, formed by several uplift events after the collision of the Indian tectonic plate with the Asian plate, about 40 Ma (million years ago) (Guo et al., 2002; Spicer et al., 2003). Further significant uplift of the QTP occurred during the periods of the East Asian summer and winter monsoons about 15 Ma (Wan et al., 2007), 10–8 Ma (Molnar et al., 1993; Harrison et al., 1995) and 3.6–2.6 Ma (Zhisheng et al., 2001). The monsoon system interacted with the glacial-interglacial cycle and produced a more variable monsoon climate during the Pleistocene (Zhisheng et al., 2001). In recent decades, considerable disagreement has arisen on the relation between the uplifting of the plateau and the East Asian monsoons. Some scholars suggest that the uplift of the QTP modified the global and East Asian climate dramatically (Bloemendal, 1989; Zhisheng et al., 2001) and triggered and intensified the Asian monsoon, which in turn strongly influenced biological processes in the region (Li and Fang, 1999). In contrast, other scholars, such as Renner (2016) and Spicer (2017), suggest that there was no obvious impact on the East Asian monsoon from the uplifting of the QTP, even they hold the opinion that uplift having reached average heights of 4–5 km since the mid-Eocene. However, these climatic oscillations did affect the demography of some species, leading to their range shifting or extinction. Furthermore, the harsh climate of this region may have improved the adaptability of some local organisms (Davis and Shaw, 2001; Hewitt, 2004; Wan et al., 2016).
Numerous endemic species occur in the QTP and adjacent highlands, which represent centers of the preservation of ancient species and the differentiation of young species (Wu, 1988; Myers et al., 2000; Liu et al., 2012). A popular but rarely proved hypothesis is that the uplift of mountains creates environmental conditions (such as dispersed barriers or new habitats) that increase the rate of speciation (Xing and Ree, 2017). However, several phylogeographic studies have shown that certain species may have retreated during the ice age to refugia located at edge of the QTP, and recolonized the QTP and the adjacent highlands after the ice age, e.g., Juniperus przewalskii (Zhang et al., 2005), Metagentiana striata (Chen et al., 2008), and Pedicularis longiflora (Yang et al., 2008). Recent studies on Aconitum gymnandrum (Wang et al., 2009), Hippophae rhamnoides (Jia et al., 2012), and Spiraea alpina (Gulzar et al., 2018) suggest that some species also survived in the QTP at high altitude during the glacial period. For those species, multiple refugia may have remained during the glacial period, some on the QTP and others on its edge (Liu et al., 2012). For every species that has been researched, there is a species-specific feature in their evolutionary histories, even in some closely related species, such as S. alpina and S. mongolica (Gulzar et al., 2018). Therefore, further phylogeographic studies of a wider range of species are necessary to improve and refine the model for differentiation and formation of species in the region.
According to the present taxonomical treatment, Lancea Hook. f. et Thoms. is a small genus of the Mazaceae with only two species, L. tibetica and L. hirsuta (Hong et al., 1998). As a traditional Tibetan medicinal plant, L. tibetica has been used in the treatment of leukemia, intestinal angina, heart disease, and cough (Song et al., 2011b). Phytochemical studies on L. tibetica suggest that it contains more than 71 compounds that have pharmacodynamic effects, including anti-tumor, antioxidant, and hypoglycemic-inhibiting activities (Song et al., 2011a; Liu et al., 2014, 2015). L. tibetica is a perennial species endemic to the QTP, widely distributed in alpine meadows at altitudes of 2,000–4,500 m (Hong et al., 1998). The generation time for L. tibetica is 2 years according to our preliminary field observations. Under the inferior living condition, local human harvest the wild populations puts extra pressure on L. tibetica threatened with extinction (Tian et al., 2016). In this study, by combining ecological niche modeling and molecular data, we investigated the historical, genealogical and promoted diversity of L. tibetica, to gain insights into its intraspecific divergence and spatiotemporal population dynamics. Our study provides an important advance in knowledge of the population dynamics of endemic species on the QTP.
Materials and Methods
Population Sampling and Experimental Protocols
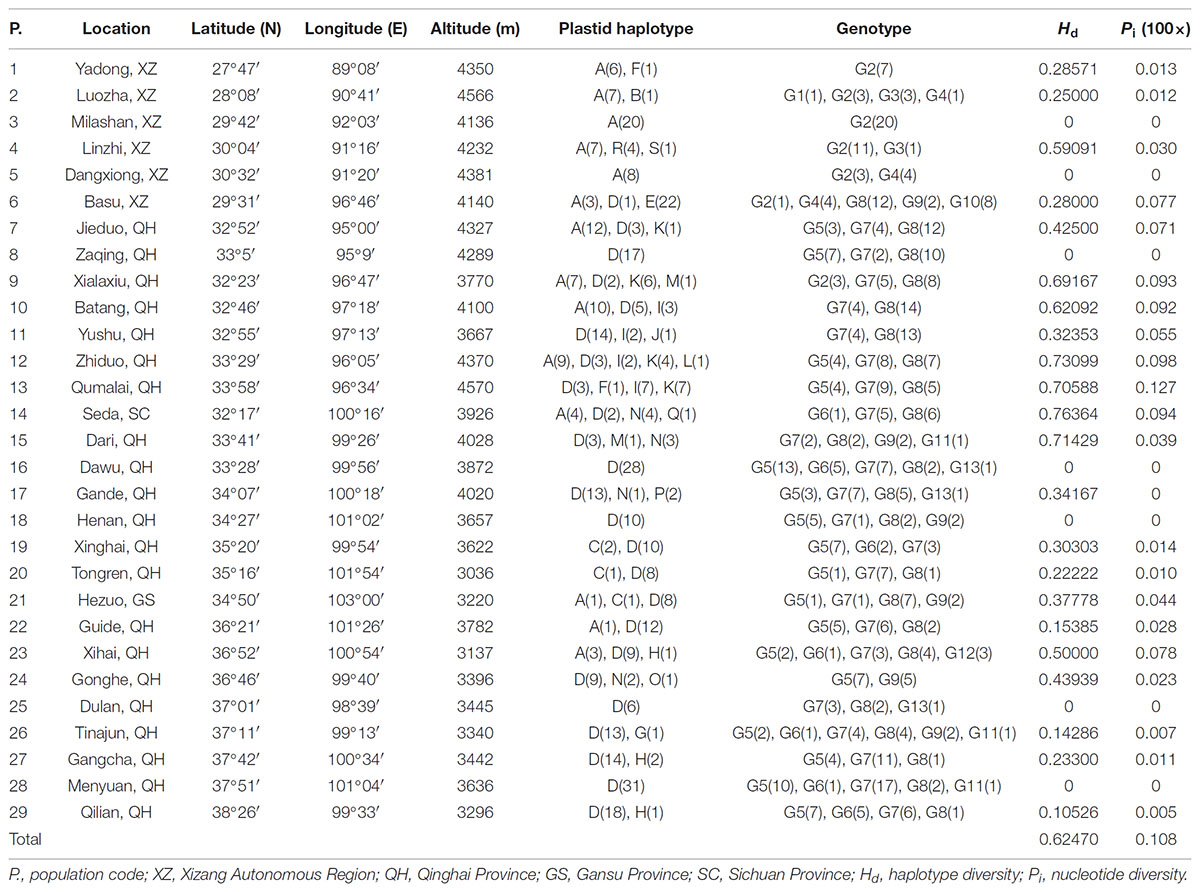
According to the Flora of China (Hong et al., 1998) and herbarium records from the Chinese Virtual Herbarium (CVH1), L. tibetica mainly occurs in Gansu, Qinghai, Sichuan, Xizang, and Yunnan in China. It should be noted that few CVH herbarium records of L. tibetica are mainly before the 1960s. Some locations with just one or two records are difficult to sample again in our field investigation. In this study, a total of 429 individuals were collected from 29 populations covering the major distribution range of L. tibetica (Table 1 and Figure 1). Fresh leaves were sampled, dried in silica gel and kept at -20°C until DNA extraction. Pedicularis rhinanthoides and P. chinensis were also sampled as outgroups (sample information may be found under the GenBank accession numbers MH628332–MH628339). All the sampling locations were geo-referenced, and voucher specimens deposited into the Herbarium of Northwest Plateau Institute of Biology (HNWP), Chinese Academy of Sciences.
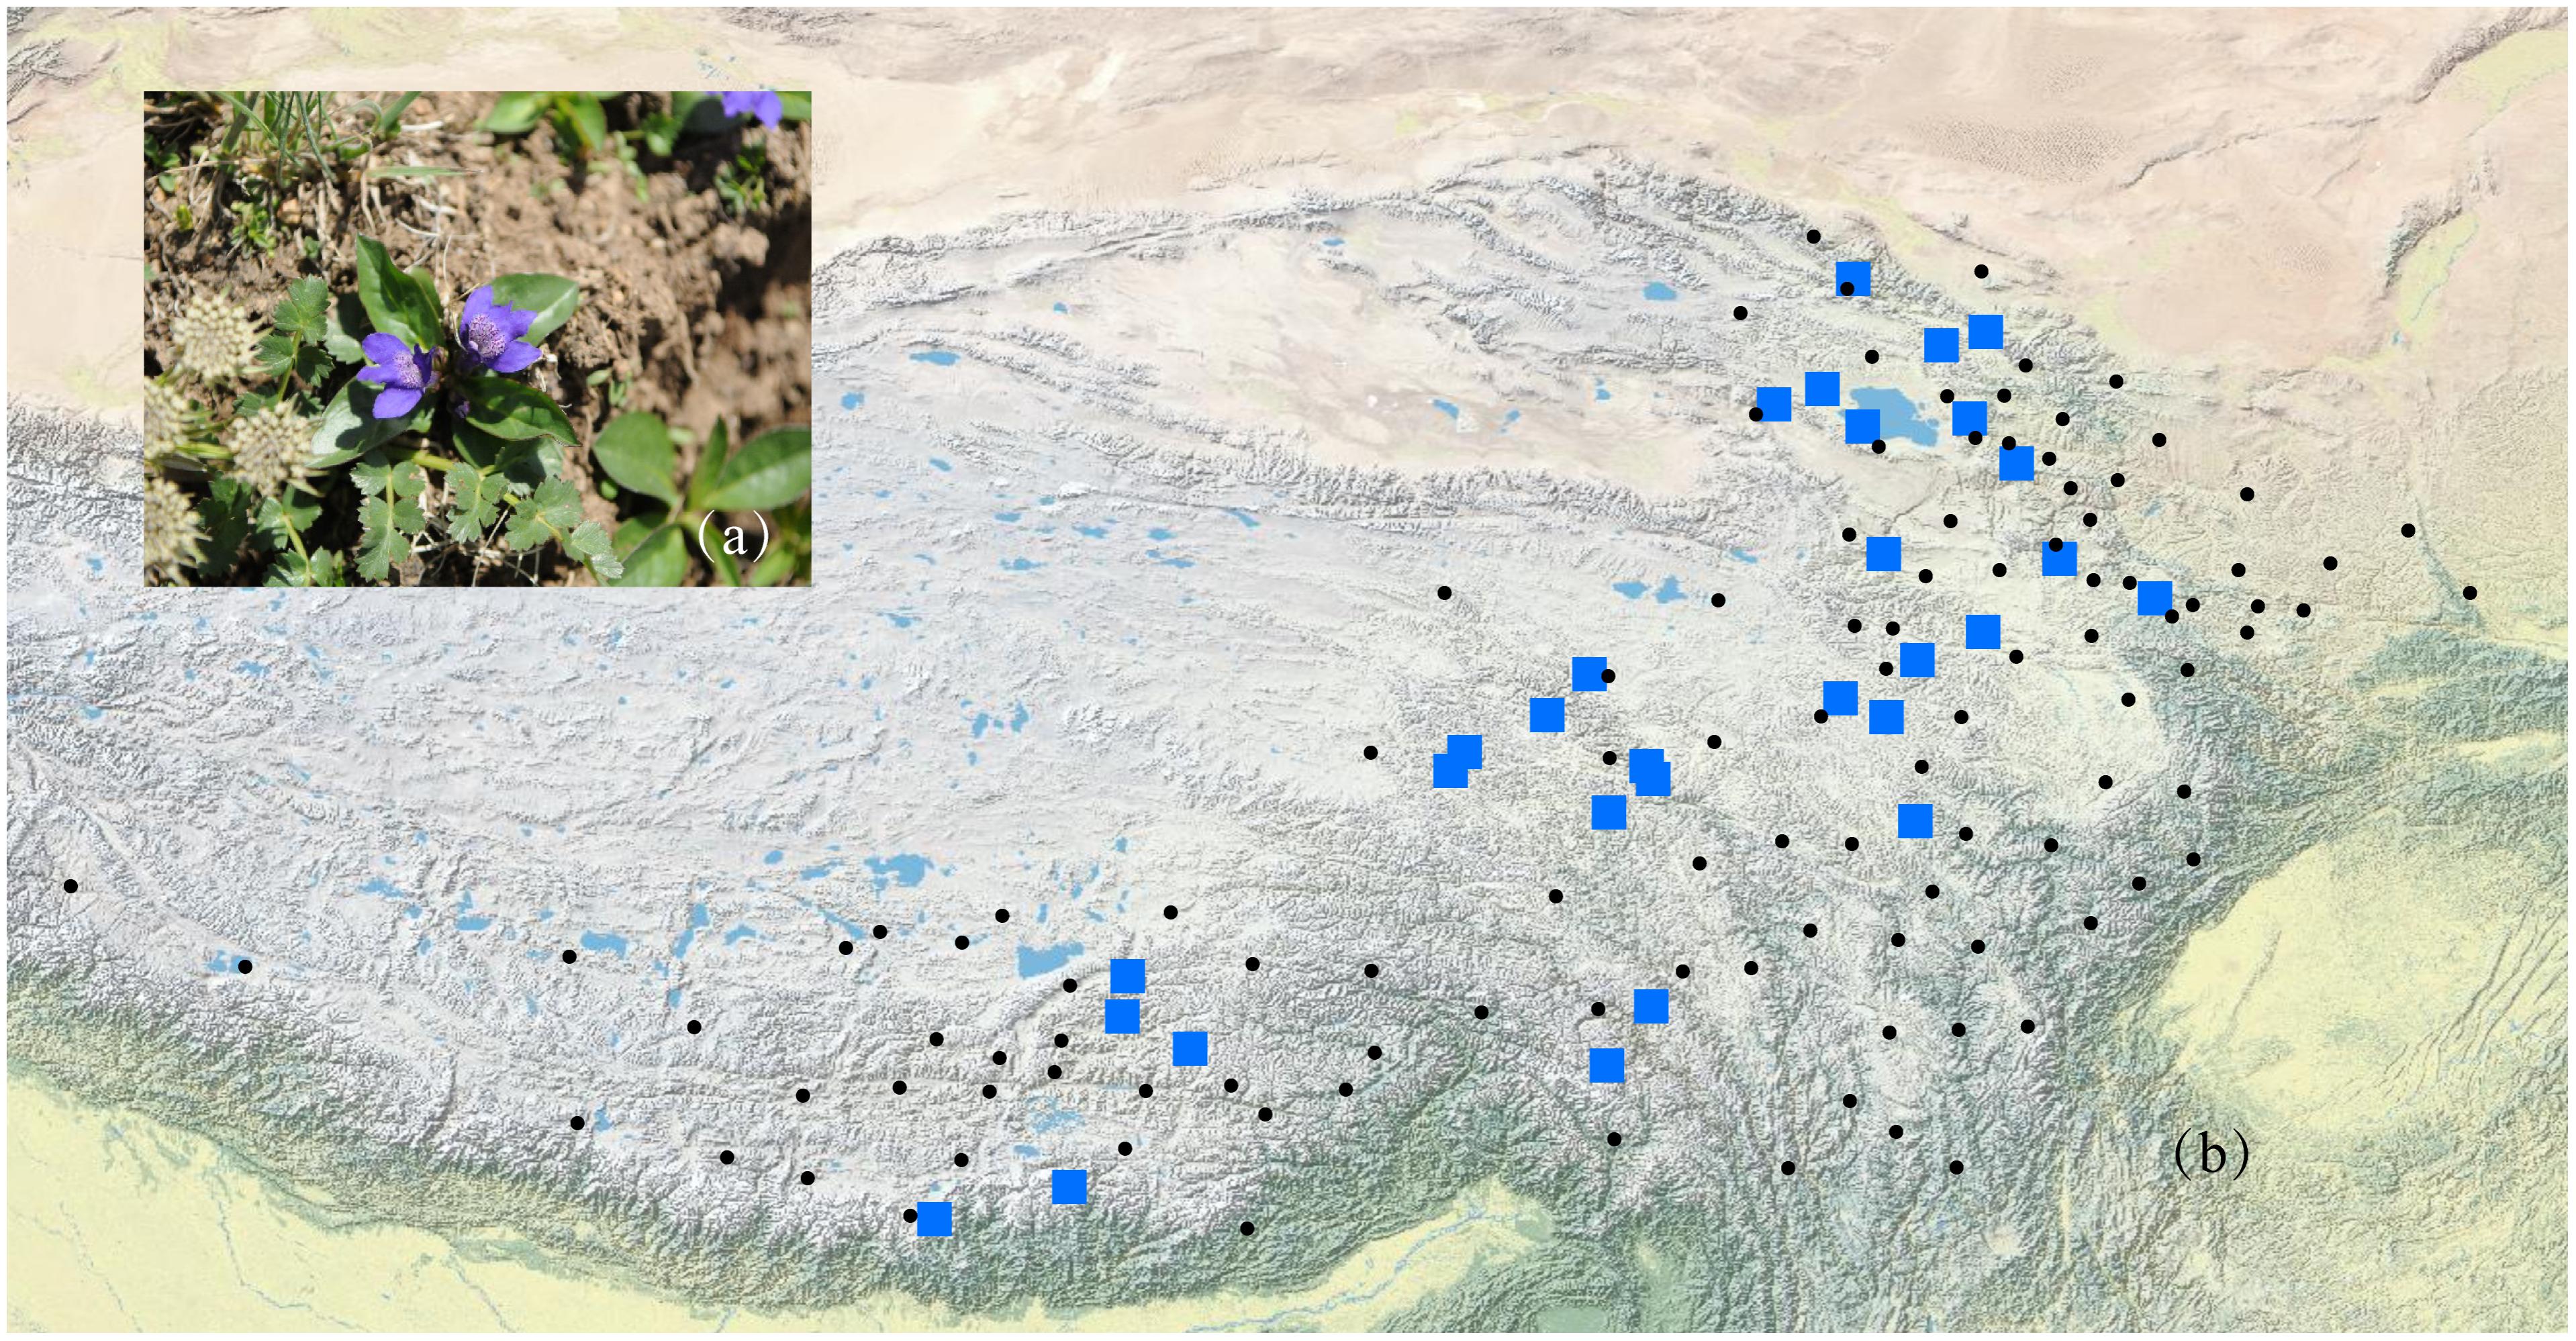
FIGURE 1. A photograph of L. tibetica plant (a) and a map of sampling coverage in this study (b). Black dots represent herbarium records in CVH, and blue squares represent sampled populations in this study.
Genomic DNA was extracted from approximately 20 mg of dried leaves using a modified cetyltrimethylammonium bromide (CTAB) method (Doyle, 1987). Four intergenic spacers of chloroplast DNA (cpDNA) (genes trnH-psbA, matK, trnL-F and rbcL) and two nuclear ribosomal internal transcribed spacer regions (ITS1 and ITS2) were amplified for all samples (White et al., 1990; Baldwin, 1992; Olmstead and Michaels, 1992; Sang et al., 1997). PCR amplification was performed using the following protocol: 25-μL reaction mixtures containing 30–50-ng genomic DNA, 2.5 μL of 10× PCR buffer (containing Mg2+), 1 μL of dNTPs (each 10 mM), 0.5 μL of each primer (50 μM), and 1 U of Taq DNA polymerase (Takara, China). The amplification temperature followed a profile of 95°C for 1 min; 30 cycles of 95°C for 30 s, 55°C for 30 s and 72°C for 1 min 30 s; extension at 72°C for 10 min. PCR products were sequenced with an ABI 377XL DNA sequencer (Applied Biosystems). The program CLUSTAL X (Thompson et al., 1997) was used to perform alignment of all the sequences and the alignment was checked manually in BioEdit v7.0.5 (Hall, 1999). All sequences have been deposited in GenBank under accession numbers MG818228–MG818245, MH605185–MH605197, and MH628332–MH628339.
Genetic Variation and Population Genetic Structure
During all analyses, insertion–deletion polymorphisms (indels) were coded as presence/absence characters. After alignment, cpDNA haplotypes and ITS genotypes were identified and distinguished using DnaSP v5.0 (Librado and Rozas, 2009). The level of genetic variation, total haplotype diversity (Hd) and nucleotide diversity (Pi) were also calculated in DnaSP. The program PERMUT (Pons and Petit, 1996) was used to estimate within-population diversity (HS), total gene diversity (HT), genetic differentiation (GST) and population subdivision of phylogenetically ordered alleles (NST) (Nei, 1987; Grivet and Petit, 2002). The GST value represents the degree of genetic differentiation among the population and was calculated as GST= (HT -HS)/HT (Raymond and Rousset, 1995). The U-statistical method was used to compare GST and NST (using 1,000 repeat replacement tests) and to check the geographical distribution pattern.
Population subdivision analysis was performed in the program SAMOVA v1.0 (Dupanloup et al., 2010), to define groups that are geographically homogeneous and genetically differentiated. The analysis used the data from cpDNA, run for K = 2–10, starting from 1,000 random initial conditions for each run, to obtain the maximal value of FCT for the most appropriate K-value and grouping method. Genetic differentiation based on cpDNA was estimated through analysis of molecular variance (AMOVA) as implemented in the program ARLEQUIN v3.5 (Excoffier and Lischer, 2010). To calculate the average effective gene flow, we used the formula Nm = ([1/FST]-1)/2. Genetic distances were estimated in ARLEQUIN with 1,000 permutation tests.
Phylogeny and Demographic History Based on cpDNA Sequences
Relationships among cpDNA haplotypes were constructed via a maximum-parsimony median-joining network using NETWORK 4.6 with default parameters (Bandelt et al., 1999). Phylogeny of cpDNA haplotypes was estimated using MrBayes 3.1.2 (Drummond et al., 2012). P. rhinanthoides and P. chinensis were selected as outgroups, as Pedicularis and Lancea were formerly in the same family Scrophulariaceae (Hong et al., 1998). The best-fitting GTR + G + I model was selected by MrModeltest 2.3 (Nylander, 2004) using the Akaike Information Criterion. For MrBayes, two independent Markov-chain Monte Carlo analyses for 100,000,000 generations were performed with a random starting tree. One cold and three heated chains were run simultaneously, with trees sampled every 1,000 generations, and discarding the first 25% as burn-in. FIGTREE 1.3.1 (Rambaut, 2009) was used to display the tree.
Tajima’s D and Fu’s FS statistics were calculated to test for evidence of range expansion (Tajima, 1989; Fu, 1997; Jaeger et al., 2005). A significant value for D or a significantly large negative value for FS may be the result of population expansion (ArisBrosou and Excoffier, 1996). To analyze the dynamic size of the populations, we performed mismatch distribution as implemented in ARLEQUIN. The observed and expected mismatch distribution of the sum of squared deviation (SSD) and Harpending’s raggedness index (HRI) were used as test statistics. A unimodal shape of the mismatch distribution provides evidence of sudden population expansion during the history of a species. All the tests were implemented in ARLEQUIN v3.01 (Rogers and Harpending, 1992) with 1,000 significant permutations. When the sudden expansion model was accepted, the formula τ = 2ut was used to estimate the age of expansion (t), where τ is the total number of mutations and u is the mutation rate per generation for the whole analyzed sequence. The value of u is calculated as u = μkg, where μ is the substitution rate per nucleotide site in 1 year, k is mean sequence length of the analyzed DNA region and g is the generation time of the plant. We used the substitution rates (2 × 10⁻⁹ s s-1 year-1) of cpDNA (Wolfe et al., 1987) to estimate the expansion time of both clades.
Divergence Time Analysis Based on ITS Sequences
There are few reports of fossil data of Lamiales, and only a few fossil records [Fraxinus L. (Call and Dilcher, 1992; Magallon, 2000); Catalpa Bur. (Meyer and Manchester, 1997)] are reliable (Manchester, 1999). Based on these fossil records, Nie et al. (2006) analyzed the divergence time of Lamiales, showed the divergence between Mazus reptans and L. tibetica was around 25 Ma. The sequence of M. reptans (LC027734) was used as the outgroup in analyzing ITS data (Nie et al., 2006). The GTR + I base substitution model was selected with a loose molecular clock model of the uncorrelated index in BEAST 1.5.0 (Drummond and Rambaut, 2007). The two independent models were analyzed and combined using LogCombiner v1.5.3. Convergence was traced using TRACER v1.7 (Rambaut et al., 2018). The program TreeAnnotator v1.5.3 (Rambaut et al., 2018) was used to summarize the maximum credible tree. Finally, a tree showing ages for each branch was displayed in FigTree v1.3.1 (Rambaut, 2009).
Ecological Niche Modeling
During the field work, the locations of the sampling sites were recorded using GPS (Table 1). To infer the potential geographic range and the effects of past climatic oscillations on L. tibetica through one complete glacial-interglacial cycle, we performed species distribution models based on current, mid-Holocene (6 ka), last glacial maximum (20 ka), and last interglacial (135 ka) periods (Otto-Bliesner et al., 2006). We simulated the species distribution models GBM: generalized boosted models (Ridgeway, 2004); SRE: surface range envelop (Busby, 1991); GLM: generalized linear model (Mccullagh and Nelder, 1989), CTA: classification tree analysis (Breiman et al., 1984); ANN: artificial neural network (Lecun and Bengio, 1996); FDA: flexible discriminant analysis (Hastie, 1994); MARS (Friedman, 1991); RF: random forests (Breiman, 2001); and MAXENT (Phillips et al., 2004) using R package biomod2 v3.1-64 (Thuiller et al., 2014), supported with additional packages rworld map, rgdal, dismo, and SDMTools. To evaluate the effectiveness of these algorithms we used TSS and ROC values >0.7 to assemble the raster layers using median values. A total of 13 bioclimatic variables were chosen (annual mean temperature, mean diurnal range, isothermality, temperature seasonality, maximum temperature of warmest month, minimum temperature of coldest month, temperature annual range, mean temperature of wettest quarter, mean temperature of driest quarter, mean temperature of warmest quarter, annual precipitation, precipitation of wettest month, and precipitation of driest month) with low correlation and high informativeness after a jackknife procedure on the 19 bioclimatic variables downloaded from the WorldClim database (Robert et al., 2005).
We selected the maximum entropy model and machine learning algorithm as implemented in MAXENT v3.3.3k (Phillips et al., 2006; Phillips and Dudík, 2008) to predict suitable climate models for both lineages. MAXENT can produce a useful model with a small sample size (Hernandez et al., 2006; Pearson et al., 2007; Wisz et al., 2008; Anderson and Gonzalez, 2011). We used all the 19 bioclimatic variables from 1950 to 2000, downloaded from the WorldClim database (Hijmans et al., 2005). In addition, we selected ten environmental variables (annual mean temperature, mean diurnal range, isothermality, maximum temperature of warmest month, minimum temperature of coldest month, mean temperature of driest quarter, mean temperature of warmest quarter, mean temperature of the coldest quarter, precipitation seasonality, precipitation of coldest quarter) to perform the tests. The restricted dataset was used to avoid including highly correlated variables and prevent potential overfitting (Peterson and Nakazawa, 2008). Model performance was evaluated by the area under the receiver operating characteristic curve (AUC) using the program MAXENT. We used a jackknife (or ‘leave-one-out’) procedure to train and test the model. Values between 0.7 and 0.9 indicated good discrimination (Swets, 1988).
To measure the niche similarity between lineages, we used ENMTools 1.3 (Warren et al., 2008, 2010) to calculate Schoener’s D and Warren’s I indices (Warren et al., 2008) and quantify niche overlap: a value of 0 means ecological niches do not overlap at all, and 1 means the habitats are estimated to be equally suitable for both lineages. The overlap test was performed in layers using the program MAXENT. A niche identity test was obtained based on 200 pseudo-replicates to generate a distribution of the expected values of each index. The significance of observed and expected indices were estimated using SPSS v20.0 (IBM Corp, 2013).
Results
Sequencing, Genetic Variation, and Population Genetic Structure
The total alignment length of four chloroplast gene regions (trnH-psbA, matK, trnL-F, and rbcL) in all individuals was 2,179 bp, included 14 substitutions and four indels (also coded as substitutions during analysis, Table 2). Based on those polymorphisms, we identified a total of 19 haplotypes (A–S), which were asymmetrically distributed across the 29 populations (Figure 2). The total estimated haplotype diversity (Hd) was 0.6247 and nucleotide diversity (Pi) was 0.00108 (Table 1). At the population level, the populations 9–15 showed a higher Hd and Pi. Haplotypes A and D were widely distributed in the south and north ranges, respectively (Figure 2). Populations 9, 10, and 12–15 showed higher haplotype and nucleotide diversities.
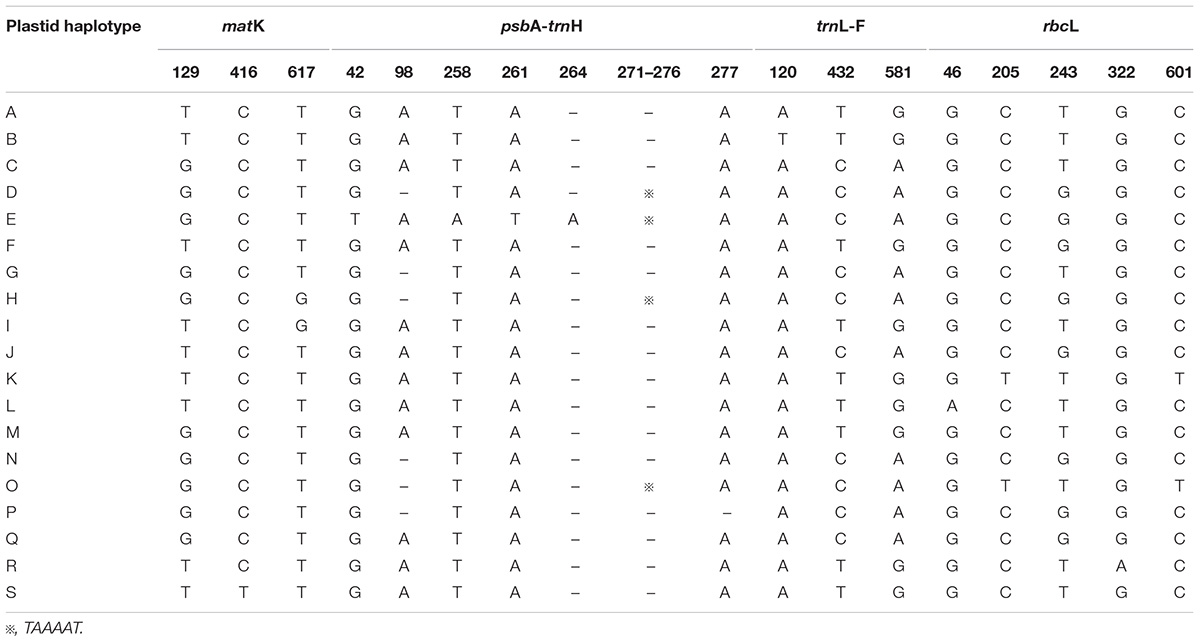
TABLE 2. Variable nucleotide sites in four chloroplast DNA fragments, allowing 19 haplotypes to be identified in L. tibetica.
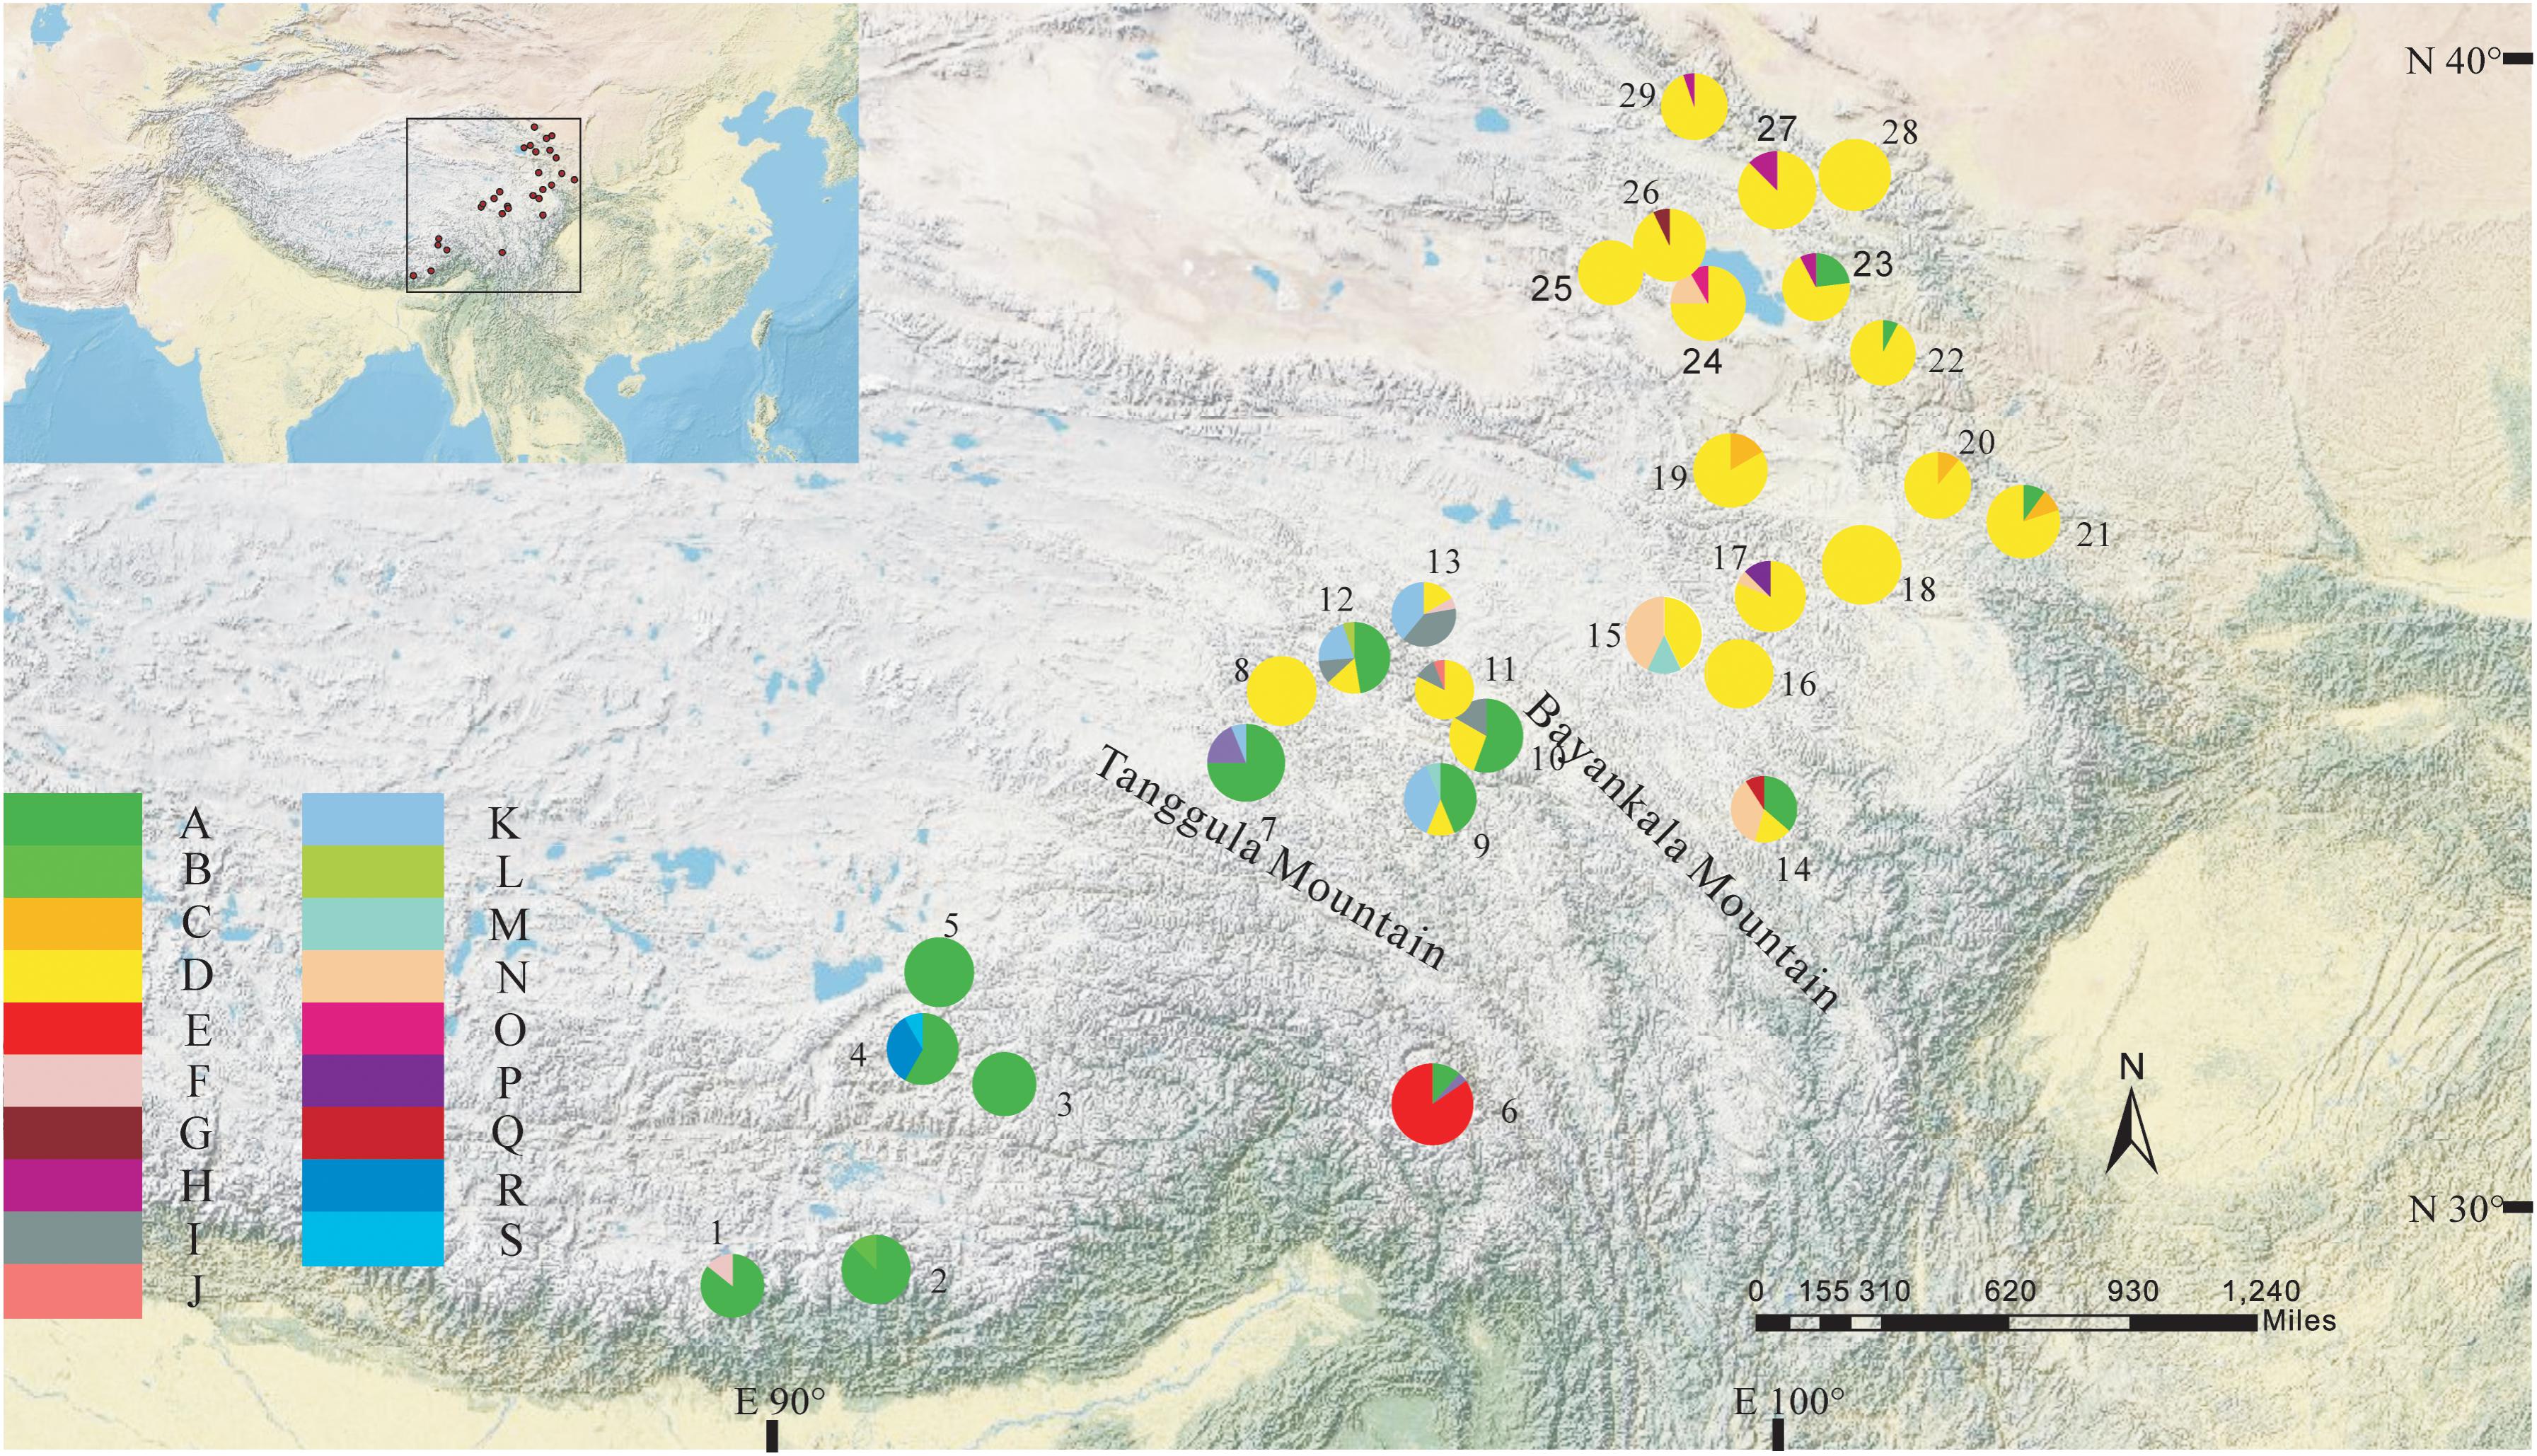
FIGURE 2. Geographic distribution of haplotypes detected from the combined cpDNA sequences of L. tibetica (population codes as detailed in Table 1).
The total alignment length of ITS in all individuals was 693 bp, which included eight substitutions that enabled us to identify thirteen genotypes (G1–G13; Table 3). In combination with the geographical distribution of L. tibetica, our results indicated that the G1–G4 genotypes were mainly distributed to the south of the Tanggula Mountains, while the other genotypes were found to the north (Figure 3).
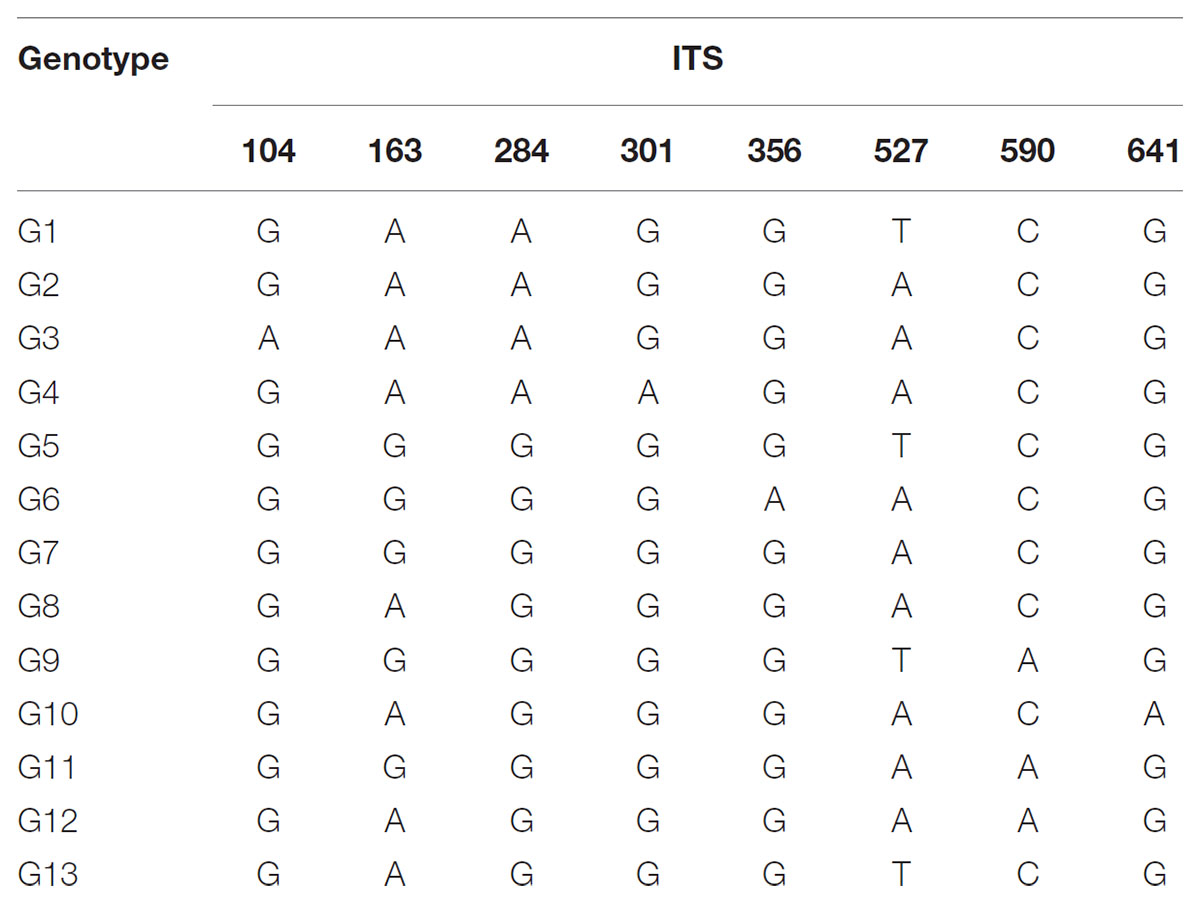
TABLE 3. Variable nucleotide sites in nuclear ribosomal internal transcribed spacer (ITS) sequences in 13 genotypes identified in L. tibetica.
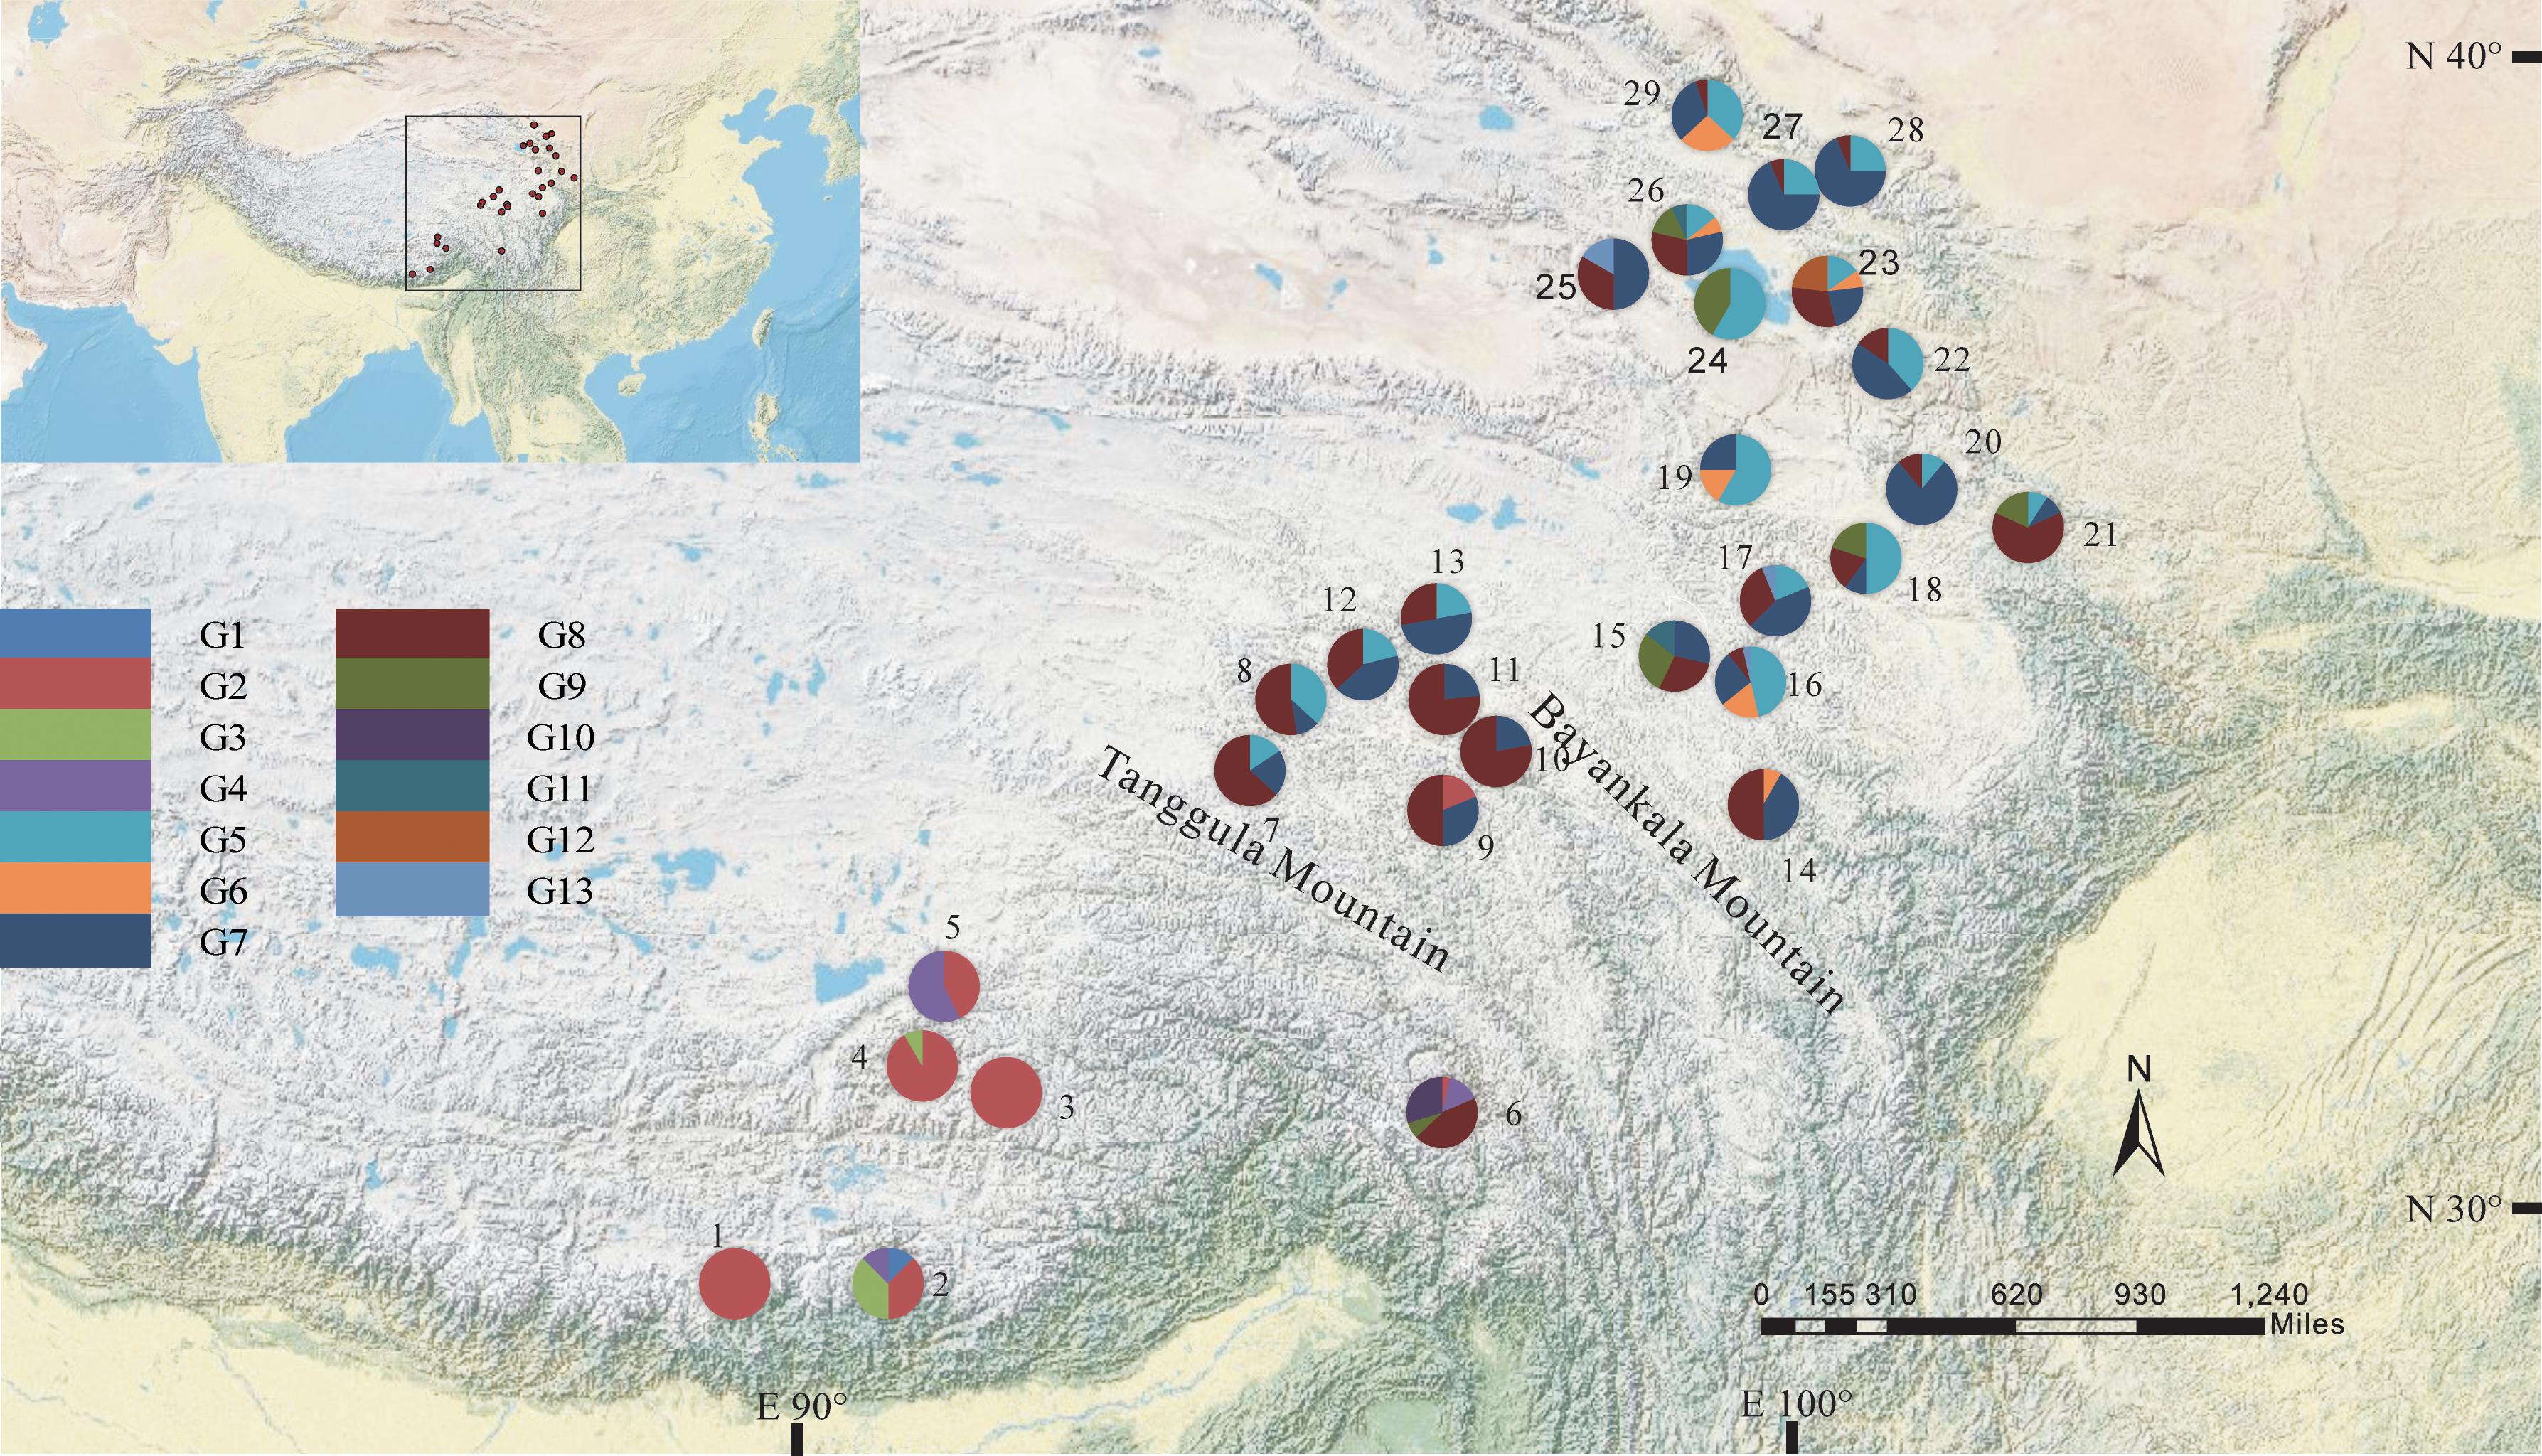
FIGURE 3. Geographic distribution of genotypes detected from the ITS sequences of L. tibetica (population codes as detailed in Table 1).
The program SAMOVA divided all the populations into two groups based on the chloroplast sequences, corresponding to the south and north lineages. The south lineage included populations 1–7, 9, 10, 12, and 13 while the north lineage included populations 8, 11, and 14–29, although the FCT was not the highest. The FCT values changed very little with increasing number of groups (K) and were highest at K = 5 when populations 6, 14, and 15 formed three groups (these populations had a high proportion of private haplotypes). The average genetic diversity (HS) was 0.311, while the total genetic diversity (HT) was 0.644. The NST (0.662) was significantly higher than GST (0.507), as shown by a U-test (P < 0.01), indicating significant phylogeographical structure in L. tibetica. AMOVA revealed that 61.50% of genetic variation was partitioned among groups, 15.50% among populations within the group, and 22.94% within populations (Table 4). Moreover, the average gene flow among the populations and between the two groups of L. tibetica was 0.249 and 0.149, respectively.
Phylogeny and Demographic History Based on cpDNA Sequences
The Bayesian inference tree topology of the 19 cpDNA haplotypes strongly supported the hypothesis of two lineages (south and north; Figure 4A). Haplotypes in the south lineage occurred in populations from the south of the QTP, and haplotypes in the north lineage occurred in populations from the north. The maximum-parsimony median-joining network also grouped all the cpDNA haplotypes into two major groups (south and north) separated by two mutational steps (Figure 4B).
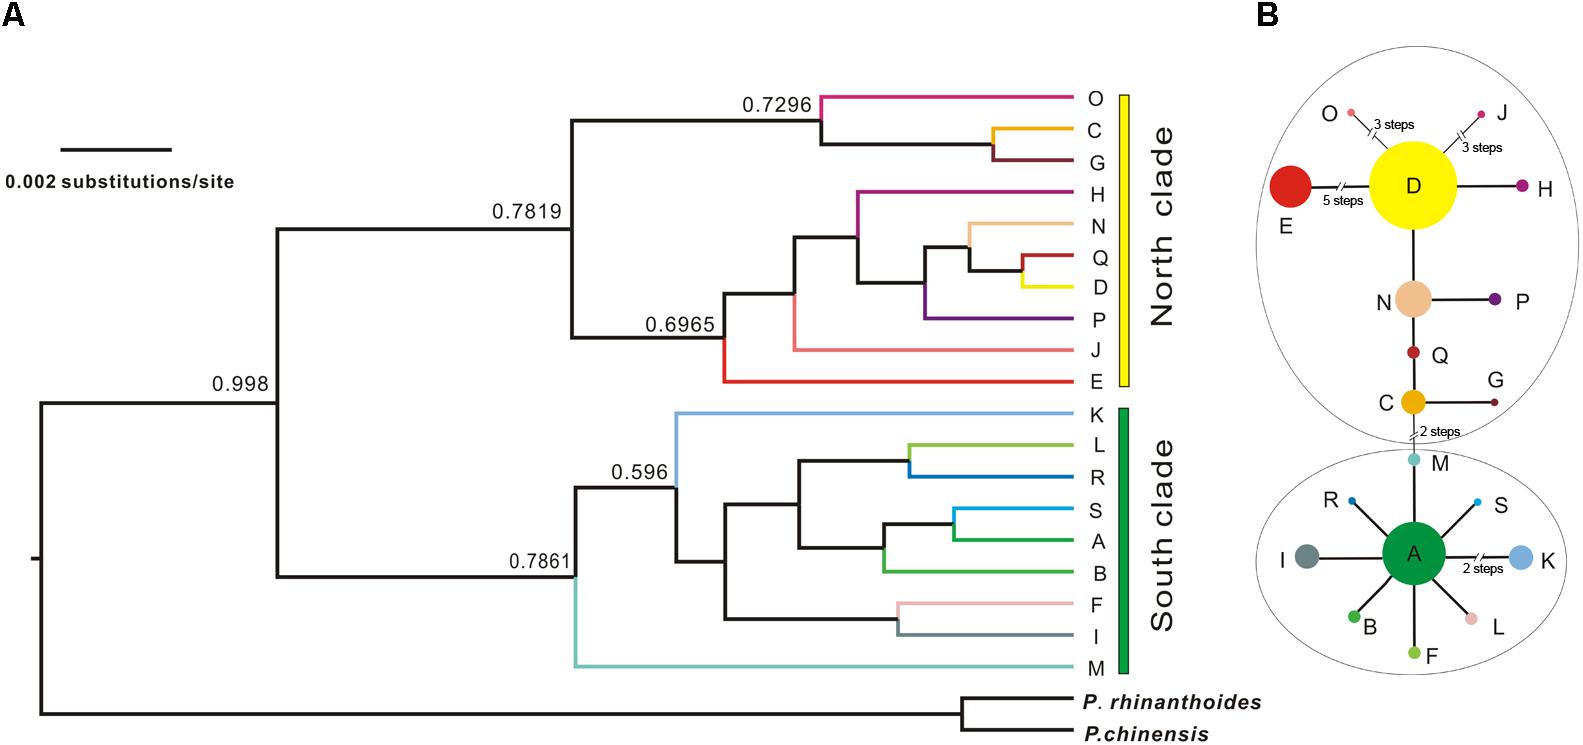
FIGURE 4. Bayesian tree of L. tibetica with P. rhinanthoides and P. chinensis as an outgroup, based on analysis of cpDNA sequences. (A) Bayesian tree of 19 L. tibetica lineages and two Pedicularis species: the numbers at the branches are posterior probability values. (B) maximum-parsimony median-joining network of the genealogical relationship among the 19 cpDNA haplotypes. Each circle denotes a single haplotype, shown with the area in proportion to its frequency. The numbers near the slashes across network branches indicate the number of mutational steps. The remaining branches represent single mutational steps.
The results of Tajima’s D and Fu’s FS was not significant. However, the observed mismatch distributions of haplotypes for each lineage failed to reject the spatial expansion model (SSD, HRag values P > 0.05; Table 5 and Figure 5). The observed mismatch distributions of the whole population rejected the spatial expansion model (SSD, HRag values P < 0.05; Table 5). Based on the range of the plastid DNA substitution rate, a haplotype sequence length of 2,179 bp and 2-year generation time, the expansion of the south lineage was estimated to have occurred at 0.727 Ma (with a confidence interval 0.024–1.412 Ma), and that of the north at 0.172 Ma (with a confidence interval 0.021–0.201 Ma).
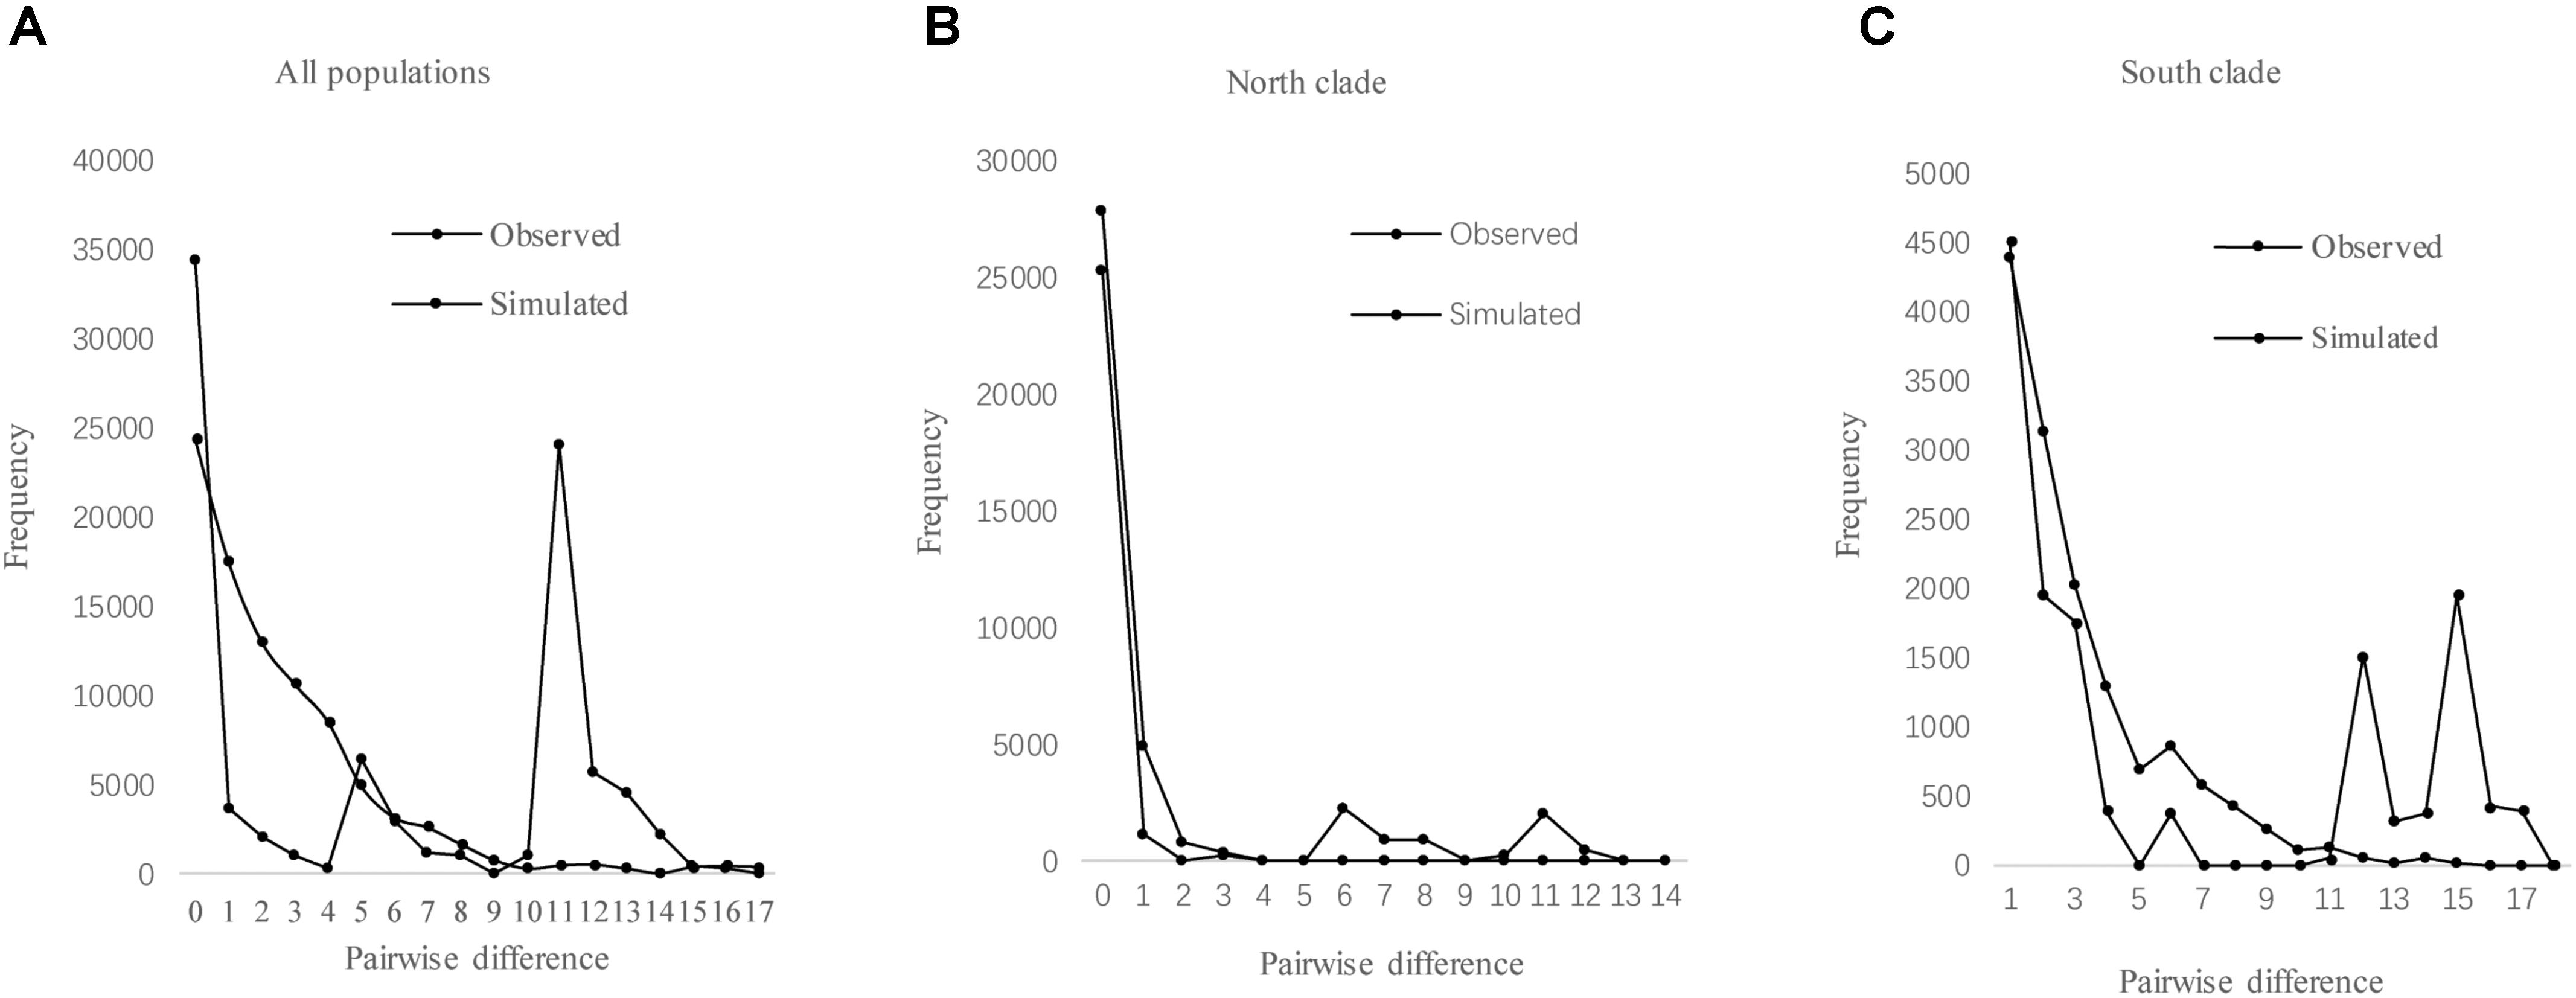
FIGURE 5. Mismatch distribution analysis for cpDNA sequence data of all populations (A), north clade (B), and south clade (C) in L. tibetica.
Divergence Time Analysis Based on ITS Sequences
According to preliminary calculations using ITS sequence data, L. tibetica diverged from M. reptans around 25 Ma, and the divergence of L. tibetica between the major north and south lineages was dated at around 8.63 Ma (Figure 6). These estimates of dates of origin need to be treated with caution but the estimated divergence times correspond well with the geological evidence of the QTP uplift during the late Miocene and Pliocene (Li and Fang, 1999; Zheng et al., 2000; Mulch and Chamberlain, 2006).
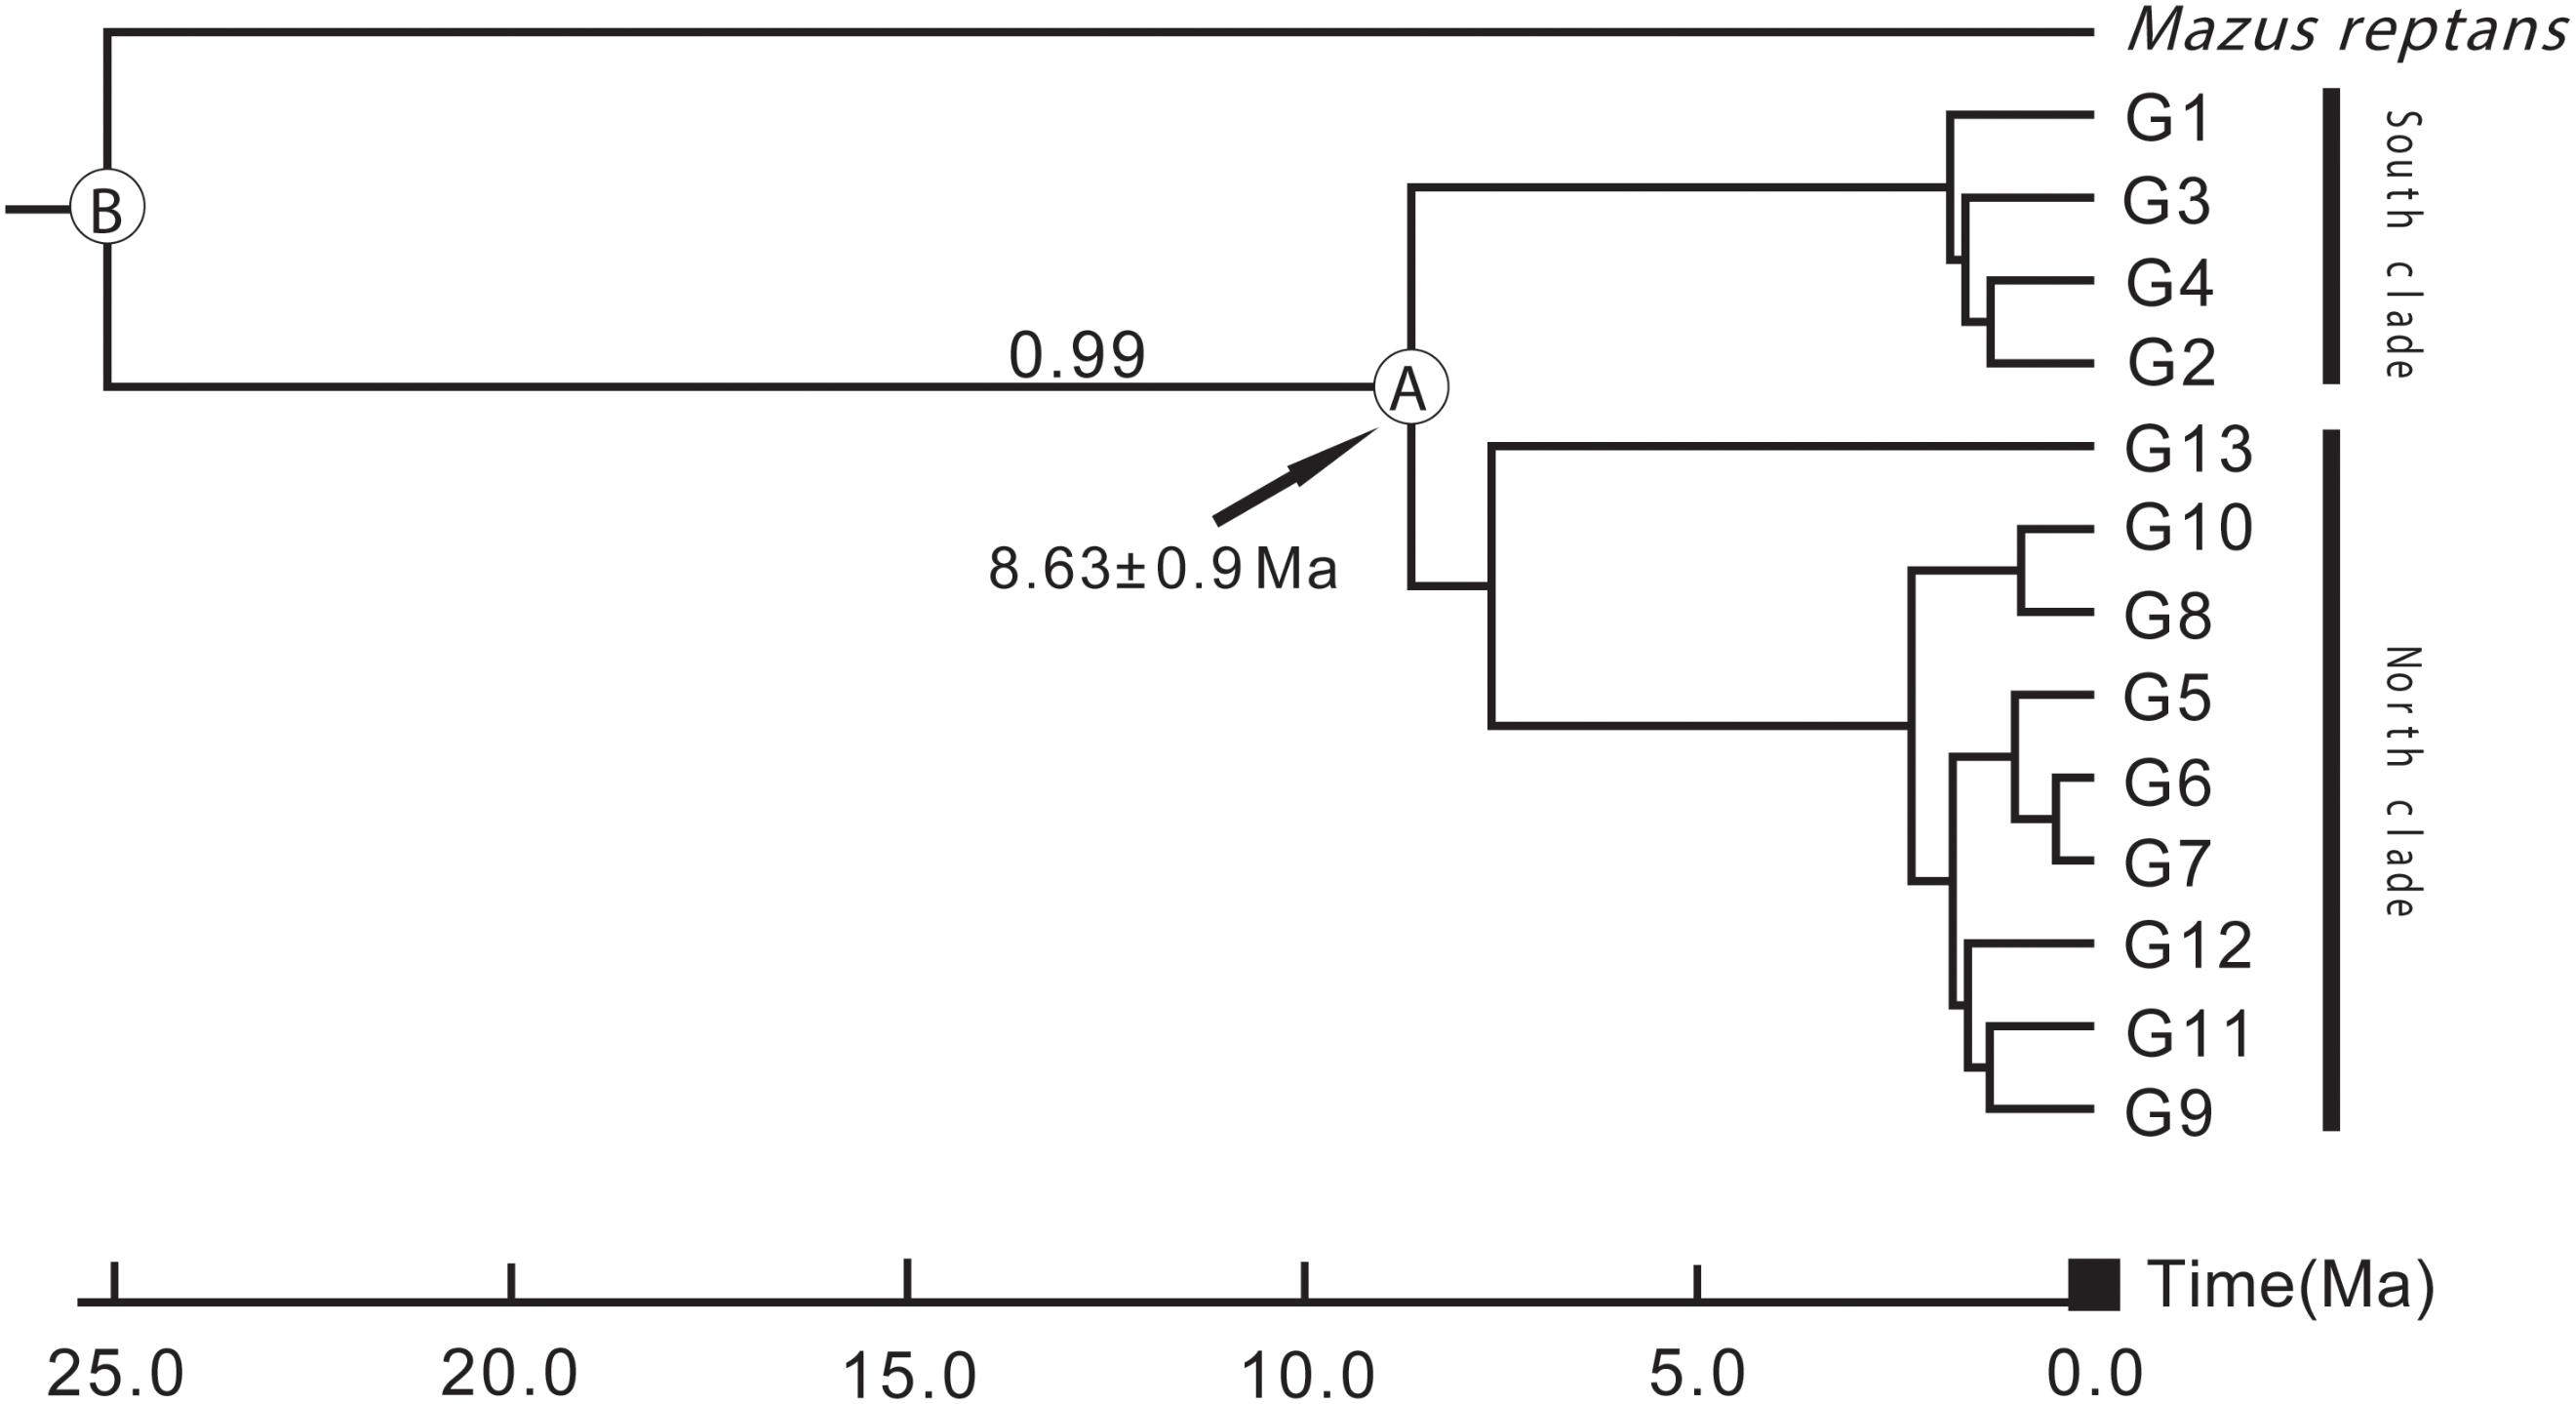
FIGURE 6. Divergence time between the major north and south lineages of L. tibetica, based on analysis of internal transcribed spacer regions. B indicates the divergence time of L. tibetica from M. reptans, and A indicates the divergence time between the north and south lineages.
Ecological Niche Modeling
The predicted distribution of L. tibetica underwent significant changes during the glacial-interglacial period (Figure 7). From the last interglacial maximum to the last glacial maximum to the mid-Holocene, the range of the predicted distribution of L. tibetica experienced successive reduction and expansion. There was no significant change from the mid-Holocene to the current period (Figure 7). The AUC values for ecological niche modeling of the north and south lineages were 0.986 and 0.960, respectively, indicating far better than a random prediction. A test of identity between the two lineages showed that there was distinct niche differentiation (P < 0.05). A background test of both lineages also showed that the ecological niches of the two lineages are well differentiated (Figures 8a,c,d). Values of Schoener’s D and Warren’s I indices suggested significant niche divergence between the south and north lineages (P < 0.05, Figure 8b).
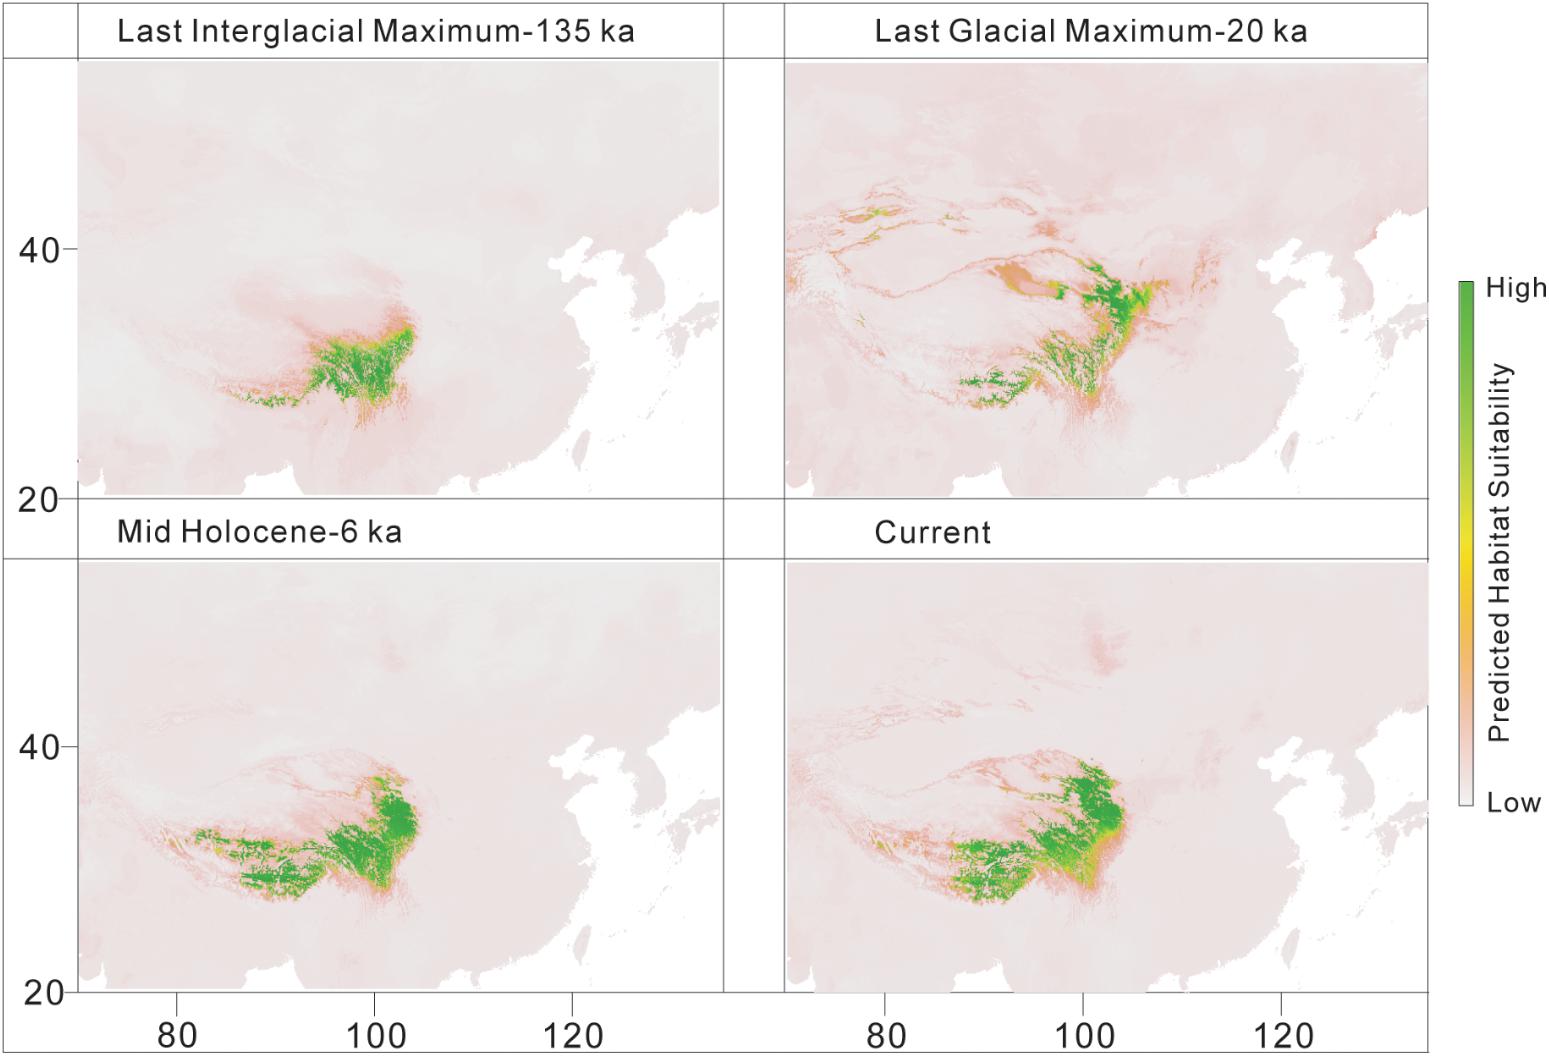
FIGURE 7. Distribution models for L. tibetica, simulated based on current, mid-Holocene (6 ka), last glacial maximum (20 ka), and last interglacial maximum (135 ka) periods.
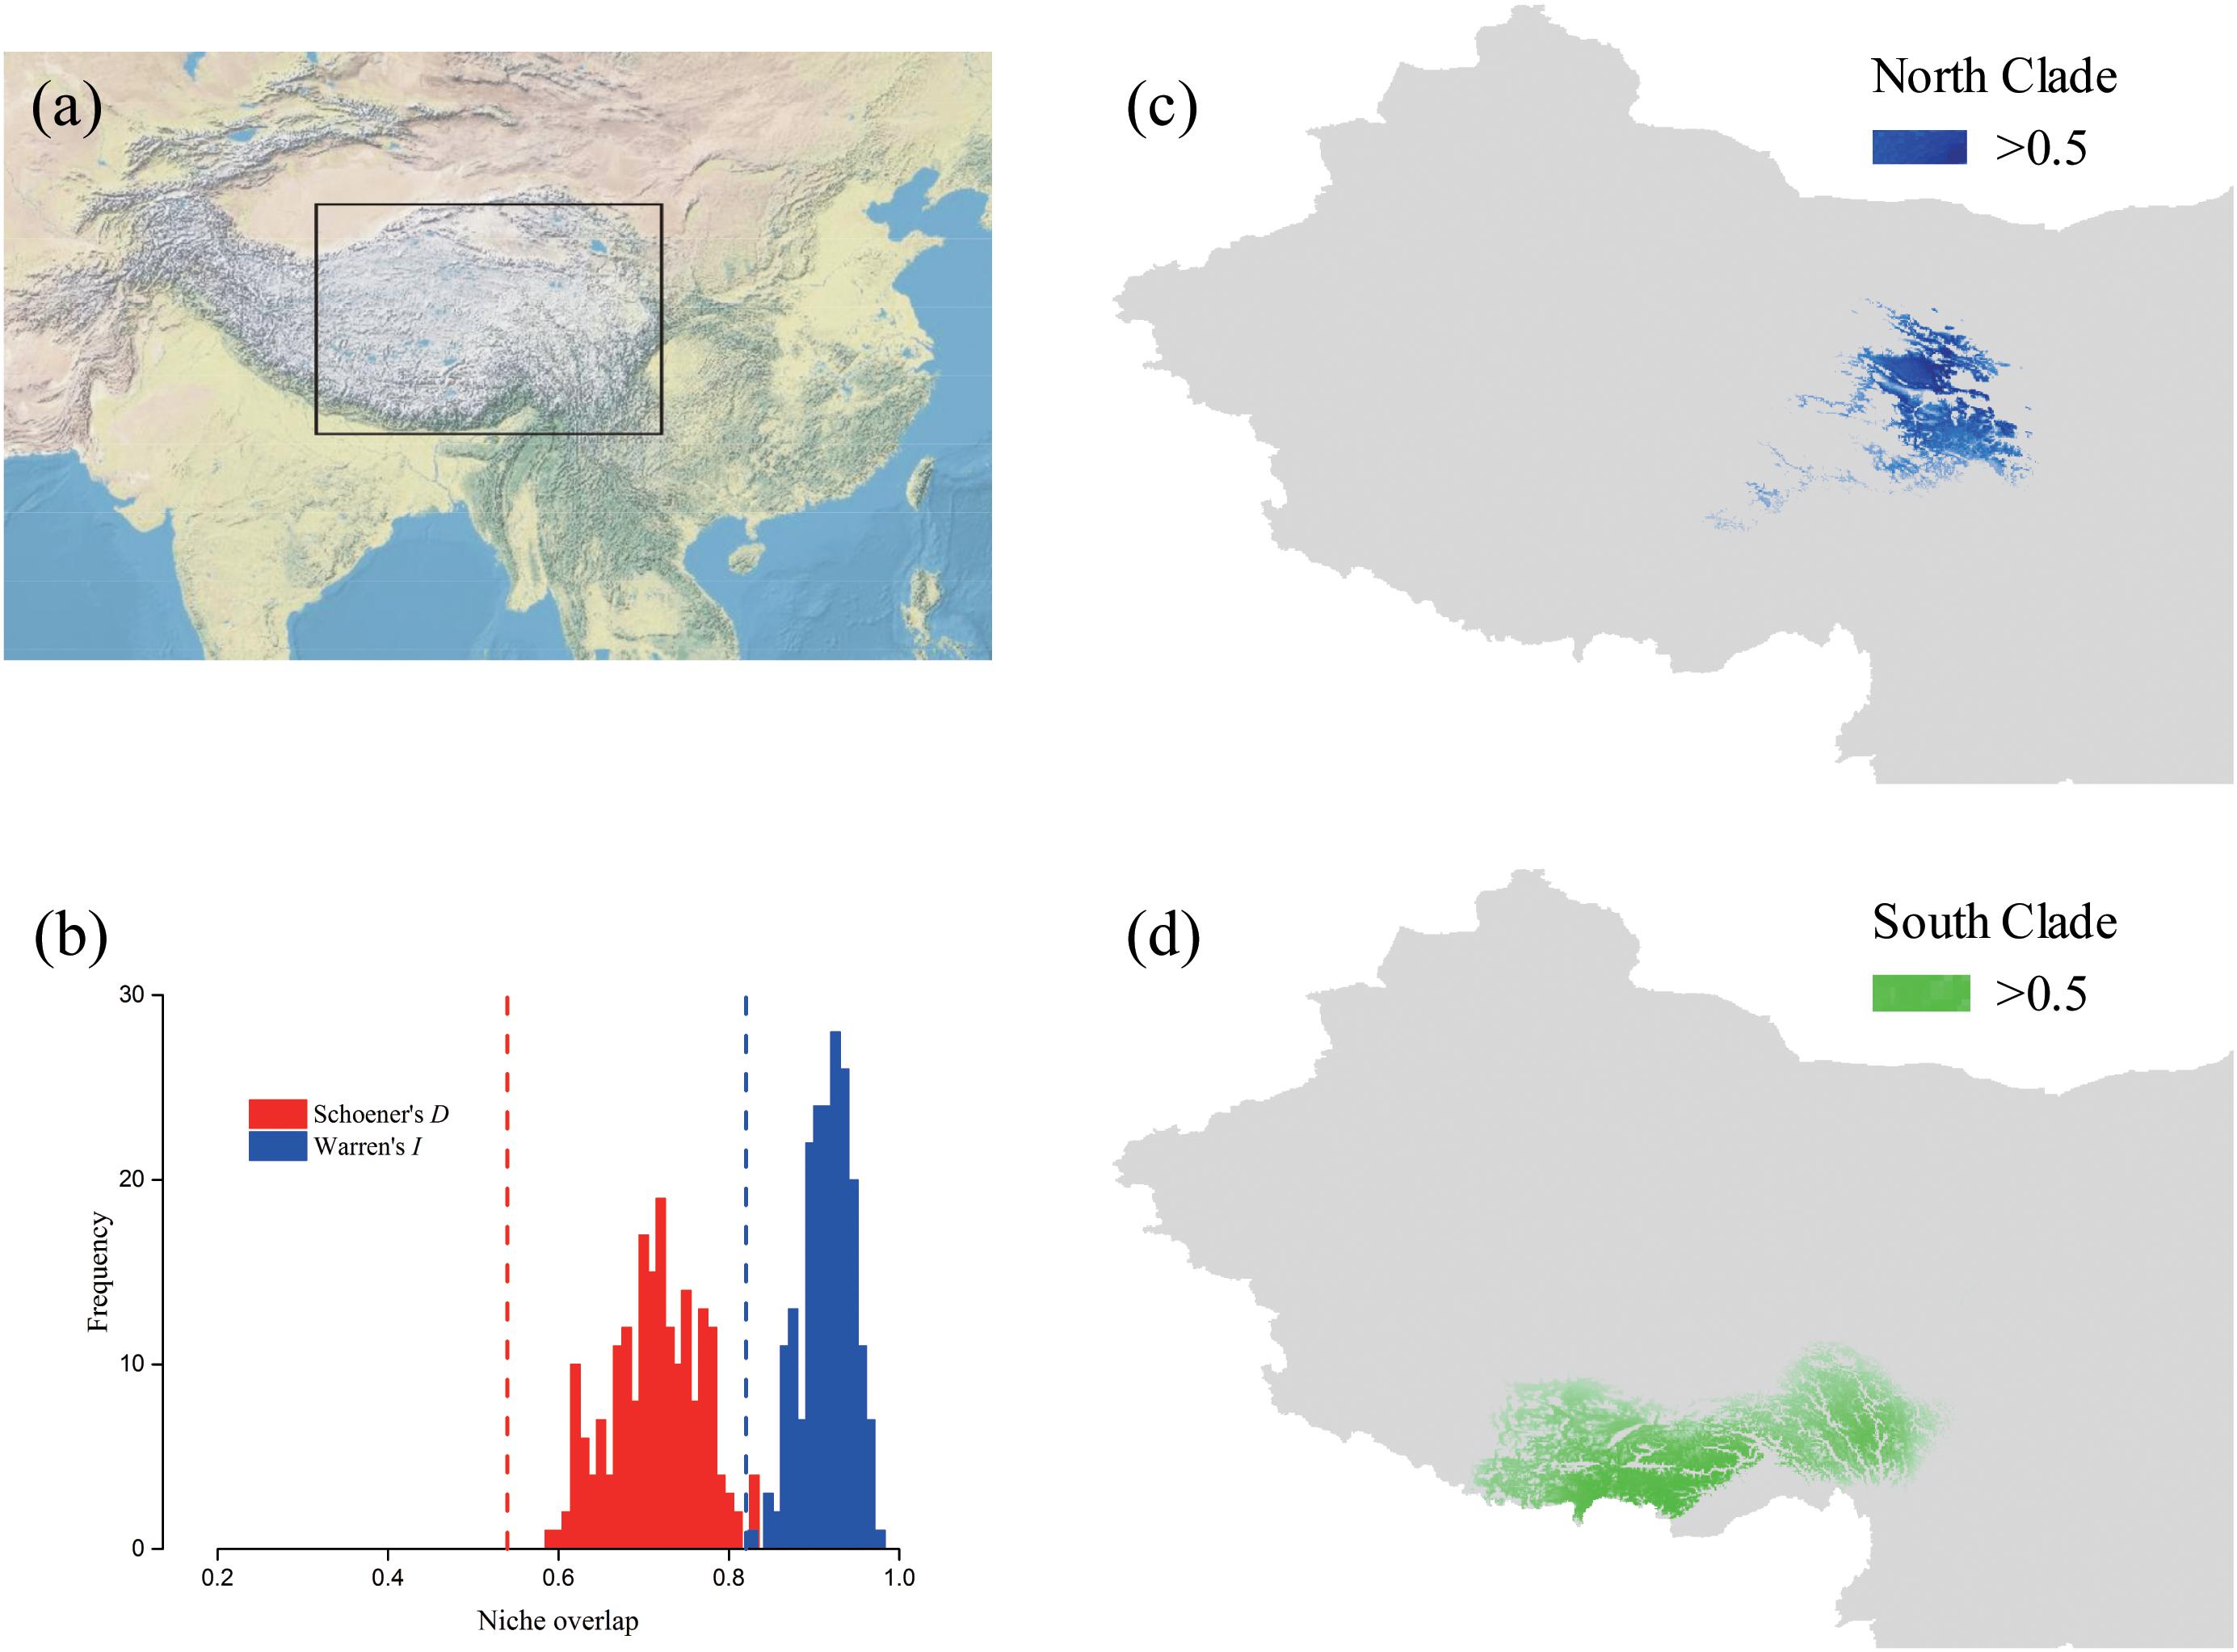
FIGURE 8. Potential distributions and niche overlap for L. tibetica lineages in the QTP. (a) The location illustration of the simulation area. (b) Vertical lines represent the empirical value of Warren’s I and Schoener’s D indices, obtained from observed points; the histograms represent the expected distribution of overlap; the null hypothesis of identical niches is rejected if the empirical value falls outside the 95% probability threshold of the expected distributions (P < 0.05). The potential distributions for L. tibetica in the North lineage (c) and South lineage (d).
Discussion
Genetic Structure and Intraspecific Divergence
The average effective gene flow within the distribution range of L. tibetica is low, compared with that of previous studies on other species in the area, e.g., Spiraea mongolica (0.41) (Wang et al., 2014) and Camellia flavida (0.35) (Wei et al., 2017). Higher gene flow in those other species might have resulted in higher genetic differentiation among their populations. We found that the average effective gene flow among the two lineages of L. tibetica (0.149) was lower than that among the different populations (0.249). The seeds of L. tibetica are small and wingless and disperse near the parent plants, a feature that is likely to have enhanced the degree of genetic differentiation by restricting gene flow (Hong et al., 1998). However, we found high genetic differentiation among the populations, and most genetic variation was distributed among the populations and groups, based on SAMOVA. The geographic isolation of populations within species and variation in ecological factors are major driving forces to cryptic speciation (Hoskin et al., 2005; Liu et al., 2013).
The results of SAMOVA, the Bayesian inference tree and parsimony network analysis showed that L. tibetica comprises two major cpDNA groups. One group has its main geographic distribution to the north of the Tanggula and Bayangela Mountains, while the other group lies mainly to the south of the QTP. Gene flow across the whole region appears to be restricted by high mountains, suggesting a significant role of geography in the genetic differences between the two groups. Similarly, the ITS sequence variation showed clearly that the divergence of L. tibetica between the major north and south lineages was around 8.63 Ma. Although the estimates of dates of origin need to be treated with caution, they correspond well with geological evidence that the QTP experienced uplift during the late Miocene and Pliocene periods (Li and Fang, 1999; Zheng et al., 2000; Mulch and Chamberlain, 2006). This evidence suggests that the Tanggula and Bayangela Mountains appear to act as a geographical barrier for L. tibetica, probably imposed significant barriers on gene flow and divided the species into north and south lineages.
As indicated by the cpDNA, the ecological differences between the two lineages seem to represent species-specific characteristics that would be sufficient to keep the lineages separated to a high degree. Such distinct ecological niches would have reinforced the divergence of the two lineages following their initial spatial isolation. Thus, each of the two lineages may have given rise to some degree of differential adaptation to its respective environmental conditions. It is likely that the extensive QTP uplifts created fragmentation and isolation of habitats and niche differentiation, and provided the preconditions for the adaptive divergence of fragmented populations and subsequent speciation (Hewitt, 1996; Abbott and Brennan, 2014). In addition, about 9–8 Ma, enhanced aridity in the Asian interior and the onset of Indian and East Asian monsoons (Zhisheng et al., 2001) might have provided different ecological niches for the different lineages of L. tibetica. Some studies have reported that if related species live in significantly different niches, ecological divergence would likely be important in facilitating speciation, even in the presence of gene exchange (Nosil, 2008; Nosil et al., 2009a; Anacker and Strauss, 2014; Wan et al., 2016). Although ecological divergences in this case have not resulted in the emergence of new species, the initial divergence demonstrates the potential for ecological speciation. If geographic isolation and restricted gene flow are maintained long enough, they may eventually lead to reproductive isolation (Rieseberg and Burke, 2001; Nosil et al., 2009b; Thorpe et al., 2010), resulting in the formation of new species. Our results support the conclusion from previous studies that the uplift of the QTP and its associated climatic changes were most likely the main cause of plant diversification (Cun and Wang, 2010; Xu et al., 2010; Yang et al., 2012).
Quaternary Demographic History and Glacial Refugia of L. tibetica
Climate changes during the Pleistocene glacial-interglacial cycles had a dramatic effect on species distribution ranges (Comes and Kadereit, 1998; Hewitt, 2004), causing migration and/or extinction of populations, followed by periods of isolation, divergence and subsequent expansion (Taberlet et al., 1998; Cun and Wang, 2010). During the Pleistocene period, continuing climatic oscillations caused repeated shifts in the abundance of alpine species (Tang and Shen, 1995; Herzschuh et al., 2010). There were some glacial refugia on the QTP platform, giving some plant species a chance to survive the changing climate (Yang et al., 2008; Wang et al., 2009, 2015; Li et al., 2011; Gao et al., 2016; Liu et al., 2018). In the present study, the simulated distribution from the last interglacial period to the current period showed that the distribution of L. tibetica experienced shrinkage and expansion (Figure 7). In the last glacial maximum period, extreme cold and dry weather substantially reduced its distribution from a continuous geographical distribution to a more fragmented pattern. Our distribution simulations for the mid-Holocene and the current period showed that the distribution ranges of L. tibetica were the same, and apparently more extensive than those in the last glacial maximum periods. Taken together, our results reveal that L. tibetica did experience population expansion.
Molecular data also provided further support for the above hypothesis. Based on cpDNA sequence variation, the north and south lineages of L. tibetica experienced a rapid range expansion at 0.172 Ma and 0.727 Ma, respectively (Table 5), consistent with the Pleistocene (Hewitt, 2000; Zheng et al., 2002). The largely open alpine regions that became available following the end of the major glaciation would have provided extensive opportunities for L. tibetica to expand its range. Indeed, such expansions of geographical range into alpine regions of the QTP have been reported previously for several plant species and are likely to have been common during the largest Pleistocene glaciation on the QTP (Liu et al., 2012, 2013; Gulzar et al., 2018; Lin et al., 2018). The QTP has been shown to be sensitive to climatic shifts, when plants were profoundly affected by alpine glaciation (Meng et al., 2007; Chen et al., 2008).
According to Taberlet and Cheddadi (2002), localities with high levels of genetic variation and unique haplotypes have often been recognized as possible refugia or as centers of diversification for species, whereas localities with low levels of genetic variation represent recent colonization. Some reports suggest that the mountainous areas of subtropical China may have provided refugia for warm-temperate evergreen species through periods of adverse climatic conditions (Bennett and Provan, 2008; Qiu et al., 2011; Wang et al., 2015). Our results showed that since the last glacial maximum, the south and north lineages experienced population expansion, while the population as a whole showed no expansion. In addition, even though L. tibetica has only two major lineages, some of its populations (9, 10, 12, 13, 14, and 15) contained higher haplotype and nucleotide diversities. It is likely that populations located in the Tanggula Mountains could survive in alternative habitats within a short distance, allowing biodiversity to persist during climate modifications (Hoorn et al., 2013). These patterns collectively suggest that areas south of the Tanggula and north of the Bayangela Mountains harbored refugia during the early Pleistocene, and then the southern and northern distribution ranges expanded rapidly at 0.727 and 0.172 Ma, respectively, during the interglacial periods. It might be a possible explanation for our finding that these populations have lower haplotype and nucleotide diversities than do some other species. Previous reports have suggested that rapid range expansion should decrease intra-population genetic diversity in the direction of spread (Hewitt, 1996; Soltis et al., 1997; Nason et al., 2002).
Conclusion
In conclusion, analyses of L. tibetica from our sample range, bringing together molecular phylogeography and species distribution modeling, indicate that a combination of geographic isolation and climatic factors have played a fundamental role in promoting diversification and evolution of this species. This study provides valuable evidence that advances research on genetic differentiation on the QTP.
Author Contributions
FZ and SC conceived and designed the experiments. MX and ZT performed the experiments. MX, ZT, FZ, and GK analyzed the data. QG, RX, YZ, and JY contributed reagents, materials, and analysis tools. MZ wrote the paper. FZ, SC, and GK reviewed and edited the paper. All authors approved the final version of the manuscript.
Funding
This work was supported by the Strategic Priority Research Program of the Chinese Academy of Sciences (XDA20050204), the Ministry of Science and Technology, China (2015FY11050014), the Applied Basic Research Programs of Qinghai Province (2016-ZJ-761), the National Natural Science Foundation of China (31110103911), the Construction Project for Innovation Platform of Qinghai province (2017-ZJ-Y14), the Youth Innovation Promotion Association CAS (2016378), and the CAS “Light of West China” Program.
Conflict of Interest Statement
The authors declare that the research was conducted in the absence of any commercial or financial relationships that could be construed as a potential conflict of interest.
Acknowledgments
We thank Dr. Huw Tyson, from Liwen Bianji, Edanz Editing China (www.liwenbianji.cn/ac), for editing the English text of a draft of this manuscript.
Footnotes
References
Abbott, R. J., and Brennan, A. C. (2014). Altitudinal gradients, plant hybrid zones and evolutionary novelty. Philos. Trans. R. Soc. B 369, 5042–5050. doi: 10.1098/rstb.2013.0346
Anacker, B. L., and Strauss, S. Y. (2014). The geography and ecology of plant speciation: range overlap and niche divergence in sister species. Proc. R. Soc. Lon. B Biol. Sci. 281:20132980. doi: 10.1098/rspb.2013.2980
Anderson, R. P., and Gonzalez, I. (2011). Species-specific tuning increases robustness to sampling bias in models of species distributions: an implementation with Maxent. Ecol. Modell. 222, 2796–2811. doi: 10.1016/j.ecolmodel.2011.04.011
ArisBrosou, S., and Excoffier, L. (1996). The impact of population expansion and mutation rate heterogeneity on DNA sequence polymorphism. Mol. Biol. Evol. 13, 494–504. doi: 10.1093/oxfordjournals.molbev.a025610
Baldwin, B. G. (1992). Phylogenetic utility of the internal transcribed spacers of nuclear ribosomal DNA in plants: an example from the compositae. Mol. Phylogenet. Evol. 1, 3–16. doi: 10.1016/1055-7903(92)90030-K
Bandelt, H. J., Forster, P., and Röhl, A. (1999). Median-joining networks for inferring intraspecific phylogenies. Mol. Biol. Evol. 16, 37–48. doi: 10.1093/oxfordjournals.molbev.a026036
Bennett, K. D., and Provan, J. (2008). What do we mean by ‘refugia’? Quat. Sci. Rev. 27, 2449–2455. doi: 10.1016/j.quascirev.2008.08.019
Bloemendal, J. (1989). Evidence for a change in the periodicity of tropical climate cycles at 2.4 Myr from whole-core magnetic susceptibility measurements. Nature 342, 897–900. doi: 10.1038/342897a0
Breiman, L., Friedman, J. H., Olshen, R. A., and Stone, C. J. (1984). Classification and regression trees. Encycl. Ecol. 57, 582–588. doi: 10.2307/2530946
Busby, J. R. (1991). BIOCLIM: a bioclimate analysis and prediction system. Plant Protect. Quart. 6, 8–9.
Call, V. B., and Dilcher, D. L. (1992). Investigations of angiosperms from the Eocene of southeastern North America: samaras of Fraxinus wilcoxiana berry. Rev. Palaeobot. Palynol. 74, 249–266. doi: 10.1016/0034-6667(92)90010-E
Chen, S. Y., Wu, G. L., Zhang, D. J., Gao, Q. B., Duan, Y. Z., Zhang, F. Q., et al. (2008). Potential refugium on the qinghai-tibet plateau revealed by the chloroplast DNA phylogeography of the alpine species Metagentiana striata (Gentianaceae). Bot. J. Linn. Soc. 157, 125–140. doi: 10.1111/j.1095-8339.2008.00785.x
Comes, H. P., and Kadereit, J. W. (1998). The effect of quaternary climatic changes on plant distribution and evolution. Trends Plant Sci. 3, 432–438. doi: 10.1016/S1360-1385(98)01327-2
Cun, Y. Z., and Wang, X. Q. (2010). Plant recolonization in the Himalaya from the southeastern Qinghai-Tibetan Plateau: geographical isolation contributed to high population differentiation. Mol. Phylogenet. Evol. 56, 972–982. doi: 10.1016/j.ympev.2010.05.007
Davis, M. B., and Shaw, R. G. (2001). Range shifts and adaptive responses to quaternary climate change. Science 292, 673–679. doi: 10.1126/science.292.5517.673
Doyle, J. (1987). A rapid DNA isolation procedure for small quantities of fresh leaf tissue. Phytochem. Bull. 19, 11–15.
Drummond, A., Suchard, M., Xie, D., and Rambaut, A. (2012). Bayesian phylogenetics with BEAUti and the BEAST 1.7. Mol. Biol. Evol. 29, 1969–1973. doi: 10.1093/molbev/mss075
Drummond, A. J., and Rambaut, A. (2007). BEAST: bayesian evolutionary analysis by sampling trees. BMC Evol. Biol. 7:214. doi: 10.1186/1471-2148-7-214
Dupanloup, I., Schneider, S., and Excoffier, L. (2010). A simulated annealing approach to define the genetic structure of populations. Mol. Ecol. 11, 2571–2581. doi: 10.1046/j.1365-294X.2002.01650.x
Excoffier, L., and Lischer, H. E. L. (2010). Arlequin suite ver 3.5: a new series of programs to perform population genetics analyses under Linux and Windows. Mol. Ecol. Resour. 10, 564–567. doi: 10.1111/j.1755-0998.2010.02847.x
Friedman, J. H. (1991). Multivariate adaptive regression splines. Ann. Stat. 19, 1–67. doi: 10.1214/aos/1176347973
Fu, Y. (1997). Statistical tests of neutrality of mutations against population growth, hitchhiking and background selection. Genetics 147, 915–925.
Gao, Q. B., Zhang, F. Q., Xing, R., Gornall, R. J., Fu, P. C., Li, Y., et al. (2016). Phylogeographic study revealed microrefugia for an endemic species on the Qinghai-Tibetan Plateau: Rhodiola chrysanthemifolia (Crassulaceae). Plant Syst. Evol. 302, 1179–1193. doi: 10.1007/s00606-016-1324-4
Grivet, D., and Petit, R. J. (2002). Phylogeography of the common ivy (Hedera sp.) in Europe: genetic differentiation through space and time. Mol. Ecol. 11, 1351–1362. doi: 10.1046/j.1365-294X.2002.01522.x
Gulzar, K., Zhang, F. Q., Gao, Q. B., Fu, P. C., Zhang, Y., and Chen, S. L. (2018). Spiroides shrubs on Qinghai-Tibetan Plateau: Multilocus phylogeography and palaeodistributional reconstruction of Spiraea alpina and S. mongolica (Rosaceae). Mol. Phylogenet. Evol. 123, 137–148. doi: 10.1016/j.ympev.2018.02.009
Guo, Z. T., Ruddiman, W. F., Hao, Q. Z., Wu, H. B., Qiao, Y. S., and Zhu, R. X. (2002). Onset of Asian desertification by 22 Myr ago inferred from loess deposits in China. Nature 416, 159–163. doi: 10.1038/416159a
Hall, T. A. (1999). BioEdit : a user-friendly biological sequence alignment editor and analysis program for Windows 95/98/NT. Nucleic Acids Symp. Ser. 41, 95–98. doi: 10.14601/Phytopathol_Mediterr-14998u1.29
Harrison, T. M., Copeland, P., Kidd, W. S. F., and Lovera, O. M. (1995). Activation of the nyainqentanghla shear zone: implications for uplift of the southern tibetan plateau. Tectonics 14, 658–676. doi: 10.1029/95TC00608
Hastie, T. (1994). Flexible discriminant analysis by optimal scoring. Publ. Am. Stat. Assoc. 89, 1255–1270. doi: 10.1080/01621459.1994.10476866
Hernandez, P. A., Graham, C. H., Master, L. L., and Albert, D. L. (2006). The effect of sample size and species characteristics on performance of different species distribution modeling methods. Ecography 29, 773–785. doi: 10.1111/j.0906-7590.2006.04700.x
Herzschuh, U., Birks, H. J. B., Mischke, S., Zhang, C., and Böhner, J. (2010). A modern pollen-climate calibration set based on lake sediments from the Tibetan Plateau and its application to a late quaternary pollen record from the qilian mountains. J. Biogeogr. 37, 752–766. doi: 10.1111/j.1365-2699.2009.02245.x
Hewitt, G. (2000). The genetic legacy of the quaternary ice ages. Nature 405, 907–913. doi: 10.1038/35016000
Hewitt, G. M. (1996). Some genetic consequences of ice ages, and their role in divergence and speciation. Biol. J. Linn. Soc. 58, 247–276. doi: 10.1111/j.1095-8312.1996.tb01434.x
Hewitt, G. M. (2004). Genetic consequences of climatic oscillations in the quaternary. Philos. Trans. R. Soc. Lond. B Biol. Sci. 359, 183–195. doi: 10.1098/rstb.2003.1388
Hijmans, R. J., Cameron, S. E., Parra, J. L., Jones, P. G., and Jarvis, A. (2005). Very high resolution interpolated climate surfaces for global land areas. Int. J. Climatol. 25, 1965–1978. doi: 10.1002/joc.1276
Hong, D. Y., Yang, H. B., Jin, C. L., and Noel, H. H. (1998). Flora of China. Beijing: Missouri Botanical Garden Press.
Hoorn, C., Mosbrugger, V., Mulch, A., and Antonelli, A. (2013). Biodiversity from mountain building. Nat. Geosci. 6, 154–154. doi: 10.1038/ngeo1742
Hoskin, C. J., Higgie, M., McDonald, K. R., and Moritz, C. (2005). Reinforcement drives rapid allopatric speciation. Nature 437, 1353–1356. doi: 10.1038/nature04004
Jaeger, J. R., Riddle, B. R., and Bradford, D. F. (2005). Cryptic Neogene vicariance and quaternary dispersal of the red-spotted toad (Bufo punctatus): insights on the evolution of North American warm desert biotas. Mol. Ecol. 14, 3033–3048. doi: 10.1111/j.1365-294X.2005.02645.x
Jia, D. R., Abbott, R. J., Liu, T. L., Mao, K. S., Bartish, I. V., and Liu, J. Q. (2012). Out of the Qinghai–Tibet Plateau: evidence for the origin and dispersal of Eurasian temperate plants from a phylogeographic study of Hippophae rhamnoides (Elaeagnaceae). New Phytol. 194, 1123–1133. doi: 10.1111/j.1469-8137.2012.04115.x
Lecun, Y., and Bengio, Y. (1996). Pattern recognition and neural networks. Handb. Brain Theory Neural Netw. 8, 815–816.
Li, J. J., and Fang, X. M. (1999). Uplift of the Tibetan Plateau and environmental changes. Chin. Sci. Bull. 44, 2117–2124. doi: 10.1007/BF03182692
Li, Z. H., Zhang, Q., Liu, J. Q., Källman, T., and Lascoux, M. (2011). The pleistocene demography of an alpine juniper of the Qinghai-Tibetan Plateau: tabula rasa, cryptic refugia or something else? J. Biogeogr. 38, 31–43. doi: 10.1111/j.1365-2699.2010.02400.x
Librado, P., and Rozas, J. (2009). DnaSP v5: a software for comprehensive analysis of DNA polymorphism data. Bioinformatics 25, 1451–1452. doi: 10.1093/bioinformatics/btp187
Lin, N., Deng, T., Moore, M. J., Sun, Y. X., Huang, X. H., Sun, W. G., et al. (2018). Phylogeography of Parasyncalathium souliei (Asteraceae) and its potential application in delimiting phylogeoregions in the qinghai-tibet plateau (QTP)-hengduan mountains (HDM) hotspot. Front. Genet. 9:171. doi: 10.3389/fgene.2018.00171
Liu, C., Liu, S. J., Tang, Z. S., and Sun, J. Y. (2015). Lancea tibetica as the Tibetan herb: a review of its phytochemistry and pharmacology. Phytochem. Lett. 14, 270–279. doi: 10.1016/j.phytol.2015.10.029
Liu, H. R., Gao, Q. B., Zhang, F. Q., Gulzar, K., and Chen, S. L. (2018). Westwards and northwards dispersal of Triosteum himalayanum (Caprifoliaceae) from the hengduan mountains region based on chloroplast DNA phylogeography. PeerJ 6:e4748. doi: 10.7717/peerj.4748
Liu, J., Möller, M., Provan, J., Gao, L. M., Poudel, R. C., and Li, D. Z. (2013). Geological and ecological factors drive cryptic speciation of yews in a biodiversity hotspot. New Phytol. 199, 1093–1108. doi: 10.1111/nph.12336
Liu, J. Q., Sun, Y. S., Ge, X. J., Gao, L. M., and Qiu, Y. X. (2012). Phylogeographic studies of plants in China: advances in the past and directions in the future. J. Syst. Evol. 50, 267–275. doi: 10.1111/j.1759-6831.2012.00214.x
Liu, S. J., Liao, Z. X., Liu, C., and Qu, Y. B. (2014). A trehalose ester from Lancea tibetica. Nat. Prod. Res. 28, 1613–1618. doi: 10.1080/14786419.2014.930859
Magallon, S. (2000). Phylogenetic pattern, diversity, and diversification of eudicots. Ann. Missouri Bot. Garden 86, 297–372. doi: 10.2307/2666180
Manchester, S. R. (1999). Biogeographical relationships of north american tertiary floras. Ann. Missouri Bot. Garden 86, 472–522. doi: 10.2307/2666183
Mccullagh, P., and Nelder, J. A. (1989). Generalized linear models (Second edition). J. Am. Stat. Assoc. 93, 730–739. doi: 10.1007/978-1-4899-3242-6
Meng, L., Yang, R., Abbott, R. J., Miehe, G., Hu, T., and Liu, J. (2007). Mitochondrial and chloroplast phylogeography of Picea crassifolia Kom.(Pinaceae) in the Qinghai-Tibetan Plateau and adjacent highlands. Mol. Ecol. 16, 4128–4137. doi: 10.1111/j.1365-294X.2007.03459.x
Meyer, H. W., and Manchester, S. R. (1997). The Oligocene Bridge Creek Flora of the John Day Formation, Oregon. Oakland, CA: Press.
Molnar, P., England, P., and Martinod, J. (1993). Mantle dynamics, uplift of the Tibetan Plateau, and the Indian monsoon. Rev. Geophys. 31, 357–396. doi: 10.1029/93RG02030
Mulch, A., and Chamberlain, C. P. (2006). Earth science: the rise and growth of Tibet. Nature 439, 670–671. doi: 10.1038/439670a
Myers, N., Mittermeier, R. A., Mittermeier, C. G., Da, F. G., and Kent, J. (2000). Biodiversity hotspots for conservation priorities. Nature 403, 853–858. doi: 10.1038/35002501
Nason, J. D., Hamrick, J. L., Fleming, T. H., and Tonsor, S. (2002). Historical vicariance and postglacial colonization effects on the evolution of genetic structure in Lophocereus, a sonoran desert columnar cactus. Evolution 56, 2214–2226. doi: 10.1554/0014-38202002056
Nie, Z. L., Sun, H., Beardsley, P. M., Olmstead, R. G., and Wen, J. (2006). Evolution of biogeographic disjunction between eastern Asia and eastern North America in Phryma (Phrymaceae). Am. J. Bot. 93, 1343–1356. doi: 10.3732/ajb.93.9.1343
Nosil, P. (2008). Speciation with gene flow could be common. Mol. Ecol. 17, 2103–2106. doi: 10.1111/j.1365-294X.2008.03715.x
Nosil, P., Funk, D. J., and Ortiz-Barrientos, D. (2009a). Divergent selection and heterogeneous genomic divergence. Mol. Ecol. 18, 375–402. doi: 10.1111/j.1365-294X.2008.03946.x
Nosil, P., Harmon, L. J., and Seehausen, O. (2009b). Ecological explanations for (incomplete) speciation. Trends Ecol. Evol. 24, 145–156. doi: 10.1016/j.tree.2008.10.011
Nylander, J. (2004). MrModeltest v2. (Program Distributed by the Author). Uppsala: Uppsala University: Evolutionary Biology Centre.
Olmstead, R. G., and Michaels, H. J. (1992). Monophyly of the Asteridae and identification of their major lineages inferred from DNA sequences of rbcL. Ann. Missouri Bot. Garden 79, 249–265. doi: 10.2307/2399768
Otto-Bliesner, B. L., Marsha, S. J., Overpeck, J. T., Miller, G. H., and Hu, A. X. (2006). Simulating arctic climate warmth and icefield retreat in the last interglaciation. Science 311, 1751–1753. doi: 10.1126/science.1120808
Pearson, R. G., Raxworthy, C. J., Nakamura, M., and Peterson, T. A. (2007). Predicting species distributions from small numbers of occurrence records: a test case using cryptic geckos in Madagascar. J. Biogeogr. 34, 102–117. doi: 10.1139/L08-045
Peterson, A. T., and Nakazawa, Y. (2008). Environmental data sets matter in ecological niche modelling: an example with Solenopsis invicta and Solenopsis richteri. Global Ecol. Biogeogr. 17, 135–144. doi: 10.1111/j.1466-8238.2007.00347.x
Phillips, S. J., Anderson, R. P., and Schapire, R. E. (2006). Maximum entropy modeling of species geographic distributions. Ecol. Modell. 190, 231–259. doi: 10.1016/j.ecolmodel.2005.03.026
Phillips, S. J., and Dudík, M. (2008). Modeling of species distributions with Maxent: new extensions and a comprehensive evaluation. Ecography 31, 161–175. doi: 10.1016/S0009-3084(99)00017-1
Phillips, S. J., Dudík, M., and Schapire, R. E. (2004). “A maximum entropy approach to species distribution modeling,” in Proceedings of the Twenty-First International Conference on Machine Learning, Banff, 655–662.
Pons, O., and Petit, R. J. (1996). Measwring and testing genetic differentiation with ordered versus unordered alleles. Genetics 144, 1237–1245.
Qiu, Y. X., Fu, C. X., and Comes, H. P. (2011). Plant molecular phylogeography in China and adjacent regions: Tracing the genetic imprints of quaternary climate and environmental change in the world’s most diverse temperate flora. Mol. Phylogenet. Evol. 59, 225–244. doi: 10.1016/j.ympev.2011.01.012
Rambaut, A. (2009). FigTree v1. 3.1: Tree Figure Drawing Tool. Available at: http://tree.bio.ed.ac.uk/software/figtree
Rambaut, A., Drummond, A. J., Xie, D., Baele, G., and Suchard, M. A. (2018). Posterior summarisation in bayesian phylogenetics using tracer 1.7. Syst. Biol. 67, 901–904. doi: 10.1093/sysbio/syy032
Raymond, M., and Rousset, F. (1995). An exact test for population differentiation. Evolution 49, 1280–1283. doi: 10.2307/2410454
Renner, S. S. (2016). Available data point to a 4-km-high tibetan plateau by 40 Ma, but 100 molecular-clock papers have linked supposed recent uplift to young node ages. J. Biogeogr. 43, 1479–1487. doi: 10.1111/jbi.12755
Ridgeway, G. (2004). GBM: Generalized Boosted Regression Models. R Package Version 1.5. Available at: https://CRAN.R-project.org/package(gbm)
Rieseberg, L. H., and Burke, J. M. (2001). The biological reality of species: gene flow, selection, and collective evolution. Taxon 50, 47–67. doi: 10.2307/1224511
Robert, H., Susan, E. C., Juan, L. P., Peter, G. J., and Andy, J. (2005). Very high resolution interpolated climate surfaces for global land areas. Int. J. Climatol. 25, 1965–1978. doi: 10.1002/joc.1276
Rogers, A. R., and Harpending, H. (1992). Population growth makes waves in the distribution of pairwise genetic differences. Mol. Biol. Evol. 9, 552–569. doi: 10.1093/oxfordjournals.molbev.a040727
Sang, T., Crawford, D., and Stuessy, T. (1997). Chloroplast DNA phylogeny, reticulate evolution, and biogeography of Paeonia (Paeoniaceae). Am. J. Bot. 84, 1120–1136. doi: 10.2307/2446155
Soltis, D. E., Gitzendanner, M. A., Strenge, D. D., and Soltis, P. S. (1997). Chloroplast DNA intraspecific phylogeography of plants from the Pacific Northwest of North America. Plant Syst. Evol. 206, 353–373. doi: 10.1007/BF00987957
Song, Z. H., Qian, Z. Z., Rumalla, C. S., Smillie, T. J., and Khan, I. A. (2011a). Identification of 11 marker compounds simultaneously in herb Lancea tibetica by using high-performance thin-layer chromatography. JPC – J. Planar Chromatogr. Modern TLC 24, 312–315. doi: 10.1556/JPC.24.2011.4.7
Song, Z. H., Wang, Y. H., Avula, B., Smillie, T. J., Qian, Z. Z., and Khan, I. A. (2011b). Chemical analysis of Lancea tibetica using UPLC-UV/MS and ESI-MSn methods. Planta Med. 77:5. doi: 10.1055/s-0031-1273608
Spicer, R. (2017). Tibet, the Himalaya, Asianmonsoons and biodiversity-in what ways are they related? Plant Divers. 39, 233–244. doi: 10.1016/j.pld.2017.09.001
Spicer, R. A., Harris, N. B., Widdowson, M., Herman, A. B., Guo, S., and Valdes, P. J. (2003). Constant elevation of southern Tibet over the past 15 million years. Nature 421, 622–624. doi: 10.1038/nature01356
Swets, J. A. (1988). Measuring the accuracy of diagnostic systems. Science 240, 1285–1293. doi: 10.1126/science.3287615
Taberlet, P., and Cheddadi, R. (2002). Ecology. Quaternary refugia and persistence of biodiversity. Science 297, 2009–2010. doi: 10.1126/science.297.5589.2009
Taberlet, P., Fumagalli, L., Wust-Saucy, A. G., and Cosson, J. F. (1998). Comparative phylogeography and postglacial colonization routes in Europe. Mol. Ecol. 7, 453–464. doi: 10.1046/j.1365-294x.1998.00289.x
Tajima, F. (1989). Statistical method for testing the neutral mutation hypothesis by DNA polymorphism. Genetics 123, 585–595.
Tang, L., and Shen, C. (1995). Late Cenozoic vegetational history and climatic characteristics of Qinghai-Xizang Plateau. Acta Micropalaeontol. Sin. 13, 321–338.
Thompson, J. D., Gibson, T. J., Plewniak, F., Jeanmougin, F., and Higgins, D. G. (1997). The CLUSTAL_X windows interface: flexible strategies for multiple sequence alignment aided by quality analysis tools. Nucleic Acids Res. 25, 4876–4882. doi: 10.1093/nar/25.24.4876
Thorpe, R. S., Surget-Groba, Y., and Johansson, H. (2010). Genetic tests for ecological and allopatric speciation in anoles on an island archipelago. PLoS Genet. 6:e1000929. doi: 10.1371/journal.pgen.1000929
Thuiller, W., Georges, D., and Engler, R. (2014). Biomod2: Ensemble Platform for Species Distribution Modelling. Available at: https://www.rdocumentation.org/packages/biomod2
Tian, Z. Z., Zhang, F. Q., Liu, H. R., Gao, Q. B., and Chen, S. L. (2016). Development of SSR markers for a tibetan medicinal plant, Lancea tibetica (phrymaceae), based on RAD sequencing. Appl. Plant Sci. 4:1600076. doi: 10.3732/apps.1600076
Wan, D. S., Feng, J. J., Jiang, D. C., Mao, K. S., Duan, Y. W., Miehe, G., et al. (2016). The quaternary evolutionary history, potential distribution dynamics, and conservation implications for a Qinghai–Tibet Plateau endemic herbaceous perennial, anisodus tanguticus (Solanaceae). Ecol. Evol. 6, 1977–1995. doi: 10.1002/ece3.2019
Wan, S., Li, A., Clift, P. D., and Stuut, J. B. W. (2007). Development of the East Asian monsoon: mineralogical and sedimentologic records in the northern South China Sea since 20 Ma. Palaeogeogr. Palaeoclimatol. Palaeoecol. 254, 561–582. doi: 10.1016/j.palaeo.2007.07.009
Wang, J. L., Gao, Q. B., Fu, P. C., Khan, G., Chen, S. L., and Zhang, F. Q. (2014). Phylogeography of Spirasa mongolica (Rosaceae) on the Qinghai-Tibetan Plateau and adjacent highlands. Acta Botan. Boreali-Occident. Sin. 34, 1981–1991. doi: 10.7606/j.issn.1000-4025.2014.10.1981
Wang, L. Y., Abbott, R. J., Zheng, W., Chen, P., Wang, Y. J., and Liu, J. Q. (2009). History and evolution of alpine plants endemic to the Qinghai-Tibetan Plateau: aconitum gymnandrum (Ranunculaceae). Mol. Ecol. 18, 709–721. doi: 10.1111/j.1365-294X.2008.04055.x
Wang, Y. H., Jiang, W. M., Comes, H. P., Hu, F. S., Qiu, Y. X., and Fu, C. X. (2015). Molecular phylogeography and ecological niche modelling of a widespread herbaceous climber, Tetrastigma hemsleyanum (Vitaceae): insights into Plio-Pleistocene range dynamics of evergreen forest in subtropical China. New Phytol. 206, 852–867. doi: 10.1111/nph.13261
Warren, D. L., Glor, R. E., and Turelli, M. (2008). Environmental niche equivalency versus conservatism: quantitative approaches to niche evolution. Evolution 62, 2868–2883. doi: 10.1111/j.1558-5646.2008.00482.x
Warren, D. L., Glor, R. E., and Turelli, M. (2010). ENMTools: a toolbox for comparative studies of environmental niche models. Ecography 33, 607–611. doi: 10.1111/j.1600-0587.2009.06142.x
Wei, S. J., Lu, Y. B., Ye, Q. Q., and Tang, S. Q. (2017). Population genetic structure and phylogeography of Camellia flavida (Theaceae) based on chloroplast and nuclear DNA sequences. Front. Plant Sci. 8:718. doi: 10.3389/fpls.2017.00718
White, T. J., Bruns, T., Lee, S., and Taylor, J. (1990). Amplification and Direct Sequencing of Fungal Ribosomal RNA Genes for Phylogenetics. San Diego, CA: Academic Press.
Wisz, M. S., Hijmans, R. J., Li, J., Peterson, A. T., Graham, C. H., and Guisan, A. (2008). Effects of sample size on the performance of species distribution models. Divers. Distribut. 14, 763–773. doi: 10.1021/ic0350537
Wolfe, K. H., Li, W. H., and Sharp, P. M. (1987). Rates of nucleotide substitution vary greatly among plant mitochondrial, chloroplast, and nuclear DNAs. Proc. Natl. Acad. Sci. U.S.A. 84, 9054–9058. doi: 10.1073/pnas.84.24.9054
Xing, Y., and Ree, R. H. (2017). Uplift-driven diversification in the hengduan mountains, a temperate biodiversity hotspot. Proc. Natl. Acad. Sci. U.S.A. 114:E3444. doi: 10.1073/pnas.1616063114
Xu, T. T., Abbott, R. J., Milne, R. I., Mao, K. S., Du, F. K., Wu, G., et al. (2010). Phylogeography and allopatric divergence of cypress species (Cupressus L.) in the Qinghai-Tibetan Plateau and adjacent regions. BMC Evol. Biol. 10:194. doi: 10.1186/1471-2148-10-194
Yang, F. S., Li, Y. F., Ding, X., and Wang, X. Q. (2008). Extensive population expansion of Pedicularis longiflora (Orobanchaceae) on the Qinghai-Tibetan Plateau and its correlation with the quaternary climate change. Mol. Ecol. 17, 5135–5145. doi: 10.1111/j.1365-294X.2008.03976.x
Yang, F. S., Qin, A. L., Li, Y. F., and Wang, X. Q. (2012). Great genetic differentiation among populations of Meconopsis integrifolia and its implication for plant speciation in the Qinghai-Tibetan Plateau. PLoS One 7:e37196. doi: 10.1371/journal.pone.0037196
Zhang, Q., Chiang, T. Y., George, M., Liu, J. Q., and Abbott, R. J. (2005). Phylogeography of the Qinghai-Tibetan Plateau endemic Juniperus przewalskii (Cupressaceae) inferred from chloroplast DNA sequence variation. Mol. Ecol. 14, 3513–3524. doi: 10.1111/j.1365-294X.2005.02677.x
Zheng, B., Xu, Q., and Shen, Y. (2002). The relationship between climate change and quaternary glacial cycles on the Qinghai-Tibetan Plateau: review and speculation. Quat. Int. 97, 93–101. doi: 10.1016/S1040-6182(02)00054-X
Zheng, H., Powell, C. M., An, Z., Zhou, J., and Dong, G. (2000). Pliocene uplift of the northern Tibetan Plateau. Geology 28, 715–718. doi: 10.1130/0091-7613200028
Keywords: divergence, Lancea tibetica, genetic structure, phylogeography, demography, Qinghai-Tibetan Plateau
Citation: Xia M, Tian Z, Zhang F, Khan G, Gao Q, Xing R, Zhang Y, Yu J and Chen S (2018) Deep Intraspecific Divergence in the Endemic Herb Lancea tibetica (Mazaceae) Distributed Over the Qinghai-Tibetan Plateau. Front. Genet. 9:492. doi: 10.3389/fgene.2018.00492
Received: 12 June 2018; Accepted: 03 October 2018;
Published: 25 October 2018.
Edited by:
Kangshan Mao, Sichuan University, ChinaReviewed by:
Jian-Wen Zhang, Kunming Institute of Botany (CAS), ChinaPeng Zhao, Northwest University, China
Copyright © 2018 Xia, Tian, Zhang, Khan, Gao, Xing, Zhang, Yu and Chen. This is an open-access article distributed under the terms of the Creative Commons Attribution License (CC BY). The use, distribution or reproduction in other forums is permitted, provided the original author(s) and the copyright owner(s) are credited and that the original publication in this journal is cited, in accordance with accepted academic practice. No use, distribution or reproduction is permitted which does not comply with these terms.
*Correspondence: Faqi Zhang, ZnF6aGFuZ0Bud2lwYi5jYXMuY24= Shilong Chen, c2xjaGVuQG53aXBiLmNhcy5jbg==
†These authors have contributed equally to this work
 Mingze Xia
 Zunzhe Tian1†
 Faqi Zhang
 Qingbo Gao