 Carlos Zapata
A commentary on
A comparison of linkage disequilibrium measures for fine-scale mapping
by Devlin, B., and Risch, N. (1995). Genomics 29, 311–322. doi: 10.1006/geno.1995.9003
Genome-wide association (GWA) studies for fine-scale mapping of disease loci are conceptually based on the occurrence and history of non-random association of alleles at different loci in populations (or linkage disequilibrium). Thus, a new disease mutation arises on a single ancestral haplotype of a given population in complete linkage disequilibrium with syntenic polymorphic markers. Owing to historical recombination events, markers close to the disease locus will tend to be in strongest disequilibrium than distant markers when the presence of evolutionary mechanisms generating non-uniform disequilibrium patterns is ignored. Therefore, the use of optimal measures to assess gradients of the strength of disequilibrium along chromosomes is crucial for fine mapping of disease loci. In practice, an ideal disequilibrium measure for fine-scale mapping should be a monotone function of the recombination fraction between the marker and the disease locus.
In an influential paper, Devlin and Risch (1995, henceforth referred to as “D&R”) compared the efficiency of five measures of linkage disequilibrium used to refine the location of disease loci: the robust formulation of the population attributable risk δ (Lewin and Bertell, (1978), Lewontin's D' (Lewontin, 1964), the correlation coefficient Δ (Hill and Robertson, 1968; also described in the literature as r), Yule's Q (Nei and Li, 1980), and Kaplan and Weir's d (Kaplan and Weir, 1992). It was concluded that the measures δ and D' outperform all other measures for fine-scale mapping. In particular, D&R established analytically that δ is the ideal measure for fine mapping because changes of δ over generations are directly related to the recombination fraction (θ) between the disease and the marker locus. In contrast, they found that D' not only depends on θ, but also on the haplotype frequencies. This supposed advantage of δ over D' for fine-scale mapping of disease loci has become a classical paradigm in the literature on disequilibrium. Nevertheless, D&R's conclusion about the relative merits of δ and D' for fine-scale mapping based on analytic results is erroneous. As is shown below, the source of the error lies in a misinterpretation of the formulas used by D&R to assess the relationship between the decay of disequilibrium by recombination and the measures δ and D'. Despite the time elapsed, this misconception remains uncorrected.
Following D&R, let us consider that there are two alleles at each of two loci: a disease allele and a normal allele segregate at the first locus, and two marker alleles segregate at the other locus. The layout and notation for population haplotype, marker allele and disease allele frequencies are given in Table 1. The measures δ and D' are defined as δ = D/π+1π22 and D' = D/Dmax, respectively; where D = π11π22 − π12π21 and Dmax is the lesser of π1+π+2 and π+1π2+ when D > 0, or the lesser of π1+π+1 and π2+π+2 when D < 0. Under a deterministic population model, D&R assumed initial complete linkage disequilibrium between disease and marker loci; no change of disease allele and marker allele frequencies over time; the disease allele arose in a haplotype carrying the allele A1 at the marker locus, so that π21 = 0, π11 = π+1, π22 = π2+ and D > 0 at generation 0; and θ between the disease and the marker locus is constant along generations. After n generations, the decay of the initial disequilibrium (D0) can be obtained as a function of θ by means of the expression Dn = (1 − θ)nD0, where Dn is the value of disequilibrium in the nth generation (Hedrick, 2005). Expressing the measures δ and D' in terms of (1 − θ)n, D&R obtained then the following mathematical relationship:
where π+1π22 was considered to be the best estimate of D0, the initial amount of linkage disequilibrium, given that π21 = 0 at generation 0 and hence π11 = π+1. In contrast:
D&R concluded, therefore, that the measure δ is a function of θ only, whereas the relationship between D' and θ depends on haplotype frequencies. Nevertheless, the formulas (1) and (2) are conceptually erroneous. Any measure of the strength of disequilibrium is computed from haplotype frequencies at a given generation. Note, however, that the numerator and the denominator in the formula (1) refer to haplotype frequencies at generations n and 0, respectively. As initial complete linkage disequilibrium between disease locus and marker locus decays from D > 0 to D = 0, coupling (π11 and π22) and repulsion (π12 and π21) haplotype frequencies decrease and increase, respectively, by a proportion θ each generation. Accordingly, haplotype frequencies at generations 0 and n are distinct and they should be denoted differently. Distinguishing haplotype frequencies at generations 0 and n by πij(0) and πij(n), respectively, where i, j = {1, 2}; the formula (1) can be then rewritten as follows:
Therefore, the relationship between δ and θ depends on the frequencies of the haplotype π22 at generations n and 0. In terms of D', the formula (1) can be rewritten as:
given that π22(0) = π2+ and Dmax = π+1π2+ when D > 0 and π+1π2+ < π1+π+2. It is shown, therefore, that D' is directly related to the recombination fraction. Likewise, the formula (2) can be rewritten as:
given that π21(0) = 0. D&R studied the relationship between D' and θ when π1+ < π+1. Note, however, that π1+ = [π11(0) + π12(0)] cannot be lower than π+1 = [π11(0) + π21(0)] = π11 (0).
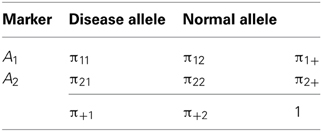
Table 1. Layout and notation for population haplotypes, marker alleles, and disease allele frequencies in a 2 × 2 table.
Our reanalysis on the relationship of the recombination fraction with the measures of disequilibrium δ and D' thus, contradicts the contention by D&R that δ outperforms D' for fine-scale mapping because changes of δ over generations are directly related to the recombination fraction. In fact, we reached the opposite conclusion to that of D&R. This finding reinforces the view that D' exhibits better statistical properties as a general measure of linkage desequilibrium than other commonly used measures (Zapata, 2011). In particular, D' seems to be an optimal measure for mapping of marker association and localization of disease loci sensu D&R.
References
Devlin, B., and Risch, N. (1995). A comparison of linkage disequilibrium measures for fine-scale mapping. Genomics 29, 311–322. doi: 10.1006/geno.1995.9003
Hill, W. G., and Robertson, A. (1968). Linkage disequilibrium in finite populations. Theor. Appl. Genet. 38, 226–231. doi: 10.1007/BF01245622
Kaplan, N., and Weir, B. S. (1992). Expected behavior of conditional linkage disequilibrium. Am. J. Hum. Genet. 51, 333–343.
Lewin, M. L., and Bertell, R. (1978). Re: “Simple estimation of population attributable risk from case-control studies.” Am. J. Epidemiol. 108, 78–79.
Lewontin, R. C. (1964). The interaction of selection and linkage. I. General considerations: heterotic models. Genetics 49, 49–67.
Nei, M., and Li, W.-H. (1980). Non-random associations between electromorphs and inversion chromosomes in finite populations. Genet. Res. 35, 65–83. doi: 10.1017/S001667230001394X
Keywords: genome-wide association studies, linkage disequilibrium and genetic recombination, linkage disequilibrium between diallelic loci, new disease mutations, 2 × 2 contingency tables
Citation: Zapata C (2013) Linkage disequilibrium measures for fine-scale mapping of disease loci are revisited. Front. Genet. 4:228. doi: 10.3389/fgene.2013.00228
Received: 30 July 2013; Accepted: 17 October 2013;
Published online: 05 November 2013.
Edited by:
Xuefeng Wang, Harvard University, USAReviewed by:
Alexandre Bureau, Université Laval, CanadaCopyright © 2013 Zapata. This is an open-access article distributed under the terms of the Creative Commons Attribution License (CC BY). The use, distribution or reproduction in other forums is permitted, provided the original author(s) or licensor are credited and that the original publication in this journal is cited, in accordance with accepted academic practice. No use, distribution or reproduction is permitted which does not comply with these terms.
*Correspondence:Yy56YXBhdGFAdXNjLmVz