
A commentary on
Functional environmental genomics of a municipal landfill soil
by Roelofs, D. et al. (2012). Front. Genet. 3:85. doi: 10.3389/fgene.2012.00085
In Figure 2
An error has been identified in the legend of Figure 2 after our article was published in Frontiers in Genetics. The current description in the legend of Figure 2 wrongly assigns red dots to soil samples and blue dots to extract samples.
The correct description in the legend of Figure 2 is as follows:
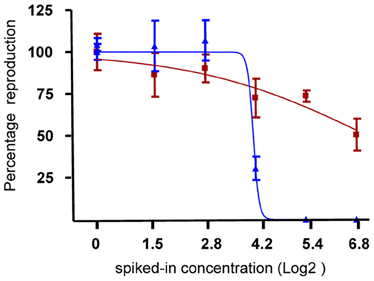
Figure 2. Effect of soil and extract on reproduction of F. candida. Blue dots indicate the number of F. candida juveniles in the jars after 28 days exposure to 6 dilutions of soil samples. Red dots indicate the number of juveniles retrieved after 28 days exposure to dilutions of extract samples. The lines indicate the dose-response curves derived from a logistic model. X-axis, Log2 transformed spiked-in concentrations; y-axis, percentage reproduction scaled to the control samples (set at 100%).
Citation: Roelofs D (2013) Erratum: Functional environmental genomics of a municipal landfill soil. Front. Genet. 4:69. doi: 10.3389/fgene.2013.00069
Received: 09 April 2013; Accepted: 11 April 2013;
Published online: 25 April 2013.
Edited by:
Chris Vulpe, University of California, Berkeley, USAReviewed by:
Chris Vulpe, University of California, Berkeley, USACopyright © 2013 Roelofs. This is an open-access article distributed under the terms of the Creative Commons Attribution License, which permits use, distribution and reproduction in other forums, provided the original authors and source are credited and subject to any copyright notices concerning any third-party graphics etc.
*Correspondence:ZGljay5yb2Vsb2ZzQHZ1Lm5s