 José M. Álvarez-Castro1* and Rong-Cai Yang2,3
- 1 Department of Genetics, University of Santiago de Compostela, Lugo, Spain
- 2 Research and Innovation Division, Alberta Agriculture and Rural Development, Edmonton, Alberta, AB, Canada
- 3 Department of Agricultural, Food and Nutritional Science, University of Alberta, Edmonton, Alberta, AB, Canada
Fisher’s concepts of average effects and average excesses are at the core of the quantitative genetics theory. Their meaning and relationship have regularly been discussed and clarified. Here we develop a generalized set of one locus two-allele orthogonal contrasts for average excesses and average effects, based on the concept of the effective gene content of alleles. Our developments help understand the average excesses of alleles for the biallelic case. We dissect how average excesses relate to the average effects and to the decomposition of the genetic variance.
Introduction
Since Fisher (1918), partitioning of the genotypic values at a locus into additive and dominance effects has been used for conventional quantitative genetic analyses and recently for mapping quantitative trait loci (QTL; see, e.g., Lynch and Walsh, 1998). Numerous statistical models have been proposed for such partitioning. Some of them are restricted to populations under Hardy–Weinberg equilibrium (HWE; see, e.g., Falconer and MacKay, 1996), including a special case of gene frequency being one half (Mather and Jinks, 1982). Others also adequately account for Hardy–Weinberg disequilibrium (HWD; e.g., Cockerham, 1954; Yang, 2004; Álvarez-Castro and Carlborg, 2007). Regardless of whether a population is in HWE or HWD, Fisher (1918) and others have shown that the additive and dominance genetic effects are simply the coefficient of a linear regression of the genotypic values on the gene content and the deviation from that regression, respectively. The regression coefficient is commonly known as the average effect of substituting one allele by the other in a diploid genotype (Falconer and MacKay, 1996).
As another measure of the additive effect, Fisher (1941) defined the average excess of an allele as the difference by which the average of genotypes carrying that allele exceeds the average of genotypes carrying the alternative allele. Fisher (1941) also pointed out that the average effect is equal to the average excess if the population is in HWE, but it is less than the average excess if inbreeding occurs. Such relationships between average effect and average excess have been subsequently confirmed and elaborated (e.g., Kempthorne, 1957; Falconer, 1985; Templeton, 1987; Lynch and Walsh, 1998).
In this note, we further clarify the relationship between the average effect and the average excess of a gene substitution based on a new set of general contrasts that entail both the average effects and the average excesses as particular cases. We provide a common conceptual and graphical interpretation for both parameters and further dissect how they are related to the decomposition of the genetic variance.
Model
Additive and dominance contrasts are commonly used to build and interpret models of genetic effects (e.g., Cockerham, 1954; Li, 1976; Zeng et al., 2005). Such contrasts enter the regression model as:

where Gij are the genotypic values, μ is the population mean,  and
and  are the additive and dominance genetic effects, and wij and vij are, respectively, the coefficients for the additive and dominance contrasts.
In this context, the values 0 and 1 can naturally be used to indicate the presence of alleles A1 and A2 in the genotypes, leading to the genotype indicator variable zij taking the values z11 = 0, z12 = 1, and z22 = 2 for A1A1, A1A2, and A2A2, respectively, and to the coefficients for the additive effects through wij = zij − E(z), where E(z) is the expectation of z (see, e.g., Zeng et al., 2005). This indicator variable has thus a clear biological meaning – the gene content of one of the alleles, A2. When using this indicator variable, the additive parameter is the average effect, i.e.,  and the dominance parameter is the dominance genetic effect
On the other hand, the average excesses of alleles in a population under HWD were proffered to further entail the effects of alleles due to correlations with other alleles in that population (Fisher, 1941). Aiming to allow for such correlations in our derivations, we here consider more general indexes. In particular, we introduce a constant c as the ratio of the average effect over the average excess (cf.Eq. 3of Fisher, 1941). Multiplying zij by this constant leads to a new genotype indicator variable with z11 = 0, z12 = c, and z22 = 2c. This new genotype indicator variable will serve to indicate the effective content of allele A2 in the three genotypes, as it will be further illustrated below.
The use of effective gene contents for obtaining orthogonal contrasts under HWD is summarized in Table 1. Obtaining the coefficients for the orthogonal additive contrast, wij, as zij − E(z), warrants that Σpijwij = 0, where pij, ij = 11, 12, 22, are the genotypic frequencies of the population (see, e.g., Cockerham, 1954). The coefficients for the orthogonal dominance contrasts, vij, are obtained to fulfill Σpijvij = 0 and Σpijwijvij = 0 (Álvarez-Castro and Carlborg, 2007). These are the deviations of the observed genotypic values from the expected values as predicted from the regression of the genotypic values on the effective gene contents.
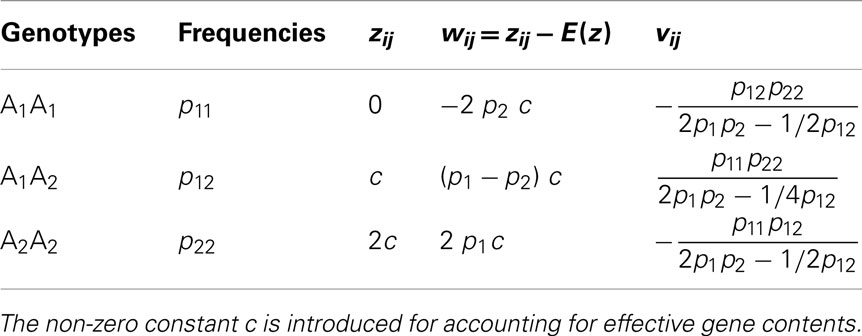
Table 1. Coefficients of orthogonal contrasts for the average effects and the average excesses for two allels at a locus.
Additive and dominance contrasts (e.g., the ones built in Table 1) can be conveniently expressed in matrix notation. This allows for a straightforward extension of the one locus model to and arbitrary number of loci with arbitrary epistasis under linkage equilibrium (LE; Tiwari and Elston, 1997). It has also been shown that the matrix notation enables straightforward transformations between parameters that have previously been expressed using appropriate contrasts (Álvarez-Castro and Carlborg, 2007).
Let thus G be the vector of genetic effects, E be the vector entailing the population mean and the additive and dominant parameters and S be the genetic-effect design matrix entailing the contrasts that allow for a transformation between vectors G and E. Then, just using the contrasts in Table 1 we obtain the matrix expression G = S·E as:
where pi, i = 1, 2, are the frequencies of the alleles, pi = pii + 1/2pij, j ≠ i.
A Unified Framework for Average Effects and Average Excesses
As mentioned above, the contrasts in Table 1 provide the average effects of allele substitutions when c = 1. It is thus not surprising that in this caseEq. 2reduces to Álvarez-Castro and Carlborg (2007)Eq. 8 – for the average (additive and dominance) effects. For analyzing how (2) relates to the average excesses, we first recall their definition for one biallelic gene (following Fisher, 1941; Kempthorne, 1957):
By inverting expression (2), it is easy to see that  when c = 1/(1 + F), with F = 1 − p12/2p1 p2 being Wright’s (1965) fixation index. F, with the range of −1 ≤ F ≤ 1, reflects any departure from the HWE, toward either an excess or a deficiency of heterozygotes. We can thus rename
  when c = 1/(1 + F). That is to say, Eq. 3restores the definition of average excesses of the alleles for a biallelic locus. We will consequently refer to (2) with c = 1/(1 + F) as the average-excess formulation of NOIA.
From the general expression (2), we have thus retrieved both the average effects and the average excesses as particular cases of the contrasts in Table 1, specifically with c = 1 and c = 1/(1 + F), respectively. Therefore, by implementing the effective gene content c we have actually made our model to capture the correlation between alleles that the average excesses account for. Further, using the relationship between the two values of c (1 and 1/(1 + F)) we are also retrieving the relationship between average effects and average excesses reported by Kempthorne (1957),  which actually applies to the case of multiple alleles (see also Templeton, 1987).
Evidently, the possible values of the function 1/(1 + F) depend on those of the fixation index, F. In particular, c = 1/(1 + F) must always be positive and within the range 1/2 ≤ c < ∞ for the allowable values of F ranging from complete homozygosity (F = 1) to complete heterozygosity (F = -1). When F = 0 (i.e., c = 1) we have the well-known case where the average effect and average excess are the same, that is under HWE. Since c = 1/(1 + F) must always be positive, α and α* will always have the same sign and will verify |α| = c|α*|. Taking all this into account, Table 2 summarizes how the fixation index affects the relationships between average excesses and additive genetic effects under three situations: heterozygote deficiency (F < 0), HWE (F = 0) and heterozygote excess (F > 0). Within that table, we also stress that the mathematical relationship between average excesses and average effects does not depend upon which one(s) of all potential biological features is (are) underlying a particular set of observed genotype frequencies.
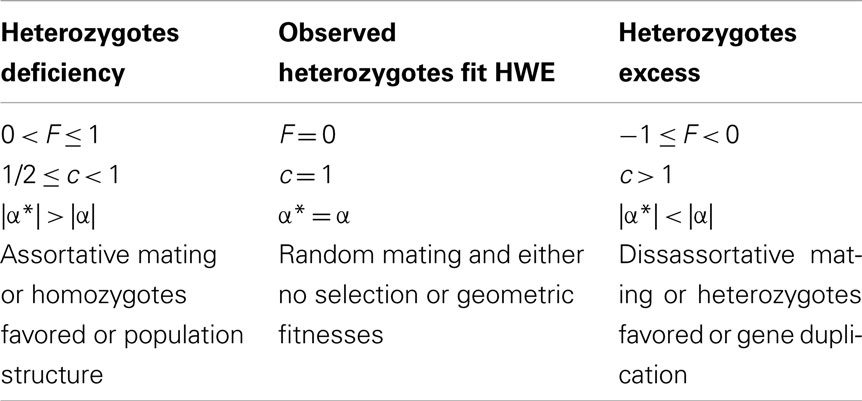
Table 2. Summary of some relevant mathematical and biological features associated to different statuses of the heterozygosity of a population.
Partitioning the Genotypic Values and the Genetic Variance
The average-excess formulation [expression (2) with c = 1/(1 + F)] comes from a linear regression (1) and it can thus be expressed by means of its intercept, μ, and its regression coefficient, α*, as:

This regression entails a decomposition of the genotypic values in which the predictions from the regression are the additive components and the deviations of the regression – due to dominance interactions – are the dominance components. For instance, the predicted [by (4)] value for genotype A1A1 is  Now, both Table 1 and expression (2) show that the dominance contrasts, vij, do not depend upon the scaling factor c and, hence, they are equal for the statistical and the statistical excess formulations. This implies that the dominance deviations are the same in both cases, i.e.,
  and that, therefore,
  That is to say, both formulations lead to the same decomposition of genotypic values,

This is illustrated in Figure 1, where we show the graphical interpretation of the decomposition of genotypic values coming from the average excesses and compare it with the classical decomposition coming from the average effects (Fisher, 1918). Note, particularly, that the decomposition of genotype A1A1 into additive and dominance parts is the same regardless of which linear regression is used. Interestingly, although for the average effects formulation (with c = 1) the predictions of the regression can be obtained by just summing up the appropriate average effects (see, e.g., Álvarez-Castro and Carlborg, 2007), this does not hold for the average-excess formulation [with c = 1/(1 + F)], i.e.,  unless the genotypic frequencies are under HWE. The reason for this is also noted in Figure 1, where it can be seen that
  and
and  associated to different values for the regression independent variable (
 whereas
  ). The exact relationship between these values under HWD is straightforward from
  and
and  (Kempthorne, 1957), which lead to:
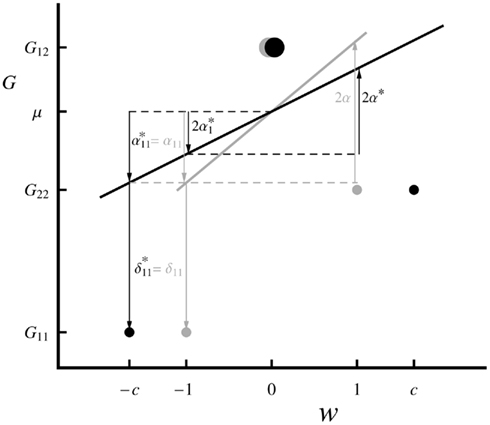
Figure 1. Graphical interpretation of the decomposition of the genotypic values (5) through the statistical excess (in black) and the statistical (in gray) formulations of NOIA for one locus with two alleles. For simplicity, a case with equal allele frequencies (p1 = p2 = 1/2) is shown. The specific genotypic values (circles; G11 = 1, G12 = 3, G22 = 2) displaying overdominance and a fixation index (F = − 2/5) have been chosen for facilitating the visualization of the parameters of interest. The size of the circles represents the frequency of the genotypes. Horizontal dashed lines emphasize coincident arrow edges, the upper one corresponding to the population mean phenotype, μ = 2.55. The regression independent variable of the statistical formulation is the gene content, whereas the one of the statistical excess formulation is scaled by c = 1/(1 + F) = 5/3 and it works as an effective gene content. For both cases, the independent variable, w, is rescaled by its expectation as shown in Table 1.

The decomposition of genotypic values being the same for the average effects and the average excesses (5) necessarily implies that they also lead to the same decomposition of the genetic variance. We have confirmed this result by substituting the average-excess additive contrasts (Table 1, with c = 1/(1 + F)) in the equation for the additive variance (see, e.g., Cockerham, 1954). When doing so, a common factor c2 can be simplified from both the numerator and the denominator of that expression so that the original expression for the additive variance is retrieved.
The additive variance coming from the average excesses is the variance of the values  Thus, the average excesses of the alleles enter the computation of the additive variance by just applying (6). Although a common way to express and compute the additive variance under HWD entails both the average (additive) effects and the average excesses [see, e.g., expression (4.23a) in Lynch and Walsh, 1998], here we have shown that either formulation alone suffices to provide the additive variance under HWD. We recall that this is true as long as the formulations are built using contrasts that are appropriate to HWD – as the ones we are providing in this communication for both the biallelic case.
Effective Gene Content
Hardy–Weinberg disequilibrium implies that alleles become (either positively or negatively) correlated in zygotes as compared to the expected genotype frequencies under HWE. A deficiency of heterozygotes, for instance, causes alleles to become positively correlated, leading to their effective additive contribution to the genotypes of a population to be more extreme (i.e., further away from their expectation) than under HWE. Fisher (1941) noted that this is accounted for by the average excesses. We note that this is not in contradiction with the interpretation of the average excesses of one allele as the conditional average genotypic deviation of the individuals that received that allele from at least one parent (see, e.g., Templeton, 2006).
For the biallelic case, we can trace Fisher’s (1941) remark in our graphical interpretation (Figure 1). We first recall that although both the average effects and the average excesses are linear regressions of the genotypic values (the regression dependent variable) as expressed in (1), each of them is regressed on a different independent variable. The independent variable of the formulation of average effects is the actual content of allele A2 (which is in Figure 1 shown as rescaled by its expectation) whereas the independent variable of the average-excess formulation is the effective content of allele A2 measured by a factor c. This factor being greater than one in our example (c = 5/3) reflects an excess of heterozygotes (particularly with F = − 2/5) and makes the slope of the regression for the average excess, α*, to be less steep than the one on the actual gene content, α, as noted in Table 2. Conversely, a deficiency of heterozygotes would make the slope of the average-excess regression to become steeper than the one of the regression for the average effects. Thus, the effective gene content c leads to the average excesses to reflect the effective contributions of the alleles to the genotypes of a population.
Closing Perspective
In conclusion, we have showed here that Fisher’s (1941) definition of average excesses can be phrased within a new regression framework that also generalizes the average effects. This has enabled us to clarify the significance of the average excesses in different ways. First, we have expressed the average excesses in terms of matrix notation within the NOIA framework, which entails the extension of that theory to multiple loci with arbitrary epistasis under LE and allows us to easily transform between average excesses and other genetic parameters. Second, we have fully integrated the average excesses into the theory for the decomposition of the genotypic values and the genetic variance into additive and dominant components. Third, we have provided a graphical interpretation of the average excesses that is analogous to the one of the average effects. Finally, we interpret the factor determining the relationship between average effects and average excesses as the effective gene content of individuals, accounting not only for the effects of their alleles but also for how pairs of alleles are correlated in a particular population.
Conflict of Interest Statement
The authors declare that the research was conducted in the absence of any commercial or financial relationships that could be construed as a potential conflict of interest.
Acknowledgments
José M. Álvarez-Castro acknowledges funding by an “Isidro Parga Pondal” contract from the autonomous administration Xunta de Galicia. This research has been supported by project BFU2010-20003 form the Spanish Ministry of Science (José M. Álvarez-Castro) and the Natural Sciences and Engineering Research Council of Canada, Grant OGP0183983 (Rong-Cai Yang).
References
Álvarez-Castro, J. M., and Carlborg, Ö. (2007). A unified model for functional and statistical epistasis and its application in quantitative trait loci analysis. Genetics 176, 1151–1167.
Cockerham, C. C. (1954). An extension of the concept of partitioning hereditary variance for analysis of covariances among relatives when epistasis is present. Genetics 39, 859–882.
Falconer, D. S. (1985). A note on Fisher’s ‘average effect’ and ‘average excess’. Genet. Res. (Camb.) 46, 337–347.
Falconer, D. S., and MacKay, T. F. C. (1996) Introduction to Quantitative Genetics, 4th Edn. Harlow: Prentice Hall.
Fisher, R. A. (1918). The correlation between relatives on the supposition of Mendelian inheritance. Trans. R. Soc. Edinburgh 52, 339–433.
Fisher, R. A. (1941). Average excess and average effect of a gene substitution. Ann. Eugen. 11, 53–63.
Mather, K., and Jinks, J. L. (1982). Introduction to Biometrical Genetics. London: Chapman and Hall.
Templeton, A. R. (1987). The general relationship between average effect and average excess. Genet. Res. (Camb.) 49, 69–70.
Templeton, A. R. (2006). Population Genetics and Microevolutionary Theory. Hoboken, NJ: John Wiley & Sons.
Tiwari, H. K., and Elston, R. C. (1997). Deriving components of genetic variance for multilocus models. Genet. Epidemiol. 14, 1131–1136.
Wright, S. (1965). The interpretation of population structure by F-statistics with special regard to systems of mating. Evolution 19, 395–420.
Yang, R.-C. (2004). Epistasis of quantitative trait loci under different gene action models. Genetics 167, 1493–1505.
Keywords: average effects, average excesses, effective gene content, models of genetic effects, non-equilibrium populations
Citation: Álvarez-Castro JM and Yang R-C (2012) Clarifying the relationship between average excesses and average effects of allele substitutions. Front. Gene. 3:30. doi: 10.3389/fgene.2012.00030
Received: 21 December 2011; Accepted: 17 February 2012;
Published online: 09 March 2012.
Edited by:
Jason Wolf, University of Bath, UKReviewed by:
Chen-Hung Kao, Academia Sinica, TaiwanAlan Templeton, Washington University, US Minor Outlying Islands
Copyright: © 2012 Álvarez-Castro and Yang. This is an open-access article distributed under the terms of the Creative Commons Attribution Non Commercial License, which permits non-commercial use, distribution, and reproduction in other forums, provided the original authors and source are credited.
*Correspondence: José M. Álvarez-Castro, Department of Genetics, Veterinary Faculty, University of Santiago de Compostela, Avda Carvalho Calero, s/n, ES-27002 Lugo, Galiza, Spain. e-mail:am9zZS5hbHZhcmV6LmNhc3Ryb0B1c2MuZXM=