 Antonino Vitetta
- Dipartimento di ingegneria dell’Informazione, delle Infrastrutture e dell’Energia Sostenibile, Università degli Studi Mediterranea di Reggio Calabria, Reggio Calabria, Italy
This paper considers the problem of path choice models in transport systems. It is studied within the wider problem of choice models. The main issues discussed are the classification of the utility choice model, also considering the non-random classes as quantum and fuzzy; the specification of path choice with particular reference to the easy-to-apply models within the assignment model; and a numerical results comparison in a small test system to allow the results control in each element and the reproduction. The random, quantum, and fuzzy utility models are different, and the validity of each must be tested case by case. With the assumed parameters, the models cover different trends in simulating paths overlapping. The models require application in a real system and calibration of the parameters with real data.
1 Introduction
Simulation and transport systems design require matching travel demand with transport supply sub-models. The travel demand sub-models simulate how user behavior (and consequently the demand flow) is influenced by network performance. The transport supply sub-models simulate how performance is influenced by demand flow. These two sub-models are dependent on each other. In the demand sub-models, user behavior is simulated, and it is influenced by how the users perceive the utility and how the analysts model it. Users maximize the perceived utility, and the analysis models user behavior as accurately as possible. For more details and developments on utility models, see Ben-Akiva and Lerman (1985), Ortúzar and Willumsen (1994), Cascetta (2009), and Cantarella et al. (2020).
In a transport utility model, the utility can be deterministic or non-deterministic (Figure 1). Non-deterministic utility functions can be classified into two categories in relation to the function associated to each utility (i.e., a probability distribution function (DF) for random or a fuzzy membership function (MF) for fuzzy): homoscedastic (all the utilities have the same finite variance) and heteroscedastic (at least one of the utilities has a different finite variance) with equal or different specifications across users, alternatives and/or time (varying through a deterministic or stochastic process). Note that variance is a concept applied in the probabilistic model that can also be transferred to other non-deterministic models, importing only the mathematical specification and adapting the interpretation respecting the real phenomena. The non-deterministic distribution functions could be disjoint or joint.
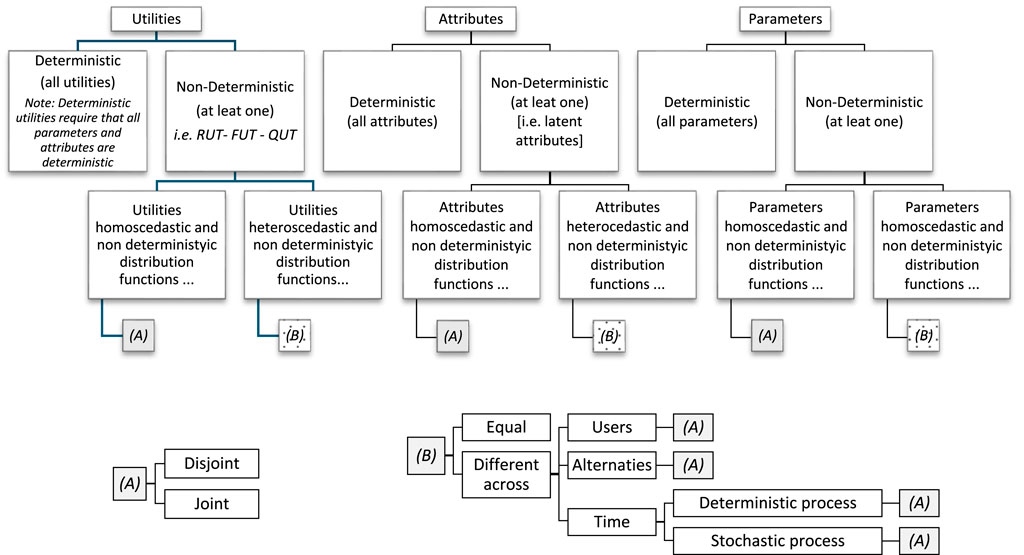
Figure 1. Classification of the choice model.
The utility is derived from the attributes and parameters. A deterministic utility model requires all parameters and attributes to be deterministic. A non-deterministic utility model can be formed by including at least one non-deterministic parameter or one non-deterministic attribute. In common applications, the utility has all deterministic or all non-deterministic attributes. The same consideration could be made for the parameters. As reported for the utility, also non-deterministic attributes and parameters could be homoscedastic or heteroscedastic; with non-deterministic distribution functions equal or different specifications across users, alternatives, and time; with disjoint or joint non-deterministic distribution functions (Cantarella et al., 2020). From a mathematical perspective, there are no limits to the combinations of distributions for parameters, attributes, and utilities. A specific and recent class of models belongs to the field of hybrid models (Guzman et al., 2021; Kim et al., 2014), which also consider latent variables and a non-linear utility function. From a mathematical point of view, these models have non-deterministic attributes, with or without non-deterministic parameters and non-deterministic utility.
Figure 2 classifies the possible utility in terms of variances associated with the parameters and attributes. This is assuming that the utility does not add any additional uncertainty. If all the parameters and attributes are deterministic, the utility is deterministic, and the model is deterministic. If only the parameters or only the attributes are homoscedastic (and the other are deterministic), the utility should be homoscedastic or heteroscedastic in relation to the stability of the characteristic in the utility specification. The utilities are heteroscedastic if the parameters and/or the attributes are heteroscedastic.
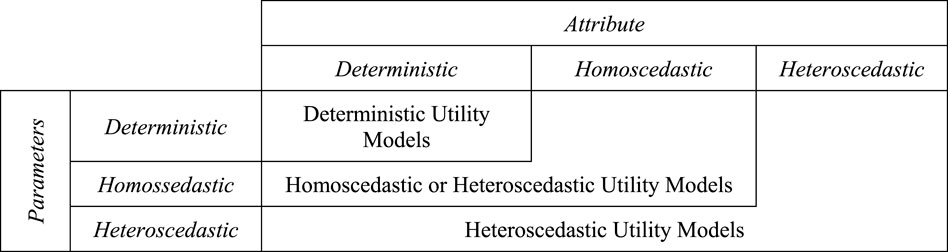
Figure 2. Homoscedastic and heteroscedastic classification in relation to the attribute and parameter typology.
Utility models are used to estimate travel demand in transport systems, typically dividing the decision process into subsequent and conditional decision levels. In the most common demand models, the main decision levels are relative to whether to travel or not to travel from an origin, once or with a defined frequency, for a purpose; conditioned on the decision to travel, a desired departure and/or arrival time, a destination to reach, a mode and service or multi-mode and multi-services to use; a path or hyper-path to follow, assumed given the decisions of the previous levels. Depending on the problem studied, other levels may be added, some levels may be deleted or aggregated, and the order may be different. As an example, consider that in an emergency (Lovreglio et al., 2016; Russo et al., 2024), the user tries to find a safe destination with an immediate or non-fixed departure time, with mode and/or path eventually constrained by an external decision maker.
This paper studies the last level of decision in the common model, the path choice model. In relation to the contribution of this paper, the main objective of the paper is to classify, specify, and compare consolidated and recent models that can be applied within assignment models and procedures (Di Gangi and Polimeni, 2022) and that allow the possibility of being calibrated from real data. The main characteristics required are:
• The possibility of being integrated within an assignment model and algorithms;
• The ability to model path overlap in assignment models;
• The application in implicit or explicit path enumeration algorithms;
• The extension to large and real-scale transport systems;
• The estimation of parameters from aggregated or disaggregated observations.
A comparison of all potential proposed path-choice models is beyond the scope of this paper. The comparison is not limited to the class of random utility model (RUM), which is widely applied in transport systems, not only at the level of path choice but also to the quantum utility model (QUM) and fuzzy utility model (FUM) classes. The QUM and FUM encompass additional behavioral aspects not represented by RUM.
The principal innovation of this paper is the comparison of some RUM and non-RUM models, with characteristics reported below, in path choice in a test system. The following points, which correspond to sections of this paper, summarize the innovation:
• The methodology for specifying the path choice is defined and divided into seven macro steps in Section 2.
• The three classes of utility theories and models (RUM, QUM, and FUM) proposed in the literature are specified and compared in terms of their assumptions, and the specifications of the three classes of models are reported in Section 3, adding the trivial deterministic utility model (DUM).
• Experiment and compare the results of the specified models in a small test system in order to facilitate step-by-step application, enable reproduction of results, and facilitate comparison of results; the experimentation in the test system is reported in Section 4.
• The results derived from the application of the models, with discussion, main conclusions, and some further developments, are reported in Section 5.
2 Choice model
The choice model can be divided into two main choice levels: the choice of the perceived set (or sets) containing the alternatives and the choice of the alternative from the perceived set (or sets). Each of the two models, associated to each choice level, requires the definition of the elementary alternatives, the attribute, the parameters, and the utility function for each elementary alternative.
The main element is shown in Figure 3 for the definition, notation, and model specification.
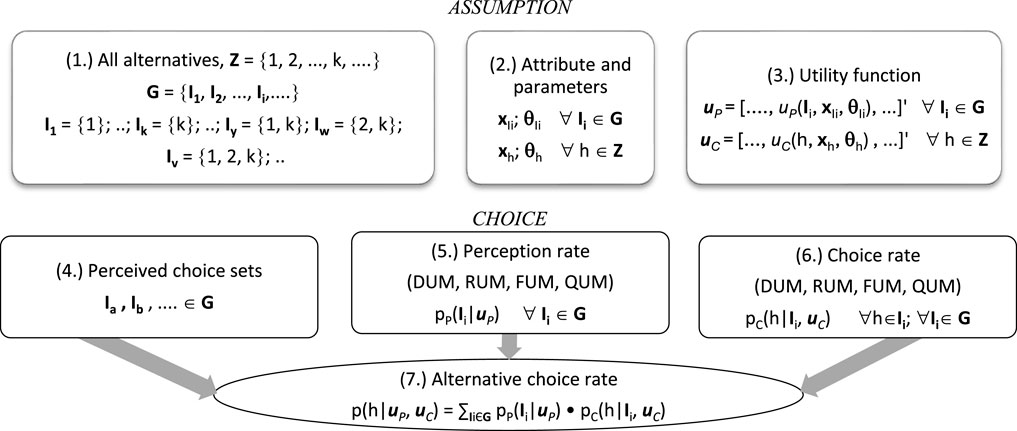
Figure 3. Architecture of the choice model.
The bullet points in the next two sub-sections refer to the numbers reported in Figure 3.
2.1 Definition and notation (assumption)
(1.) The simplest alternative is a path k between an origin and a destination, with no loops. The set Z includes a finite number of paths. The power set G of Z, excluding the empty set, includes all possible non-empty subsets I1, … Ii, … of Z; these subsets are candidates for user perception.
(2.) In order to consider the two decision levels (perceived set/sets and alternative), it would be helpful to define four vectors:
• xIi, ∀ Ii ∈ G, the attribute vector for each perceived set Ii; it contains the variables (level of service, criteria, attractiveness, etc.) that users perceive as defining the set;
• θIi, ∀ Ii ∈ G, the parameter vector for the utility for the perceived set Ii;
• xh, ∀ h ∈ Z, the attribute vector for each alternative h; it contains the variables (level of service, attractiveness, etc.) that users perceive as defining the alternative;
• θh, ∀ h ∈ Z, the parameter vector for the utility for the alternative h.
(3.) It is essential to define a utility function at each decision level and for each perceived set and alternative:
• uP = […, uP(Ii, xIi, θIi), …]' ∀ Ii ∈ G, the vector of the utility function associated with the perceived sets; each element of the vector is the utility function uP() associated with the perceived set Ii, depending on the attributes xIi and parameters θIi; the utility function for non-deterministic models includes the parameters of the DF or the parameters of the MF; for example is, the expected value and the variance for the Gaussian in a probit RUM; the left, center, right, and maximum values in a triangular FUM;
• uC = […, uC(h, xh, θh), …]' ∀ h ∈ Z, the vector of the utility function associated with the alternatives; each element of the vector is the utility function uC() associated with the alternative h, depending on the attributes xh and parameters θh; the utility function for non-deterministic models includes the parameters of the DF or the parameters of the MF; for example is, the expected value and the variance for the Gaussian in a probit RUM; the left, center, right, and maximum values in a triangular FUM.
2.2 Model specification (choice)
(4.) The perceived choice set is a subset of G. It is common to consider only one set, either the set that contains all the paths (exhaustive approach) or a subset of them (selective approach). It is reasonable to assume that a user may perceive more than one choice set. However, in real conditions, it is likely that a very low number of sets are perceived. From a mathematical perspective, all the sets can be considered with a perception rate (reported in Point 5): greater than zero for the perceived sets and zero for the non-perceived set.
(5.) The perception rate, pP(Ii|uP), is associated with each perceived set Ii. The models refer to a given set G, omitted in the formulas for simplicity's sake. All perception rates are greater than or equal to zero (pP(Ii|uP) ≥ 0, ∀ Ii ∈ G), and the sum of all perceived sets is equal to one (∑IiЄG pP(Ii|uP) = 1). From a mathematical standpoint, the perception rate is zero for the sets not perceived by the users. If only one choice set is perceived, the perception rate is 1 for that set and 0 for the others. Several types of models can be adopted to evaluate the perception rate, some of which are discussed in Section 3.
(6.) The choice rate, pC(h|Ii, uC), is associated with each alternative h belonging to a perceived choice set Ii. All the choice rates are greater than or equal to zero (pC(h|Ii, uC) ≥ 0, ∀ Ii ∈ G, ∀ h ∈ Ii). This is true for all choice sets that are perceived. Furthermore, the sum of all the alternatives belonging to a given set is equal to one (∑hЄIi pC (h|Ii, uC) = 1, ∀ Ii ∈ G). Several types of models can be adopted to evaluate the perception rate, some of which are discussed in Section 3.
(7.) The alternative choice rate is given for each alternative (independently from the perceived choice set). In the general case, the alternative choice rate is evaluated with Equation 1 from Mansky (1977):
In the particular case that only one set is perceived (i.e., set Ia), the alternative choice rate is evaluated with Equation 2:
3 Main models in path choice
This section presents some models for perception rate and choice rate evaluation. Each requires a specific utility function and model that must be specified, calibrated, and validated (Comi and Polimeni, 2022). The models must take into account sets and alternatives dependency because a perceived choice set has common paths, and the paths partially overlap.
3.1 Deterministic utility theory
The choice must be evaluated using a deterministic utility theory (DUT) and models. In a deterministic model, the user can choose the path that offers the greatest utility (or the lowest cost). If a path is used by users, it has a maximum utility. However, if a path has the maximum utility, it might not be the path chosen, particularly when there are multiple paths with the same maximum utility. It is evident that if a path is used, the choice rate is greater than zero; however, a path with minimum utility could not be used. This is true except when all paths share the same utility value. In a non-congested system, given a set of paths, the choice rate exists but could not be a unique solution.
As an example of a DUT, consider a system with three paths with utilities 11, 11, and 10. The first two paths have the maximum utility and can be chosen with DUM. In DUM, all users could choose the first path: the first path is chosen and has the maximum utility, and the second path has the maximum utility and is not chosen. All users could also choose the second path, or a subset could choose the first path, and another subset could choose the second path: the uniqueness of the solution is not guaranteed.
Given a perceived set of alternatives L, the utility functions u for a path m belonging to the perceived choice set with utility um follow for the choice rate pDE (m |u) reported in the Equations 3.a, 3.b:
3.2 Random utility theory
The choice could be evaluated using a non-deterministic model. The most consolidated approach in the field of discrete choice in transport systems is the random utility theory (RUT) (Domencich and McFadden, 1975).
In the context of path choice, RUT (Ben-Akiva and Lerman, 1985; Cascetta, 2009; Tinessa et al., 2023) assumes that for path choice, in a journey, a user: (a) perceives a set of alternatives; (b) associates to each alternative a perceived utility; (c) chooses the alternative of maximum utility; (d) the utility is modeled with a continuous random variable. Given these assumptions, the choice rate for an alternative m (it should be a perceived set or a path) belonging to a set L, given the utility functions u, is evaluated with Equation 4:
Any probability DF can be used for the parameters, attributes, and utilities. Some DFs are adopted more frequently because they have properties that are useful for modeling user behavior and for utility specification.
Identical and independent Weibull DFs for the utilities allow specifying the logit model, and the probability can be evaluated in a closed form. Identical and independent Weibull DFs guarantee that the maximum utility (also known as satisfaction) has a Gumbel DF. It does not guarantee that the sum of Gumbel DFs is a Gumbel DF. Very often, the utility is obtained as a linear combination of the attributes weighted by the parameters. Therefore, deterministic parameters (or attributes) and Gumbel DFs for the attributes (or parameters) do not guarantee that the utility is a Gumbel DF. The model is only valid for independent alternatives.
Different Gumbel DFs for single alternatives and for subsets of alternatives introduce a covariance from the alternative belonging to the same set and the nested logit model with different sub-categories, some of them are hybrid (Vallejo-Borda et al., 2023) or mixed (Lovreglio et al., 2016). The introduction of latent variables allows for the consideration of variables that are not directly observed (Cantillo et al., 2015; dell’Olio et al., 2023).
Gaussian DFs for the utilities allow the specification of a probit model. The probability cannot be evaluated in closed form, but it allows for the modeling of dependent alternatives, and it guarantees that the sum of Gaussian DFs is a Gaussian DF. It does not guarantee that the maximum of Gaussian DFs is a Gaussian DF. In this context, in linear utility specification, the Gaussian DF of the attributes (or parameters) gives the Gaussian DF for the utility.
The logit and probit family models, based on RUM, are the most appropriate choice models for path choice. The logit family allows closed-form evaluation, stability respects utility maximization, and explicit or implicit path enumeration is adopted. For path choice, the main models adopted are the path-size (Ben-Akiva and Bierlaire, 1999), C-logit (Cascetta et al., 1996), and link-nested-logit (Vovsha and Bekhor, 1998), which consider the overlapping effect. The probit family does not allow for a closed-form evaluation, and implicit path enumeration is adopted, often with Monte Carlo simulation algorithms (Sheffi and Powell, 1982).
Other less common models are gammit (gamma DFs for the utility) and lognormal (lognormal DFs for the utility). These models guarantee that the DFs are defined only for positive or negative values of the utility.
3.3 Quantum utility theory
Starting from the hypothesis defined in RUT, the quantum utility theory (QUT) and models are also based on the assumption that users make an intermediate choice, that is, based on criteria, before the final choice (Vitetta, 2016). In this intermediate choice, the user will select more than one intermediate alternative due to incomplete information and interfering perception.
In the path choice model, the RUT operates at an intermediate level, whereby a criterion is selected (e.g., minimized time), and the choice rate for an alternative generated with the criterion is evaluated. In contrast, the QUT operates at an intermediate level, whereby more than one criterion is selected at the same time (e.g., minimum time and minimum cost contemporaneously), and the choice rate for an alternative generated with the criteria is evaluated. In this QUT, an interference term r() for each alternative must be introduced. From a theoretical standpoint, it is set to zero when only one criterion is perceived at the intermediate level. It should be noted that in the RUM, more than one criterion can be perceived but separately from one another; in this case, the choice rate could be evaluated with nested logit or cross-nested logit models.
In QUM, the choice rate
The interference term
For an intermediate decision level with alternatives (i.e., criteria) c1, c2, , cN, the RU term has the classical conditioned probability specification given by Equation 8:
The interference term has the specification given in Equation 9:
The angle θmc,mc’ is the interference angle between each couple of interfering alternative c and c' for the alternative m. It is π/2 (and the cosine is zero) if the two corresponding intermediate levels for the alternative m are not interfering. If all the intermediate levels for all the alternatives are not interfering, the sum is zero, and the interference term is zero; in this case, QUM degenerates in RUM, and RUM is a particular case of QUM.
If only two alternatives, c1 and c2, are available at intermediate levels, the interference term is expressed by Equation 10:
QUMs are more appropriate than RUMs when users do not have clear information about the alternatives, and the a priori decision is influenced by the interference between perceptions, not only the imprecise values of the perceived attributes. The interference can be reduced by real-time information but may increase if a detour is required en route (e.g., an accident). In some cases, it is also possible in the path choice that some criteria used to generate the perceived path are in conflict, and the decision is influenced by the opposite criteria to be optimized (i.e., minimum pollution and minimum travel cost and time).
For more details on the route choice model with QUT, see Vitetta (2016).
3.4 Fuzzy utility theory
The fuzzy utility theory (FUT) and models assume similar assumptions of RUT for the user with the difference (assumption d in RUT) that the utility is modeled with a fuzzy number defined through a MF (Henn, 2003; Henn and Ottomanelli, 2006). This assumption allows us to evaluate the rate of choice for each alternative m belonging to the set L, given the utility functions u, with the possibility that the alternative has the maximum utility evaluated with Equation 11:
In MF, for each path, the utility defined with a MF has a different meaning with respect to the DF. One model is not a special case of the other. The MFs give a possibility that can be between zero and one for each utility value. A user can associate the maximum value of the possibility with a precise value of the utility. The comparison between the utilities of the alternatives is in the realm of possibility theory, where the utility is considered as a fuzzy number. The utility could be derived from a fuzzy number associated to the whole values and/or a fuzzy number associated to the parameters and attributes.
For the application of the FUT, the sum of the fuzzy number (of non-additive and link cost utilities vs. path utility), the comparison of the utilities of the different alternatives for the evaluation of the possibility, and the conversion from the possibility to the probability are required.
The addition of two fuzzy numbers A and B, with MF μA(x) and μB(y), respectively, gives a fuzzy number C with MF specified in Equation 12:
The comparison of two fuzzy numbers (Iskander, 2002) depends on the MF. Given two triangular fuzzy numbers, A and B, with characteristics.
• Left values a1 and b1 and right values a2 and b2,
• Main values a and b,
• MFs μA and μB, with maximum values of the functions θ∈(0,1],
The possibility that A is equal to or greater than B is determined by Equation 13:
The comparison between two trapezoidal fuzzy numbers of a trapezoidal fuzzy number and a triangular fuzzy number is reported by Iskander (2002).
The sum of all possibilities could also be more than one, considering that there is no axiom, such as probability, that the sum must be one. For this reason, a transformation from possibility to choice rate must be introduced (Equation 14) to guarantee that the sum of all possibilities and all alternatives is one (a method is proposed by Klir, 1990):
with the γ parameter being greater than zero.
3.5 Parameter estimation
Very often, in RUM and QUM, the expected value of the utility and in FUM, the core of the fuzzy number for each alternative m, Vm, is assumed as a linear combination of measurable transport service levels and socio-economic variables, x, by means of unknown parameters, β specified in Equation 15:
It is common for the parameters to encompass the parameters of the DFs in RUM, the parameters of the DFs and the interference term in QUMs, and the parameters of the MFs in FUMs.
The parameters must be calibrated from real data using disaggregated or aggregated methods and classical or Bayesian approaches. Further details can be found in Cantarella and Vitetta (2023).
4 Experimentation
This section presents the results of a numerical experiment conducted in a small test network; it is easier to control the results in case limits when the paths are defined appropriately. In transport assignments, the presence of similar cost paths with different levels of overlap is common. Following the Wardrop (1952) principle, users cannot reduce their costs by changing their paths unilaterally in congested conditions. The experiment is designed to compare different path-choice models and highlight the impact of varying specifications and assumptions in a small system. The aim of this paper is not to compare and test all literature models. The aim is to compare some models for each category, highlighting the pros and cons of each. It is clear that the results depend on the real case studied. Figure 4 shows a small test system that allows for the testing of this similarity and overlapping. It has already been adopted in many published papers. The network has an origin (A), a destination (B), an intermediate node (C), four links (1, 2, 3, 4), and three paths (one independent -path I- and two overlapping with the common link 2 -paths II and III-).
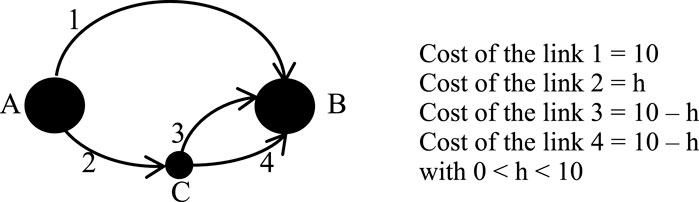
Figure 4. Test system.
4.1 Deterministic utility
The DUM assumes that users perceive and choose the alternative with the highest utility (or lowest cost). If only one alternative has the maximum utility (or the minimum cost), it is the only choice, and the others are excluded.
If two or more alternatives have the same utility (or the same cost), the problem is undetermined. This is the case of the text system shown in Figure 4: all values greater or equal to zero with a sum equal to 100% are acceptable for these alternatives.
4.2 Random utility
The network shown in Figure 4 is used for the RUMs. Two different cases are tested: (i) absence of covariance between paths with logit and probit models (and homoscedastic utilities); (ii) covariance between paths with C-logit and probit (and heteroscedastic utilities). The results are presented in Figure 5 for the four models tested. All probabilities can also be read from the figures. The probabilities of paths II and III are shown in the figures for all scenarios, and the probability of path I is 100% less the sum of the probabilities of paths II and III.
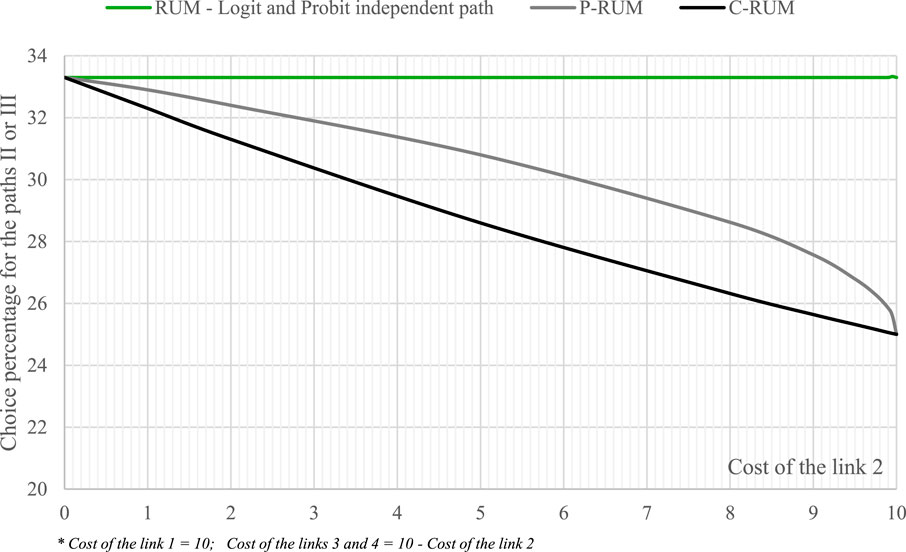
Figure 5. Results in the test system with some RUMs.
In the first case (i), it is not possible to model the overlapping effects of the (two) paths in the absence of covariance. In a homoscedastic logit and probit model, the choice percentages for the three paths are equal. The 100% rate is divided equally between the paths. In a logit model, the Gumbel DF is assumed to have the same parameter (same variance). In a probit model, the same predefined variance is assumed for all paths. It is assumed that the expected value of the DF is equal to the path cost for both models.
In the second case (ii), the two paths can be modeled in the presence of covariance between two of the three paths. The first model considered is the probit (P-RUM) model proposed by Sheffi and Powell (1982). It assumes a Gaussian DF for the paths with an expected value equal to the path cost, a variance proportional to the path cost, and a covariance between the two paths proportional to the common cost of the paths. It is generated with an algorithm with the assumption that each link follows an independent Gaussian DF with an expected value equal to the link cost and a variance proportional to the link cost. The second model is the C-logit model (C-RUM), which adds a commonality factor term (Cascetta et al., 1996) dependent on the similarity of the paths to others to the expected value of the utility. The logit model is assumed, with a Gumbel DF for all paths with the same parameter. The expected value is the path cost plus the commonality factor. It is heteroscedastic because the presence of the commonality factor introduces a heuristic covariance.
4.3 Quantum utility
The network shown in Figure 4 is used for the QUMs. It has been tested against the interference term specified by Vitetta (2016). The interference term for a given origin-destination pair and path m is given by Equation 16:
where
• β is a parameter in the range in relation to the level of interference;
• s = Σh pRU(m | u) ⋅ ch / gh;
• gm and cm are the total cost of the path m and m in common with other paths.
The results are presented in Figure 6 for the three values of the parameter β. The quantum term models the dependency between two of the three paths. The model accurately represents the dependency effects, and the value of the parameter has a significant influence. Other specifications can be adopted. Di Gangi and Vitetta (2021) propose a specification depending on the criteria for generating paths and on the interference angle; the parameters of the proposed specification are calibrated from the aggregate traffic count.
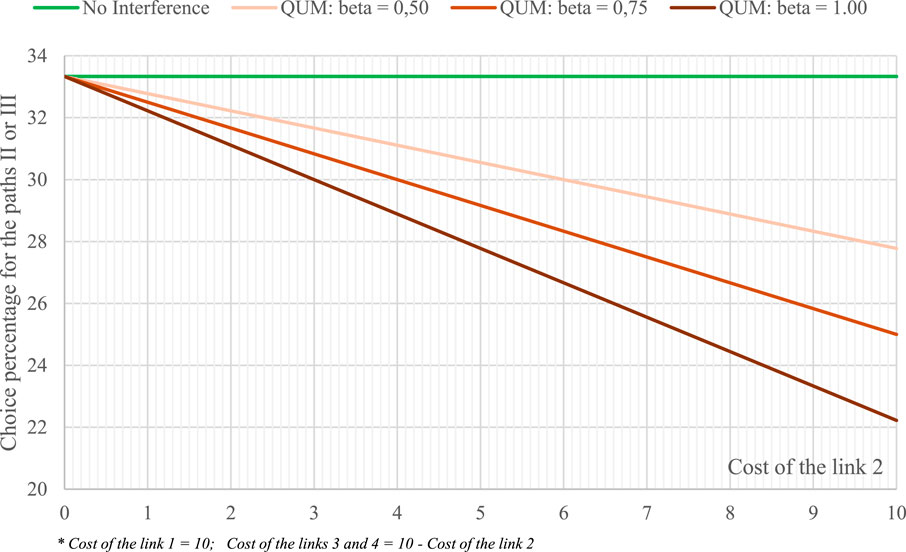
Figure 6. Results in the test system with some QUMs.
4.4 Fuzzy utility
The network shown in Figure 4 is used for the FUMs. Two different cases are tested: (i) no dependency between paths and (ii) dependency between paths. A triangular MF is considered for the fuzzy utility. In all cases (the path in the first case and the link in the second case), it is assumed that the main (or maximum) value of the MF is in the value of the expected cost; the zero (minimum) values are assumed on the left to decrease the expected cost by 50% and on the right to increase the expected cost by 50%. The maximum value of the MF is 1 in the first case and depends on the degree of overlap in the second case. This assumption, which measures the dispersion around the expected value, can be easily changed, and different percentages on the right and left can be considered.
In the first case (i), called path-FUM in this application, it is not possible to model the overlapping effects of the paths in the absence of dependency. The choice percentages relative to the possibilities and to the probabilites for the three paths are equal.
In the second case (ii), called in this application C-FUM, the triangular MF is associated with each link, and it can be assumed that a triangular fuzzy number is obtained for the sum of two triangular fuzzy numbers (from link cost to path cost). The core of the fuzzy number related to the path follows the C-FUM approach proposed by Quattrone and Vitetta (2011).
The results are shown in Figure 7 for the two cases tested.
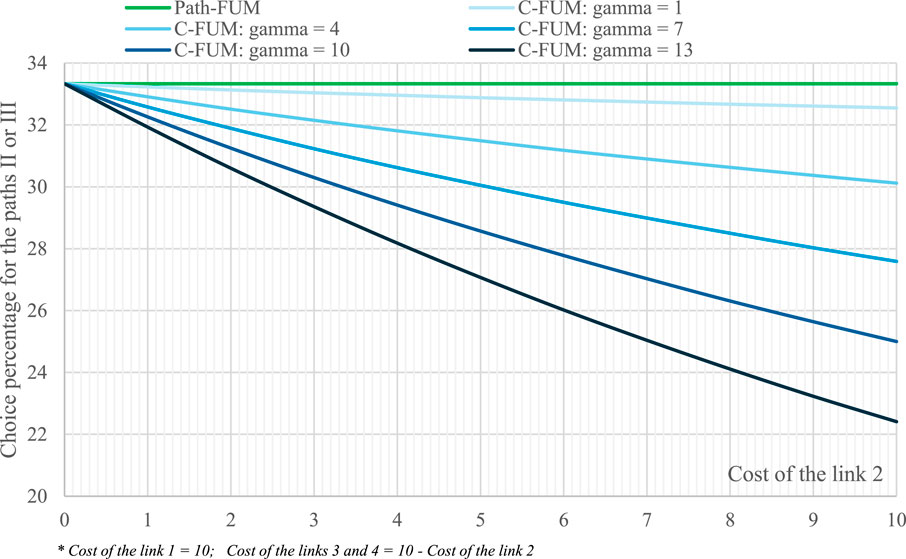
Figure 7. Results in the test system with some FUMs.
5 Discussions and conclusion
This paper compares some path choice models derived from random, quantum, and fuzzy approaches. The objective is to compare the influence of some easy-to-use route choice specifications in modeling the influence of path overlap; the specification must be considered in assignment models applied to real-size transport systems and in real-time computation time. The section is divided into two main parts: some discussion points obtained with each model, a comparison of the results, and some conclusions and indications for further developments.
5.1 Discussion
5.1.1 Deterministic utility
The test is forced in a system with three paths with equal cost. The problem can assume any value for the choice probability for the three alternatives as long as the sum is 100%. These values are independent of the overlapping (link 2). This model is an inaccurate representation of reality and is not discussed further.
5.1.2 Random utility
The RUMs also give a solution in the case of the same path cost. If the covariance is not modeled, the choice probability is the same in the three paths, independently from the overlapping level (h, cost of link 2): the probability is 1/3, split equally between the three paths. This model is clearly not an accurate representation of reality. Modeling the covariances will result in a change to the choice probability. However, when the covariances are modeled, and the two paths overlap completely (two of the three paths degenerate in one path), the probability splits equally (1/2) between the independent and the degenerated path: the choice probability is 1/2 for the independent path and 1/4 for each dependent path that degenerates in only one path (the sum is 1/2). This type of model accurately represents reality, as the probability changes in relation to the overlapping with congruent values at the two extreme overlapping levels. The C-logit specification tested in this paper demonstrates an almost linear tendency between the two overlapping levels, with the probit probably providing a highly accurate representation of reality.
5.1.3 Quantum utility
In the quantum model, it is assumed that the interference term is zero if all paths are not overlapped (in the test system, 1/3 probability for each path); it increases with the degree of overlap (positive interference term for the non-overlapped path; negative interference term for the overlapped path, term increasing with the degree of overlap). The probability of the overlapped path decreases with the degree of overlap. The interference parameter β has a different effect on the decrease, which is not the same as that observed in logit and probit RUMs. In the complete overlapping case, the choice probability depends on the interference parameter and is not necessarily equal to 25% for the two completely overlapped paths.
5.1.4 Fuzzy utility
If the dependency is not modeled (which this paper refers to as a “fuzzy path”), these models can only give the same value for the choice possibility and probability in the three paths; this model is an inaccurate representation of reality. Modeling the dependencies will result in a change to the choice probability (which this paper refers to as a “C-FUM”). The probability of each path is dependent on the level of overlapping and the value assumed by the Klir function. As with RUM models, the probability decreases with overlapping. As with QUM, in the completely overlapping case, the choice probability is not necessarily equal to 25%. It depends on the Klir parameters. Note that the C-FUM, with a particular value of the Klir parameter, has the same tendency as the C-logit. Other specifications must be found for the fuzzy model to represent a different behavior from that represented by the C-logit.
5.2 Conclusions and further developments
In the considered test system, the two bound values (non-overlapping paths and fully overlapping paths) are: (a) if the three paths are not overlapped and have the same cost, they must have the same probability (1/3); (b) if two of the three paths are completely overlapped, the network degenerates into two independent paths with the same cost; in this case, the choice probability must be 1/2 for one real path and 1/2 for the two aggregated path, divided by 1/4 for each path.
All the models correctly evaluate case (a). Only RUMs converge to the expected value for case (b). FUMs and QUMs will correctly converge to the expected value for case (b) when the appropriate parameters are calibrated. The results are compared for these models and reported in Figure 8.

Figure 8. Results in the test system with RUM, FUM, and QUM giving a 25% choice percentage with a complete overlap.
It is not possible to say with certainty whether the modeled value obtained with RUMs, QUMs, and FUMs is correct or not in line with reality, given the tendency between the two bound values. The results reported in Figure 8 show that the tendencies are between the RUMs link-probit at the top and C-RUM and C-FUM at the bottom; the QUMs follow the intermediate tendency, as covering the intermediate tendency not covered by the RUMs specifications tested. The tendency depends on the context, so obtaining information about the most realistic models requires comparing the results with real data observed in the context studied.
A comparison of the models studied, with the parameters that give a 25% choice percentage with complete overlap, is shown in Table 1. C-RUM and C-FUM give similar results considering the adopted statistics. All models are significantly different from the case of the independent path; the probit (P-RUM) is the model that has the lower distance with the case of independent paths. Probably, the similarity between C-RUM and C-FUM is due to the same specification adopted for the commonality factor and for the small size of the test system considered with the same total expected cost. Additional research to test other specifications is required.
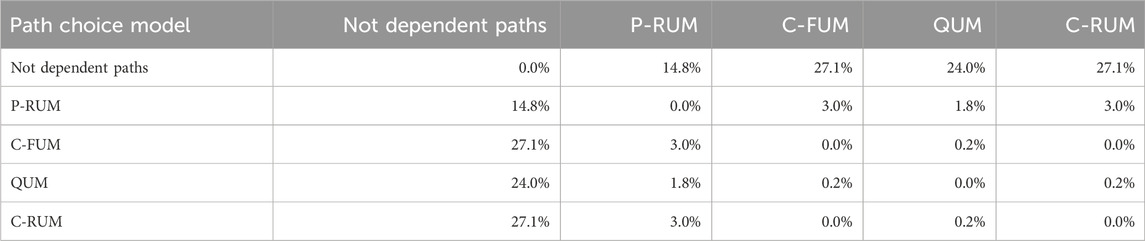
Table 1. Mean square difference between the choice percentage for paths II or III with RUM, FUM, and QUM, with parameters that calculate 25% choice percentage with a complete overlap.
The main findings for path choice models are that all tested models that simulate the overlap can represent the real condition, but without data, it is not possible to define a priori the model closest to reality; the parameters in all models play a key role, and they must be calibrated from real data to obtain results close to reality. In the overlapping condition, the simpler model is the C-RUM, considering the simple mathematical form and the possibility of applying it in implicit algorithms; promising models are FUMs and QUMs that consider overlapping, as they can allow simulating other behavior respecting that represented with RUMs.
The models must be included in an assignment model in which demand mobility is assigned in a supply system in a congested condition. The assignment in a real-size system requires an easy-to-use path choice model because it is the core of the model and is applied many times in the procedure for finding the exact or heuristic solution. A limitation of this study, to be improved in future research, is related to the application in a small system; it has the advantage of being able to control all the results, but it has the limitation of not being able to find the problem that can arise in a real large system. This is why one of the first advancements is the comparison of the model inside the assignment procedure for comparing running time and extension in a real-size system and testing the results in terms of flow and performance in relation to real-observed data and the context (urban vs. extra-urban areas with different levels of urbanization and number of available paths for users). In each context, the model that provides the best results will be the one that meets these criteria.
In terms of running time, the evaluation of path choices is repeated many times within an assignment procedure. Applying a simple closed-form specification is preferable, possibly integrated with implicit assignment algorithms. There are implicit assignment algorithms for logit, C-logit, and probit models in RUMs. In terms of running time, a logit model has a mathematical closed form; it is the fastest, but it does not simulate overlapping. The C-logit model has a mathematical closed form, and it is intermediate in terms of running time. The probit model has no mathematical closed form, and it has the longest running time. The FUMs and QUMs can be solved with explicit path enumeration, and the running time depends on the choice set generation algorithm. A research direction could be to specify implicit algorithms for FUMs and QUMs to reduce running time.
The research evolution guarantees that the models reproducing user behavior more accurately will evolve next year. They will have specifications that are easy to calibrate and validate from real data.
Data availability statement
The original contributions presented in the study are included in the article; further inquiries can be directed to the corresponding author.
Author contributions
AV: Conceptualization, Formal Analysis, Investigation, Methodology, Supervision, Validation, Visualization, Writing–original draft, and Funding acquisition.
Funding
The author(s) declare that financial support was received for the research, authorship, and/or publication of this article. The study is partially carried out within the research project “National and local factors affecting times of ships in container ports” (CUP C53D23008780001), Piano Nazionale di Ripresa e Resilienza (PNRR)—Progetti di Rilevante Interesse Nazionale (PRIN).
Conflict of interest
The author declares that the research was conducted in the absence of any commercial or financial relationships that could be construed as a potential conflict of interest.
The author(s) declared that they were an editorial board member of Frontiers, at the time of submission. This had no impact on the peer review process and the final decision.
Generative AI statement
The author(s) declare that no Generative AI was used in the creation of this manuscript.
Publisher’s note
All claims expressed in this article are solely those of the authors and do not necessarily represent those of their affiliated organizations, or those of the publisher, the editors and the reviewers. Any product that may be evaluated in this article, or claim that may be made by its manufacturer, is not guaranteed or endorsed by the publisher.
Author disclaimer
The study reflects only the authors’ views and opinions; neither the European Union nor the European Commission can be considered responsible for them.
References
Ben-Akiva, M., and Bierlaire, M. (1999). “Discrete choice methods and their applications to short term travel decisions,” in Handbook of transportation science. International series in operations research and management science. Editor R. W. Hall (Boston, MA: Springer), 23, 5–33. doi:10.1007/978-1-4615-5203-1_2
Ben-Akiva, M. E., and Lerman, S. R. (1985). Discrete choice analysis: theory and application to travel demand. Cambridge, Mass: MIT Press.
Cantarella, G. E., and Vitetta, A. (2023). Bayesian disaggregate and aggregate calibration of path logit choice models. J. Adv. Transp. 2023, 1–13. doi:10.1155/2023/5596292
Cantarella, G. E., Watling, D. P., de Luca, S., and Di Pace, R. (2020). Dynamics and stochasticity in transportation systems: tools for transportation network modelling. Oxford, UK: Elsevier.
Cantillo, V., Arellana, J., and Rolong, M. (2015). Modelling pedestrian crossing behaviour in urban roads: a latent variable approach. Transp. Res. Part F Traffic Psychol. Behav. 32, 56–67. doi:10.1016/j.trf.2015.04.008
Cascetta, E. (2009). Transportation systems engineering: theory and methods. Berlin/Heidelberg, Germany: Springer.
Cascetta, E., Nuzzolo, A., Russo, F., and Vitetta, A. (1996). “A modified logit route choice model overcoming path overlapping problems. Specification and some calibration results for interurban networks. Transportation and Traffic Theory,” in Proceedings of the 13th international symposium on transportation and traffic theory. Lyon, France.
Comi, A., and Polimeni, P. (2022). Estimating path choice models through floating car data. Forecasting, 4–29. doi:10.3390/forecast4020029
dell’Olio, L., Rodríguez, A., and Sipone, S. (2023). Modeling airport choice using a latent class logit model. Aerospace 10, 703. doi:10.3390/aerospace10080703
Di Gangi, M., and Polimeni, A. (2022). Path choice models in stochastic assignment: implementation and comparative analysis. Front. Future Transp. 3, 885967. doi:10.3389/ffutr.2022.885967
Di Gangi, M., and Vitetta, A. (2021). Quantum utility and random utility model for path choice modelling: specification and aggregate calibration from traffic counts. J. Choice Model. 40, 100290. doi:10.1016/j.jocm.2021.100290
Domencich, T. A., and McFadden, D. (1975). Urban travel demand: a behavioural analysis. New York: American Elsevier.
Guzman, L. A., Arellana, J., and Camargo, J. P. (2021). A hybrid discrete choice model to understand the effect of public policy on fare evasion discouragement in Bogotá's Bus Rapid Transit. Transp. Res. Part A Policy Pract. 151 (C), 140–153. doi:10.1016/j.tra.2021.07.009
Henn, V. (2003). “Path choice making under uncertainty: a fuzzy logic based approach,” in Fuzzy sets-based heuristics for optimization. Editor J. Verdegay (New York: Springer-Verlag), 277–292.
Henn, V., and Ottomanelli, M. (2006). Handling uncertainty in route choice models: from probabilistic to possibilistic approaches. Eur. J. Operational Res. 175, 1526–1538. doi:10.1016/j.ejor.2005.02.026
Iskander, M. G. (2002). Comparison of fuzzy numbers using possibility programming: comments and new concepts. Comput. and Math. Appl. 43 (Issues 6–7), 833–840. doi:10.1016/s0898-1221(01)00324-8
Kim, J., Rasouli, S., and Timmermans, H. (2014). Hybrid choice models: principles and recent progress incorporating social influence and nonlinear utility functions. Procedia Environ. Sci. 22, 20–34. doi:10.1016/j.proenv.2014.11.003
Klir, G. J. (1990). A principle of uncertainty and information invariance. Int. J. General Syst. 17 (2/3), 249–275. doi:10.1080/03081079008935110
Lovreglio, R., Fonzone, A., and dell’Olio, L. (2016). A mixed logit model for predicting exit choice during building evacuations. Transp. Res. Part A Policy Pract. 92 (C), 59–75. doi:10.1016/j.tra.2016.06.018
Mansky, C. F. (1977). The structure of random utility models. Theory Decis. 8, 229–254. doi:10.1007/bf00133443
Ortúzar, J. de D., and Willumsen, L. G. (1994). Modelling transport. England: John Wiley and Sons Ltd. Publishing.
Quattrone, A., and Vitetta, A. (2011). Random and fuzzy utility models for road route choice. Transp. Res. Part E 47, 1126–1139. doi:10.1016/j.tre.2011.04.007
Russo, F., Comi, A., and Chilà, G. (2024). Dynamic approach to update utility and choice by emerging technologies to reduce risk in urban road transportation systems. Future Transp. (4), p.p. 1078–1099. doi:10.3390/futuretransp4030052
Sheffi, Y., and Powell, W. B. (1982). An algorithm for the equilibrium assignment problem with random link times. Networks 12, 191–207. doi:10.1002/net.3230120209
Tinessa, F., Marzano, V., Simonelli, F., Tocchi, D., and Papola, A. (2023). Choice probabilities and correlations in closed-form route choice models: specifications and drawbacks. Transp. Eng. 13, 100186. doi:10.1016/j.treng.2023.100186
Vallejo-Borda, J. A., Bhaduri, E., Ortiz-Ramirez, H. A., Arellana, J., Choudhury, C. F., Rodriguez-Valencia, A., et al. (2023). Modeling the COVID-19 travel choices in Colombia and India: a hybrid multiple discrete-continuous nested extreme value approach. Transp. Res. Rec. 2677 (4), 778–801. doi:10.1177/03611981231162588
Vitetta, A. (2016). A quantum utility model for route choice in transport systems. Travel Behav. Soc. 3, 29–37. doi:10.1016/j.tbs.2015.07.003
Vovsha, P., and Bekhor, S. (1998). Link-nested logit model of route choice: overcoming route overlapping problem. Transp. Res. Rec. 1645 (1998), 133–142. doi:10.3141/1645-17
Keywords: path choice, traffic assignment, travel demand, choice models, transport systems
Citation: Vitetta A (2025) Path choice in transport systems: comparing random, quantum, and fuzzy utility models in a small network. Front. Future Transp. 6:1544947. doi: 10.3389/ffutr.2025.1544947
Received: 13 December 2024; Accepted: 20 January 2025;
Published: 27 February 2025.
Edited by:
Luigi Dell’Olio, University of Cantabria, SpainReviewed by:
Qiang Bai, Chang’an University, ChinaJuan Benavente Ponce, University of Cantabria, Spain
Andres Rodriguez Gutierrez, University of Cantabria, Spain
Copyright © 2025 Vitetta. This is an open-access article distributed under the terms of the Creative Commons Attribution License (CC BY). The use, distribution or reproduction in other forums is permitted, provided the original author(s) and the copyright owner(s) are credited and that the original publication in this journal is cited, in accordance with accepted academic practice. No use, distribution or reproduction is permitted which does not comply with these terms.
*Correspondence: Antonino Vitetta, dml0ZXR0YUB1bmlyYy5pdA==