 Chongzhi Zhong1Jiaxing Sun1Zishu Liu1Haomiao Niu2Jing Zhang3Xiaoyu Liang2
 Jiawei Yin2Lin Wu2Jianfei Peng2Qijun Zhang2Hongjun Mao2*
- 1CATARC Automotive Test Center (Tianjin) Co., Ltd, China Automotive Technology and Research Center Co., Ltd, Tianjin, China
- 2Tianjin Key Laboratory of Urban Transport Emission Research, College of Environmental Science and Engineering, Nankai University, Tianjin, China
- 3Tianjin Eco-Environmental Monitoring Center, Tianjin, China
A brake dynamometer has been modified to accurately study the concentration and size distribution of wear particles in different testing conditions. The test equipment was a charged low-pressure impactor ELPI+ from Dekati, Finland. 29 test conditions were defined based on speed, acceleration and initial brake temperature. Additionally, five different types of brake pads were selected for testing to provide a more comprehensive understanding of the particle size distribution characteristics of brake wear particles. The results showed that the mass of BWPs was unimodal in the range of 0.01–8.11 μm, with peak sizes at 2–5 μm or >8.11 μm, and particles of 0.5–3.0 μm accounted for an average of 49.09% of the total particulate mass, while particles with sizes of 3.0–8.11 μm accounted for an average of 49.72% of the total particulate mass. The number of particles emitted by abrasion had a bimodal distribution, with one in the nucleation mode and the other in the accumulation mode, with peak sizes of <10 nm and 1 μm, respectively; the nucleation mode particles accounted for an average of 60.11% of the total PN10, and the ultrafine particles accounted for an average of 82.15%.
1 Introduction
Atmospheric particulate matter (PM) causes many adverse effects (Fuzzi et al., 2015) on environmental quality (Pant and Harrison, 2013; Akhbarizadeh et al., 2021; Sridharan et al., 2021) and human health (West et al., 2016; Costa et al., 2017; Shaddick et al., 2020; Ambade et al., 2021). The sources of atmospheric particulate matter are complex, including fixed combustion sources, mobile sources, industrial process sources, etc .,(Mukherjee and Agrawal, 2017). Many studies have shown that mobile sources have been the main source of particulate matter in large and medium-sized cities (Pant and Harrison, 2013; Karagulian et al., 2015; Moreno-Ríos et al., 2022). In the case of conventional fuel-fired vehicles, the contribution of particulate matter to the environment comes not only from exhaust emissions, but also partly from non-exhaust emissions, including tire wear, brake wear, road wear and resuspension, and wear of other parts (e.g., clutches). However, with the development and implementation of more stringent emission standards for motor vehicles (Denier van der Gon et al., 2013), motor vehicle exhaust emissions will show a decreasing trend, while the proportion of non-exhaust emissions will gradually increase (Timmers and Achten, 2016; Beddows and Harrison, 2021; Jiang et al., 2022; Woo et al., 2022). In the context of the “double carbon” goal, the electrification of vehicle fleets has become inevitable. The use of cleaner energy has made electric vehicles (EVs) considered as “zero-emission” vehicles (Requia et al., 2018). However, compared to traditional fuel-powered vehicles, their larger mass may cause them to emit more non-exhaust particulate matter (Beddows and Harrison, 2021). With the combination of exhaust and non-exhaust particulate matter, non-exhaust emissions have already exceeded exhaust emissions in some large and medium-sized cities (Piscitello et al., 2021), and become the main source of motor vehicle particulate matter (Amato et al., 2014; Grigoratos and Martini, 2015; Singh et al., 2020; Matthaios et al., 2022). Non-exhaust particulate matter can now account for 86% of the traffic-related particulate matter in megacities Delhi (Singh et al., 2020).
Every braking of a vehicle generates braking wear particles, brake wear particulate matter is an important component of non-exhaust particulate matter (Jeong et al., 2019; Zhang et al., 2020). Several studies conducted in urban environments have reported brake wear particles to contribute between 16% and 55% to traffic-related non-exhaust PM10 (Harrison et al., 2012; Lawrence et al., 2013), and between 11% and 21% to traffic-related PM10 (Lawrence et al., 2013; Grigoratos and Martini, 2015). The importance of brake wear particles (BWPs) lies not only in their contribution to atmospheric particulate matter, but also in its potential population health risks (Sadiktsis et al., 2012; Grigoratos and Martini, 2015). Brake wear particles (BWPs) have a high metal content (Sadiktsis et al., 2012; Avagyan et al., 2014; Hulskotte et al., 2014; Grigoratos and Martini, 2015; Fang et al., 2017), and contributes up to 55% to the oxidation potential of coarse atmospheric particulate matter in European cities (Daellenbach et al., 2020). And it is easy to understand that the high-emission areas of braking wear particles (such as traffic intersections and pedestrian crossings) highly overlap with areas of dense human activity (Thomas et al., 2024).found that over 80% of brake wear particles (BWPs) carry a high charge, which correlates with particle size. This high charge accelerates particle growth, alters transmission characteristics, and enhances particle attachment efficiency in the human lung. Exposure to motor vehicle brake wear particles (BWPs) has become a significant source of public health risk globally and is an important issue in the field of environment and health.
There are a number of difficulties associated with the study of brake wear emissions, with perhaps the greatest limitation being the lack of standardized sampling procedures and measurement techniques. Current methods for conducting brake wear particulate emission tests include the pin-on-disc tribometer tests (Verma et al., 2016; Wahlström et al., 2017; Lyu et al., 2020), brake dynamometers (Hagino et al., 2016; Kim et al., 2021), chassis dynamometers (Mathissen et al., 2019; Beji et al., 2020) and on-road methods (Zum Hagen et al., 2019; Oroumiyeh and Zhu, 2021). And different researchers have used different dimensions to quantify brake wear particulate mass emissions, including mg/stop brake, mg/km brake and number particles/cm3 (Nosko and Olofsson, 2017; Hesse et al., 2021), which often leads to non-comparable results and conclusions in different experimental methods (Fussell et al., 2022). A number of researchers have also conducted studies on the size distribution of brake wear particulate matter based on the above methods, and most of the studies have found that the mass of brake wear emission PM10 has a single-peak distribution, with peak concentrations occurring between 1.0 and 6.0 μm (Sanders et al., 2003; Iijima et al., 2008; Harrison et al., 2012). Most studies examined BWPs found at least one number of peak particle sizes in the ultrafine particulate fraction (Garg et al., 2000; Wahlstrom et al., 2010). Several studies have shown that the characterization of brake wear emissions of particulate matter is related to the raw material of the brake pad friction linings (Österle et al., 2001; Kukutschova et al., 2011). In addition, the chemical composition and emission rate of brake wear particulate matter are highly dependent on driving behavior (Kwak et al., 2013; Wei et al., 2022). In summary, prior research have tended to examine particle size distribution within a limited scope of brake materials or specific braking conditions. However, considering the intricate mechanisms underlying brake wear particle generation, such approaches may not fully reveal the complete patterns. A study investigating the particle size distribution of brake wear particles across various types of brake pads and braking conditions is essential for subsequent research on their chemical and health impacts. This study delves into the emissions of five different brake pads under 29 distinct braking conditions. A braking wear particle testing system was designed based on a braking dynamometer, and the collection of braking wear particles were completed under the 29 braking events. The particle size distribution of the particles under different braking events was also analyzed.
2 Materials and methods
2.1 Test system
Figure 1 illustrates a schematic of the brake wear particulate matter test setup. The brake pad wear test is conducted using the TS102B Brake Inertia Test Stand to simulate multiple braking modes of a vehicle. The Brake Bench can accurately control the brake speed and torque, and accurately monitor the brake disk temperature so that each test condition can be accurately controlled. In order to reduce the influence of particles in the ambient air on the experiment, a sealed Plexiglas chamber (500 mm × 600 mm × 1,000 mm, W × D × H) was added to the brake (including pads, discs, and calipers) with a high-efficiency particulate air (HEPA) filter at the air inlet, following the method of Iijima et al. (2008). The pump (with constant flow controller) is connected to the sealed chamber, and the air flow is filtered by HEPA into the sealed chamber, and the particles emitted from brake wear (Filtered air with dust) are carried into the pipeline (Tunnel), and at the same time, the monitoring and sampling instruments connected to the pipeline are used to test and collect the particles in the air flow. The monitoring instrument uses the Electrical low-pressure impactor (ELPI+) manufactured by Dekati, Finland, which is based on the principle of inertial impact separation and real-time measurement of airborne particulate matter particle size spectral distribution and mass concentration. The ELPI + impinger classifies 6 nm–10 μm particles into 14 stages, the first 13 stages measure 17 nm–10 μm particles, and the last stage is a filtering section to collect 6 nm–17 nm particles. According to the study of Hagino et al. (2015), when the air flow rate of sampling tunnel is between 0.5 and 5 m3/min, the flow rate does not have a significant effect on the emission rate of particulate matter emitted from brake wear, so in this study, the air flow rate of the sampling tunnel is set to 2.8 m3/min.
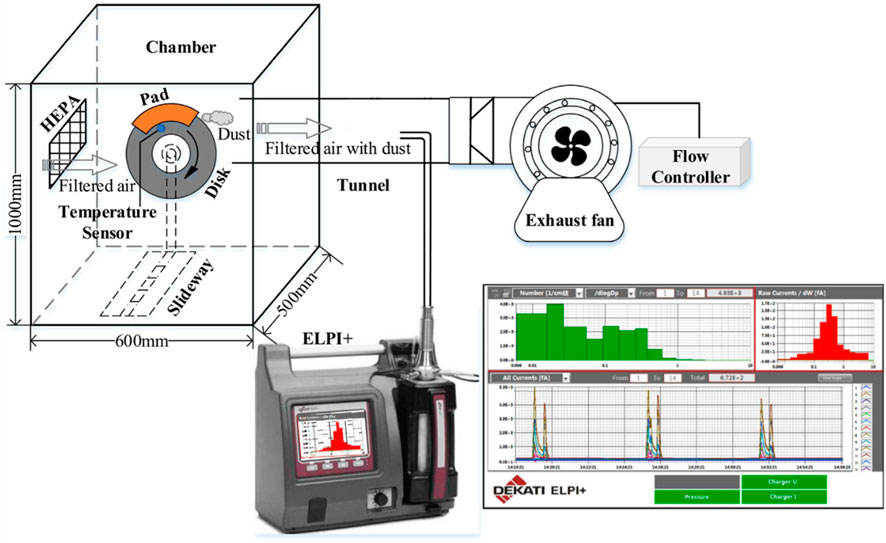
Figure 1. Brake wear test equipment.
2.2 Test brake pad information
Since different brands of automobiles are equipped with different types of brake pads, and different brake pads contain large differences in the components, and different types of brake pads yield slightly different particle size distribution characteristics, this study selected five small buses (including domestic brands and imported brands) with a large domestic ownership in the middle and low price range, and purchased five sets of original matching right front brake assemblies for testing and sampling. The brand affiliation, brake pad type, brake pad appearance and brake pad area of each sample are shown in Table 1.
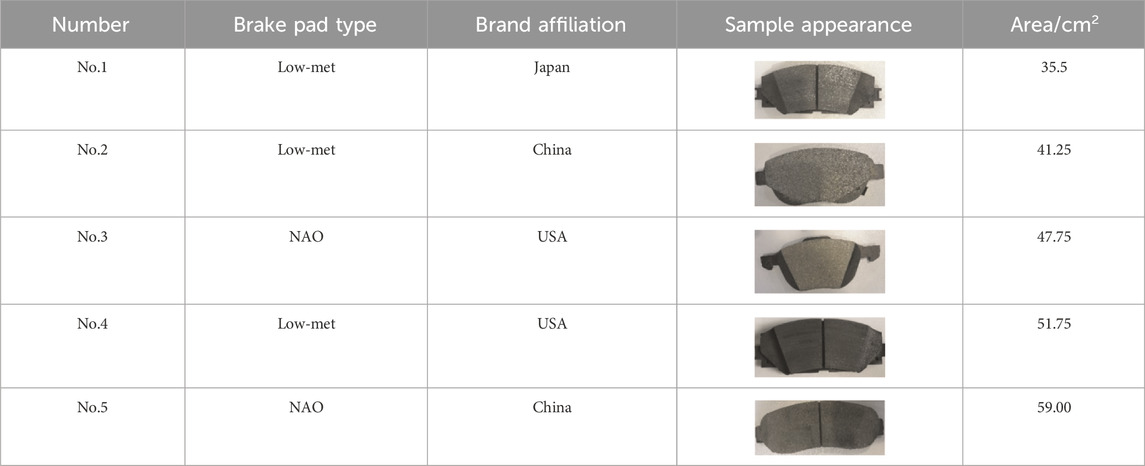
Table 1. Brake pad sample summary.
2.3 Test cycle
Brake wear test conditions are determined by combining the initial braking speed (V, km/h), deceleration speed (D, m/s2), and the initial braking temperature (T, °C) (the temperature of the brake disc at the beginning of braking). The common speed limits are 40 km/h and 60 km/h for urban roads, 80 km/h for expressways, and 120 km/h for highways. In order to have a comprehensive understanding of the particulate emissions from braking under various working conditions, five initial braking speeds (V = 40, 60, 80, 100, and 120 km/h), five deceleration speeds (D = 1, 2, 3, 5 and 7 m/s2), and five initial braking temperatures (T = 100, 150, 200, 250°C and 300°C) were selected for experiments. Each experiment involves starting from a certain speed and decelerating to zero, resulting in a total of 29 working conditions, and the test was repeated four times for each working condition. Detailed information of the 29 conditions is shown in Table 2. For each new braking system or set of brake pads, at least 200 braking break-in tests need to be conducted before performing the braking wear particulate emission testing experiment. This is to remove the relatively rough surface friction material and reduce its impact on the experimental results. The experimental conditions are set as follows: initial braking temperature of 25°C, initial speed of 40 km/h, final speed of 0, and deceleration of 1 m/s2. And the test conditions were only started when the brake disk temperature had risen to the target temperature. This means that the speed is adjusted to 40 km/h, braking is started (the brake fluid applies pressure to the piston and presses the brake pads against the brake disk, generating a friction torque) until the speed is reduced to 0, and the second test is carried out when the temperature of the brake disk again reaches 100°C. In order to reduce experimental errors, each condition was repeated four times, and the whole simulation test process was controlled by computer.
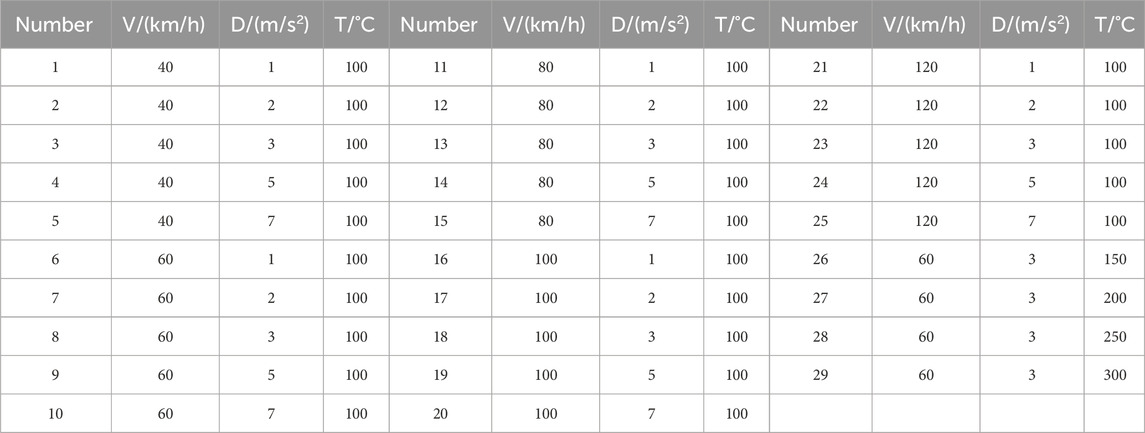
Table 2. Experimental conditions of brake wear.
3 Results and discussion
Figure 2 shows an example of the variation of particulate matter mass concentration and number concentration in the sealed compartment with operating conditions during brake wear. It can be seen in the figure that there are two sharp peaks of particulate matter mass concentration and quantity concentration in the sealed compartment at the end of each working condition, i.e., there are two brake wear particulate matter emission processes in the whole process. The first of these peaks is due to the collision and friction between the brake disc and the brake pad, and the second peak is due to the separation of the wear particles from the surface of the brake pad. This phenomenon is identical to the findings of previous studies (Iijima et al., 2007; Iijima et al., 2008; Hagino et al., 2015; Hagino et al., 2016). The particulate matter concentration in the sealed compartment returned to the background concentration within a certain period of time after the end of a braking process, which indicates that the extractor fan can remove most of the particulate matter in the compartment to keep the air in the sealed compartment clean. The large differences in peak concentrations and peak retention times of PM2.5, PM2.5-10, PN2.5 (Number of particles with a diameter less than 2.5 μm), and PN2.5-10 produced by each wear condition indicate that there are differences in the amount of particulate matter emitted in each condition.
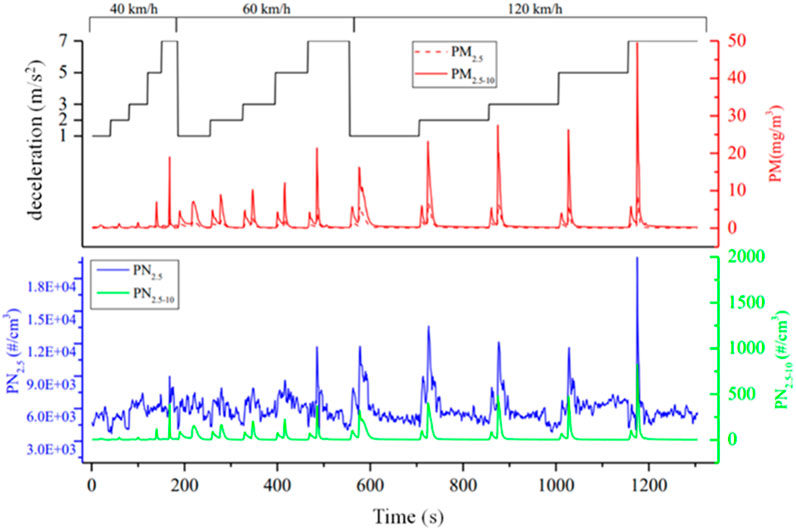
Figure 2. Example of the variation of particulate matter concentration in the sealed compartment with operating conditions during brake wear.
3.1 Mass particle size distribution
In order to prevent the resuspension of particles remaining on the brake discs and pads during each braking process from interfering with the ELPI + test data, we defined the amount of particulate matter emitted during the entire braking process, i.e., the amount of particulate matter emitted from a single braking (PE, mg/braking/wheel). The PE is the cumulative amount of the entire emission process, i.e., the cumulative amount during the time period between the beginning of the rise of the particle concentration in the compartment (t0) and the return of particle concentration to the background concentration level (t1), which was calculated by the following formula:
V' is the duct wind speed (6 m/s), S is the cross-sectional area of the duct (0.01131 m2), and Ct is the corresponding concentration at each moment (μg/m3).
To improve the visualization effect, we performed a meticulous cluster analysis on the evolving patterns of particulate matter across 14 distinct particle size categories, utilizing component linkage and cosine similarity metrics. And we used a dendrogram (Figure 3) to show the clustering process, which was completed by IBM SPSS Statistics. The horizontal axis of the dendrogram represents the relative distance between clusters, while the vertical axis represents distinct test conditions. Notably, test conditions within the same cluster exhibit similar patterns in particulate matter mass size distribution trends. The 25 working conditions of Pad.1 were divided into three categories, namely,: ➀15–25-2-6-1–20–13–14-7-8–24–23-4–5; ➁9–10-3; ➂ 16–21-11–17-12–18-22–19.25 working conditions of Pad.2 were divided into two categories: ➀1 15–17-18–19-11–14-12–13-2-1–16–20–22–23–24-3-4-5–21; ➁6-7-9–10–8.29 working conditions in Pad.3 were divided into two categories: ➀12-3–26-7-8-6-4–27-5-9–10–12–14–15–11–13; ➁28–29-21–23-16–20-25–17-24–22-19–18. The 29 working conditions of Pad.4 are divided into three categories: ➀1-2-3-4-7–26-8-5–28–29-6–27–13–14–12; ➁9–10-11; ➂24–25-23–21-22–20-16–17-18–19-15.29 working conditions of Pad.5 are divided into three categories: ➀1-3-2-4-5-6-9–10-7-8–26–13–14–12–15–11; ➁16–17-18–19-20–24-25–21-22–23; ➂28–29-27.
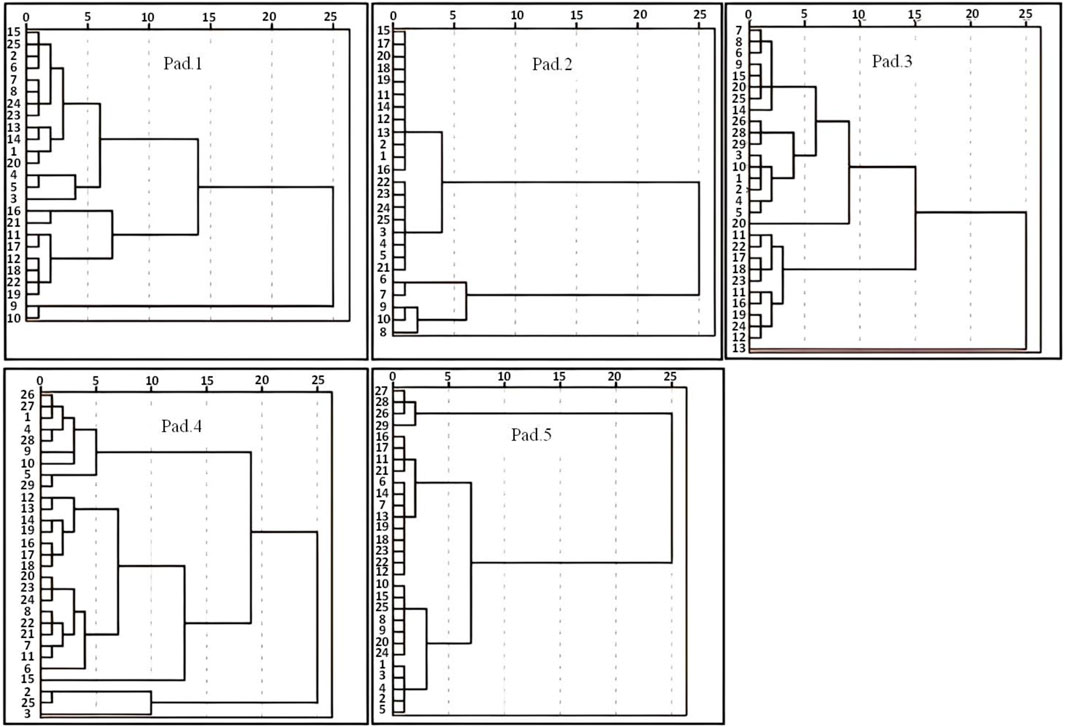
Figure 3. Cluster analysis results of particle size distribution of brake wear emissions.
The particle size distribution of each sample mass is shown in Figure 4. From the figure, it can be seen that although the systematic clustering classifies the particle size distribution of abraded particles into two to three categories, when the particle size is less than 0.50 μm, the distribution trend is very similar among the samples, and all of them are remain basically unchanged with the increase of the particle size. When the particle size is larger than 0.50 μm, there are some differences in the emission trends. For all samples and conditions, the emissions start to increase significantly at a particle size of about 0.75 μm. In the range of 0.01–8.11 μm, for Pad.1, there were two peaks in the distribution of category ➀ and ➁, which occurred between 2 and 3 μm and >8.11 μm, respectively, while there was only one peak in the distribution of category ➂, which occurred between 2 and 3 μm. Sample Pad.2 has a peak emission value in the particle size distribution of category ➀ at around 5 μm, and the peak concentration of category ➁ is at >8.11 μm. Sample Pad.3 has a peak emission value in the particle size distribution of categories ➀ and ➁ at around 3 μm, but the emission of category ➁ does not decrease significantly at particle sizes of 3–8.11 μm and maintains a high level of emission. Pad.4 samples have only one peak particle size for all conditions, but the peak size fluctuates, the peak size is around 5 μm in the distribution of category ➀ and ➁, and between three and 5 μm in the distribution of category ➂. in the distribution of particle size in category ➀, ➁, and ➂of sample Pad.5, there is only one peak particle size for all conditions, and the peak size is around 5 μm in the distribution of categories ➀ and ➁, and the peak size is > 8.11 μm in the distribution of category ➂. From the above analysis, it can be seen that the mass of particles emitted from all five samples is dominated by particles with larger particle sizes (Figure 5). Particles with particle size less than 0.5 μm accounted for 0.1%–0.7% of the total particulate mass, with an average of 0.38%; particles with particle size between 0.5 and 3.0 μm accounted for 33.11%–60.1% of the total particulate mass, with an average of 49.1%; particles with particle size 3.0–8.11 μm accounted for 39.5%–66.8% of the total particulate mass, with an average of 49.7%; particles with particle size 0.5–8.11 μm accumulated more than 99% of the total particles. This particle size distribution characteristic allows brake wear particles to persist in the atmosphere for longer periods of time and exacerbate their health risks. This is consistent with previous research conclusions, such as Sanders et al. (2003)tested the PM10 emissions of brake pad wear under typical urban driving conditions for low-metal, semi-metal, and NAO brake pads and found that the mass-weighted average diameter was 5–6 μm; Iijima et al. (2008) tested the mass-weighted average diameter of NAO brake pads to be 3–6 μm. Kukutschova et al. (2011)tested low-metallic brake pads and found that the mass exhibited a unimodal distribution with a peak concentration appearing at 2–4 μm; von Uexküll et al. (2005) tested the front and rear brake pads of trucks and found that the peak concentration appeared at 2–3 μm. Harrison et al. (2012) collected air particles of different sizes and used the particle size distribution of specific marker elements to estimate the contribution of brake wear to particle mass. They found that the PM10 mass of brake wear exhibited a unimodal distribution with a peak located at 2–3 μm.
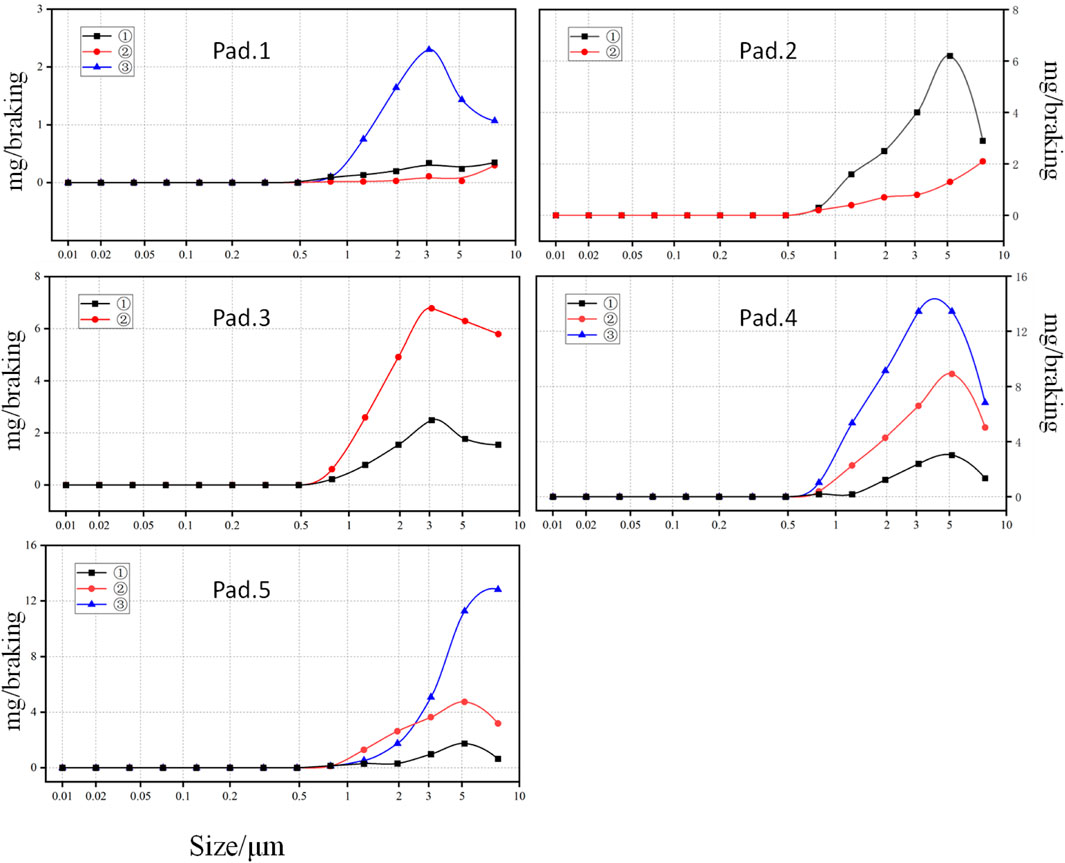
Figure 4. Mass distribution of particulate matter emitted by brake wear.
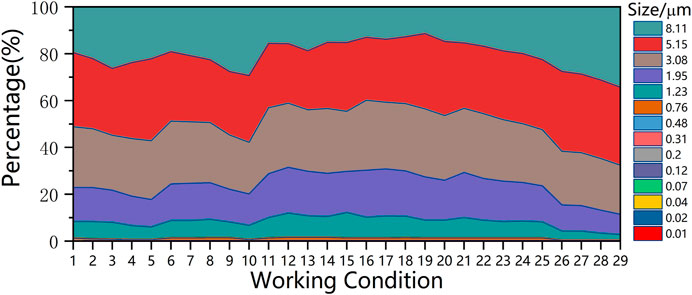
Figure 5. Mass share of particulate matter in each size band.
Garg et al. (2000) found that PM2.5 accounted for 63% and PM10 86% of total particulate matter emitted by wear by testing different brake pads, and 33% of the particulate matter had a particle size of less than 0.1 μm; Sanders et al. (2003) had similar results, with PM10 accounting for 63%–85% of the total particulate matter; Iijima et al. (2008) found 56%–70% PM2.5 and 95%–98% PM10. EMEP/CORINAIR emission inventory guidelines state that brake wear 39% PM2.5 and 98% PM10 (Thorpe and Harrison, 2008), which is more similar to the results of this study. On the other hand, brake wear was also found to be a higher percentage of PM10 than PM2.5 in the source resolution of particulate matter performed by receptor modeling (Abu-Allaban et al., 2003).
3.2 Number particle size distribution
The number size distribution of brake wear emission particles is also very important because a large portion of the particulate matter produced by brake wear is distributed in the smaller size range. Figure 6 shows the number size distribution of brake wear particles for some conditions, and the number size distribution trends are similar. Within the measurement range of the ELPI+, it can be seen from Figure 6 that for each sample and condition, the maximum number of particles was found at a particle size of 0.01 μm, the number of particles showed a decreasing trend in the range of 0.01–0.2 μm, and the number of particles showed an increasing trend in the range of 0.2–1.0 μm, with another peak at about 1 μm. In this study, the number of brake wear particles was bimodally distributed, one in the nucleation mode (Dp < 10 nm) and the other in the accumulation mode (1 μm).
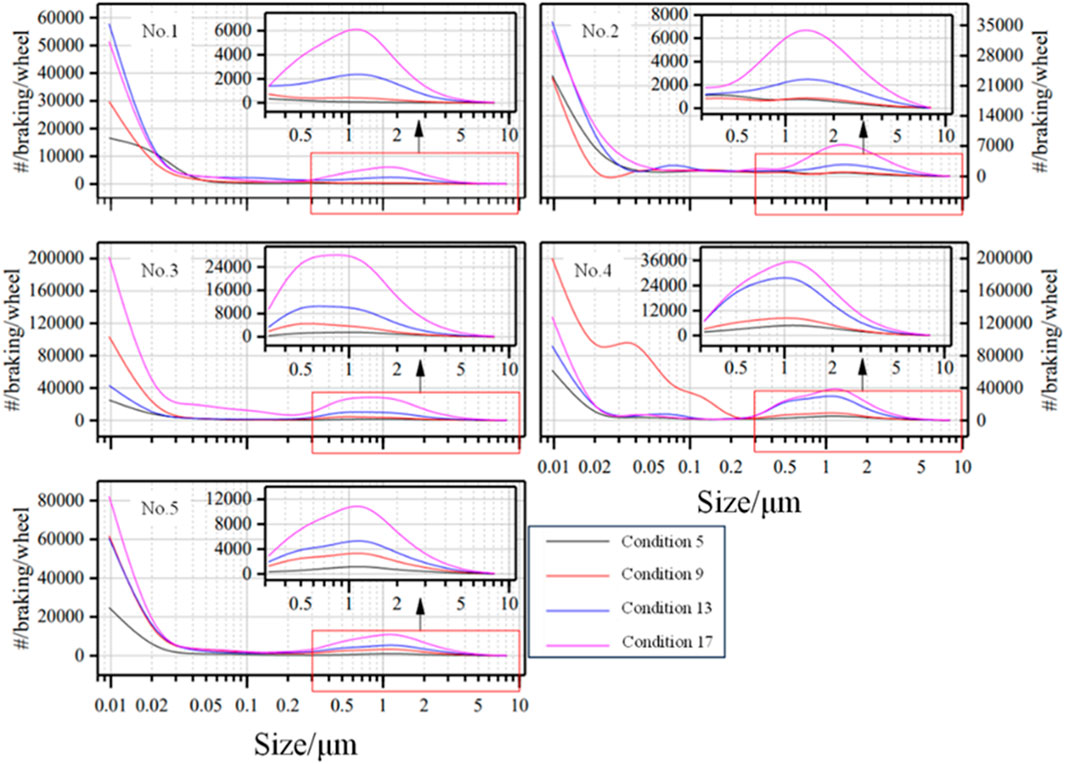
Figure 6. Distribution of the amount of particulate matter emitted by brake wear.
From the above analysis, it can be seen that the number of brake wear particles is mainly dominated by ultrafine particles (Dp < 0.1 μm) (Figure 7). Among them, the amount of nucleated modal particles (Dp < 0.05 μm) accounted for 46.52%–73.50% of the total number of PM10, accounting for 60.11% on average; the amount of particles with a particle size of 10 nm–0.1 μm accounted for 12.21%–39.79%, averaging 22.04%; the amount of particles with a particle size of 0.1–1.0 μm accounted for 1.23%–29.58%, averaging 14.04%; and the amount of particles with a particle size of 1.0–8.11 μm accounted for 14.04%, averaging 14.04%. The number of particles with particle size of 1.0–8.11 μm accounted for 0.45%–9.27% and 3.81% on average. The number of ultrafine particles (Dp < 0.1 μm) accounted for 61.1%–98.3% of the total PN10(Number of particles with a diameter less than 10 μm), and the average accounted for 82.15%.
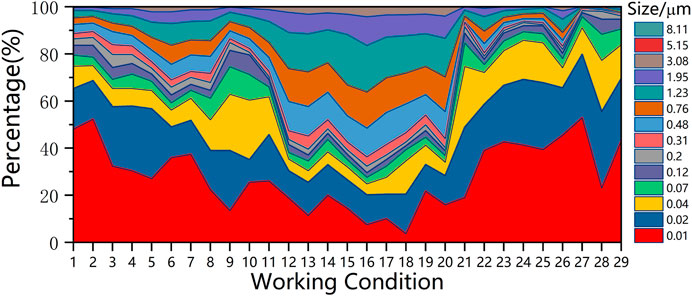
Figure 7. Quantity share of particulate matter in each size band.
Most of the studies found that BWPs have at least one peak size in the ultrafine fraction, and tests conducted by Garg et al. (2000) found that the largest number of brake wear particles was less than 30 nm. A road simulation study conducted by Mathissen et al. (2011) found that the number of brake wear particles produced by a vehicle decelerating from 100 km/h to 0 was bimodally distributed with peaks at 10 nm and 30–50 nm, respectively, and when decelerating from 30 km/h to 0, the number was unimodally distributed with peaks at 70–90 nm, compared to 100 km/h. Kukutschova et al. (2011) found that although <500 nm particles were negligible at low disk temperatures, as the disk temperature increased (up to 340°C), particles smaller than 100 nm were generated. They suggested that submicron particles may be produced by evaporation and condensation of initially produced nanoparticles rather than abrasive wear. Wahlstrom et al. (2010)also pointed out that there is a peak in the particle number distribution at approximately 100 nm, and they found that when testing the front brakes (compared to the rear brakes), the PN peak particle size distribution shifted towards smaller particle sizes. Riediker et al. (2004) tested six different passenger car brake lining materials under controlled environmental conditions and found concentration peaks at 80 nm (depending on the vehicle and braking behavior) and 200–400 nm. Compared to normal deceleration, braking from initial speed to a complete stop resulted in the generation of more nanoparticles. However, in some studies, the number of BWPs peaked at larger particle sizes. Wahlstrom et al. (2010) tested the brake emission processes of low-metal and non-asbestos organic linings and found a bimodal distribution with peaks of about 280–350 nm, which may be caused by the limitation of the instrumental measurement particle size range (>0.30 μm). Mosleh et al. (2004) tested a semi-metallic brake lining for commercial trucks and found a bimodal number concentration distribution with one peak at about 350 nm and another larger peak at about 2.0 μm. Sanders et al. (2003) conducted wear tests on three different types of brake lining materials using both a wear test bench and actual road tests, and found that the peak particle size was approximately 1.0 μm. Iijima et al. (2007) used an APS spectrometer (measuring particles >0.5 μm) to study the number concentration distribution of wear particles from non-asbestos organic brake linings and found a peak at 1.0 μm. They also observed that as the temperature increased, the peak distribution gradually shifted towards larger particle sizes. Overall, the number of particulate matter for brake wear fine particle modes into a bimodal distribution.
4 Conclusion
Overall, we obtained 29 different braking operating conditions based on speed, acceleration and braking initial temperature. In addition, we modified the brake dynamometer to generate and collect brake wear particulate matter (BWPs), and tested the particle size distribution of BWPs using the ELPI. The mass of BWPs had a single-peak distribution in the range of 0.01–8.11 μm, with peak sizes at 2–5 μm or >8.11 μm; particles of 0.5–3.0 μm accounted for an average of 49.09% of the total particulate mass; and those with sizes of 3.0–8.11 μm accounted for an average of 49.72% of the total particulate mass. The number of particles emitted by abrasion had a bimodal distribution, with one in the nucleation mode and the other in the accumulation mode, with peak sizes of <10 nm and 1 μm, respectively; the nucleation mode particles accounted for an average of 60.11% of the total PN10, and the ultrafine particles accounted for an average of 82.15% of the total PN10.
The emissions of particulate matter under various braking conditions were carefully monitored, aiding in the comprehensive characterization of brake wear particulate matter emissions. The thorough characterization of these emissions is pivotal in quantifying their potential health impacts in future studies. The meticulous monitoring of particulate matter emissions across diverse braking scenarios has yielded valuable insights into the emission characteristics of brake wear particulate matter. These data are pivotal in understanding the patterns and influencing factors of particulate emissions, providing a foundation for subsequent investigations into their potential health impacts. Building upon this foundation, investigating the distribution of brake wear particulate matter under standard operating conditions compared to real-world driving conditions is highly anticipated. Additionally, further research on the secondary transformation and health effects of brake wear particulate matter within these particle size ranges is urgently needed.
Data availability statement
The original contributions presented in the study are included in the article/Supplementary material, further inquiries can be directed to the corresponding author.
Author contributions
CZ: Investigation, Resources, Writing–original draft, Writing–review and editing. JS: Data curation, Investigation, Writing–review and editing. ZL: Formal Analysis, Project administration, Writing–review and editing. HN: Visualization, Writing–review and editing. JZ: Validation, Writing–review and editing. XL: Validation, Writing–review and editing. JY: Validation, Writing–review and editing. LW: Conceptualization, Writing–review and editing. JP: Conceptualization, Writing–review and editing. QZ: Conceptualization, Writing–review and editing. HM: Writing–review and editing.
Funding
The author(s) declare that financial support was received for the research, authorship, and/or publication of this article. This research was funded by CATARC Automotive Test Center (Tianjin) Co., Ltd., grant number TJKY2325004.
Conflict of interest
CZ, JS, ZL, were employed by CATARC Automotive Test Center (Tianjin) Co., Ltd, China Automotive Technology and Research Center Co., Ltd.
The remaining authors declare that the research was conducted in the absence of any commercial or financial relationships that could be construed as a potential conflict of interest.
The authors declare that this study received funding from CATARC Automotive Test Center (Tianjin) Co., Ltd. The funder had the following involvement in the study: Formal analysis; Investigation; Resources; Data curation; and the writing of this article.
Publisher’s note
All claims expressed in this article are solely those of the authors and do not necessarily represent those of their affiliated organizations, or those of the publisher, the editors and the reviewers. Any product that may be evaluated in this article, or claim that may be made by its manufacturer, is not guaranteed or endorsed by the publisher.
References
Abu-Allaban, M., Gillies, J. A., Gertler, A. W., Clayton, R., and Proffitt, D. (2003). Tailpipe, resuspended road dust, and brake-wear emission factors from on-road vehicles. Atmos. Environ. 37, 5283–5293. doi:10.1016/j.atmosenv.2003.05.005
Akhbarizadeh, R., Dobaradaran, S., Torkmahalleh, M. A., Saeedi, R., Aibaghi, R., and Ghasemi, F. F. (2021). Suspended fine particulate matter (PM2.5), microplastics (MPs), and polycyclic aromatic hydrocarbons (PAHs) in air: their possible relationships and health implications. Environ. Res. 192, 110339. doi:10.1016/j.envres.2020.110339
Amato, F., Cassee, F. R., Denier Van Der Gon, H. A. C., Gehrig, R., Gustafsson, M., Hafner, W., et al. (2014). Urban air quality: the challenge of traffic non-exhaust emissions. J. Hazard. Mater. 275, 31–36. doi:10.1016/j.jhazmat.2014.04.053
Ambade, B., Kumar, A., and Sahu, L. K. (2021). Characterization and health risk assessment of particulate bound polycyclic aromatic hydrocarbons (PAHs) in indoor and outdoor atmosphere of Central East India. Environ. Sci. Pollut. Res. 28, 56269–56280. doi:10.1007/s11356-021-14606-x
Avagyan, R., Sadiktsis, I., Bergvall, C., and Westerholm, R. (2014). Tire tread wear particles in ambient air-a previously unknown source of human exposure to the biocide 2-mercaptobenzothiazole. Environ. Sci. Pollut. Res. 21, 11580–11586. doi:10.1007/s11356-014-3131-1
Beddows, D. C. S., and Harrison, R. M. (2021). PM10 and PM2.5 emission factors for non-exhaust particles from road vehicles: dependence upon vehicle mass and implications for battery electric vehicles. Atmos. Environ. 244, 117886. doi:10.1016/j.atmosenv.2020.117886
Beji, A., Deboudt, K., Khardi, S., Muresan, B., Flament, P., Fourmentin, M., et al. (2020). Non-exhaust particle emissions under various driving conditions: implications for sustainable mobility. Transp. Res. Part D Transp. Environ. 81, 102290. doi:10.1016/j.trd.2020.102290
Costa, L. G., Cole, T. B., Coburn, J., Chang, Y.-C., Dao, K., and Roqué, P. J. (2017). Neurotoxicity of traffic-related air pollution. NeuroToxicology 59, 133–139. doi:10.1016/j.neuro.2015.11.008
Daellenbach, K. R., Uzu, G., Jiang, J., Cassagnes, L.-E., Leni, Z., Vlachou, A., et al. (2020). Sources of particulate-matter air pollution and its oxidative potential in Europe. Nature 587, 414–419. doi:10.1038/s41586-020-2902-8
Denier Van Der Gon, H. A. C., Gerlofs-Nijland, M. E., Gehrig, R., Gustafsson, M., Janssen, N., Harrison, R. M., et al. (2013). The policy relevance of wear emissions from road transport, now and in the future—an international workshop report and consensus statement. J. Air and Waste Manag. Assoc. 63, 136–149. doi:10.1080/10962247.2012.741055
Fang, T., Guo, H., Zeng, L., Verma, V., Nenes, A., and Weber, R. J. (2017). Highly acidic ambient particles, soluble metals, and oxidative potential: a link between sulfate and aerosol toxicity. Environ. Sci. Technol. 51, 2611–2620. doi:10.1021/acs.est.6b06151
Fussell, J. C., Franklin, M., Green, D. C., Gustafsson, M., Harrison, R. M., Hicks, W., et al. (2022). A review of road traffic-derived non-exhaust particles: emissions, physicochemical characteristics, health risks, and mitigation measures. Environ. Sci. Technol. 56, 6813–6835. doi:10.1021/acs.est.2c01072
Fuzzi, S., Baltensperger, U., Carslaw, K., Decesari, S., Denier Van Der Gon, H., Facchini, M. C., et al. (2015). Particulate matter, air quality and climate: lessons learned and future needs. Atmos. Chem. Phys. 15, 8217–8299. doi:10.5194/acp-15-8217-2015
Garg, B. D., Cadle, S. H., Mulawa, P. A., Groblicki, P. J., Laroo, C., and Parr, G. A. (2000). Brake wear particulate matter emissions. Environ. Sci. Technol. 34, 4463–4469. doi:10.1021/es001108h
Grigoratos, T., and Martini, G. (2015). Brake wear particle emissions: a review. Environ. Sci. Pollut. Res. 22, 2491–2504. doi:10.1007/s11356-014-3696-8
Hagino, H., Oyama, M., and Sasaki, S. (2015). Airborne brake wear particle emission due to braking and accelerating. WEAR 334, 44–48. doi:10.1016/j.wear.2015.04.012
Hagino, H., Oyama, M., and Sasaki, S. (2016). Laboratory testing of airborne brake wear particle emissions using a dynamometer system under urban city driving cycles. Atmos. Environ. 131, 269–278. doi:10.1016/j.atmosenv.2016.02.014
Harrison, R. M., Jones, A. M., Gietl, J., Yin, J., and Green, D. C. (2012). Estimation of the contributions of brake dust, tire wear, and resuspension to nonexhaust traffic particles derived from atmospheric measurements. Environ. Sci. Technol. 46, 6523–6529. doi:10.1021/es300894r
Hesse, D., Hamatschek, C., Augsburg, K., Weigelt, T., Prahst, A., and Gramstat, S. (2021). Testing of alternative disc brakes and friction materials regarding brake wear particle emissions and temperature behavior. Atmosphere 12, 436. [Online]. doi:10.3390/atmos12040436
Hulskotte, J. H. J., Roskam, G. D., and Van Der Gon, H. A. C. D. (2014). Elemental composition of current automotive braking materials and derived air emission factors. Atmos. Environ. 99, 436–445. doi:10.1016/j.atmosenv.2014.10.007
Iijima, A., Sato, K., Yano, K., Kato, M., Kozawa, K., and Furuta, N. (2008). Emission factor for antimony in brake abrasion dusts as one of the major atmospheric antimony sources. Environ. Sci. Technol. 42, 2937–2942. doi:10.1021/es702137g
Iijima, A., Sato, K., Yano, K., Tago, H., Kato, M., Kimura, H., et al. (2007). Particle size and composition distribution analysis of automotive brake abrasion dusts for the evaluation of antimony sources of airborne particulate matter. Atmos. Environ. 41, 4908–4919. doi:10.1016/j.atmosenv.2007.02.005
Jeong, C.-H., Wang, J. M., Hilker, N., Debosz, J., Sofowote, U., Su, Y., et al. (2019). Temporal and spatial variability of traffic-related PM2.5 sources: comparison of exhaust and non-exhaust emissions. Atmos. Environ. 198, 55–69. doi:10.1016/j.atmosenv.2018.10.038
Jiang, R., Liu, Y., Hu, D., and Zhu, L. (2022). Exhaust and non-exhaust airborne particles from diesel and electric buses in Xi'an: a comparative analysis. Chemosphere 306, 135523. doi:10.1016/j.chemosphere.2022.135523
Karagulian, F., Belis, C. A., Dora, C. F. C., PrüSS-UstüN, A. M., Bonjour, S., Adair-Rohani, H., et al. (2015). Contributions to cities' ambient particulate matter (PM): a systematic review of local source contributions at global level. Atmos. Environ. 120, 475–483. doi:10.1016/j.atmosenv.2015.08.087
Kim, S.-H., Jeong, M. H., Kim, J., Shim, W., Kwon, S.-U., Lee, J.-J., et al. (2021). Dynamometric investigation on airborne particulate matter (PM) from friction materials for automobile: impact of abrasive and lubricant on PM emission factor. Lubricants 9, 118. [Online]. doi:10.3390/lubricants9120118
Kukutschova, J., Moravec, P., Tomasek, V., Matejka, V., Smolik, J., Schwarz, J., et al. (2011). On airborne nano/micro-sized wear particles released from low-metallic automotive brakes. Environ. Pollut. 159, 998–1006. doi:10.1016/j.envpol.2010.11.036
Kwak, J.-H., Kim, H., Lee, J., and Lee, S. (2013). Characterization of non-exhaust coarse and fine particles from on-road driving and laboratory measurements. Sci. Total Environ. 458, 273–282. doi:10.1016/j.scitotenv.2013.04.040
Lawrence, S., Sokhi, R., Ravindra, K., Mao, H., Prain, H. D., and Bull, I. D. (2013). Source apportionment of traffic emissions of particulate matter using tunnel measurements. Atmos. Environ. 77, 548–557. doi:10.1016/j.atmosenv.2013.03.040
Lyu, Y., Leonardi, M., WahlströM, J., Gialanella, S., and Olofsson, U. (2020). Friction, wear and airborne particle emission from Cu-free brake materials. Tribol. Int. 141, 105959. doi:10.1016/j.triboint.2019.105959
Mathissen, M., Grigoratos, T., Lahde, T., and Vogt, R. (2019). Brake wear particle emissions of a passenger car measured on a chassis dynamometer. Atmosphere 10, 556. [Online]. doi:10.3390/atmos10090556
Mathissen, M., Scheer, V., Vogt, R., and Benter, T. (2011). Investigation on the potential generation of ultrafine particles from the tire–road interface. Atmos. Environ. 45, 6172–6179. doi:10.1016/j.atmosenv.2011.08.032
Matthaios, V. N., Lawrence, J., Martins, M. A. G., Ferguson, S. T., Wolfson, J. M., Harrison, R. M., et al. (2022). Quantifying factors affecting contributions of roadway exhaust and non-exhaust emissions to ambient PM10–2.5 and PM2.5–0.2 particles. Sci. Total Environ. 835, 155368. doi:10.1016/j.scitotenv.2022.155368
Moreno-RíOS, A. L., Tejeda-BeníTEZ, L. P., and Bustillo-Lecompte, C. F. (2022). Sources, characteristics, toxicity, and control of ultrafine particles: an overview. Geosci. Front. 13, 101147. doi:10.1016/j.gsf.2021.101147
Mosleh, M., Blau, P. J., and Dumitrescu, D. (2004). Characteristics and morphology of wear particles from laboratory testing of disk brake materials. Wear 256, 1128–1134. doi:10.1016/j.wear.2003.07.007
Mukherjee, A., and Agrawal, M. (2017). World air particulate matter: sources, distribution and health effects. Environ. Chem. Lett. 15, 283–309. doi:10.1007/s10311-017-0611-9
Nosko, O., and Olofsson, U. (2017). Quantification of ultrafine airborne particulate matter generated by the wear of car brake materials. Wear 374-375, 92–96. doi:10.1016/j.wear.2017.01.003
Oroumiyeh, F., and Zhu, Y. (2021). Brake and tire particles measured from on-road vehicles: effects of vehicle mass and braking intensity. Atmos. Environ. X 12, 100121. doi:10.1016/j.aeaoa.2021.100121
Österle, W., Griepentrog, M., Gross, T., and Urban, I. (2001). Chemical and microstructural changes induced by friction and wear of brakes. WEAR 251, 1469–1476. doi:10.1016/s0043-1648(01)00785-2
Pant, P., and Harrison, R. M. (2013). Estimation of the contribution of road traffic emissions to particulate matter concentrations from field measurements: a review. Atmos. Environ. 77, 78–97. doi:10.1016/j.atmosenv.2013.04.028
Piscitello, A., Bianco, C., Casasso, A., and Sethi, R. (2021). Non-exhaust traffic emissions: sources, characterization, and mitigation measures. Sci. Total Environ. 766, 144440. doi:10.1016/j.scitotenv.2020.144440
Requia, W. J., Mohamed, M., Higgins, C. D., Arain, A., and Ferguson, M. (2018). How clean are electric vehicles? Evidence-based review of the effects of electric mobility on air pollutants, greenhouse gas emissions and human health. Atmos. Environ. 185, 64–77. doi:10.1016/j.atmosenv.2018.04.040
Riediker, M., Devlin, R. B., Griggs, T. R., Herbst, M. C., Bromberg, P. A., Williams, R. W., et al. (2004). Cardiovascular effects in patrol officers are associated with fine particulate matter from brake wear and engine emissions. Part. Fibre Toxicol. 1, 2. doi:10.1186/1743-8977-1-2
Sadiktsis, I., Bergvall, C., Johansson, C., and Westerholm, R. (2012). Automobile tires-A potential source of highly carcinogenic dibenzopyrenes to the environment. Environ. Sci. Technol. 46, 3326–3334. doi:10.1021/es204257d
Sanders, P. G., Xu, N., Dalka, T. M., and Maricq, M. M. (2003). Airborne brake wear debris: size distributions, composition, and a comparison of dynamometer and vehicle tests. Environ. Sci. Technol. 37, 4060–4069. doi:10.1021/es034145s
Shaddick, G., Thomas, M. L., Mudu, P., Ruggeri, G., and Gumy, S. (2020). Half the world’s population are exposed to increasing air pollution. npj Clim. Atmos. Sci. 3, 23. doi:10.1038/s41612-020-0124-2
Singh, V., Biswal, A., Kesarkar, A. P., Mor, S., and Ravindra, K. (2020). High resolution vehicular PM10 emissions over megacity Delhi: relative contributions of exhaust and non-exhaust sources. Sci. Total Environ. 699, 134273. doi:10.1016/j.scitotenv.2019.134273
Sridharan, S., Kumar, M., Singh, L., Bolan, N. S., and Saha, M. (2021). Microplastics as an emerging source of particulate air pollution: a critical review. J. Hazard. Mater. 418, 126245. doi:10.1016/j.jhazmat.2021.126245
Thomas, A. E., Bauer, P. S., Dam, M., Perraud, V., Wingen, L. M., and Smith, J. N. (2024). Automotive braking is a source of highly charged aerosol particles. Proc. Natl. Acad. Sci. U. S. A. 121, e2313897121. doi:10.1073/pnas.2313897121
Thorpe, A., and Harrison, R. M. (2008). Sources and properties of non-exhaust particulate matter from road traffic: a review. Sci. Total Environ. 400, 270–282. doi:10.1016/j.scitotenv.2008.06.007
Timmers, V. R. J. H., and Achten, P. A. J. (2016). Non-exhaust PM emissions from electric vehicles. Atmos. Environ. 134, 10–17. doi:10.1016/j.atmosenv.2016.03.017
Verma, P. C., Alemani, M., Gialanella, S., Lutterotti, L., Olofsson, U., and Straffelini, G. (2016). Wear debris from brake system materials: a multi-analytical characterization approach. Tribol. Int. 94, 249–259. doi:10.1016/j.triboint.2015.08.011
Von UexküLL, O., Skerfving, S., Doyle, R., and Braungart, M. (2005). Antimony in brake pads -: a carcinogenic component? J. Clean. Prod. 13, 19–31. doi:10.1016/j.jclepro.2003.10.008
WahlströM, J., Lyu, Y., Matjeka, V., and SöDERBERG, A. (2017). A pin-on-disc tribometer study of disc brake contact pairs with respect to wear and airborne particle emissions. Wear 384-385, 124–130. doi:10.1016/j.wear.2017.05.011
Wahlstrom, J., Soderberg, A., Olander, L., Jansson, A., and Olofsson, U. (2010). A pin-on-disc simulation of airborne wear particles from disc brakes. WEAR 268, 763–769. doi:10.1016/j.wear.2009.11.014
Wei, N., Jia, Z., Men, Z., Ren, C., Zhang, Y., Peng, J., et al. (2022). Machine learning predicts emissions of brake wear PM2.5: model construction and interpretation. Environ. Sci. Technol. Lett. 9, 352–358. doi:10.1021/acs.estlett.2c00117
West, J. J., Cohen, A., Dentener, F., Brunekreef, B., Zhu, T., Armstrong, B., et al. (2016). What we breathe impacts our health: improving understanding of the link between air pollution and health. Environ. Sci. Technol. 50, 4895–4904. doi:10.1021/acs.est.5b03827
Woo, S.-H., Jang, H., Lee, S.-B., and Lee, S. (2022). Comparison of total PM emissions emitted from electric and internal combustion engine vehicles: an experimental analysis. Sci. Total Environ. 842, 156961. doi:10.1016/j.scitotenv.2022.156961
Zhang, J., Peng, J., Song, C., Ma, C., Men, Z., Wu, J., et al. (2020). Vehicular non-exhaust particulate emissions in Chinese megacities: source profiles, real-world emission factors, and inventories. Environ. Pollut. 266, 115268. doi:10.1016/j.envpol.2020.115268
Keywords: non-exhaust emission, brake wear emissions, size distribution, particle mass concentration, particle number distributions
Citation: Zhong C, Sun J, Liu Z, Niu H, Zhang J, Liang X, Yin J, Wu L, Peng J, Zhang Q and Mao H (2024) Size distribution of brake wear particulate matter based on a brake dynamometer investigation. Front. Future Transp. 5:1407660. doi: 10.3389/ffutr.2024.1407660
Received: 27 March 2024; Accepted: 15 May 2024;
Published: 05 June 2024.
Edited by:
Jun Zhao, Sun Yat-sen University, ChinaReviewed by:
Balram Ambade, National Institute of Technology, IndiaWorradorn Phairuang, Kanazawa University, Japan
Copyright © 2024 Zhong, Sun, Liu, Niu, Zhang, Liang, Yin, Wu, Peng, Zhang and Mao. This is an open-access article distributed under the terms of the Creative Commons Attribution License (CC BY). The use, distribution or reproduction in other forums is permitted, provided the original author(s) and the copyright owner(s) are credited and that the original publication in this journal is cited, in accordance with accepted academic practice. No use, distribution or reproduction is permitted which does not comply with these terms.
*Correspondence: Hongjun Mao, aG9uZ2p1bm1AbmFua2FpLmVkdS5jbg==