 Fengwei Guo1*
 Anton Fuchs2Stefan Kirschbichler2Wolfgang Sinz1
 Ernst Tomasch1Hermann Steffan1Joerg Moser1
- 1Vehicle Safety Institute, Graz University of Technology, Graz, Austria
- 2Virtual Vehicle Research GmbH, Graz, Austria
Virtual scenario-based testing has become an acceptable method for evaluating safety effectiveness of advanced driver assistance systems (ADAS). Due to the complexity of the ADAS operating environment, the scenarios that an ADAS could face are almost infinite. Therefore, it is crucial to find critical scenarios to improve the efficiency of testing without compromising credibility. One popular method is to explore the parameterized scenario space using various intelligent search methods. Selecting parameters to parameterize the scenario space is particularly important to achieve good coverage and high efficiency. However, an extensive collection of (relevant) influence parameters is missing, which allows a thorough consideration when selecting parameters regarding specific scenarios. In addition, the general importance definition for individual influence parameters is not provided, regarding the potential influence of their variations on the safety effectiveness of ADAS, which can also be used as a reference while selecting parameters. Combining knowledge from different sources (the published literature, standardized test scenarios, accident analysis, autonomous vehicle disengagement, accident reports, and specific online surveys), this paper has summarized, in total, 94 influence parameters, given the general definitions of importance for 77 influence parameters based on cluster analysis algorithms. The list of influence parameters provides researchers and system developers a comprehensive basis for pre-selecting influence parameters for evaluating the safety effectiveness of ADAS by virtual scenario-based testing and helps check whether certain influence parameters can be a meaningful extension for the evaluation.
1 Introduction
Advanced driver assistance systems (ADAS) are designed besides other systems to make driving safer and more comfortable. To achieve effective and reliable functionality, most of the ADAS tend to become more complex systems that are sensitive to various parameters in real-world traffic. Thus, conventional validation based on only test drives is no longer realizable (Kalra and Paddock, 2016). Accordingly, scenario-based testing will be one feasible solution (Nalic, 2020) and offers advantages like raising the acceptance of customers for ADAS, reproducibility and extensible scenarios, and minimization of safety hazards during testing (TÜV SÜD, 2021). In addition, high-fidelity simulation-based testing becomes a necessary step due to two main disadvantages of real-world testing: the extremely lengthy testing process and potential dangers (Sun et al., 2021). These facts underline the need for virtual scenario-based testing in safety certification and safety effectiveness evaluation of ADAS.
To comprehensively evaluate the potential of ADAS for accident avoidance and collision mitigation, ADAS should be tested with the entire scenario space and ideally parameterized with all influence parameters. Influence parameters are defined as parameters that describe a scenario and whose variation within that scenario could potentially affect the safety effectiveness of ADAS. The parameters can be clearly categorized using a model presented in the German research project PEGASUS. The model was designed to describe scenarios systematically with six independent layers, namely, the road level, traffic infrastructure, temporal modification of the former two layers, objects, environments, and digital information (PEGASUS METHOD, 2019). Due to the complexity of the scenarios and the generally huge number of superimposed influence parameters, the number of scenarios to be considered is virtually infinite.
Given the huge number of potential influence parameters, a possible solution could be to consider a limited number of influence parameters based on a pre-selection to develop test scenarios within a limited scenario space. Zhou and Re (2017) used relative distance, relative speed, and the relative moving direction between eGO and target vehicles in the parameterization and generation of test scenarios for an adaptive cruise control system. Ben Abdessalem et al. (2016) applied a multi-objective search to derive the most critical scenarios for a pedestrian detection vision-based system. Five parameters considered in the multi-objective search were identified through discussions with the domain expert, namely, the speed of the vehicle and the pedestrian, and the position and orientation of the pedestrian. In a research study by Chelbi et al. (2018), six influence parameters, namely, the relative distance, relative speed, temperature, humidity, weather event, and visibility, were included in the generation model of test scenarios for an autonomous emergency braking system. Similarly, values of eight demonstrative influence parameters, which are related to the kinematic status of eGO and target vehicles, were varied by Kluck et al. (2019) to create test scenarios for virtual ADAS verification and validation. Except for Chelbi et al. (2018), other researchers have focused only on the parameters related to the “objects” layer in the PEGASUS model.
Due to the strongly reduced number of influence parameters considered so far, which parameters should be additionally considered in the next step is the question. Extensive observation of every possible influence parameter is necessary. Several researchers have attempted to specify influence parameters across different categories. Different categories of influence parameters were defined and included in a scenario generation model called MaTeLo, which generates a test case for ADAS based on the Markov chain Monte Carlo method. The defined categories include weather conditions, structure of the road and the environments, behavior of the equipped vehicle, behavior of surrounding vehicles, pedestrians, and obstacles and disturbance. For each category, several examples of parameters were given (Raffaëlli et al., 2016). Gyllenhammar et al. likewise gave several examples for different categories, such as dynamic elements, connectivity, and other factors and scenarios (Gyllenhammar et al., 2020). Categorizing influence parameters in alignment with a clear scenario description structure, such as the PEGASUS model, and providing a comprehensive collection of parameters that fit into the defined categories can be an extensive observation. The parameters were all treated equally in the aforementioned research study, regardless of their potential to affect the safety effectiveness of ADAS. When determining parameters used to parameterize the scenario space, the general importance definition of each influence parameter can be a useful reference to combine with the consideration of the particular use case (specific types of ADAS and scenarios).
Based on the best knowledge of the authors, there is no list including overall potential influence parameters for ADAS safety effectiveness evaluation with corresponding general importance definitions available in the literature. Thus, an extensive collection of work of influence parameters and furthermore an importance definition for the parameters are necessary.
The purpose of this study is to provide information on a key aspect of virtual scenario-based testing, namely, scenario generation, by presenting a comprehensive list of influence parameters with general importance definitions that can be used by researchers and system developers. This list can be used in combination with a consideration of specific use cases to systematically select influence parameters for generating scenarios to evaluate the safety effectiveness of ADAS in scenario-based testing.
2 Materials and methods
2.1 Steps followed to carry out the research
1) Multiple sources were used to identify influence parameters and gather qualitative assessment information that measures the impact of these parameters on ADAS safety effectiveness.
2) Cluster analysis was applied based on features quantified from the qualitative assessment information collected to classify the identified influence parameters into different levels of importance.
2.2 Collection of influence parameters and corresponding qualitative assessment information
For an extensive collection of influence parameters, the following different sources were studied:
• Published literature
• Standardized tests
• Accident analysis
• Autonomous vehicle disengagement and accident reports
• Online surveys (expert knowledge)
The collection was carried out in two phases. First, a literature review including the published literature, standardized tests, accident analysis, autonomous vehicle disengagement, and accident reports was carried out to identify influence parameters and to obtain corresponding qualitative assessment information. After aggregation, the identified influence parameters were summarized in a list and the qualitative assessments collected from various sources were documented appropriately. Second, the experts from relevant study fields were invited to participate in an online survey to evaluate the importance of the previously collected influence parameters regarding their impact on safety effectiveness of ADAS and to complete the list of influence parameters.
2.2.1 First phase: Literature review
The sources used in the collection of influence parameters and the corresponding methods or criteria used to identify influence parameters and extract qualitative assessment information are described in this subsection.
2.2.1.1 Published literature
A three-step literature search methodology was employed to identify relevant studies. The steps were as follows:
• Step 1: The search strings are defined as follows, where $AD, $IP, $SG, $VV, and $ODD represent the synonyms of the terms AD and ADAS, influence parameters, scenario generation, verification and validation, and operational design domain. The synonyms are listed in Table 1.
• Step 2: A literature search m was carried out on four electronic databases, namely, Scopus, SAE Mobilus, IEEE Xplore Digital Library, and Google Scholar, in order to include as many relevant studies as possible in the research.
• Step 3: The literature collected in Step 2 was screened to filter out studies that contain relevant information on the influence parameters. The snowballing method was applied to the filtered studies in order to identify any additional relevant studies in conjunction with a filtering process.
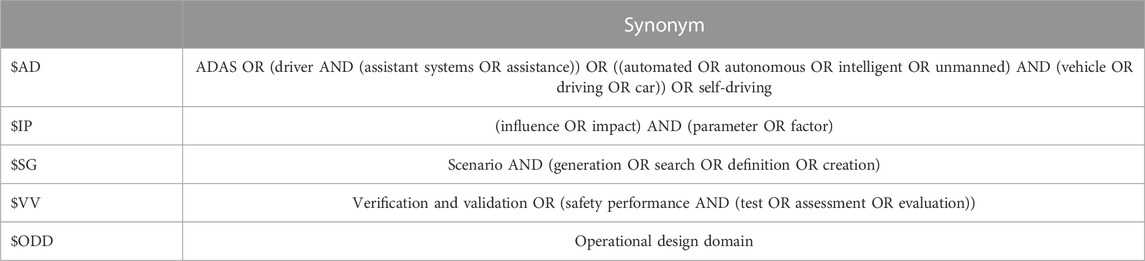
TABLE 1. Coverage of the knowledge of the 25 surveyed experts in different study fields.
Thirty-one documents (Buehler and Wegener, 2005; Schmidt and Sax, 2009; Staender, 2010; Weitzel and Winner, 2013; Chen et al., 2014; Weitzel, 2014; Kurt et al., 2015; Seiniger and Gail, 2015; Wittmann et al., 2015; Zhang et al., 2015; Ben Abdessalem et al., 2016; Hasirlioglu et al., 2016; Raffaëlli et al., 2016; Doric, 2017; Hasirlioglu et al., 2017; Wittmann et al., 2017; Xia et al., 2017; Zhao et al., 2017; Zhou and Re, 2017; Chelbi et al., 2018,; Chelbi et al., 2019; Chen, 2018; Junietz et al., 2018; Kolk et al., 2018; Sander and Lubbe, 2018; Xia et al., 2018; Antona-Makoshi et al., 2019; Goodin et al., 2019; Kluck et al., 2019; Duan et al., 2020; Koné et al., 2020) were identified. From these studies, the influence parameters that meet one of the following criteria were identified and a preliminary grade (qualitative assessment) was assigned accordingly. The grades and corresponding criteria are as follows:
• “Important”: The authors of the studies have identified the parameters as important or critical for the safety effectiveness of ADAS in their research or have used the parameters as a variant in ADAS testing.
• “Limitedly important”: The authors considered the parameters important under certain conditions. For example, “Obvious conditions like friction coefficient are only relevant in few scenarios with strong accelerations.” (Wittmann et al., 2015).
• “Mentioned”: The authors have mentioned the parameters as potential influence parameters for ADAS.
2.2.1.2 Standardized tests
To identify influence parameters from standardized tests, the present test and rating protocols for ADAS from five standardized tests were reviewed. These five standardized tests are Euro NCAP (new car assessment program), U.S. NCAP, IIHS (Insurance Institute for Highway Safety), China NCAP, and JNCAP and cover four main automobile markets. The varied parameters between designed test conditions in a test scenario were identified as influence parameters and graded as important. For example, according to Assessment Protocol–Vulnerable Road User Protection by Euro NCAP (2019), day or night, the light condition, speed of the eGO vehicle, size of the pedestrian, obstructed view, etc., are varied during the test. These factors were identified as influence parameters and rated as important.
2.2.1.3 Accident analysis
The IGLAD codebook (IGLAD, 2018) is a data scheme designed for a harmonized description of the accidents and is used to document in-depth information on accident cases provided by partners from nine countries in the database. In this codebook, 81 contributing factors, which have the main (most critical) influence on the triggering of the accident, were documented as the “main contributing factor” (IGLAD, 2018). Factors that are associated with the influence parameters previously collected from the literature and standardized tests are identified; for example, speeding is associated with the longitudinal speed of the eGO vehicle. The remaining factors were checked by the author if they are assumed to have a potential influence on the safety effectiveness of ADAS. These factors are eliminated as they are only relevant for human drivers, such as “alcohol” and “overtaking on the wrong side (undertaking)”.
2.2.1.4 Autonomous vehicle disengagement and accident reports
California’s Autonomous Vehicle Tester Program has allowed manufacturers to test their autonomous driving systems on public roads since 2014. Manufacturers testing vehicles in this program are required to report disengagement of the autonomous mode during testing (either because of technology failure or situations requiring the test driver/operator to take manual control of the vehicle to operate safely) and any collision that resulted in property damage and bodily injury within 10 days of the incident (California Department of Motor Vehicles, 2022). In addition, the causes of these disengagements and accidents are indicated. Favarò et al. (2017), Favarò et al. (2018), and Boggs et al. (2020) have studied these reports in detail and summarized the causes of the disengagement and the collision. Autonomous driving features, which correspond to SAE driving automation levels 3–5 (SAE On-Road Automated Vehicle Standards Committee, 2014), can be seen as an extension of ADAS features, which correspond to SAE driving automation levels 0–2. Therefore, these causes of disengagement and collision are also highly relevant to ADAS. From these research studies, the causes of disengagement and collision related to the external environment (including other road users, traffic infrastructure, and weather) were identified as influence parameters. The corresponding qualitative assessments include the cause of disengagement and cause of accidents, respectively. The other causes related to human factors (driver) and system failure were excluded.
2.2.2 Second phase: Identifying the importance of the influence parameters
In an online survey (created with Google Form (Google, 2021)), 25 experts evaluated the importance of the influence parameters collected from four sources in the first phase and their potential influence on safety effectiveness of ADAS. Invitations will be extended to experts through the networks of EVU (European Association for Accident Research and Analysis), P.E.A.R.S consortium (Wimmer et al., 2019), Virtual Vehicle Research Center, TU Graz, and TU Darmstadt. The invited experts will be required to have a minimum of 3 years of experience in the corresponding research discipline, as outlined in Table 2. The qualitative assessments include “Important,” “Might be important,” “Not important,” and “Not applicable (in the case of missing knowledge of this parameter).” Additionally, the list of influence parameters was expanded by experts based on their experience. Table 2 shows the percentage of 25 participating experts who have research experience in the given study fields. The information was provided by the survey participants in a multiple-choice question. The choice includes the first five study fields listed in Table 2. The last three fields with only 4% coverage (corresponding to one expert) were added by experts. Almost half of the experts have experience in the study fields “Simulation” and “Research & Development” of ADAS or automated driving, which are relevant to the research topic of this paper.
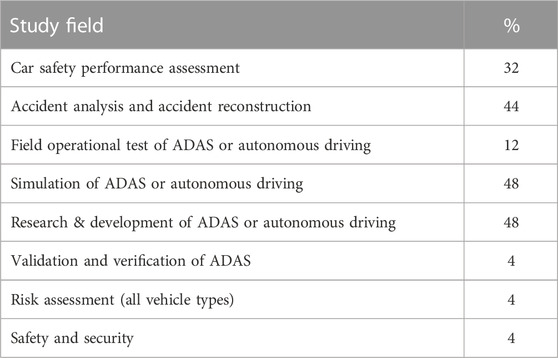
TABLE 2. Coverage of the knowledge of the 25 surveyed experts in different study fields.
2.3 Classification of influence parameters using cluster analysis
To generally classify the collected influence parameters into different importance levels by holistically considering the qualitative assessment information collected from different sources, a type of machine learning method called cluster analysis (Everitt, 2011) was applied. The influence parameters added by the experts in the online survey were excluded as they are not assessed by all experts. Cluster analysis is a group of methods used to distinguish a set of objects into several groups with similar characteristics (Everitt, 2011). It is an unsupervised learning method that needs neither predefinitions of the classes nor labeled training data for training the clustering model. Thus, cluster analysis is suitable to classify the collected influence parameters into different classes. The classification process includes two stages (as shown in Figure 1): feature extraction (quantization of collected qualitative assessment information) and application of the clustering algorithms (including selection of clustering algorithms, determination of weights and key parameters, comparison of clustering results, and selection of the optimal result for classification).
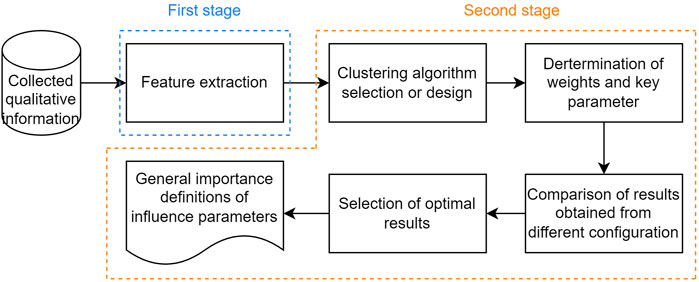
FIGURE 1. Flow diagrams of application of clustering analysis.
2.3.1 Feature extraction
The feature denotes a measurement of the importance of an influence parameter based on qualitative assessment information from a specific source and will be used as the predictors (Mathworks, 2021) in the cluster analysis. For each influence parameter, the qualitative assessment information collected from each source will be quantized as features corresponding to that source. To avoid distortion caused by different ranges of values, the extracted features are normalized (Lakshmanan, 2019). The extraction/quantization method used for each source is described as follows:
• Published literature: For a given influence parameter, an “important” or “limited important” assessment from the literature is assigned 3 points and “mentioned” 1 point. To rate the influence parameters as important or use them as varied parameters for test scenario generation, significantly higher justification efforts are required compared to mentioning them as potentially important. Therefore, to place more additional value on the “important” or “limited important” assessments, 3 points were given. The points are added and divided by the highest score of all parameters to be normalized to [0.000, 1.000].
• Standardized tests: The frequency that the influence parameter occurs in the five standardized tests will be extracted as the feature, which ranges in [0.000, 1.000]. For example, if the size of target objects will be varied in two tests (Euro NCAP and IIHS) out of the five tests, then the value is 0.400.
• Accident analysis: The feature is valued as either 1 or 0, which is a dummy variable (Eckstein et al., 1994), depending on if the influence parameter is documented in the IGLAD codebook as a main contributing factor.
• Autonomous vehicle disengagement and accident reports: Two features were extracted representing the cause of disengagement and the cause of accidents. Both features are valued using dummy variables (1 or 0), depending on if the influence parameter is the cause of the disengagement/accident.
• Online surveys: “Important” evaluation is counted as 3 points, “might be important” as 1 point, “Not applicable” as 0 points, and “not important” as −3 points. To give more weight to a clear evaluation (“important” and “not important”), which requires more reasoning efforts, than to an ambiguous evaluation (“might be important”), 3 points and −3 points were counted for “important” and “not important,” respectively. The points are added and divided by the theoretical maximum total of points (75 points) to be scaled down to [−1.000, 1.000] (a minimal value of −1 occurs when all 25 experts evaluate the influence parameter as “not important” [25 (the number of experts) multiplied by −3 points and divided by 75)].
Features extracted from the published literature, standardized tests, and online survey are given by a ratio scale, and a higher value means more important. Features extracted from accident analysis and autonomous vehicle disengagement and accident reports are represented by dummy variables (1 or 0). A Boolean value of 1 (true) represents more important, while 0 (false) represents less important.
2.3.2 Application of cluster analysis
2.3.2.1 Used clustering algorithms
Considering both the assessment dimensions summarized by Wegmann et al. (2021) and our use case, the following assessment dimensions were considered to select appropriate clustering algorithms:
• Type of the dataset: In our use case, a mixed data structure is faced. The features corresponding to the source literature, standardized test, and online survey are numerical data, while those corresponding to source accident analysis and disengagement and accident reports are categorical data (dummy variables). The clustering algorithms applied should be applicable for datasets with a mixed data structure. According to our survey, the most common clustering algorithms applicable to mixed data structures are K-prototype (Huang, 1998) and algorithms based on Gower’s distance (Gower, 1971).
• Shape of clusters: The goal is to classify influence parameters into different importance levels, which, in principle, is a distance-based clustering problem rather than a density-based clustering problem. Figure 2 shows the biggest difference between results achieved by applying a typical distance-based algorithm—K-means (Hartigan and Wong, 1979) and a typical density-based algorithm DBSCAN (density-based spatial clustering of applications with noise) (Ester et al., 1996). Two different colors (blue and orange) represent two clusters of objects separated by the clustering algorithm. K-means separates the objects by regions in the coordinate system, which means features of objects within the same cluster are all relatively similar, while DBSCAN separates the objects by shapes, which means that two objects with large differences in features can still be grouped into one cluster. Therefore, density-based clustering algorithms are not suitable for our application.
• Sensibility to the scale of features: Advantages of the definition of weights for features regarding their relevance and quality are shown in Chowdhury (2021). The relevance to the topic—safety effectiveness of ADAS and comprehensiveness of sources used in 2.1—also varies. Thus, the weights should also be dedicatedly defined for features corresponding to different sources. The weight can be interpreted as feature re-scaling factors (Chowdhury, 2021). The used algorithms must be sensitive to the scale of features, which means a distribution-based clustering method like the Gaussian mixed model (Sarkar et al., 2020) is not appropriate.
• Implementation: The algorithms used in this study must be implemented in existing Python packages. Specifically, the Python package used must natively support the definition of feature weights and the utilization of precomputed Gower’s distance. If the package does not support these features, the required extension efforts must be reasonable.
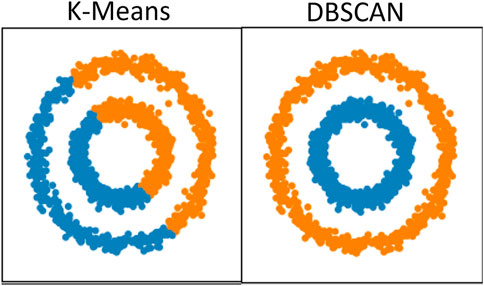
FIGURE 2. Comparison between K-means (distance-based) and DBSCAN (density-based). Reproduced from Comparing different clustering algorithms on toy datasets (2022).
Based on the assessment, the following clustering algorithms are determined for application.
• Ward’s hierarchical clustering (Murtagh and Legendre, 2014) based on Gower’s distance (Gower, 1971)
• K-prototypes (Huang, 1998)
2.3.2.2 Weight definition
As specified in section 2.2.2.1, it is necessary to define weights dedicatedly for different features. To determine the weights of features, two criteria (comprehensiveness and relevance) are used to evaluate the sources, from which features are extracted. The evaluations and determined weights are summarized in Table 3. Comprehensiveness assesses whether the sources cover all possible aspects related to safety effectiveness of ADAS so that influence parameters of certain aspects are not missed and qualitative assessments obtained are not biased. The literature research was carried out as extensively as possible. Nevertheless, completeness cannot be guaranteed. As for standardized tests, limited by the controllability of parameters like weather and light conditions, not every influence parameter is reflected in a standardized test, which leads to poor comprehensiveness. In accident analysis, main contributing factors in the IGLAD codebook are mostly summarized from accidents related to human-driven cars. Some factors that have an impact on ADAS are not summarized. These three sources are not comprehensive. The expert knowledge included in the online survey covers a wide range of relevant study fields. The influence parameter list evaluated by experts is a summarization of information from multiple sources. Disengagement and accident reports summarize the causes based on testing of autonomous vehicles on public roads, in which vehicles are exposed to real-world scenarios consisting of all possible influence parameters. These sources are comprehensive. Relevance measures the relevance of the information from the sources for the safety effectiveness of ADAS. In other words, the subject of study must be an ADAS or a subject that is functionally similar, such as an autonomous vehicle. Accident analysis is more relevant to human drivers than to ADAS, resulting in low relevance, while topics from other sources are highly relevant to the ADAS safety effectiveness. Features from sources (disengagement and accident reports, and online survey) that are both comprehensive and highly relevant were assigned the highest weight of 1. Features from sources (the literature and standardized test) that are highly relevant but not comprehensive were given the second highest weight of 2/3. The weight of the feature from the source (accident analysis) that is neither highly relevant nor comprehensive was defined as 1/3.
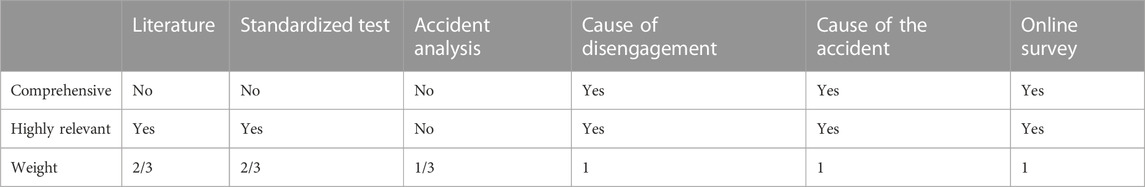
TABLE 3. Evaluation and weight definition of features corresponding to different sources.
2.3.2.3 Key parameter definition—Number of clusters
Both methods selected in section 2.2.2.1 require defining a key parameter at implementation—the number of clusters. This key parameter determines the number of clusters to which the influence parameters can be assigned. There were already three different qualitative assessments in both the online survey and literature research; a cluster number less than 3 would not be able to classify the parameters properly. In addition, a cluster number of more than 6 would make it difficult to give the clusters a proper importance definition. The number of clusters was varied from 3 to 6, and the optimal value was chosen based on the assessment method introduced in Section 2.2.2.5.
2.3.2.4 Implementation process
The key steps to implement Ward’s hierarchical clustering based on Gower’s distance are as follows:
1) Calculate Gower’s distance using the Python package Gower (Yan, 2019) based on extracted features with weights defined in section 2.2.2.2.
2) Apply Ward’s hierarchical clustering in the Python package SciPy (SciPy, 2022) using the precomputed Gower’s distance as the input.
The key steps to implement K-prototypes are as follows:
1) Extend original K-prototypes algorithms implemented in the original Python package KModes (Nelis J de Vos, 2022) to support the weight definition for features;
2) Apply the extended K-prototypes using the extracted features as the input.
2.3.2.5 Assessment of the clustering quality
To determine the best classification from the results obtained by combining different clustering methods and key parameter values, objective and subjective evaluations are combined. Subjective evaluation means that the results are examined by the authors to exclude abnormal and controversial results. The average silhouette width (ASW) was used to assess the quality of clustering objectively (Rousseeuw, 1987). Wegmann et al. (2021) denoted that the ASW works best for distance-based clustering. ASW ranges from −1 to 1. According to Sander and Lubbe (2018), ASW in different ranges can be interpreted as follows:
• [−1.000, 0.250]: No substantial structure was found.
• [0.251, 0.500]: A weak structure was found that could be artificial.
• [0.501, 0.700]: A reasonable structure was found.
• [0.701, 1.000]: A strong structure was found.
3 Results
In this section, the clustering results of the identified influence parameters were compared and examined to determine the best classification of the influence parameters. Then, the list of influence parameters including the identified influence parameters and the importance level of the parameters according to the best classification result is shown.
3.1 Result of clustering
As shown in Table 4, the best results (highest ASW) of both clustering methods were achieved when the number of clusters is 3. This suggests that it is reasonable to divide the influence parameters into three clusters. The ASW values of both methods with a defined cluster number of 3 (K-prototypes: 0.642, Ward: 0.677) also show that a reasonable structure was found according to the interpretations in section 2.2.2.5. The only difference between the results lies in three influence parameters (listed in Table 5), which are classified in the most important group by K-prototypes but in the less important group by Ward’s hierarchical clustering. According to the features of the three parameters shown in Table 5, they are not supposed to be less important since features corresponding to standardized tests and online surveys are very high for all three parameters. These three parameters are not covered in the AV disengagement and accident reports. K-prototypes based on the method presented by Huang (1998) can adjust the weight of the cost associated with categorical features relative to the weight of the cost associated with numerical features. The costs associated with categorical features were lowered during clustering. This resulted in the different clustering result of the three parameters listed in Table 5. The clustering result obtained by applying K-prototypes with a cluster number of three was accepted.

TABLE 4. Average silhouette width when using different methods and the number of clusters.
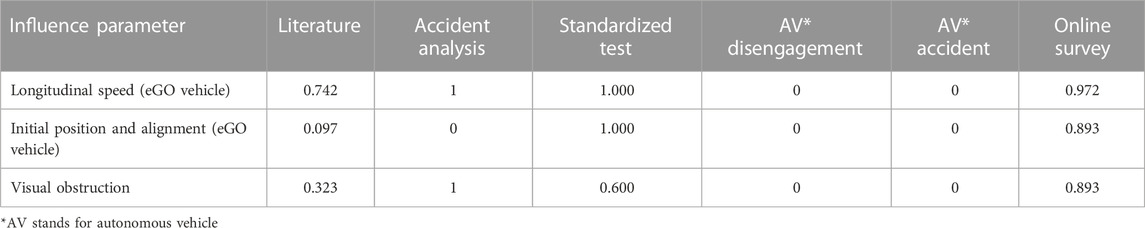
TABLE 5. Influence parameters classified differently by K-prototype and Ward’s hierarchical clustering (K-prototype: most important; Ward: less important).
According to the result of clustering, the influence parameters were divided into three different importance levels, namely, most important, important, and less important. These importance levels are relative concepts, and less important does not mean unimportant. The means of numerical features extracted from the literature, online survey, and the percentage of a value of 1 (true) of categorical features corresponding to autonomous vehicle disengagement and accident reports and accident analysis are shown in Table 6 for clusters with different importance levels. The difference in means and percentages between clusters with different importance levels proves the plausibility of the classification.

TABLE 6. Statistical comparison between clusters with different importance levels.
3.2 Influence parameter list
In total, 94 influence parameters were collected and are listed in Table 7. To be consistent with other researchers on the topic of “scenario description,” the six-layer model presented in the German research project PEGASUS (PEGASUS METHOD, 2019) was used. The influence parameters were assigned to these layers (column “Layer” in Table 7) except for layer 3—temporal modification. Layer 3 describes only the temporal change of influence parameters included in layers 1 and 2. The column “Sub-cat” indicates a subcategory to which the parameter belongs, to allow deeper categorization and definition that are more precise. A total of 77 influence parameters were identified or summarized from the published literature, IGLAD codebook, and five standardized tests. In total, 17 parameters were supplemented by experts through the online surveys and are tagged as “not classified” in the column “Class.” The column “Class” implies the importance of influence parameters for ADAS safety effectiveness evaluation based on the clustering result accepted in section 3.1. There are, in total, four different definitions in column “Class”: “Most important,” “Important,” “Less important,” and “not classified.” In total, 77 of the 94 influence parameters were divided into the first three classes. In particular, eight parameters in the “most important” class and 22 parameters in the “important” class are of particular interest. The 17 parameters in the “not classified” class should also be noted as they were added by survey experts, indicating that they were kept in mind by the experts. It should be noted that the importance definition given for the influence parameters is a general definition where different ADAS are treated as a whole. In particular use cases, the characteristics of specific ADAS types (e.g., systems based on different sensors and systems designed for different purposes, etc.) and scenarios (e.g. highway scenarios, urban scenarios, etc.) should be considered in combination with the general importance definition.
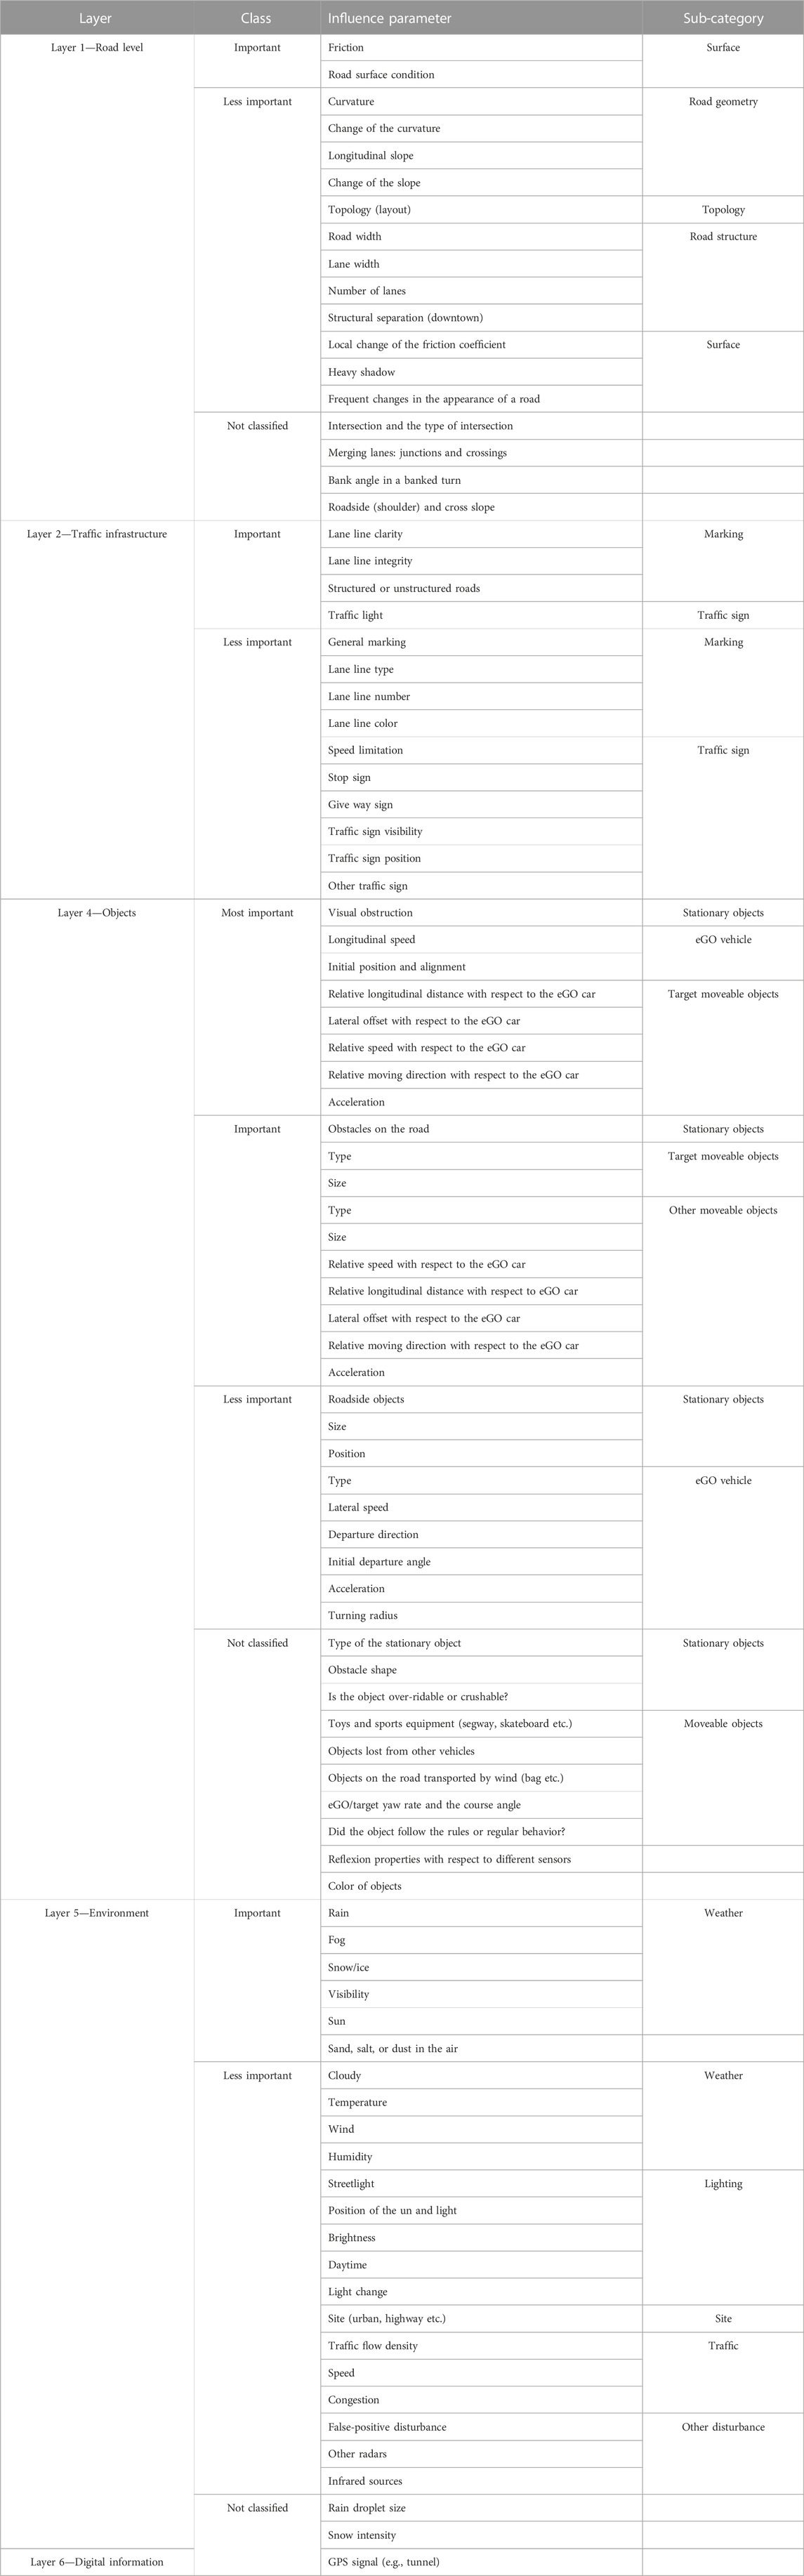
TABLE 7. Influence parameter list with categorization and classification.
4 Conclusion
4.1 Key findings
By combining information from different sources including the published literature, accident analysis knowledge, standardized tests, autonomous vehicle disengagement, and accident reports and expert knowledge from online surveys, an extensive list of 94 influence parameters has been collected and structured according to a six-layer scenario description model defined by PEGASUS (PEGASUS METHOD, 2019). In addition to the 17 influence parameters added by experts through the online survey, 77 of the 94 influence parameters were generally classified into three different levels of importance (most important, important, and less important) using K-prototype clustering based on weighted features extracted from various sources mentioned previously. Among them, the eight most important influence parameters (ego vehicle: longitudinal speed, initial position, and alignment; target moveable objects: relative longitudinal distance with respect to the eGO car, lateral offset with respect to the eGO car, relative speed with respect to the eGO car, relative moving direction with respect to the eGO car, and acceleration; and stationary objects: visual obstruction) and 22 important influence parameters (listed in Table 7) are especially worthy of attention. The list of influence parameters allows researchers and system developers to select influence parameters for the generation of scenarios in virtual scenario-based testing from a comprehensive point of view.
4.2 Limitations and outlooks
There are three main directions to improve the result of this paper.
• This paper focuses on ADAS features rather than autonomous driving features as ADAS features have a significantly higher market penetration than autonomous driving features. Adequate information on ADAS features can be obtained from all presented sources and will be analyzed comprehensively, e.g., standardized tests are currently only developed and performed for ADAS features. Autonomous driving features are expected to play a bigger role in the future of transportation. A similar methodology can be applied specially to autonomous driving features, which are likely to be more complex in terms of application scenarios, available functionality, and system architecture.
• The ADAS features are constantly being improved and expanded. The influence parameters should also be further supplemented and updated to match the development trend of ADAS for the completeness of the list of influence parameters. It should also be considered and discussed whether driver behavior should be included in the description of the scenarios and whether driver-related parameters should be included in the list of influencing parameters.
• In this paper, importance levels of influence parameters are determined by analyzing information synthesized from various sources in a general context. To obtain more specific and validated definitions of the importance level, the influence parameters can be examined for specific types of ADAS in specific types of scenarios using simulation in which the influence of the variation of influence parameters on the safety effectiveness of ADAS can be quantitatively observed and evaluated. It is important to note that the effects of variations of influence parameters should be accurately reflected in the used simulators.
Data availability statement
The raw data supporting the conclusion of this article will be made available by the authors, without undue reservation.
Author contributions
FG, AF, SK, WS, ET, HS, and JM contributed to the conception and design of the study and execution of the online survey. FG, JM, and ET contributed to the perfection and finalization of the influence parameter list. FG contributed to meta-analysis, cluster analysis. FG wrote the first draft of the manuscript. All authors contributed to manuscript revision and improvement, and read and approved the submitted version.
Funding
This work is supported by Virtual Vehicle Research GmbH under the project IMPACT. The authors would like to acknowledge the financial support within the COMET K2 Competence Centers for Excellent Technologies from the Austrian Federal Ministry for Climate Action (BMK), the Austrian Federal Ministry for Labour and Economy (BMAW), the Province of Styria (Dept. 12), and the Styrian Business Promotion Agency (SFG). The Austrian Research Promotion Agency (FFG) has been authorized for the program management. The publication fee is supported by the TU Graz Open Access Publishing Fund. The funders were not involved in the study design, collection, analysis, interpretation of data, the writing of this article, or the decision to submit it for publication.
Conflict of interest
Authors AF and SK are employed by Virtual Vehicle Research GmbH.
The remaining authors declare that the research was conducted in the absence of any commercial or financial relationships that could be construed as a potential conflict of interest.
Publisher’s note
All claims expressed in this article are solely those of the authors and do not necessarily represent those of their affiliated organizations, or those of the publisher, the editors, and the reviewers. Any product that may be evaluated in this article, or claim that may be made by its manufacturer, is not guaranteed or endorsed by the publisher.
References
Antona-Makoshi, J., Uchida, N., Kitahara, E., Ozawa, K., and Taniguchi, S. (2019). “Development of A Safety assurance process for automated driving systems,” in 26th ITS world congress (Singapore, 21–25.
Ben Abdessalem, R., Nejati, S., Briand, L. C., and Stifter, T. (2016). “Testing advanced driver assistance systems using multi-objective search and neural networks,” in Proceedings of the 31st IEEE/ACM international conference on automated software engineering - ASE 2016. Singapore, Singapore (New York, New York, USA: ACM Press), 63–74. 03.09.2016 - 07.09.2016. doi:10.1145/2970276.2970311
Boggs, A. M., Arvin, R., and Khattak, A. J. (2020). Exploring the who, what, when, where, and why of automated vehicle disengagements. Accid. analysis Prev. 136, 105406. doi:10.1016/j.aap.2019.105406
Buehler, O., and Wegener, J. (2005). Evolutionary functional testing of a vehicle brake assistant system. in 6th metaheuristics international conference (Vienna, Austria).
California Department of Motor Vehicles (2022). Autonomous vehicles. [Online]. Available at: https://www.dmv.ca.gov/portal/vehicle-industry-services/autonomous-vehicles/ (Accessed May 2, 2022).
Chelbi, N. E., Gingras, D., and Sauvageau, C. (2019). “New field operational tests sampling strategy based on metropolis-hastings algorithm,” in Intelligent systems and applications. Editors K. Arai, S. Kapoor, and R. Bhatia (Cham: Springer International Publishing), 1285–1302. doi:10.1007/978-3-030-01054-6_90
Chelbi, N. E., Gingras, D., and Sauvageau, C. (2018). Proposal of a new virtual evaluation approach of preventive safety applications and advanced driver assistance functions – application: AEB system. IET Intell. Transp. Syst. 12 (9), 1148–1156. doi:10.1049/iet-its.2018.5269
Chen, M., Andreas, K., Martin, P., and Klaus, D. (2018). Taming functional deficiencies of automated driving systems: A methodology framework toward safety validation: 26-30. Piscataway, NJ: IEEE. doi:10.1109/IVS.2018.8500679
Chen, Q., Chen, Y., Bostrom, O., Ma, Y., and Liu, E. (2014). A comparison study of car-to-pedestrian and car-to-E-bike accidents: Data source: The China in-depth accident study (CIDAS). Warrendale, PA, United States: SAE International400 Commonwealth Drive. SAE Technical Paper Series, APR. 08, 2014. doi:10.4271/2014-01-0519
Chowdhury, S. (2021). Learning feature weights for density-based clustering. Dissertation, Hertfordshire, University of Hertfordshire.
Comparing different clustering algorithms on toy datasets (2022). Comparing different clustering algorithms on toy datasets. [Online]. Available at: https://scikit-learn.org/stable/auto_examples/cluster/plot_cluster_comparison.html (Accessed May 1, 2022).
Doric, I. (2017). A generalised approach to active pedestrian safety testing. Warwick: Doctoral dissertation, University of Warwick.
Duan, J., Gao, F., and He, Y. (2020). Test scenario generation and optimization technology for intelligent driving systems. IEEE Intelligent Transportation Systems Magazine, 1. doi:10.1109/MITS.2019.2926269
Eckstein, P., Götze, W., Hartl, F., Rönz, B., and Strohe, H. G. (1994). Lexikon statistik. Wiesbaden: Gabler Verlag. doi:10.1007/978-3-322-91144-5
Ester, M., Kriegel, H.-P., Sander, J., and Xu, X. (1996). A density-based algorithm for discovering clusters in large spatial databases with noise.
Favarò, F., Eurich, S., and Nader, N. (2018). Autonomous vehicles' disengagements: Trends, triggers, and regulatory limitations. Accid. analysis Prev. 110, 136–148. doi:10.1016/j.aap.2017.11.001
Favarò, F. M., Nader, N., Eurich, S. O., Tripp, M., and Varadaraju, N. (2017). Examining accident reports involving autonomous vehicles in California. PloS one 12 (9), e0184952. doi:10.1371/journal.pone.0184952
Goodin, C., Carruth, D., Doude, M., and Hudson, C. (2019). Predicting the influence of rain on LIDAR in ADAS. Electronics 8 (1), 89. doi:10.3390/electronics8010089
Google (2021). Forms. [Online]. Available at: https://www.google.com/forms/about/ (Accessed, 2021).
Gower, J. C. (1971). A general coefficient of similarity and some of its properties. Biometrics 27 (4), 857. doi:10.2307/2528823
Hartigan, J. A., and Wong, M. A. (1979). Algorithm as 136: A K-means clustering algorithm. Appl. Stat. 28 (1), 100. doi:10.2307/2346830
Hasirlioglu, S., Doric, I., Kamann, A., and Riener, A. (2017). Reproducible fog simulation for testing automotive surround sensors’, 2017 IEEE 85th vehicular technology conference (Sydney, NSW; VTC Spring). 04.06.2017 - 07.06.2017, IEEE, 1–7. doi:10.1109/VTCSpring.2017.8108566
Hasirlioglu, S., Doric, I., Lauerer, C., and Brandmeier, T. (2016). “Modeling and simulation of rain for the test of automotive sensor systems,” in 2016 IEEE intelligent vehicles symposium (IV). Gotenburg (Sweden: IEEE), 286–291. 19.06.2016 - 22.06.2016. doi:10.1109/IVS.2016.7535399
Huang, Z. (1998). Extensions to the k-means algorithm for clustering large data sets with categorical values. Data Min. Knowl. Discov. 2 (3), 283–304. doi:10.1023/A:1009769707641
Junietz, P., Bonakdar, F., Klamann, B., and Winner, H. (2018). “Criticality metric for the safety validation of automated driving using model predictive trajectory optimization,” in 2018 21st international conference on intelligent transportation systems (ITSC) (Maui, HI: IEEE), 60–65. 04.11.2018 - 07.11.2018. doi:10.1109/ITSC.2018.8569326
Kalra, N., and Paddock, S. M. (2016). Driving to safety: How many miles of driving would it take to demonstrate autonomous vehicle reliability? ’, Transp. Res. Part A Policy Pract. 94 (4), 182–193. doi:10.1016/j.tra.2016.09.010
Kluck, F., Zimmermann, M., Wotawa, F., and Nica, M. (2019). “Genetic algorithm-based test parameter optimization for ADAS system testing,” in 2019 IEEE 19th international conference 22.07.2019, 418–425. doi:10.1109/QRS.2019.00058
Kolk, H., Tomasch, E., Haberl, M., and Fellenndorf, M. (2018). “ crash-simulation,” in 8th international conference on ESAR. Hannover: Expert Symposium on Accident Research.
Koné, T. F., Bonjour, E., Levrat, E., Mayer, F., and Géronimi, S. (2020). “Safety demonstration of autonomous vehicles: A review and future research questions,” in Complex systems design & management. Editors G. A. Boy, A. Guegan, D. Krob, and V. Vion (Cham: Springer International Publishing), 176–188. doi:10.1007/978-3-030-34843-4_15
Kurt, A., Özbilgin, G., Redmill, K. A., Sherony, R., and Özgüner, Ü. (2015). “Test scenarios, equipment and testing process for LDW LDP performance evaluation,” in SAE technical paper series (Warrendale, PA, United States: SAE International400 Commonwealth Drive). doi:10.4271/2015-01-1404
Lakshmanan, S. (2019). Data science: How, when, and why should you normalize/standardize/rescale your data? [Online]. Available at: https://towardsai.net/p/data-science/how-when-and-why-should-you-normalize-standardize-rescale-your-data-3f083def38ff.
Mathworks (Editor) (2021). k-Means Clustering. [Online]. Available at: https://www.mathworks.com/help/stats/k-means-clustering.html.
Murtagh, F., and Legendre, P. (2014). Ward's hierarchical clustering method: Clustering criterion and agglomerative algorithm. J. Classif. 31 (3), 274–295. doi:10.1007/s00357-014-9161-z
Nalic, D., Tomislav, M., Maximilian, B., Matthias, L., Arno, E., and Stefan, B. (2020). Scenario based testing of automated driving systems: A literature survey. Prague: FISITA Web Congress.
J de Vos, Nelis (2022) Kmodes 0.12.1 [Online]. Available at: https://pypi.org/project/kmodes/ (Accessed 1 May 2022).(2019) PEGASUS METHOD: An Overview.
Raffaëlli, L., Vallée, F., Fayolle, G., Souza, P. D., Rouah, X., Pfeiffer, M., et al. (2016). Facing ADAS validation complexity with usage oriented testing. ERTS 2016. [Online]. Available at: http://arxiv.org/pdf/1607.07849v1.
Rousseeuw, P. J. (1987). Silhouettes: A graphical aid to the interpretation and validation of cluster analysis. J. Comput. Appl. Math. 20, 53–65. doi:10.1016/0377-0427(87)90125-7
SAE On-Road Automated Vehicle Standards Committee (2014). SAE Standard J 3016: Taxonomy and definitions for terms related to on-road motor vehicle automated driving systems.
Sander, U., and Lubbe, N. (2018). The potential of clustering methods to define intersection test scenarios: Assessing real-life performance of AEB. Accid. analysis Prev. 113, 1–11. doi:10.1016/j.aap.2018.01.010
Sarkar, S., Melnykov, V., and Zheng, R. (2020). Gaussian mixture modeling and model-based clustering under measurement inconsistency. Adv. Data Analysis Classif. 14 (2), 379–413. doi:10.1007/s11634-020-00393-9
Schmidt, F., and Sax, E. (2009). ‘Funktionaler Softwaretest für aktive Fahrerassistenzsysteme mittels parameterierter Szenario-Simulation’, Informatik 2009–Im Focus das Leben.
SciPy (2022). Fundamental algorithms for scientific computing in Python. [Online]. Available at: https://scipy.org/ (Accessed May 1, 2022).
Seiniger, P., and Gail, J. (2015). ‘A methodology to derive precision requirements for automatic emergency braking (AEB) test procedures’, 24th International Technical Conference on the Enhanced Safety of Vehicles. Gottenburg: ESV.
Staender, P. (2010). Eine modellbasierte Methode zur Objektivierung der Risikoanalyse nach ISO 26262, Doctoral dissertation. Braunschweig: Technische Universität Braunschweig.
Sun, J., Zhang, H., Zhou, H., Yu, R., and Tian, Y. (2021). Scenario-based test automation for highly automated vehicles: A review and paving the way for systematic safety assurance. In IEEE transactions on intelligent transportation systems, 1–16. doi:10.1109/TITS.2021.3136353
TÜV SÜD (2021). Assessment of automated vehicles with scenario-based testing: Testing of critical scenarios in a controlled environment. [Online]. Available at: https://www.tuvsud.com/en/industries/mobility-and-automotive/automotive-and-oem/autonomous-driving/assessment-of-automated-vehicles-with-scenario-based-testing.
Wegmann, M., Domenique, Z., Jonas, H., and Jürgen, F. (2021). A review of systematic selection of clustering algorithms and their evaluation. arXiv preprint.
Weitzel, A., and Winner, H. (2013) ‘Controllability assessment for unintended reactions of active safety systems’, in Proceedings of the 23rd international technical conference on the enhanced safety of vehicles.
Weitzel, D. A. (2014) Absicherungsstrategien für Fahrerassistenzsysteme mit Umfeldwahrnehmung: Bericht zum Forschungsprojekt FE 82.0546/2012 [Online], Bremen, Fachverl. NW. Available at: http://bast.opus.hbz-nrw.de/volltexte/2015/836/pdf/F98b.pdf.
Wimmer, P., Düring, M., Chajmowicz, H., Granum, F., King, J., Kolk, H., et al. (2019). Toward harmonizing prospective effectiveness assessment for road safety: Comparing tools in standard test case simulations. Traffic Inj. Prev. 20(1), S139–S145. doi:10.1080/15389588.2019.1616086
Wittmann, D., Lienkamp, M., and Wang, C. (2017). “Method for comprehensive and adaptive risk analysis for the development of automated driving,” in 2017 IEEE 20th international conference on intelligent transportation systems (ITSC) (Yokohama: IEEE), 1–7. 16.10.2017 - 19.10.2017. doi:10.1109/ITSC.2017.8317791
Wittmann, D., Wang, C., and Lienkamp, M. (2015). Definition and identification of system boundaries of highly automated driving. Munich: Tagung Fahrerassistenz, 7.
Xia, Q., Duan, J., Gao, F., Chen, T., and Yang, C. (2017). “Automatic generation method of test scenario for ADAS based on complexity,” in SAE technical paper series (Warrendale, PA, United States: SAE International400 Commonwealth Drive). SEP. 26, 2017. doi:10.4271/2017-01-1992
Xia, Q., Duan, J., Gao, F., Hu, Q., and He, Y. (2018). Test scenario design for intelligent driving system ensuring coverage and effectiveness. Int. J. Automot. Technol. 19 (4), 751–758. doi:10.1007/s12239-018-0072-6
Yan, M. (2019). Gower 0.0.5. [Online]. Available at: https://pypi.org/project/gower/ (Accessed May 1, 2022).
Zhang, Q., Chen, D., Li, Y., and Li, K. (2015). “Research on performance test method of lane departure warning system with PreScan,” in Proceedings of SAE-China congress 2014: Selected papers (Berlin, Heidelberg: Springer Berlin Heidelberg), 445–453. doi:10.1007/978-3-662-45043-7_45
Zhao, D., Lam, H., Peng, H., Bao, S., LeBlanc, D. J., Nobukawa, K., et al. (2017). “Accelerated evaluation of automated vehicles safety in lane-change scenarios based on importance sampling techniques,” in IEEE transactions on intelligent transportation systems (a publication of the IEEE Intelligent Transportation Systems Council), 18, 595–607. doi:10.1109/TITS.2016.2582208
Keywords: advanced driver assistance systems, influence parameters, scenario-based testing, safety effectiveness, cluster analysis
Citation: Guo F, Fuchs A, Kirschbichler S, Sinz W, Tomasch E, Steffan H and Moser J (2023) Collection and classification of influence parameters for safety effectiveness of ADAS. Front. Future Transp. 4:945599. doi: 10.3389/ffutr.2023.945599
Received: 16 May 2022; Accepted: 06 March 2023;
Published: 03 April 2023.
Edited by:
Robert Thomson, Chalmers University of Technology, SwedenReviewed by:
David Kidd, Insurance Institute for Highway Safety (IIHS), United StatesDustin Joshua Souders, Clemson University, United States
Makoto Itoh, University of Tsukuba, Japan
Copyright © 2023 Guo, Fuchs, Kirschbichler, Sinz, Tomasch, Steffan and Moser. This is an open-access article distributed under the terms of the Creative Commons Attribution License (CC BY). The use, distribution or reproduction in other forums is permitted, provided the original author(s) and the copyright owner(s) are credited and that the original publication in this journal is cited, in accordance with accepted academic practice. No use, distribution or reproduction is permitted which does not comply with these terms.
*Correspondence: Fengwei Guo, ZmVuZ3dlaS5ndW9AdHVncmF6LmF0