 Gabriel de Oliveira Torres
 Marcelo Xavier Guterres
 Victor Rafael Rezende Celestino
94% of researchers rate our articles as excellent or good
Learn more about the work of our research integrity team to safeguard the quality of each article we publish.
Find out more
ORIGINAL RESEARCH article
Front. Future Transp., 17 April 2023
Sec. Transportation Systems Modeling
Volume 4 - 2023 | https://doi.org/10.3389/ffutr.2023.1070533
In Brazil, one of the most harmful costs for airlines is the number of lawsuits filed against them. It is a problem that can affect its operations, reduce the entry of new competitors and create legal uncertainty in the country. This work seeks to highlight the factors which most contribute to the rise of judicial indemnities, discuss the most relevant issues and identify the best techniques to predict the indemnified values. The objective is to provide subsidies for airlines to mitigate the number of legal actions by using machine learning models. This research contributes by discussing one of the most relevant subjects in Brazilian air transport and comparing the machine learning models’ performance. The study is based on lawsuits between 2016 and 2021 using the companies’ data. The performance of Naive Bayes, Random Forest, Support Vector Machines, and Multinomial Logistic Regression models are evaluated through the accuracy, area under the ROC curve, and confusion matrix. The results showed better predictive power for Random Forest and Logistic Regression. The latter showed that flight delays, cancellations, and airline faults have a negative effect on indemnities. The above-average compensation is a tendency in some states, being the moral damage awarded to customers the main cause of higher compensation.
The air transport industry, which has narrow profit margins, depends on external factors that are not only outside the companies’ control, but also difficult to control, such as the price of fuel (Doganis, 2019). Other factors, such as weather conditions, aeronautical infrastructure, air traffic problems, and unexpected aircraft maintenance, can also hamper airline operations. In addition to increasing the complexity of operations, some aspects may generate extra expenses for the companies, such as costs with lawsuits, food supply, transport assistance, and accommodation for passengers, since the chances of failure may frustrate customers’ expectations (Gasparotto et al., 2018).
Some conditions not controlled by the companies, such as meteorology, studied by de Oliveira et al. (2021), aircraft in transit, and air traffic system may generate more lawsuits. Having to cancel flights in favor of flight safety is common. The service offered is presented as a factor that can directly interfere with consumers’ relations (Sezgen et al., 2019; Lucini et al., 2020). One of the most relevant aspects of customer satisfaction is related to companies’ punctuality, a point observed by Arora and Mathur (2020). Although Brazilian airlines face many lawsuits, their performance is similar to the United States, which is around 80%. Non-operational aerodromes, air traffic intensity, and flight delays are other causes of lawsuits. In short, these extra costs with passengers are approximately 3% of the total companies’ costs in the industry1.
The airlines’ low efficiency in solving conflicts, the guarantee of compensation, or a culture of litigation ingrained in the country contribute to the problem in Brazil. Some companies encourage legal actions by buying the right of the passenger to receive compensation. These companies help to inhibit the growth of Brazilian aviation, as they may increase legal uncertainty, reduce the chances of foreign companies to operate in the country, reduce competition and influence the ticket price.
According to Yadav and Goriet (2022), the airline’s performance is affected by external factors, such as political, economic and legal directives. The cost of legal compliance is an example that influences revenue and performance. The difficulty of discussing the problem is also present in China’s air transport. Wang (2015) states that there are several laws regarding the issue. The discrepancies and controversies on the scope of the carrier’s liabilities, on the doctrine of liability fixation, and the amount of compensation provided for in related laws generate these difficulties.
The liability of the airline is an issue that goes beyond the delay and flight cancellation. It is present in accidents and diseases. Sipos (2021) explains that there are situations in which the judge establishes an accident and the air carrier’s liability. However, it requires the existence of a cause-effect relationship between the accident and the airline’s negligence. The Court of Justice of the European Union2 indicates that airlines may be released from their obligation to pay compensation if they prove that the cancellation or delay was due to extraordinary circumstances beyond their actual control and that could not have been avoided even if all reasonable measures had been taken. Additionally, the regulation provides for flat-rate compensation.
In Brazil, the airlines must follow the rules set out in Resolution No. 400, of 13 December 2016 recommended by ANAC (National Civil Aviation Agency) regarding assistance to passengers. The hypotheses of assisting consumers listed in the Resolution are similar to the causes of dissatisfaction shown by Xu and Li (2016). If customer assistance is not provided, it may still be recourse to the special civil courts in some Brazilian airports. According to Sabo et al. (2021), these courts were created to enable citizens’ access to justice. Another way to solve conflicts is to contact the company directly through the Consumidor.gov platform, a public service to solve consumer-company disputes considering lawsuits the last measure.
The consumption relationship in air transport is subject to the Consumer Defense Code (Sabo et al., 2021). This law establishes consumer protection rules, such as access to judicial and administrative bodies to prevent or repair property and moral damages3. Brazilian judicial decisions are based on this law, without prejudice to international treaties in which Brazil is a party, such as the Montreal and Warsaw Conventions, both related to international air transport. Non-etheless, judges are still confused about the application of one or another rule.
Discussing legal actions in air transport is complex because of different national laws, regional cultures, treaties, and the judiciary. Some judges do not recognize these laws, and most passengers do not know their rights and obligations. Additionally, the difficulty to find data makes it hard to get information, either nationally or internationally. Generally, data on customers and compensations paid by airlines are classified, making access to relevant information difficult.
This research considered the Random Forest, Support Vector Machines, Naive Bayes, and Multinomial Logistic Regression (MLR) models to address the following research questions: What are the most relevant factors to define the judicial indemnity value?, and which model has the best performance when predicting the final indemnity?
Random Forest uses bagging replacement sampling and random selection of attributes and causes variability in the induced trees, which makes it competitive compared to other approaches. It is known for its predictive capacity. SVM allows for solving complex problems with an appropriate kernel function, which helps to have satisfactory results if the proper kernel is used. In addition, it can handle databases with relatively high dimensions and noisy data. Naive Bayes presents the assumption that the attribute values are conditionally independent, which brings simplicity to solving the algorithm and less computational cost. Despite this, it can perform comparably to neural networks and decision trees in some domains. Multinomial logistic regression is cost-effective. It can establish relationships between variables, does not have different results if the reference base is another category, and provides the direction (positive or negative) of the relationship between the variables. These models were part of the research choice.
These models are widely used in the literature in several domains, such as recommendation systems by Rrmoku et al. (2022), speech detection by Alaoui et al. (2022), road traffic accidents by Bokaba et al. (2022), air pollution prediction by Kumar and Pande (2022), charging demand of electric buses by Deb and Gao (2022), prediction of risk of unmanned aircraft by Truong and Choi (2020), prediction of demand for air taxi aviation by Rajendran et al. (2021). The performance results are evaluated based on the confusion matrix, the accuracy, the area under the ROC curve, and the algorithms’ processing time. The reason for using these algorithms is their performance shown in the literature and the computational cost involved.
The hypothesis based on the literature that applies the referred models indicates the Random Forest, being an ensemble and robust one, might be the best approach to classify the compensation values given the attributes present in lawsuits. Based on the database knowledge, the moral damages, the northern region, and canceled flights are the main factors for high indemnities.
The primary contribution of this study is to highlight the main factors that lead clients to take legal action and to show what most affects compensation values. Furthermore, it points out possible hypotheses for different behaviors in each Brazilian region and presents models that help in cost forecasting. This knowledge assists airlines in predicting lawsuit expenses, in strategies to mitigate the problem, and evidences the possibility of solving the problem before going to court. These aspects and the lack of knowledge in the academic literature justify the execution of this novel study.
This article is organized as follows: Section 2 presents de current literature and works that applied the same techniques. Section 3 describes the methodology and the database. In Sections 4, 5 the results are highlighted and discussed, and the relationship among the variables is examined. Finally, Section 6 presents the research conclusions and limitations, and future work possibilities.
Knowing how cases of dissatisfaction between customers and airlines are handled in different parts of the world is crucial to understanding that there is often an absence or excess of regulations that do not define specific actions. This leaves room for the judiciary’s subjectivity and a lack of standardization in conflict resolution. On the other hand, using known and widespread methods in various areas of knowledge, such as machine learning models, helps to have confidence in understanding how some situations are influenced by poorly explored variables. Thus, this section presents the literature that discusses topics related to legal actions, air carriers’ liability, and studies that show the relevance of machine learning techniques.
Information about legal actions in air transport is a topic of great difficulty because of their confidentiality. There is a lack of research concerning this problem since no information was collected. Some of the studies takes the liability of the airline in special cases. Wang (2015) investigates how the conflicts involving air carriers and passengers are settled in China. Several laws govern the country, some limiting the carrier’s liability and others establishing the minimum rights for passengers. The difficulties are due to discrepancies and controversies on the scope of the carrier’s liabilities, the doctrine of liability fixation, and the amount of compensation provided for in related laws. These aspects are frequent in the Brazilian case. Different interpretations of different laws hinder the standardization of the problem.
Mazaheri and Basiri (2018) assessed the civil liability of air carriers at international and national levels. The research focused on the delays caused by the airlines. Non-etheless, it does not exist a specific definition for the delay. It is difficult for the passenger to demand proper services in a delay. Due to the lack of information in regulatory laws, the passenger should strive for a lawsuit in the Iranian law system. This can overburden the judiciary.
Hipp (2019)aims to analyze how new business models in form of claim management companies have successfully established themselves on the market. It is an interesting subject because what causes this number of lawsuits in Brazil is related to these companies. The passengers do not feel a loss when they need to pay the tax to the management companies. It still feels like a gain for them, because they did not expect that money. These companies help informing consumers about their rights.
Sipos (2021) seeks to answer the airline liability in the event of damages caused by diseases and the passengers’ health during the aircraft operations. The analysis is conducted according to Warsaw Convention. There are situations in which the air carrier is considered responsible for an accident. However, this requires a cause-effect relationship between the occurrence of the accident and the negligence of the air carrier. For instance, if the airline does not deny the carriage of the passenger manifesting COVID-19 symptoms, it has liability in case of infections.
Yadav and Goriet (2022) list several factors that affect airlines’ performance, such as primary and external factors. Political, economic, and legal mandates influence performance. The authors identified and analyzed relationships between these factors and airline operational performance. Data were collected through a descriptive survey. The vulnerability of the aviation industry is made present due to changes in legal environments, and the airline’s performance may be affected if the external factors are unstable or unpredictable.
The researches discussed above show that legal action is a complicated issue. There are several factors that hamper the standardization of a solution for every type of lawsuit. The regulatory laws do not have all the definitions, being the judge’s interpretation another variable. It can be seen that these studies analyzed the problems involving the subject, but none of them investigated the factors that led to a lawsuit against the airlines nor which of them led to high compensations. Table 1 shows an overview of the studies.
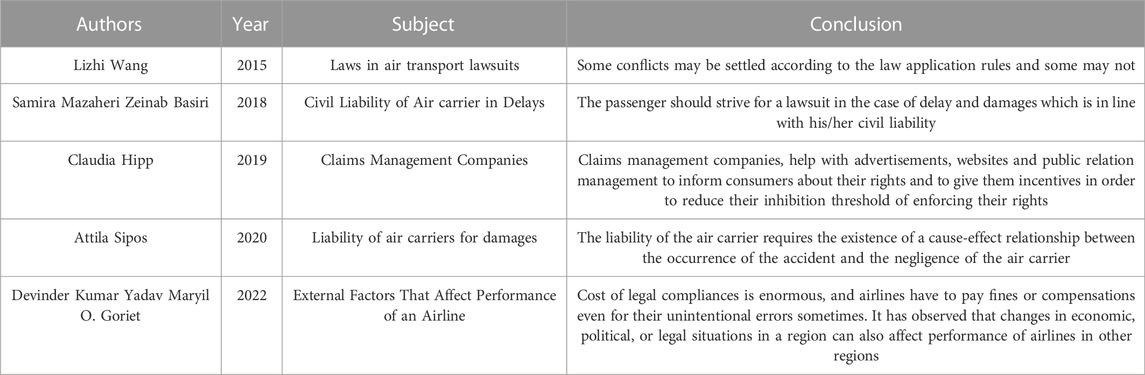
TABLE 1. Synoptic table of the reviewed studies.
Machine learning is used in many areas of knowledge, such as transportation, health, judicial, and others. Recent studies used text mining to analyze customer reviews on air transport. Sezgen et al. (2019) and Lucini et al. (2020) explored online reviews from air transport clients from different countries and airlines. Although these works have shown the attributes most likely to cause dissatisfaction among passengers, they did not investigate the impact these aspects cause on the airlines, which is important for them to create ways of reducing problems of great relevance.
Supervised and unsupervised models are frequently employed in the judicial area. Sabo et al. (2021) used clustering approaches in judicial decisions to obtain information about important factors in the air transport, such as service failures. Lei et al. (2017) used supervised models: Naive Bayes, Support Vector Machines and Random Forest to classify documents of Chinese court decisions. The SVM was the most accurate among them. The Naive Bayes classifier may show good potential for text classification, with accuracy and computational efficiency superior to other classification models, such as decision trees, neural networks and SVM, depending on the study domain (Ting et al., 2011). However, it depends on the lack of multicollinearity among the variables, which can be limiting in some cases (Tsangaratos and Ilia, 2016).
Yanying et al. (2019) applied NB, SVM, Decision Trees (DT), and Logistic Regression (LR) to predict the possibility of flight cancellations based on flight time, distance and other variables. Their study showed better performance for DT and SVM, with approximately 90% accuracy. Because of the conditional independence assumption of the NB, this model did not perform well. Schmalz et al. (2021) used the NB and SVM models to classify air travel trends. The SVM yielded the best model. They divided the data into seven different categories based on the air transport literature. An important aspect of this study was the concern of balancing the dataset classes to avoid any bias.
Recent studies about air transport used logistic regression in cases where the research variable is dichotomous. Negri et al. (2019) discussed the probability to use biometrics in airport check-in procedures, de Oliveira et al. (2021) studied the performance of arrival flights in the Brazilian air transport system due to meteorological impacts, Freitas et al. (2021) evaluated the consumer experience with commercial establishments in Brazilian airports. Savolainen et al. (2011) state that when there are three or more types of categories in the target class, it is possible to use the Multinomial Logistic Regression (MLR). Lieshout et al. (2016) applied MLR to estimate the level of competition in the air transport market available to consumers in Europe.
Wang and Herricks (2012) studied the presence of birds in the vicinity of an airfield. This can be a problem for air operations, as it can cause delays, cancellations, and accidents, potential factors to create lawsuits against airlines. The research contributes by highlighting the factors most likely to cause bird strike in the aerodrome vicinity using MLR. Arora and Mathur (2020) applied MLR to investigate service failures among United States airlines using the information on aircraft departure delays from origin airports.
Some ways to evidence the quality of machine learning models are performance comparisons made with statistical approaches, such as multinomial regression. A challenge when comparing statistical and machine learning models is that they do not have comparable interpretive power (Wang and Ross, 2018). However, some studies have addressed the topic to identify the best method to be used in different cases. As a way to address this issue, Christodoulou et al. (2019) developed a systematic study to analyze several works that performed comparisons between logistic regression and ML models in the medical clinic subject. Among the studies, 90% evaluated the techniques through the area under the ROC curve.
Wang and Ross (2018) compared the Extreme Gradient Boosting (XGB) and MRL models to model the travel mode choice of individuals based on a regional travel dataset. The study was based on the errors of the multi-class predictions to compare the models’ performance. Rajendran et al. (2021) address the issue of urban air transport, more specifically, urban air taxis. This work used machine learning models, such as RF, Gradient Boosting, MLR, and artificial neural networks with continuous and categorical variables to predict the demand for this mode of transport in New York City. The techniques used for comparison were based on accuracy.
Shiran et al. (2021) addressed a road accident severity analysis using artificial neural networks and decision tree techniques compared to MLR. The objective is to find the best model that fits the accident severity data based on qualitative and quantitative variables. Among the models, the decision tree model performed better in the prediction, but the MLR also presented good results. It is important to highlight the concern to show the reliability of the results in the MLR. The study used chi-square, AIC, and BIC tests to select the most important variables. In addition, it shows data on model fit based on Pearson’s R2 and on the deviation calculation, which makes it possible to verify whether the parameters used in the model are relevant.
Although many types of research assess the air transport industry with machine learning, there is a lack of information concerning the judicial consequences of disorders caused to the customer and how they act against the airlines. Thus, this study seeks to highlight this issue using the models presented in the studies above to contribute to one more topic in this domain.
This section presents the methodology used in this study. The steps are based on the USELEI process described by Truong (2021) in his work on flight delays and they are modified as necessary. Figure 1 shows the steps followed. The dotted links mean that the following box is within the previous one. For example, the pre-processing step is a part of the data exploring box. The non-dotted links mean the order of the steps. For example, after understanding the problem, data sampling is performed.
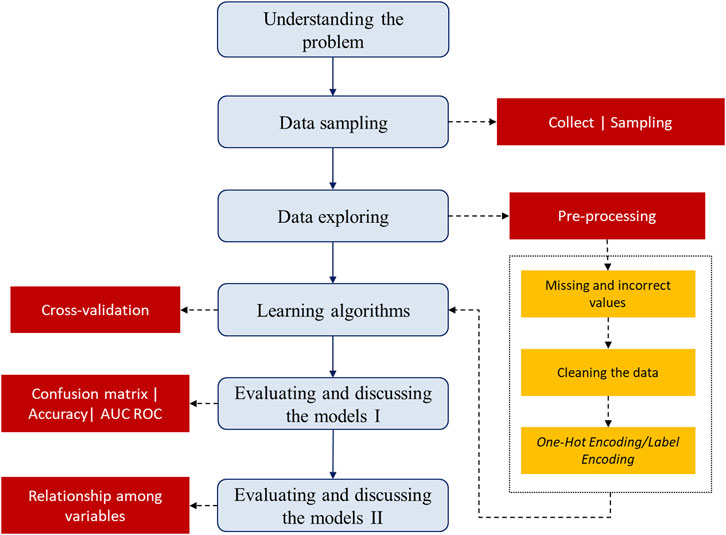
FIGURE 1. Flowchart of the steps followed in the methodology.
The number of lawsuits filed against Brazilian airlines has been a concern since the costs arising from them increased drastically. It represents an increase in expenses, both for companies and consumers. Judicialization is related to the number of lawsuits filed against airlines arising from the services they offer. Given that the data is confidential to the airlines, it is difficult to find information about this issue in the literature. Thus, identifying the relevant variables of the problem is fundamental, since it makes it possible to obtain expressive and realistic results.
The factors present in lawsuits are relevant for closing them and for the company’s knowledge. The airline attribute provides enough understanding of the frequency of complaints it receives from passengers, which may influence their final decision depending on their claims. The attributes of season and year allow airlines to understand the proportion of lawsuits over the period and assess whether the behavior of compensation values changes due to some external factor, such as the COVID-19 pandemic. In addition, it allows identifying whether there are differences between peak and low-season months. The three seasons present in the categories are vacation months (Dec-Feb and July) in Brazil. It represents peak season, more traveling, and low-season. All this information helps airlines understand their customers.
The region is an essential variable to understand the behavior of lawsuits throughout the Brazilian territory. As Brazil is a continental country with highly developed and underdeveloped regions, knowing where the highest concentrations of complaints are, helps airlines to act objectively in these places. The attributes of moral and property damages offer knowledge about what passengers’ compensation is, whether there is a higher predominance of property damages, which compensates for material losses, or whether moral damages are the most prominent in the decisions. Knowing this, some judicial patterns may have been used to close lawsuits, allowing the creation of policies between the airlines and the judiciary.
The reasons and causes are very relevant in this study, as they offer information about the main factors of customers’ complaints and the cause of the problems they reported. Knowing what is harmful to the customer allows airlines to develop ways to regain their trust and define less costly arrangements while knowing the real cause helps to develop internal programs to mitigate new problems. The decision variable shows whether the passenger’s claim was considered after closing the lawsuit.
The indemnity value corresponds to the value compensated by airlines to their customers due to complaints filed in the lawsuit. For each lawsuit, there is a judge’s interpretation and different values. This variable encompasses either legal actions in which the judge decided the final amount or arrangements signed between the parties. The values were divided into low, medium, and high categories to balance their frequency. Thus, the range values are specified as: Low ≤ R$1000,00 (United States 200); R$1000,00 (United States 200)
Table 2 shows the variables and their frequencies, and Figure 2 highlights the scenario of the number of flight operations and lawsuits in Brazil. The larger the circle in sub-figure C, the greater the number of lawsuits regarding flight operations.
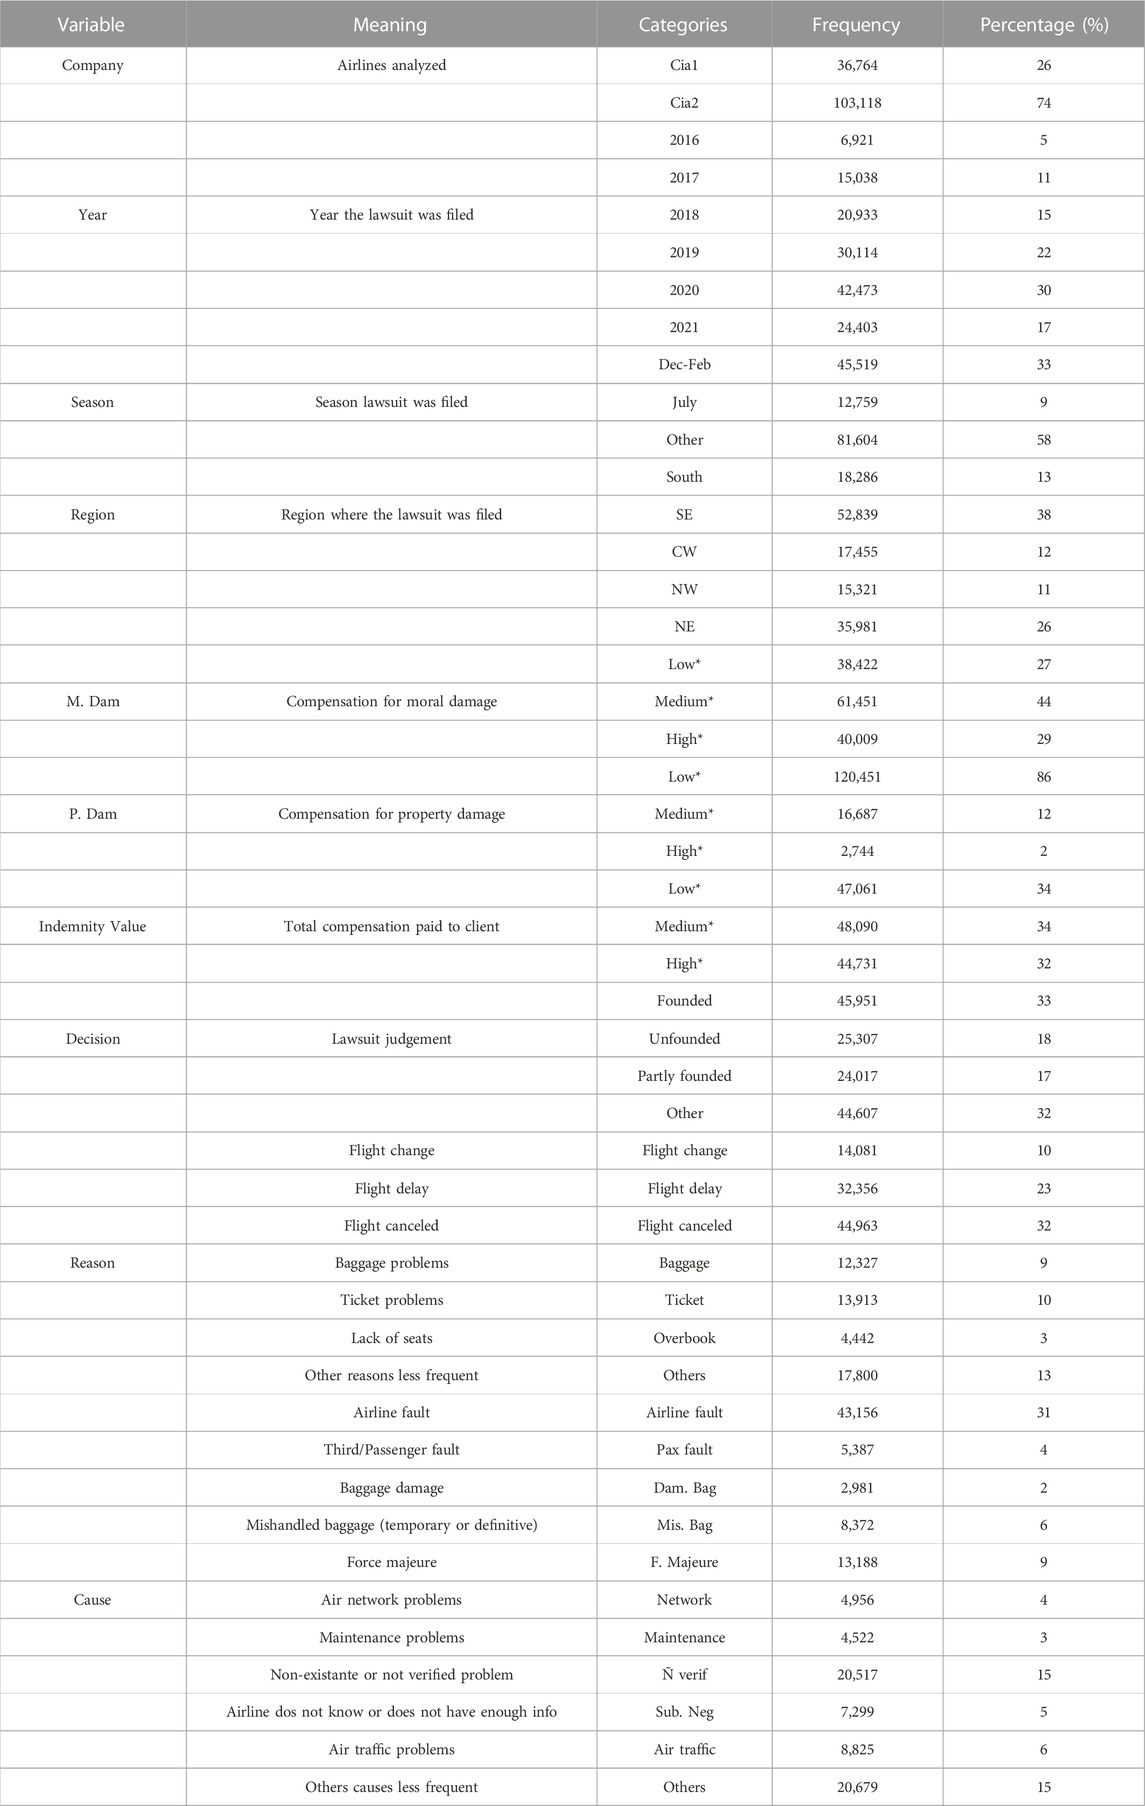
TABLE 2. Qualitative variables employed in the models.
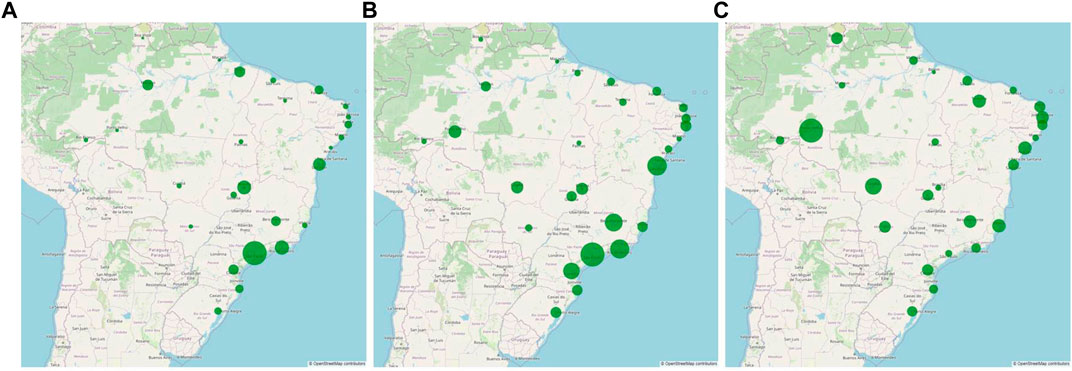
FIGURE 2. (A) Flight operations per state — (B) Lawsuits per state — (C) Standardized proportion between numbers of lawsuits and flight operations per state.
The data collected were provided by Brazilian airlines. It contains information on lawsuits filed in Brazilian cities, from January 2007 to September 2021. However, after the data pre-processing stage, this study used observations from 2016 to 2021, since there were many incomplete data before this year. The database consisted of all the relevant variables present in a Brazilian lawsuit. The sampling was based on the most important variables to the research. All the variables in the database were importants, but some of the attributes had many categories and were removed due to the complexity imposed to the algorithms.
As the data needed for the study development contains confidential information from the airlines and their customers, it is not possible to show them here. However, the variables are shown in Table 2 and explained in subsection 3.1.
Before applying the models, the pre-processing step consisted of cleaning and organizing the data of all categorical attributes. All the missing and incorrect values were removed. To clean the data, some steps were made to standardize the information. Some categories with different writing were included in others of the same meaning. White spaces were removed, misspellings were corrected, and utf-8 encoding was applied to the words.
The legal action object was divided into two attributes: reason and cause. The first one indicates the reason given by the passenger to file a lawsuit against the airline, and the second one represents the factor that led to the problem reported by the customer. For example, the customer claimed flight delay (reason), and what led to the delay was air traffic problems (cause).
After this, the database was reduced to about one hundred and ten thousand observations with balanced classes in the target attribute: about 33% for each category. The label and one-hot encoding methods were used to apply the pre-processed database to the algorithms. They transform categorical attributes into dummy variables for each attribute of the dataset, removing any numerical relationship among the variables (Miron et al., 2021). All the pre-processing stages were made in Python.
After the steps of sampling and exploring the data, the machine learning models were applied to model the problem of lawsuits based on the variables discussed. Figure 3 shows the general steps followed by applying the models. The explanation of how the techniques work is described below.
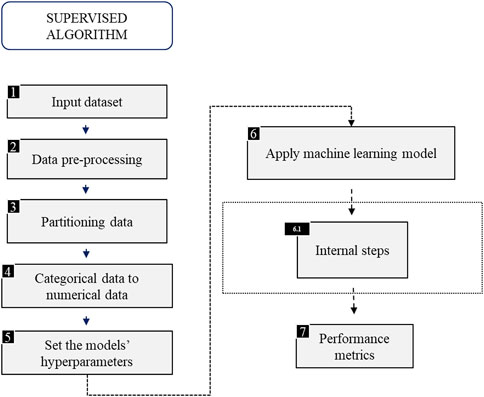
FIGURE 3. General steps followed in the learning stage.
Machine Learning tasks can be divided into predictive and descriptive. The first one aims to find a function that can predict a new example based on its input attributes. These algorithms follow the supervised learning paradigm because the output of the training example is known. The second explores a dataset and does not know the output attribute, so it follows the unsupervised learning (Carvalho et al., 2011).
The dataset used in this work is composed of categorical variables. The One Hot Encoding transformer was applied to the predictor attributes, following Rajendran et al. (2021), since there was no order between categories, and the Label Encoder transformer was applied to the target attribute. The first converts each category of an attribute into a new categorical column and assigns a binary value to this column, while the second encodes each category of the target variable with a numerical value.
The Naive Bayes Classifier is a supervised algorithm built on Bayesian reasoning applied to learning tasks where each instance is described by a set of attribute values and where the target function can assume any value from a given dataset (Mitchell, 1997). It allows us to classify an instance of information and assign the most likely value to the target, given the values of the attributes that describe it. This classifier depends on the a priori probability, P (yi), of the class to be able to calculate the a posteriori probability, P (yi/x), of this class given a set of attributes x. Using Bayes’ Theorem, the probability of an observation to be of the class yi given the set of attributes x is given by:
where P (yi) is the a priori probability, P (x/yi) is the conditional probability of the set of attributes given a class yi, and P(x) is the probability of the attribute set. As there is an assumption of independence between the attributes and as P(x) is the same for all classes, this factor can be ignored, which does not affect the relative values of their probabilities (Carvalho et al., 2011). Therefore, Eq. 1 can be written like this:
where xj is the j-th attribute of the instance.
Support Vector Machines (SVM) are a type of classifier based on Statistical Learning Theory, which helps choosing a particular classifier for a given dataset (Carvalho et al., 2011). The SVM aim is to find a Frontier that separates the classes of the dataset and classify as many examples as possible, maximizing the distance from the Frontier to the points closest to it through a hyperplane with a greater margin, that is, greater distance between the classes. The points closest to the boundary are called support vectors. The hard margin sorting is applied if all instances are required to be sorted outside the defined margin, otherwise the soft margin sorting is used, which sets a balance between keeping margins as wide as possible and limiting their breaches (Géron, 2019).
For problems that are not linearly separable, it is possible to change the type of kernel used in the SVM classifier, such as Gaussian and polynomial kernels. In multiclass datasets, there is an internal modification in the algorithm that allows to split the multiclass classification into multiple binary classifications. There are two approaches: one-vs-rest (ovr), which splits the multiclass set into several binary problems and uses a classifier in each of them, choosing the most confident model; one-vs-one (ovo), which also splits the multiclass set into several binary problems, but unlike ovr, there is a combination of the classes. In this work, the ovo method is applied.
The Random Forest Classifier (RF) is a model that combines several randomly generated decision trees into one dataset. According to Carvalho et al. (2011), it is usually trained by the bagging method, which performs random sampling of instances with replacement (Liu and Özsu, 2018). In short, the algorithm selects random samples from a specific dataset, builds a decision tree for each sample, and makes a prediction for each tree; the class with the highest number of votes among the decision trees becomes the predicted class of the model.
In addition to the ML techniques, a Multinomial Logistic Regression (MLR) model was developed. The MLR is a variation of logistic regression for dependent variables with more than two classes. For example, it seeks to identify whether there is a greater chance that the indemnity value will be high given a specific region. This model fits separate binary logistic regressions for each response category pair (Long and Freese, 2014). In this model type, the explanatory variables are invariant with outcome categories, but their parameters vary with the outcome (Gujarati, 2011). This study applies MLR to compare its predictive power against the previously discussed machine learning models. The steps for bivariate logistic regression are described below to demonstrate the process for calculating the probabilities of variables in the MLR model, and then organized for MLR. The equations below are based on the Gujarati (2011) examples.
A usual model with two explanatory variables and one dependent variable can be written as follows:
where Yi is the predicted value of example i, βi are the estimated coefficients of the intercept and of the independent variables X2 and X3, respectively, and ui is the error term. The logit model assumes that the probability distribution of the error term follows a logistic probability distribution according to Gujarati (2011), which is written in Eq. 4:
where Pi is the probability of a category, and Zi = βX + ui. This relationship is non-linear. The natural logarithm of the ratio between Pi and 1 − Pi is applied to transforms it into a linear relationship, called the odds ratio, according to the Eq. 5.
Therefore, Li (logarithm of the odds ratio) has a linear relationship with the β′s parameters and the variables X. If Li is positive, when the values of the explanatory variables increase, the chances of the category increase as well; on the other hand, if Li is negative, the odds of occurrence of the category is then reduced.
In MLR, there is more than one possible class, hence the probabilities can be given by Eq. 6:
where πij represents the probability of occurring category j in the example i. In this context, it is not possible to estimate these probabilities independently, so it becomes common practice to establish a category as a basis for comparison, as shown in Eq. 7 for category 1 as a reference:
with j = 1, … , n. This relationship indicates the chances of category j to be preferred over category 1. If the estimated coefficients are positive, then the chances of choosing category j over category one are greater.
The performance of the models was evaluated based on consolidated metrics used in researches that apply machine learning and multinomial logistic regression, according to what was reviewed in section 2.2. The notation for models I means that the performance of the machine learning techniques is presented and discussed. For this reason, the confusion matrix, the accuracy, the area under the ROC curve, and the processing time were evaluated. On the other hand, models II mean that the relationship among the attributes are discussed.
The confusion matrix shows the number of correct and incorrect predictions for each category. The rows represent the actual categories and the columns the predicted ones (Carvalho et al., 2011). It is presented as a way of evaluating the quality of the model’s prediction. The accuracy is defined as the total hit rate of the algorithm (Carvalho et al., 2011). The area under the ROC curve shows whether the classifier works better than a random choice. The models’ quality is summarized by the area under the curve (Murphy, 2012). In addition to the performance measures, tests to evidence the effects of the independent variables (likelihood-ratio test), model fit (chi-squared), and multicollinearity were performed in the MLR to provide reliability to the results.
The overall discussion of the metrics and tests is presented in sections 4 and 5. The scikit-learn in Python and the R languages were used to run the algorithms. Some of the descriptive analyses were made in Microsoft Excel and in PowerBI.
The motivation of this study is to identify how factors are related to each other and how they influence the problem in Brazil. This offers insight into how the issue behaves in Brazilian air transport and helps create measures to mitigate the problem. The results are discussed based on the significance of each variable, both practical and theoretical.
In MLR, each predictor has a category as a basis for comparison, which was chosen according to its highest frequency in the database (Long and Freese, 2014). The reference base of each variable is defined as follows [variable, reference base]: [Company, Cia2], [Season, low season], [Region, Southeast (SE)], [Moral Damage, medium value], [Material Damage, low value], [Reason, cancelled flight], [Cause, company fault], [Decision, founded], [Year, 2020].
The regressors are explained as follows: company, airlines that provided the data; season, divided into high season (December to February and July) and low season (other months); year, periods in which lawsuits were filed; regions, Brazilian regions; moral damage and property damage, indicate the indemnity range paid to the consumer for each type of damage, according to court decision; reason, indicates the reason given by the consumer to move a lawsuit against the company; cause, indicates the root factor that caused the claim by the passenger; decision, indicates what the final decision was; if found, it means that the consumer was victorious. The independent variable, Indemnity, indicates the compensation paid to the customer after a court decision or after an agreement was reached.
The model results are discussed based on the practical and statistical significance of the variables, which is what matters in the interpretation (Gujarati, 2011). Furthermore, the results are derived from a well-fitting model, as shown by the chi-squared, multicollinearity and likelihood-ratio tests. To test the model reliability and the effect of the independent variables, the likelihood-ratio test was performed between the full model, with all predictors, and the model with intercept only. The null hypothesis, H0, tests whether all the estimated coefficients of the complete model are equal to zero,
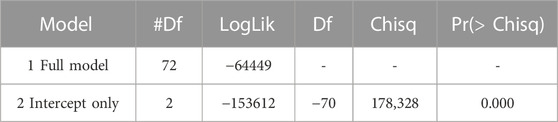
TABLE 3. Likelihood-ratio test between full and only intercept models.
In addition to the comparison between the complete model and the model with only the intercept, the probability ratio test was performed comparing the complete model with the models with one less variable. For example, the result of the line with the variable Cia is the comparison between the full model and the model with all the variables, except the variable Cia. This was made to identify whether the independent variable removed has significant effects on the model. According to the p-values, all independent variables have significant effects at 1% on the performance of the model. It means they help to explain the indemnity values. Table 4 displays the results.
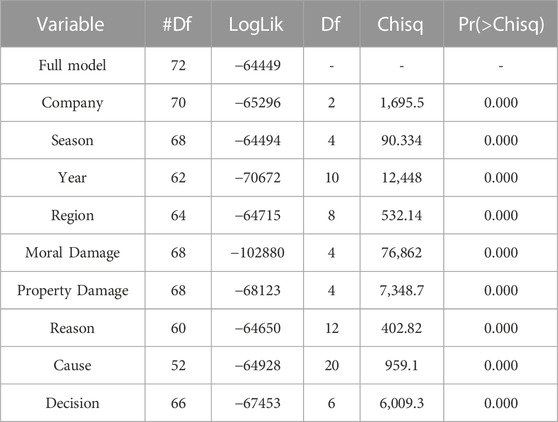
TABLE 4. Likelihood-ratio test to identify significant effects of predictor variables.
A chi-squared goodness of fit test was performed in R to know if the model fits to the data and verify if the values predicted by the multinomial regression differ from the expected values. The null hypothesis, H0, states there is no difference between observed (predicted) and expected frequencies. If H0 is rejected, it is inferred that the model has some difficulty in predicting the categories. Hence, Tables 5, 6 present the test result and frequencies, respectively. The results confirm the rejection of H0. The observed and expected frequencies have some differences since the results were significant. This fact can lead to an accurate reduction of the model and a loss in performance against ML models.

TABLE 5. Chi-squared model fit test.
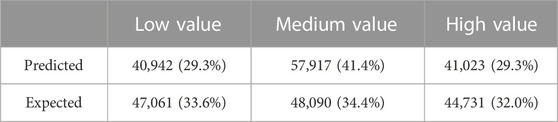
TABLE 6. Predicted and expected frequencies for each indemnity range value paid by the airlines.
Finally, variance inflation factor (VIF) is a measure to avoid problems of high correlation between the predictor attributes. This problem can cause erroneous or biased predictions. VIFs are important diagnoses of multicollinearity. VIFs greater than 10 indicate multicollinearity problems. Hence, the model results may not adequately explain the behavior of the dependent variable Montgomery et al. (2021).
For categorical variables with more than two levels, it is possible to know if there is evidence of multicollinearity between them by calculating the Generalized Variance Inflation Factor (GVIF) explained by Fox and Monette (1992) and interpreting the calculation GVIF(1/(2*df)) in the same way as the VIF is. Table 7 shows the GVIF values for the predictor attributes. All the variance inflation values are less than 10, below the threshold. It means a lack of correlation among the variables, which led to results not being biased.
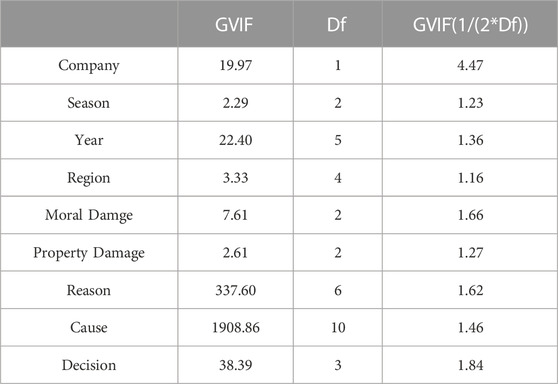
TABLE 7. GVIF values.
Given the results achieved by the tests, the model has statistical robustness. Table 8 shows the MLR results. The coefficients of each variable are shown, as well as the odds ratios, standard errors, z test, and p-values (p ≤ 0.01***, p ≤ 0.05**, p ≤ 0.1*). The influences of the variables in the compensation value are interpreted separately for better clarity. Each attribute improves the understanding in a different way. The company shows if there are big differences in the compensation values between the airlines. The season and year show when the issue is more problematic and help the airlines anticipate measures to mitigate the risks.
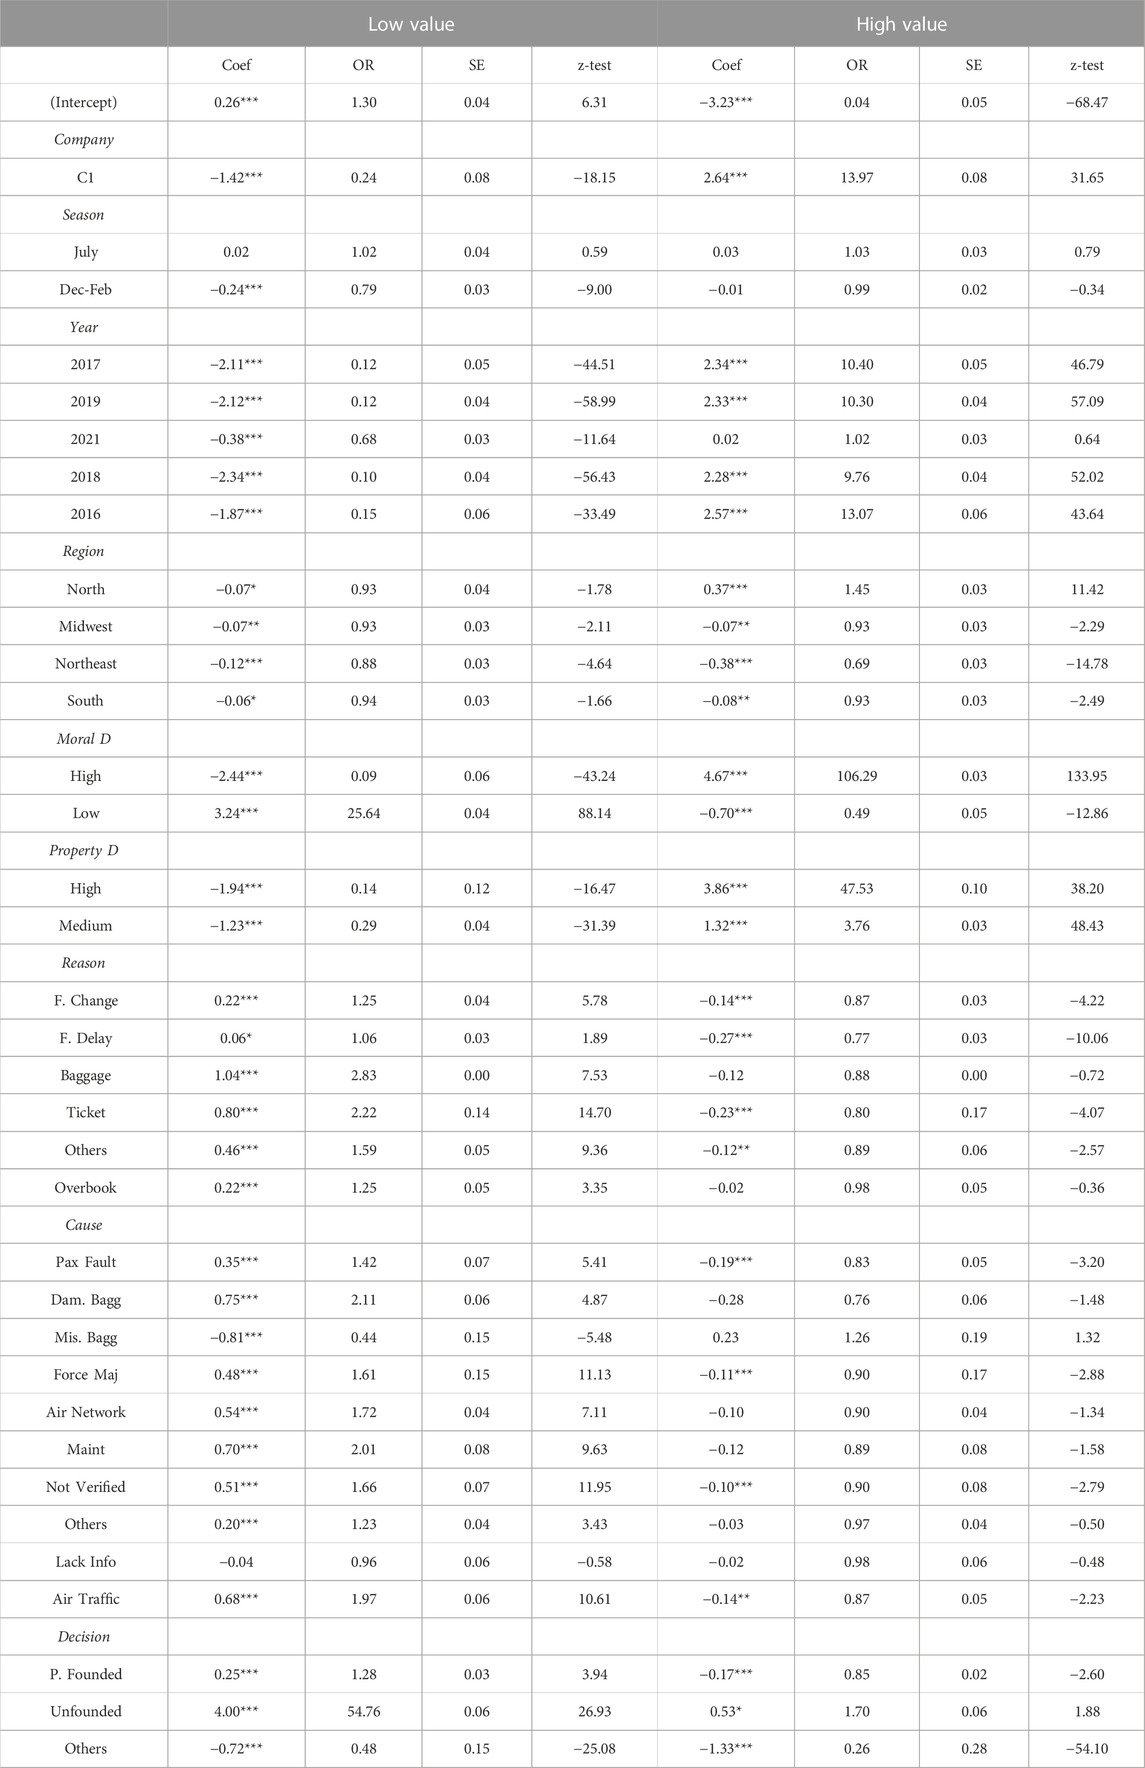
TABLE 8. MLR model results.
The region allows comprehension where the lawsuits are more present. Reason and cause highlight the main factors present in the lawsuits. The compensation values are very influenced by the moral and property damages. Knowing this contributes to establishing a flat-rated payment. The decision shows the proportion of founded lawsuits in Brazil.
The data show with significant effects that one company tends to compensate more than the other with about fourteen times more chances than to indemnify medium values. One of the companies may present another way to compensate for the disturbance generated, such as offering a travel voucher or agreement. These can reduce the final compensation, according to the judge’s interpretation or deal between the parties.
The season in which the lawsuits are filed does not seem to influence the final indemnity paid to customers since the estimated coefficients are close to zero, and only one of them is statistically significant. On this basis, it may be inferred that judicial decisions do not consider whether the problem experienced was during peak season or not. The results show there is no presence of seasonality. What matters is the type of disturbance caused, not when it occurred.
From 2016 onwards, the indemnities paid by airlines for unfavorable judgment were higher than in 2020. However, it does not mean the total monetary amount paid by companies in 2020 was lower than in other years. This information shows that, despite the number of lawsuits increasing year after year, the final compensation for an unfavorable decision may decrease. In other words, 2020 was the year with the lowest indemnities for lawsuit closure. There are more chances of having lower indemnity values than in other years.
This fact may be directly related to COVID-19 outbreak in 2020 in Brazil. As a way of helping companies in general, given the financial fragility triggered by COVID-19, the judiciary’s judgment became more parsimonious for companies, which was observed by the reduction of moral damages granted to customers. In addition, despite Law 14034/2020, which deals with emergency measures for civil aviation due to COVID-19, only coming into force in August 2020, it seems to have helped judges to subsidize their sentences based on excerpts from its text since the second quarter of 2020. Brazilian airlines specialists support this fact.
Analyzing Brazilian regions, it is evident that the compensation paid by carriers tends to remain at the same level compared to the reference region, the Southeast since the coefficients are close to zero. The exception is in the North region, whose odds increase about 1.45 times—statistically significant—to have a final indemnity of high value over a medium one.
Explaining why this occurs is a complex task. The proportion of delays and cancellations concerning total lawsuits is around 53%–58% in all regions. It excludes the hypothesis that in the North, there are more problems with delays and cancellations, which could increase the lawsuits’ indemnities. It may be expected that as the flight frequency to some regions of the North is lower than to the Southeast because of the smaller airline network, flight cancellations or delays have a bigger impact on the lives of passengers in the North. It can lead judges to sentence higher moral damage values as a way to compensate for customer reduction.
Probably, the lower number of flights to this region is because it is economically unfeasible to maintain more frequent operations there, which can be discussed with the judicial proceedings annual cost and the ticket revenues among regions’ analysis. In some northern states the lawsuit costs are higher than in others. It has a bigger effect on what is earned from ticket sales. Instead of helping the airlines, these places may harm them financially.
By investigating moral and property damages, the odds of compensating high values over medium ones when moral damages are high increase about 106 times concerning medium moral damages. The same occurs with property damages, although not to the same extent. When property damage is high, the odds of compensating high values over medium ones increase about 47 times compared with low property damage events. It said to be possible to infer that the total owed to the consumer has a growing relationship with the moral damage sentenced by the judge. It is in line with the hypothesis that the judge’s subjectivity is significant in the compensation. Furthermore, the differences among the States can be explained by different values of moral damages judged, even if the lawsuit’s issue is the same.
High odds ratios may indicate an imbalance in the target class. However, it does not occur with moral damages, since the frequency of the category medium, corresponds to 44% of the data, and high and low categories, 29%, and 27%, respectively. Regarding property damage, there is an imbalance among the categories: the low one has a frequency higher than 85% and the high one less than 1%, probably explaining why the odds ratios are high.
When exploring the factor that induces the passenger to file a lawsuit against the airline, it is noted that if there is a flight cancellation, the indemnity values are higher than any other reason. The odds of Indemnifying low values increase, and high value compensations decrease when compared with medium ones. The flight cancellation reasons are the basis for these interpretations. For example, when comparing a flight change to a flight cancellation, it is 1.25 times more likely to pay a low indemnity than a medium one for a flight change.
Another factor that has similar possibilities of causing medium-value compensation is a flight delay, with significant results at 10%. Generally, if it is a ticket problem, the chances of paying lower values are higher. It is important to note that the classifying the reasons is a complex issue. The passenger has a view of the problem, the judge may classify it as part of another, and the airline can even categorize it differently from what it is in the judicial text.
Regarding the real causes that gave rise to the reasons alleged by the passengers, the company’s fault seems to be the biggest issue. Compared to a problem caused by the airline, most of the causes tend to increase the odds of low compensation. It is the case when there are problems with maintenance (2x more chances), air traffic (1.97x more odds), air network (1.72x more odds), and force majeure (1.61x more odds).
However, when losing the luggage is the root cause of the reason alleged by the passenger in the lawsuit, the odds of paying a medium value over a low one increase about 2.27 (1/0.44) times compared to the reference base. This result is statistically significant at 1%. Therefore, when the problem is caused by factors that are not totally under the airline’s control, the court tends not to decide for high values. Although there are indemnities for factors external to the companies, their values tend to be lower.
When the lawsuit decision, which states who is victorious, is partially founded, and does not comply with all the customer complaints, the indemnities are 1.28 times more likely to be low. The odds of compensating lower values also occur for unfounded lawsuits. As might be expected, the airline should not bear any monetary loss if it wins in court. However, if during a lawsuit the customer wins, the lawsuit may be reformed as unfounded after an appeal. In these cases, there may be some expenses. In addition, since the database is a conglomeration of complex information about court decisions, it may have evidence of indemnities paid even if the process was unfounded by the litigant.
The results obtained for this variable are explained as follows. About the high odds ratio (54.76), it is important to note that of R$0.00 (United States 0.00) amounts are also in the low-value category. That is, as the vast majority of unfounded cases have zero reais indemnified, it is plausible that unfounded actions are more likely to have lower values. Another reason for this high odds ratio may be a possible imbalance of the attribute Decision. However, the frequency of each category is between 18% and 32%, which does not characterize imbalance. When the lawsuit decision has other closures (obligation to make, agreement, voucher), the odds of medium indemnities increase.
When there is no balance in asymmetric datasets between the classes to be predicted, measuring the model performance by accuracy may not be the best choice (Géron, 2019). However, in the database used in this work, the classes are balanced to have the same proportion, which makes accuracy an adequate metric to measure performance.
In addition, Tsangaratos and Ilia (2016); Nugroho and Fahmi (2017); Sagala and Wang (2018); Van der Heide et al. (2019); Yanying et al. (2019); Truong (2021) evaluated and presented other metrics in their studies: the confusion matrix, which allows to identify erroneously predicted classes, and the area under the ROC curve, which shows how well the algorithm separates the classes. They are important metrics which enable comparisons among the techniques. All metrics were evaluated with cross-validation, as advised by (Carvalho et al., 2011).
All the models used cross-validation with 5 folds. It means that the data sample was splited into 5 groups. The GridSearchCV was applied to select the best hyperparameters for each model. In the Naive Bayes model, the hyperparameter tested was alpha, Laplace smoother, of value 8. In the LinearSVC, values of penalty, loss, and regularization (C) were tested, with 12, hinge, and 2.0, respectively. In the Random Forest, the number of trees (n_estimators), quality measure (criterion), maximum tree depth (max_depth) and minimum number of divisions of a node (min_samples_split) were tested, and values of 1,000, gini, 12 and 4, respectively, were the best.
As the LinearSVC does not have a method to calculate the predicted probabilities of each class, a model calibrator for multiclass classifications was used for this purpose, called CalibratedClassifierCV, from sklearn. After this step, it was possible to obtain the value of the area under the ROC curve. The multinomial logistic regression was performed using the default parameters of the multinom function from nnet package in R. The relevel function was used to choose the baseline for each attribute. The multiclass. roc function was used to compute the area under ROC curve.
Random Forest and SVM with the one-vs-one method for multiclass classification had the best performances, 83.1% and 80.9% accuracy, respectively, followed by Naive Bayes, 76.6%. Although the field are different from other studies, these performances are similar to the results found by (Tsangaratos and Ilia, 2016; Van der Heide et al., 2019; Patgiri et al., 2020) for the models. However, they differ from the findings of Ting et al. (2011) and Wang et al. (2019) for and Yanying et al. (2019) for the SVM. It could be due to the different tuning of the hyperparameters and the dataset used. It is important to note that the NB assumes the conditional independence of the attributes, which may affect the results. Table 9 shows the values of the performance metrics for each model.
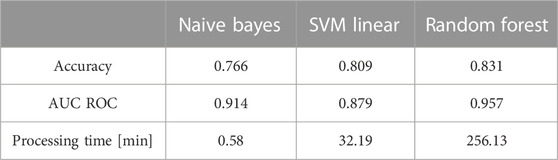
TABLE 9. Performance of Machine Learning models.
The area under the probability curve indicates how well the model can distinguish the different classes (Murphy, 2012). Among them, Random Forest was the one that presented the best ability to differentiate them. The Naive Bayes classifier had a value of 91.4%, similar to the results of Tsangaratos and Ilia (2016) that indicate its power for classification, despite the fact it did not have great accuracy.
The SVM model was the worst concerning the area under the ROC curve. Although it was more accurate than NB, it does not differentiate well one class from another when making predictions. Regarding processing times, an important factor in data analysis, NB was the one that processed in the shortest time because of its simplicity compared to other techniques, followed by SVM and RF, which is in agreement with previous work of Ting et al. (2011), Tsangaratos and Ilia (2016), and Lei et al. (2017). The characteristics of the computer processor used were: DELL GAMER, 16GB RAM, Intel(R) Core(TM) i7-7700HQ CPU 2.80GHz, using all cores available.
Another way to assess model quality is to display the distribution of data into actual classes and predicted classes. In Table 10, the confusion matrix presents a way to evaluate the performance of a classifier by allowing which classes were correctly classified (Géron, 2019). Therefore, the information processed in this work shows that the Random Forest model can more accurately predict the classes of indemnities in the medium and low classes, and a greater prediction error in the class of high values. In turn, the SVM was able to better predict the class of low values, with a greater error in the medium values category.
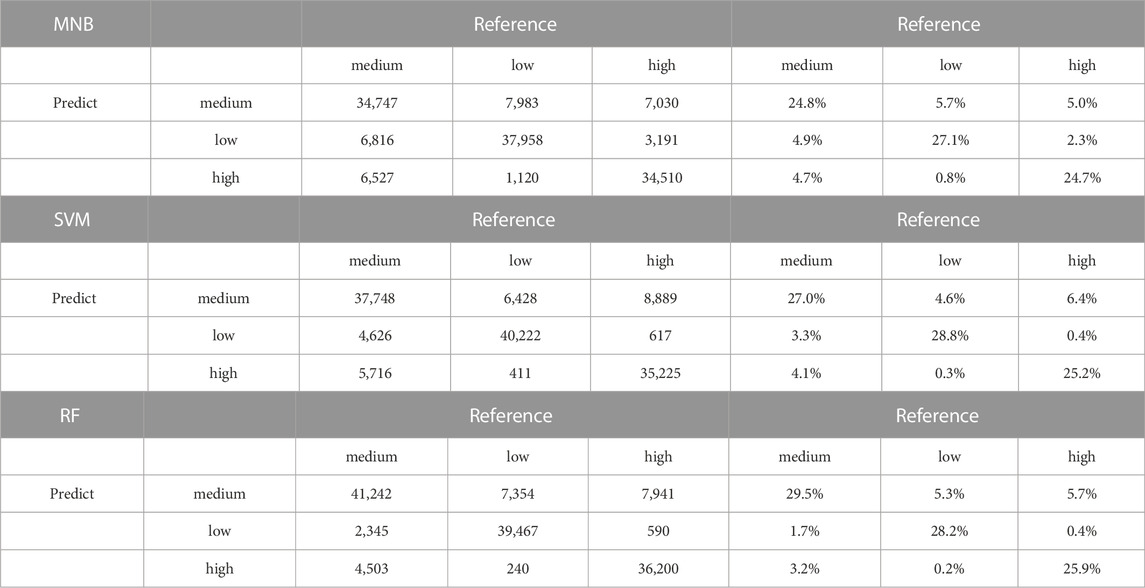
TABLE 10. Confusion Matrices of the Machine Learning models.
It is worth noting that the problem of lawsuits in air transport is complex, as it depends on several subjective factors, such as the judge’s arguments in the sentences and specific cases of passengers, who may have different compensation values. Hence, no method achieves perfect accuracy given the peculiarity of the problem.
As one of the objectives of this work is to compare machine learning models with the multinomial logistic regression model, it is necessary to have relevant metrics for the comparison. Therefore, they were chosen based on the literature of Christodoulou et al. (2019), Feng et al. (2019) and Itoo et al. (2021). The accuracy and area under the ROC curve of multi-class models are used. Tables 11, 12 display, the metrics and the confusion matrix, respectively.

TABLE 11. Performance of Multinomial Logistic Regression model.
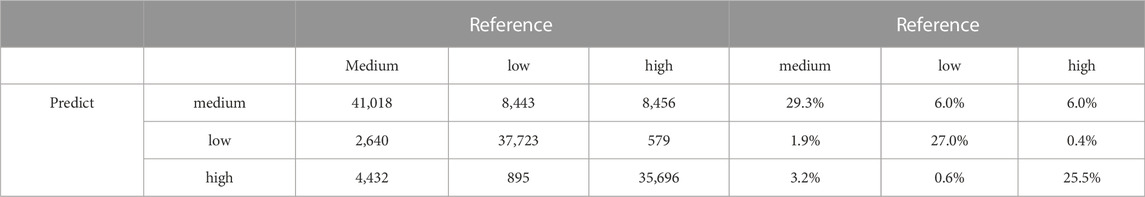
TABLE 12. Confusion matrix of the multinomial logistic regression.
The performance achieved by the Multinomial Logistic Regression model has values comparable to the RF, SVM and NB models in terms of accuracy, AUC ROC, and the confusion matrix. MLR performed better than SVM and NB, with results close to the RF. According to a previous study from Christodoulou et al. (2019) for the clinical area, the results of this work also show that the performance of the machine learning models does not prove to be superior to the performance of the multinomial logistic regression model. It is relevant because the MLR model can be applied in different types of dataset with a great performance and less computational power.
Although some ML models are more accurate, such as Gradient Boosting and some SVM, logistic regression models have a performance comparable to various ML techniques and have good predictive power, according to Wang and Ross (2018) and Feng et al. (2019). In contrast, the literature points out to a superior performance of machine learning models over logistic regression, such as the work of Rajendran et al. (2021), which is based on the metrics of precision, recall, and F1-score. Hence, it can be inferred there is no the best model since it depends on the dataset of the problem addressed.
As this model is developed and supported by statistical tests discussed in Section 6, this work reliably evidences its relevance in the analysis of databases with categorical variables. Thus, it seems that the factor that most influences the final indemnity is moral damage. The reasons given by the passengers and the causes of the problems do not seem to be as impactful as moral damages. The North region presents evidence that raises the values of court’s orders, and the year 2020 exposes the consequences of the pandemic in the case closure, with lower compensations and more moderate sentences.
This work addressed the issue of judicialization in air transport. Machine learning and multinomial logistic regression approaches were used on lawsuit data from the Brazilian airlines. According to the methodology used and described in Figure 1, it was possible to understand the problem and the execution of each necessary step to obtain the results.
Research questions are adequately answered by analyzing predictive models and discussing the relationships among the variables. The objectives were also successfully achieved since the results considered the opinion of experts in the air transport industry and have statistical robustness, which confirms the hypotheses raised for each variable and guarantees the reliability of the results.
Regarding the machine learning models, the Random Forest had the best performance, with similar values to the Multinomial Logistic Regression. Despite not being the best technique, MLR proved to be important in classifying categorical datasets. The SVM and NB techniques had a lower performance. Although the RF was the most accurate, its processing time was very high, which can be a disadvantage if the computational power is limited. MLR had the best cost-benefit ratio.
The MLR provided fundamental inferences about the relationship among the variables. The conclusion is that airlines compensate differently. The season when the service failures occur does not influence the indemnity values. Although the year 2020 had a high judicial demand, it was the year that presented the lowest compensation value. This fact may be related to the COVID-19 pandemic.
The value of moral damages is what most impacts the final compensation. The subjectivity in the case interpretation is an aspect that can be further discussed since the judgment parameters may vary from judge and place. The North region showed a different behavior from the rest of Brazil, much influenced by the State of Rondônia, which has the highest indemnities. It is mainly due to the judge’s verdict since the reasons and causes of service failures in that State are similar to the others. When the client does not have his entire claim for compensation granted, that is, part of the process is unfounded, the compensation paid by the airlines tends to be lower, as expected.
It is important to clarify the limitations of this work. The first one was the difficulty in comparing the results obtained with others in the literature since the topic is little studied and has little academic information. It was one of the reasons for consulting specialists in commercial aviation to anchor the results with practice. In addition, due to limitations contained in the Brazilian General Data Protection Law (LGPD), variables with passenger information could not be acquired, which can impair the performance of the algorithms and prevent fundamental interpretations between customers and indemnity.
Another limitation regards the difference in the classification of reasons and causes attributes by each airline, which can influence the algorithm performance. Similar events may have been interpreted differently when creating the database. The pre-processing step described in Figure 1 attempted to standardize this issue as much as possible. Finally, the pandemic period may have changed the judges’ critique, increasing differences and creating inconsistencies during the analyzed period.
In future works, it is proposed to build models that can estimate the probability of a client filing a lawsuit and its possible indemnity value. It may help airlines create more efficient strategies to solve the problems or reduce their financial impacts. Applying other machine learning techniques, such as neural networks, may improve prediction accuracy. Finally, analyzing shorter periods and the airlines separately can reach more consistent results. This work contributes with the scientific and technological literature by providing discussions on a fundamental issue in the Brazilian air market, presenting relevant comparisons between predictive models, and introducing academic knowledge concerning the problem.
The datasets presented in this article are not readily available because the dataset was obtained from the Brazilian airlines, and it is confidential. It is not possible to share them. Requests to access the datasets should be directed to GT, Z2FicmllbG90NEBnbWFpbC5jb20=.
GT was the principal investigator; he led the written part, application of the models and interpretation of the results; VC led the data acquisition contacts and was responsible to analyzed the robustness of the model; MG was responsible to review the written article and to propose the models to analyze the issue; All coauthors contributed to discussion and manuscript editing. All authors reviewed the results and approved the final version of the manuscript.
We acknowledge the airlines that offered us the data about the legal action in the Brazilian air market and ABEAR for mediating the communication.
The authors declare that the research was conducted in the absence of any commercial or financial relationships that could be construed as a potential conflict of interest.
All claims expressed in this article are solely those of the authors and do not necessarily represent those of their affiliated organizations, or those of the publisher, the editors and the reviewers. Any product that may be evaluated in this article, or claim that may be made by its manufacturer, is not guaranteed or endorsed by the publisher.
1https://www.gov.br/anac/pt-br/assuntos/dados-e-estatisticas/mercado-do-transporte-aereo/painel-de-indicadores-do-transporte-aereo/painel-de-indicadores-do-transporte-aereo-2020.
2https://curia.europa.eu/jcms/upload/docs/application/pdf/2019-05/qd-04-17-650-en-n.pdf.
Alaoui, S. S., Farhaoui, Y., and Aksasse, B. (2022). Hate speech detection using text mining and machine learning. Int. J. Decis. Support Syst. Technol. (IJDSST) 14, 1–20. doi:10.4018/IJDSST.286680
Arora, S. D., and Mathur, S. (2020). Effect of airline choice and temporality on flight delays. J. Air Transp. Manag. 86, 101813. doi:10.1016/j.jairtraman.2020.101813
Bokaba, T., Doorsamy, W., and Paul, B. S. (2022). Comparative study of machine learning classifiers for modelling road traffic accidents. Appl. Sci. 12, 828. doi:10.3390/app12020828
Carvalho, A., Faceli, K., Lorena, A., and Gama, J. (2011). Inteligência Artificial - Uma abordagem de aprendizado de máquina. Rio de Janeiro: LTC.
Christodoulou, E., Ma, J., Collins, G. S., Steyerberg, E. W., Verbakel, J. Y., and Van Calster, B. (2019). A systematic review shows no performance benefit of machine learning over logistic regression for clinical prediction models. J. Clin. Epidemiol. 110, 12–22. doi:10.1016/j.jclinepi.2019.02.004
de Oliveira, M., Eufrásio, A. B. R., Guterres, M. X., Murça, M. C. R., and de Arantes Gomes, R. (2021). Analysis of airport weather impact on on-time performance of arrival flights for the brazilian domestic air transportation system. J. Air Transp. Manag. 91, 101974. doi:10.1016/j.jairtraman.2020.101974
Deb, S., and Gao, X.-Z. (2022). Prediction of charging demand of electric city buses of helsinki, Finland by random forest. Energies 15, 3679. doi:10.3390/en15103679
Feng, J.-z., Wang, Y., Peng, J., Sun, M.-w., Zeng, J., and Jiang, H. (2019). Comparison between logistic regression and machine learning algorithms on survival prediction of traumatic brain injuries. J. Crit. care 54, 110–116. doi:10.1016/j.jcrc.2019.08.010
Fox, J., and Monette, G. (1992). Generalized collinearity diagnostics. J. Am. Stat. Assoc. 87, 178–183. doi:10.1080/01621459.1992.10475190
Freitas, P. T., Silva, L. M., Nascimento, M. V., and Borille, G. M. (2021). Passenger profile and its effects on satisfaction level in food and beverage establishments: Case study of major brazilian airports. Case Stud. Transp. Policy 9, 1219–1224. doi:10.1016/j.cstp.2021.06.009
Gasparotto, L. S., Pacheco, N. A., Basso, K., Corte, V. F. D., Rabello, G. C., and Gallon, S. (2018). The role of regulation and financial compensation on trust recovery. Australas. Mark. J. 26, 10–16. doi:10.1016/j.ausmj.2018.01.002
Géron, A. (2019). Mãos à Obra: Aprendizado de Máquina com Scikit-Learn & TensorFlow. 1. Rio de Janeiro: Alta Books.
Hipp, C. (2019). “The enforcement of air passenger rights: An analysis and comparison of claims management companies and recently established conciliation bodies,” in Eurasian business perspectives (Berlin: Springer), 341–353.
Itoo, F., Meenakshi, , , and Singh, S. (2021). Comparison and analysis of logistic regression, naïve bayes and knn machine learning algorithms for credit card fraud detection. Int. J. Inf. Technol. 13, 1503–1511. doi:10.1007/s41870-020-00430-y
Kumar, K., and Pande, B. (2022). Air pollution prediction with machine learning: A case study of indian cities. Int. J. Environ. Sci. Technol., 1–16. doi:10.1007/s13762-022-04241-5
Lei, M., Ge, J., Li, Z., Li, C., Zhou, Y., Zhou, X., et al. (2017). “Automatically classify Chinese judgment documents utilizing machine learning algorithms,” in International conference on database systems for advanced applications (Berlin: Springer), 3–17. doi:10.1007/978-3-319-55705-2_1
Lieshout, R., Malighetti, P., Redondi, R., and Burghouwt, G. (2016). The competitive landscape of air transport in Europe. J. Transp. Geogr. 50, 68–82. doi:10.1016/j.jtrangeo.2015.06.001
Long, J. S., and Freese, J. (2014). Regression models for categorical dependent variables using Stata. 3, Texas: Stata Press.
Lucini, F. R., Tonetto, L. M., Fogliatto, F. S., and Anzanello, M. J. (2020). Text mining approach to explore dimensions of airline customer satisfaction using online customer reviews. J. Air Transp. Manag. 83, 101760. doi:10.1016/j.jairtraman.2019.101760
Mazaheri, S., and Basiri, Z. (2018). Civil liability of air carrier in delays. J. Humanit. Insights 2, 67–75. doi:10.22034/JHI.2018.64941
Miron, M., Tolan, S., Gómez, E., and Castillo, C. (2021). Evaluating causes of algorithmic bias in juvenile criminal recidivism. Artif. Intell. Law 29, 111–147. doi:10.1007/s10506-020-09268-y
Montgomery, D. C., Peck, E. A., and Vining, G. G. (2021). Introduction to linear regression analysis. John Wiley & Sons.
Negri, N. A. R., Borille, G. M. R., and Falcão, V. A. (2019). Acceptance of biometric technology in airport check-in. J. Air Transp. Manag. 81, 101720. doi:10.1016/j.jairtraman.2019.101720
Nugroho, A., Fahmi, R. A., and Ali Fahmi, R. (2017). On-time flight departure prediction system using naive bayes classification method (case study: Xyz airline). Int. J. Comput. Trends Technol. 54, 4–10. doi:10.14445/22312803/IJCTT-V54P102
Patgiri, R., Hussain, S., and Nongmeikapam, A. (2020). Empirical study on airline delay analysis and prediction. arXiv [Preprint] doi:10.48550/arXiv.2002.10254
Rajendran, S., Srinivas, S., and Grimshaw, T. (2021). Predicting demand for air taxi urban aviation services using machine learning algorithms. J. Air Transp. Manag. 92, 102043. doi:10.1016/j.jairtraman.2021.102043
Rrmoku, K., Selimi, B., and Ahmedi, L. (2022). Application of trust in recommender systems—Utilizing naive bayes classifier. Computation 10, 6. doi:10.3390/computation10010006
Sabo, I. C., Dal Pont, T. R., Wilton, P. E. V., Rover, A. J., and Hübner, J. F. (2021). Clustering of brazilian legal judgments about failures in air transport service: An evaluation of different approaches. Artif. Intell. Law 1, 21–57. doi:10.1007/s10506-021-09287-3
Sagala, N. T. M., and Wang, J.-H. (2018). “A comparative study for classification on different domain,” in Proceedings of the 2018 10th International Conference on Machine Learning and Computing, Nashik, 13 Jan 2015, 1. doi:10.1145/3195106.3195129
Savolainen, P. T., Mannering, F. L., Lord, D., and Quddus, M. A. (2011). The statistical analysis of highway crash-injury severities: A review and assessment of methodological alternatives. Accid. Analysis Prev. 43, 1666–1676. doi:10.1016/j.aap.2011.03.025
Schmalz, U., Ringbeck, J., and Spinler, S. (2021). Door-to-door air travel: Exploring trends in corporate reports using text classification models. Technol. Forecast. Soc. Change 170, 120865. doi:10.1016/j.techfore.2021.120865
Sezgen, E., Mason, K. J., and Mayer, R. (2019). Voice of airline passenger: A text mining approach to understand customer satisfaction. J. Air Transp. Manag. 77, 65–74. doi:10.1016/j.jairtraman.2019.04.001
Shiran, G., Imaninasab, R., and Khayamim, R. (2021). Crash severity analysis of highways based on multinomial logistic regression model, decision tree techniques, and artificial neural network: A modeling comparison. Sustainability 13, 5670. doi:10.3390/su13105670
Sipos, A. (2021). The liability of the air carrier for damages and the state of health of the air passenger.: Accidents and diseases (Covid-19). Hung. J. Leg. Stud. 61, 85–112. doi:10.1556/2052.2020.00002
Ting, S. L., Ip, W. H., and Tsang, A. H. C. (2011). Is naive bayes a good classifier for document classification. Int. J. Softw. Eng. Its Appl. 5, 37–46.
Truong, D., and Choi, W. (2020). Using machine learning algorithms to predict the risk of small unmanned aircraft system violations in the national airspace system. J. Air Transp. Manag. 86, 101822. doi:10.1016/j.jairtraman.2020.101822
Truong, D. (2021). Using causal machine learning for predicting the risk of flight delays in air transportation. J. Air Transp. Manag. 91, 101993. doi:10.1016/j.jairtraman.2020.101993
Tsangaratos, P., and Ilia, I. (2016). Comparison of a logistic regression and naïve bayes classifier in landslide susceptibility assessments: The influence of models complexity and training dataset size. Catena 145, 164–179. doi:10.1016/j.catena.2016.06.004
Van der Heide, E., Veerkamp, R., Van Pelt, M., Kamphuis, C., Athanasiadis, I., and Ducro, B. (2019). Comparing regression, naive bayes, and random forest methods in the prediction of individual survival to second lactation in holstein cattle. J. dairy Sci. 102, 9409–9421. doi:10.3168/jds.2019-16295
Wang, F., and Ross, C. L. (2018). Machine learning travel mode choices: Comparing the performance of an extreme gradient boosting model with a multinomial logit model. Transp. Res. Rec. 2672, 35–45. doi:10.1177/0361198118773556
Wang, J., and Herricks, E. E. (2012). Risk assessment of bird–aircraft strikes at commercial airports: Submodel development. Transp. Res. Rec. 2266, 78–84. doi:10.3141/2266-09
Wang, L. (2015). Application of laws of prc concerning air transport lawsuits: What should we do in the future? Beijing L. Rev. 6, 125–132. doi:10.4236/blr.2015.62013
Wang, W., Chu, X., Jiang, Z., and Liu, L. (2019). “Classification of ship trajectories by using naive bayesian algorithm,” in 2019 5th International Conference on Transportation Information and Safety (ICTIS), Liverpool, 14-17 July 2019 (IEEE), 466–470. doi:10.1109/ICTIS.2019.8883562
Xu, X., and Li, Y. (2016). Examining key drivers of traveler dissatisfaction with airline service failures: A text mining approach. J. Supply Chain Operations Manag. 14, 30–50.
Yadav, D. K., and Goriet, M. O. (2022). An illustrative evaluation of external factors that affect performance of an airline. J. Aerosp. Technol. Manag. 14. doi:10.1590/jatm.v14.1253
Keywords: air transport, airline, lawsuit, machine learning, multinomial logistic regression
Citation: Torres GdO, Guterres MX and Celestino VRR (2023) Legal actions in Brazilian air transport: A machine learning and multinomial logistic regression analysis. Front. Future Transp. 4:1070533. doi: 10.3389/ffutr.2023.1070533
Received: 15 October 2022; Accepted: 17 January 2023;
Published: 17 April 2023.
Edited by:
Gustavo Alonso, Polytechnic University of Madrid, SpainReviewed by:
Fernando Gomez Comendador, Polytechnic University of Madrid, SpainCopyright © 2023 Torres, Guterres and Celestino. This is an open-access article distributed under the terms of the Creative Commons Attribution License (CC BY). The use, distribution or reproduction in other forums is permitted, provided the original author(s) and the copyright owner(s) are credited and that the original publication in this journal is cited, in accordance with accepted academic practice. No use, distribution or reproduction is permitted which does not comply with these terms.
*Correspondence: Gabriel de Oliveira Torres, Z2FicmllbG90NEBnbWFpbC5jb20mI3gwMjAwYTs=
Disclaimer: All claims expressed in this article are solely those of the authors and do not necessarily represent those of their affiliated organizations, or those of the publisher, the editors and the reviewers. Any product that may be evaluated in this article or claim that may be made by its manufacturer is not guaranteed or endorsed by the publisher.
Research integrity at Frontiers
Learn more about the work of our research integrity team to safeguard the quality of each article we publish.