 Maria Boile
 Sotirios Theofanis3
 Vasiliki-Maria Perra
 Xenophon Kitsios
- 1Laboratory of Quantitative Analysis in Shipping, Department of Maritime Studies, University of Piraeus, Piraeus, Greece
- 2Hellenic Institute of Transport, Centre for Research and Technology Hellas, Athens, Greece
- 3CITY College, University of York Europe Campus, Thessaloniki, Greece
Coastal shipping plays a key role in insular regions, ensuring economic, territorial and societal cohesion at national and regional level and supporting the transport of passengers, vehicles and goods. For Greece, passenger maritime transport is essential, considering its lengthy coastline (about 15,000 km) and its numerous islands, scattered within its territorial waters. This paper investigates demand for passenger maritime transport of the Greek coastal shipping before and during the pandemic through a spatial assessment based mainly on primary data provided by the responsible National Authority, thus highlighting issues to be addressed through policy and decision making. Considering that Covid-19 led to significant disruption of transport services, especially in ferry operations, demand for passenger maritime transport was almost halved during 2020. However, the supply services provided are mostly determined by the terms of the public service obligations (PSOs) that are announced by the responsible National Authority and which had to be further enhanced during the pandemic for sufficiently covering the corresponding demand. As such, the paper aims to support policy and decision making, and the implementation of relevant strategies and measures so as to maintain the proper level of services provided in the sector during emergencies.
1 Introduction
Coastal shipping is fundamental for achieving economic, territorial and societal cohesion especially for insular regions. Accessibility and connectivity among islands and between them and the mainland often depend strongly, or even solely, on coastal shipping, which accommodates the transport of passengers, vehicles, and goods. Coastal shipping faces several challenges that affect its ability to achieve seamless, efficient, and high-quality operations. These can be attributed to several factors, which include local conditions, such as geographic dispersion, weather, and seasonality, as well as global socio-economic phenomena such as economic recession, the COVID-19 pandemic, the war in Ukraine and the global energy crisis. Greece has an extensive insular region with several thousands of islands (about 6,000 islands and islets), over 200 of which are inhabited. These islands are home to 15.1% of the total population of the country, according to the 2011 census. The coastline reaches 15,000 km and the islands cover 18.7% of the total terrestrial area (University of Piraeus Research Center, 2021). Their spatial dispersion, along with the small size and great distance of several of them from the mainland, highlights the importance of and their dependence on coastal shipping for ensuring accessibility and addressing issues related to their remoteness and isolation. The economies of the islands vary depending on the allocation, intensity, productivity and growth potential of their activities. Marine-related activities with high concentration in island regions, including shipping, tourism, fishing and others, produce at least 25% of the national GDP, which highlights the importance of insular regions for the Greek economy.
At the same time, coastal shipping supports the insular economies and specifically their primary and secondary sectors (i.e., agriculture, fisheries, products’ processing, etc.) and tourism (Working group for coastal shipping Hellenic Chambers and Business Transport Association, Association of Passengers Shipping Businesses and Laboratory in Research in Shipping and Port Management, 2014; XRTC Business Consultants, 2020; Foundation for Economic and Industrial Research, 2021). It is noted that in 2019 coastal shipping accounted for 7.4% of the national GDP and provided 332 thousand direct, indirect and induced jobs, contributing approximately 8.5% of the national employment (Foundation for Economic and Industrial Research, 2021). Apart from that, the islands’ limited natural resources and their dependence on the import of raw materials and supplies, make them significantly sensitive to market changes and intensifies the need for maritime transport for their supply.
The COVID-19 outbreak caused severe disruption to almost all economic activities at a global level, also affecting the maritime transport sector. According to the European Maritime Safety Agency (2021), a 10.2% decline in the number of ship calls at EU ports was reported to SafeSeaNet in 2020 compared to 2019. The most significant downturn was recorded during the second quarter of 2020 (25.6% in comparison with the respective quarter of 2019), while ship calls during the third and fourth quarter were less affected. According to the same report, a significant decrease in the number of ship calls was observed in relation to the highly affected cruise and passenger coastal ship traffic. This decrease, for some European countries, was above 20% between 2019 and 2020.
In Greece the most affected sectors by the health crisis were tourism, air and maritime transport, and construction (Deloitte, 2021). According to ELSTAT’s relevant data (Hellenic Statistical Authority, 2021), it is estimated that the national GDP declined by almost 9.8% at current market prices in 2020 (compared to 2019), although estimations presented a gradual recovery for 2021 with an increase of 9.8% (compared to 2020). Travel restrictions were in force in Greece until February 2022, significantly restraining transport and tourism activities. Based on a recent study (XRTC Business Consultants, 2022), in 2019 Greece accommodated around 31 million tourists, while the respective numbers for 2020 and 2021 were by far less, reaching 7.4 million and 14.7 million tourists respectively. A gradual recovery has already been observed in 2022, although international conditions such as the war in Ukraine and the energy crisis create significant uncertainties.
Within this context, this paper presents the authors’ perspective stemming from the analysis of the trends in demand and supply of domestic passenger shipping in the Greek insular regions before and during the pandemic (2018—2021), supported by a first attempt of collectively gathering corresponding original data. All data collected have been processed (i.e., digitalization, data transformation, etc.) and analyzed through a Geographic Information System (GIS) based model, considering both their spatial and temporal characteristics. The following section (Section 2) presents the distribution of demand for maritime passenger transport in Greece, based on relevant information gathered from the literature as well as from the analysis of relevant data collected by the authors. Section 3 presents data related to the supply of maritime passenger services, while Section 4 concludes pointing out the issues that arise from these trends in demand and supply of maritime passenger transport and providing policy insights. The paper highlights the importance of the coastal shipping sector in supporting economic, territorial and social cohesion in Greece, especially in its insular regions and points out to issues that need to be addressed by policy and decision makers at national but also at European level.
2 Demand for passenger maritime transport
The demand for passenger maritime transportation in Greece comprises both the demand stemming from the requirement to cover basic transport needs of locals and island residents, as well as demand associated mainly with domestic and international tourist activities. In the first case the demand is deemed to be inelastic, meaning that it is more or less stable and unaffected by any changes in its determinants. In the latter case, the demand is considered to be elastic, meaning that it is influenced by several factors, to which travelers’ preferences for using the specific mode of transport are sensitive. Such factors consist of the quality of the provided services (i.e., the regularity and density of itineraries, port services, digital services, travel duration, etc.), the quality of infrastructure and transport modes (i.e., type of vessel, port infrastructure, connection with road transport networks, etc.), the access to alternative modes of transport (i.e., air transport), the fare price in comparison to alternative transport modes. Other factors that affect demand include the demographic characteristics and the economic activities (i.e., tourism, the primary sector, freight transportation, etc.) that are served by the transport system. Demand for passenger maritime transportation also varies with time and space thus creating spatial zones with different density of demand as well as seasonality in passenger traffic. (Center for Research and Technology Hellas, 2021).
More specifically, for the insular regions, demand for coastal shipping is determined by (a) demographic and economic factors (i.e., national and international GDP and income in current market prices); (b) the size of the islands’ primary sector and specifically the volume of transported goods; (c) the national road transport network, which at some cases complements ferry activities; (d) the quality of the provided services, considering the ratio between fare prices and the quality of those services especially when alternative modes (i.e., air transportation) are accessible and affordable; (e) the available port infrastructures, the quality of their services and their accessibility; (f) the fare price; and (g) tourism in terms of tourists’ arrivals considering both foreign and domestic tourists (Bello et al., 2016; Deloitte, 2021). Among the economic factors that can be considered are GDP and income of both the study area and other countries, from which a great proportion of tourists originate (Bello et al., 2016). Other factors can also be considered such as natural disasters, crisis (i.e., global economic recession), fuel prices, investments in new ferries, and ferry technology (Bello et al., 2016; Aivazidou and Politis, 2021).
Additionally, the combination of spatial and temporal factors into the analysis of the maritime transport system also facilitates the better understanding of the system and its components (i.e., infrastructures, vessels, passengers, etc.) as well as how they change during time (Loidl et al., 2016). According to the literature (Berglund, 2001; Burgess and Nielsen, 2008; Korzhenevych, 2012; Ocalir-Akunal, 2016), integrating transport data into GIS, exploiting their spatial dimension, provides several benefits since the latter presents a good performance in data management and their quality, model evaluation, forecasts and scenarios generation and the presentation and visualization of results. To this end, GIS can support the aforementioned procedures on relevant data, allowing the generation of appropriate geoprocessing frameworks that can be advanced to efficient decision support systems (Burgess and Nielsen, 2008; Ocalir-Akunal, 2016).
Passenger maritime transport demand for trips to, from, and between islands, during the period from 2018 till 2021 is derived based on data available from various sources, including data provided by the Greek central government, local authorities, and other public bodies (i.e., data. gov.gr). In 2018, Greek coastal shipping transported more than 23 million passengers within Greece, while in 2019 an increase by almost 10% was observed. In 2020, the number of transported passengers declined by 53%, as a result of the pandemic. This decrease is mainly the result of travel restrictions imposed and the concerns of travelers themselves, which affected the demand side. On the supply side, although social distancing rules were implemented, reducing the carrying capacity of vessels, and service frequencies were adjusted to a certain extent, the required minimum level of service was provided, thus not restricting travel demand. An increase of around 39% was observed in the number of passengers in 2021, as compared to 2020, indicating a gradual recovery. Island residents contributed about 24% to the total number of trips in 2018 and 2019, while for the subsequent years (2020—2021) their share increased to about 54% on average, indicating a significant decrease in tourist sector arrivals. Likewise, the number of transported vehicles, including cars and buses, followed the same trends. In 2018, more than three million cars and 52,000 buses embarked on and disembarked from coastal shipping vessels. These numbers increased by approximately 14% and 10% respectively in 2019, while they decreased in 2020, the first year of the pandemic (by 40% and 65% respectively, compared to 2019). For 2021 a gradual recovery is observed, following an increase of 19% and 32% respectively, compared to the previous year.
Figure 1 presents the incoming traffic per region and per quarter for 2019 and 2020, for all passenger and vehicle traffic.
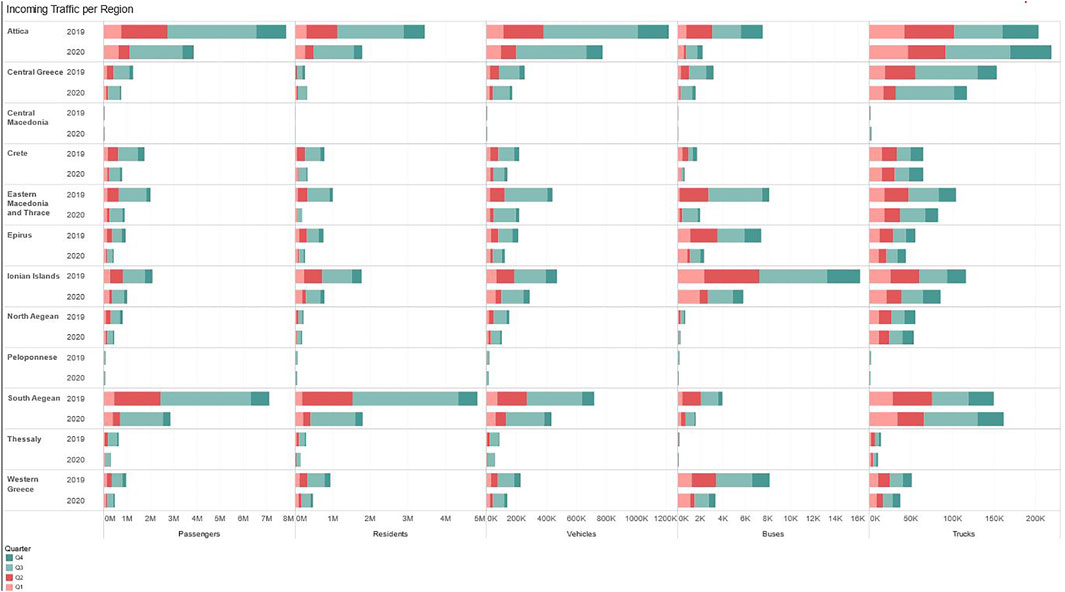
FIGURE 1. Incoming passenger and vehicle traffic per region per quarter (2019 and 2020).
In Greece there are 12 regions bordering a sea. The largest volume of traffic is observed in the Region of Attica, where Piraeus - the largest port of the country and the main hub for coastal shipping - is located. In addition, itineraries to the Saronic Gulf, the Dodecanese, the Cyclades, and Crete are carried out mainly from ports in the Region of Attica. The Region of South Aegean is the most touristic region of the country and consists of over 34 inhabited islands. The Region of Crete includes the largest and most populous Greek island. The Region of Ionian Islands is served by itineraries from the Regions of Epirus, Western Greece, and Peloponnese. The islands of the Region of North Aegean are served mainly by the Region of Eastern Macedonia, as well as by the Region of Attica. In the Region of Thessaly, the traffic originates from the islands of Sporades. In the Region of Central Macedonia, the main itineraries for the period under consideration serve visitors to the monastic community of Mount Athos.
During the spring and the summer, from Q2 to Q3, traffic increases. In all regions, during the pandemic, the movement of passengers and residents decreased. The same pattern is observed in passenger cars and buses. It is worth noting, however, that truck traffic was significantly less affected, while in some cases it even increased, which highlights the importance of coastal shipping for the supply of the islands, which is vital.
Focusing on the island regions, the figure (Figure 2) cartographically represents the demand for passenger maritime transport providing its patterns for winter and summer of 2019 and 2020 across the Greek ports through the use of GIS software and focusing on the island regions of the country. According to the legends provided on the maps, the green dots represent the Greek ports, while the concentration of the passengers traffic is depicted with colour (red scale for the summer traffic, blue scale for the winter traffic). Figure 2A presents the concentration of passengers’ demand per port during the summer of 2019, which is distributed mainly among the popular tourist destinations with high concentrations in Lefkimmi, Mytilene, Chios, Mykonos, Syros, Naxos, Paros, Thira, Rhodes, Heraklion, Chania and Sfakia. Winter 2019 (Figure 2C) is slightly different with demand being mainly concentrated on important urban conglomerations of the island regions (i.e., Heraklion, Chania, Rhodes) and on Thira, Paros and Naxos. Summer 2020 (Figure 2B) and winter 2020 (Figure 2D) seem to follow the patterns of winter 2019 with Corfu also attracting a significant share of the demand for passenger maritime transport. Significant differences can be observed between summer 2019 and 2020 considering both the spatial patterns of the passengers’ demand and the relating quantitative data per port.
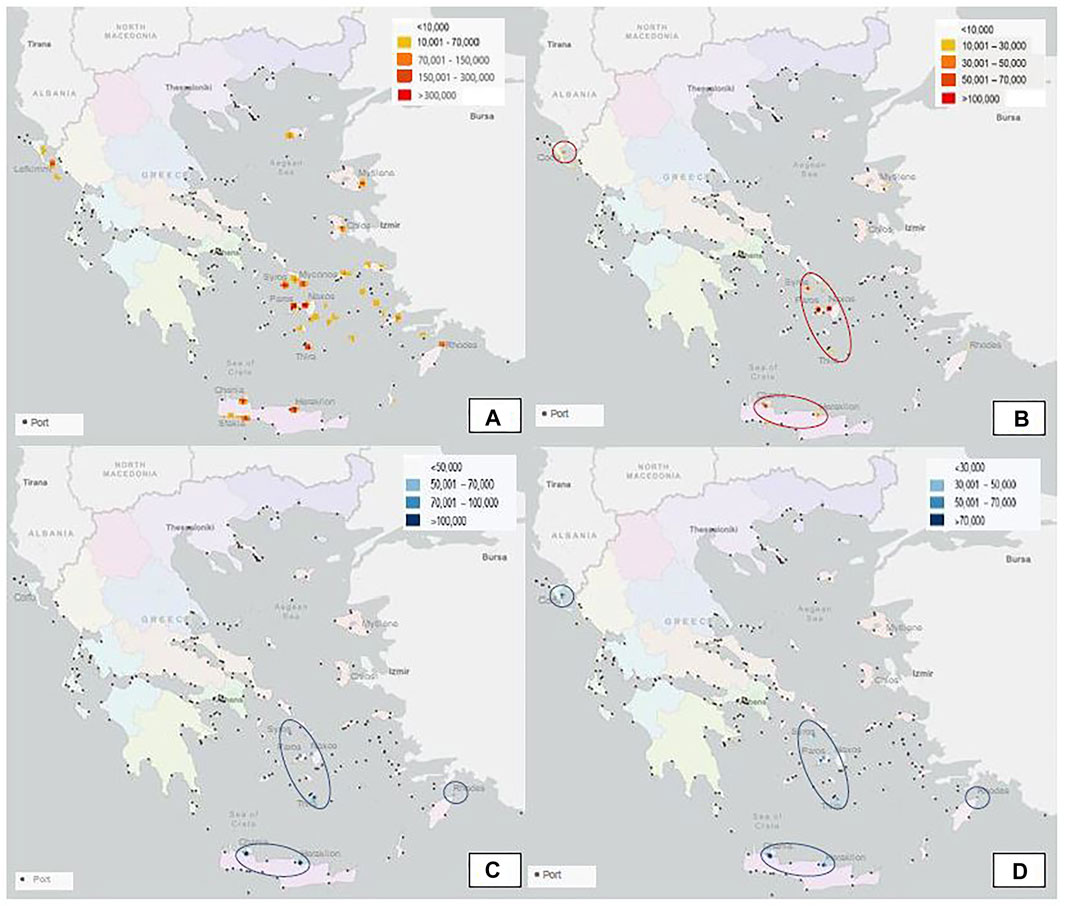
FIGURE 2. Spatial pattern of passengers’ demand for maritime transport per port during summer 2019 (A), summer 2020 (B), winter 2019 (C) and winter 2020 (D).
3 Supply of passenger maritime transport
Supply of passenger maritime transport is determined by the adequacy of the spatial coverage of the service area, the structure and the characteristics of the coastal shipping network, the size of the fleet (the number of the vessels that serve the area) and its specificities (i.e., age of the vessels, carrying capacity, availability of speedboats, etc.), the regularity of itineraries (i.e., per week considering also seasonality) (Center for Research and Technology Hellas, 2021). A significant number of coastal shipping lines are not considered profitable, leading to insufficiency in the supply of relevant services. To this end, in order to address market failures and ensure adequate provision of maritime transport services, the EU policies include provisions for public service obligations (PSOs) and the award of public service contracts (PSCs) that may predetermine fixed standards of continuity, regularity, capacity and quality (Council of the European Union, 1992). PSOs and PSCs may also adjust the provided services according to actual requirements and/or regulate their provision to specified rates and conditions (i.e., for certain passenger categories or routes) and/or regulate additional services that should be provided within the context of the awarded PSC.
Especially for the case of PSOs, factors that should be taken into account in order to provide high-quality supply of waterborne transport services, include technical specifications of the vessels in terms of appropriateness in association with the available port infrastructures, the vessel’s quality and safety level, the connectivity that should be ensured between the main port and between the islands, the reliability of the provided services (i.e., delays, cancellations, etc.), the vessel’s carrying capacity of passengers and vehicles as well as the passengers’ perceptions regarding the provided services (i.e., passengers’ complaints, etc.) (Chlomoudis et al., 2011). Within this context, the supply of relevant services can also be determined by the available budget that provides for relevant subsidies to ferry lines (Center for Research and Technology Hellas, 2021). To this end, several indicators can be considered for assessing the supply of coastal shipping services and especially their adequacy and quality. Such indicators include the scheduled and offered summer and winter vessel capacity, ship-miles and ship passenger-miles, as well as the level of subsidy per ship-mile, per passenger-mile, per ship category and so on (Angelopoulos et al., 2013; Center for Research and Technology Hellas, 2021).
According to a relevant study by XRTC Business Consultants (XRTC Business Consultants, 2022), 28 ferry companies serve the Greek coastal shipping sector. The total fleet accounts for approximately 100 vessels with a total capacity of more than 99,000 passengers and more than 26,000 vehicles. The (Table 1) presents an analysis of data collected from the relevant national authority responsible for the coastal shipping sector in Greece. The table shows an estimate of the utilization factor for the services offered by a number of vessels (for those instances for which data are available).
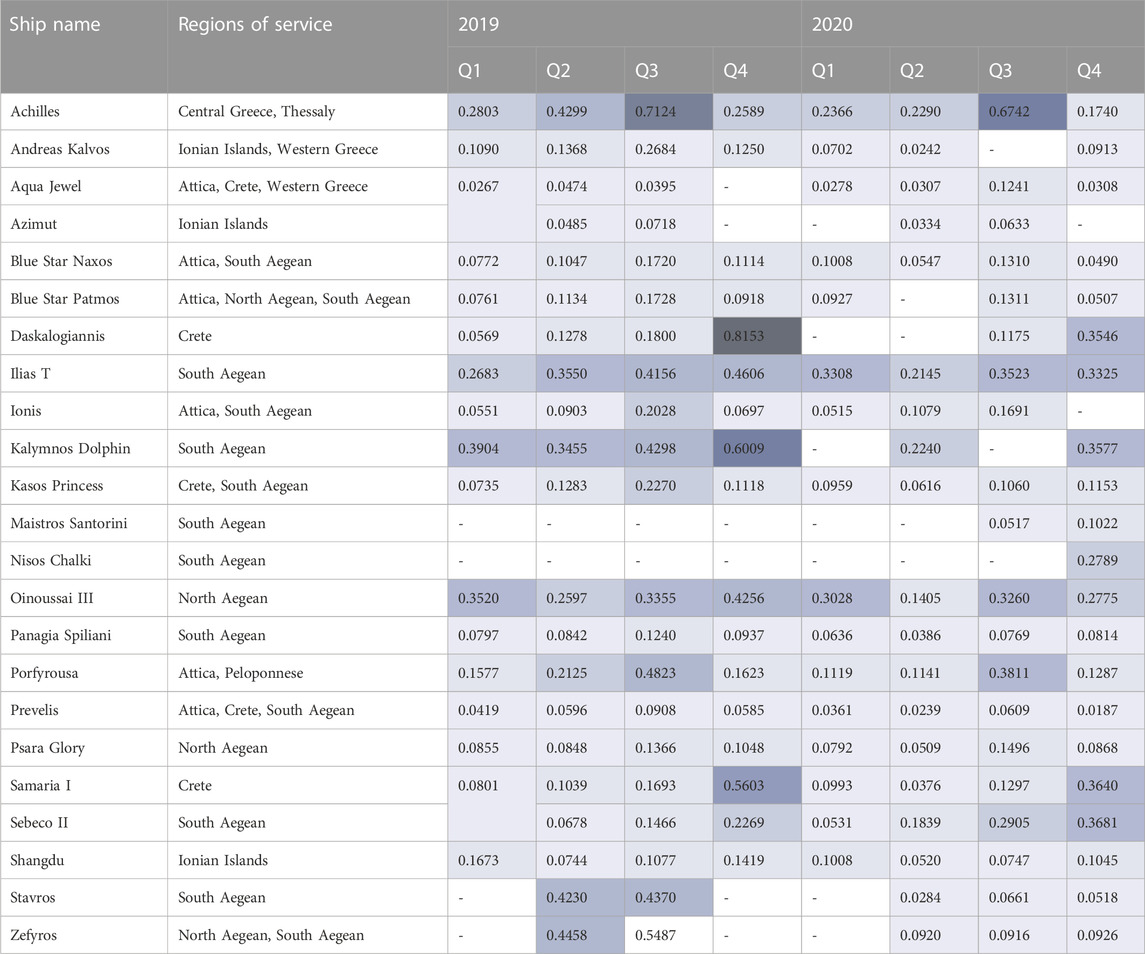
TABLE 1. Utilization factor.
The utilization factor ranges from 0 to one and provides an indication of the share of the carrying capacity of a vessel in terms of passengers, that is actually occupied by travelers. Table 1 shows the average utilization factor for each vessel, per period (per quarter for years 2019 and 2020). The carrying capacity of a vessel is different during winter and summer periods and it is further adjusted during the pandemic, due to social distancing. Nevertheless, it remained constant for all voyages within the same quarter. The mathematical formula of the average utilization factor for a specific vessel and period (quarter) is given below:
where: Utilization Factori: the utilization factor during voyage i, n: the number of voyages for the specific vessel and period, Capacity: the vessel’s capacity during the specific period and Passengersi: the number of passengers traveling on voyage i.
Utilization factor is an indicator of the relationship between supply and demand. Data summarized in the table indicates that during the pandemic the utilization factor in most of the vessel services decreased. This decrease, however, in the majority of the cases, is not as sharp as one would anticipate based on the analysis presented in the introductory section. This is the result of the application of special social distancing protocols adopted during the pandemic, which resulted in a decrease in the carrying capacity of the vessels, as well as of adjustments in the frequency of services, in an effort to align supply with demand, while at the same time maintaining a minimum of service frequency.
4 Discussion
Islands depend on the well-functioning, sustainability, reliability and resilience of their maritime systems and services. The aim of these services is to provide accessibility to the remote regions, mobility to passengers and freight, and enhance connectivity while also considering the environment. Although several companies are interested in providing services to profitable itineraries, due to several factors as analyzed in the preceding sections, national authorities need to support the provision of services to lines for which there is no market interest, through PSOs and the provision of PSCs. Maintaining proper services on these lines is critical for the islands to ensure the efficient movement of people and goods while also enhancing their growth and development prospects. Coastal shipping services, however, are vulnerable to external shocks, such as the pandemic, as also highlighted by the preceding analysis. In such situations, it is important to redesign the services, to align supply and demand, for the purpose of providing an acceptable level of service, while not wasting scarce resources. This presents major challenges to National Authorities, as on the one hand there is uncertainty and variability in demand, while on the other hand, on the supply side, more lines may become economically non-viable. This means that more funds may need to be allocated, to cover services on lines that were profitable prior to the onset of the external shocks. This was the situation in Greece during the pandemic, when the Ministry of Shipping and Insular Policy reassessed the coastal shipping network design and in collaboration with the service providers properly adjusted the services and implemented the social distancing protocols, while at the same time provided subsidies to almost all network services. As a result, the functionality of the coastal shipping system was maintained and demand and supply were better aligned, as also indicated by the values of the utilization factor presented in Table 1. GIS based modeling enabled the systematic collection, analysis and visualization of detailed data on the coastal shipping network, and the simultaneous assessment of several factors (see Figure 1 and Table 1 for example), including spatial, temporal, economic and energy related ones. Such an approach supports better educated decision making related to the allocation of scarce resources for providing services that effectively balance demand and supply on the coastal shipping network during disruptions, such as those observed during the pandemic. It is recommended that the model structure is utilized with data gathered and analyzed on a continuous basis so as to enable the assessment of various policies and their potential implications on the coastal shipping network and services.
Data availability statement
The datasets presented in this article are not readily available because the article has been based on a study that has been implemented within the framework of the Study on the Reform of the Greek Coastal Shipping network, “Upgrading and Modernization of the Operations of the Ministry of Shipping and Insular Policy” ΟΠΣ 5007849 and the generated datasets can be available by request to the authority that supports financially this study. Requests to access the datasets should be directed to dm1wZXJyYUBjZXJ0aC5ncg==.
Author contributions
Professors MB and ST led the research, providing policy perspectives related to the subject of the paper. V-MP contributed by reviewing the existing literature and supporting the data collection and their analysis. XK supported the data collection and their analysis.
Conflict of interest
The authors declare that the research was conducted in the absence of any commercial or financial relationships that could be construed as a potential conflict of interest.
Publisher’s note
All claims expressed in this article are solely those of the authors and do not necessarily represent those of their affiliated organizations, or those of the publisher, the editors and the reviewers. Any product that may be evaluated in this article, or claim that may be made by its manufacturer, is not guaranteed or endorsed by the publisher.
References
Aivazidou, E., and Politis, I. (2021). Transfer function models for forecasting maritime passenger traffic in Greece under an economic crisis environment. Transp. Lett. 13 (8), 591–607. doi:10.1080/19427867.2020.1744224
Angelopoulos, J., Chlomoudis, C., Christofas, P., and Papadimitriou, S. (2013). Cost assessment of sea and air transport PSO services: The case of Greece. Int. J. Marit. Trade Econ. Issues I (2), 3–49.
Bello, O., Phillips, W., and Indar, D. (2016). Towards a demand model for maritime passenger transportation in the Caribbean. A regional study of passenger ferry services. United Nations Santiago, Chile: ECLAC – Studies and Perspectives Series.
Berglund, S. (2001). GIS in transport modelling. Stockholm, Sweden: Royal Institute of Technology. [dissertation].
Burgess, A., and Nielsen, O. A. (2008). European TRANSTOOLS transport model. Washington, DC: Transportation Research Board 87th annual meeting. 08 – 0262.
Center for Research and Technology Hellas (CERTH) (2021). Study on the Reform of the Greek coastal shipping system. Deliverable 4: Recommended methodological approach for coastal shipping network planning.
Chlomoudis, C., Kostagiolas, P. A., Papadimitriou, S., and Tzannatos, E. S. (2011). A European perspective on public service obligations for island transport services. Marit. Econ. Logist. 13, 342–354. doi:10.1057/mel.2011.9
Council of the European Union (1992). Council Regulation (EEC) No 3577/92 of 7 December 1992 applying the principle of freedom to provide services to maritime transport within Member States (maritime cabotage). Official Journal L 364, 0007—0010.
data.gov.gr. Retrieved from: https://data.gov.gr/.
Deloitte (2021). Analysis of the impact of Covid-19 on the coastal shipping sector. Athens, Greece: Final deliverable.
European Maritime Safety Agency (2021). Impact of Covid-19 on the maritime sector in the EU. Lisboa: European Maritime Safety Agency.
Foundation for Economic and Industrial Research (IOBE) (2021). Passenger shipping in Greece in 2016 – 2020: Performance, economic contribution and potential. Athens, Greece.
Hellenic Statistical Authority (ELSTAT) (2021). Gross domestic product/2021. Retrieved from: https://www.statistics.gr/en/statistics/-/publication/SEL15/-.
Korzhenevych, A. (2012). TRANS-TOOLS – an integrated support tool for European transport policy. Informationen zur Raumentwicklung.
Loidl, M., Wallentin, G., Cyganski, R., Graser, A., Scholz, J., and Haslauer, E. (2016). GIS and transport modeling – strengthening the spatial perspective. Int. J. Geo-Information 5 (6), 84–106. doi:10.3390/ijgi5060084
Ocalir-Akunal, E. V. (2016). Decision support systems in transport planning. Procedia Eng. 161, 1119–1126. doi:10.1016/j.proeng.2016.08.518
University of Piraeus Research Center (UPRC) (2021). Study providing scientific support and evidence for planning and formulating the programming of the Ministry of Maritime Affairs and Insular Policy with emphasis on the Integrated Maritime Policy and the insular regions, within the context of the new programming period 2021 – 2027. Work Package 1.1: Definition of insularity and assessment of its importance in the Treaties and Regulations of the European Union.
Working group for coastal shipping Hellenic Chambers and Business Transport Association (EESYM), Association of Passengers Shipping Businesses (SEEN) and Laboratory in Research in Shipping and Port Management (ReShip) (2014). Critical time for coastal shipping and the transportation in the Greek islands: The issue and potential solutions. Greece: Piraeus.
XRTC Business Consultants (2020). 19th annual study on the Greek ferry market 2020: Co-Responsibility and realism, the prerequisites for addressing the new reality.
Keywords: coastal shipping, insular region, maritime passenger traffic, demand, supply
Citation: Boile M, Theofanis S, Perra V-M and Kitsios X (2023) Coastal shipping during the pandemic: Spatial assessment of the demand for passenger maritime transport. Front. Future Transp. 4:1025078. doi: 10.3389/ffutr.2023.1025078
Received: 22 August 2022; Accepted: 09 January 2023;
Published: 09 February 2023.
Edited by:
Anu Tuominen, VTT Technical Research Centre of Finland Ltd, FinlandReviewed by:
Antonio Comi, University of Rome Tor Vergata, ItalyJonathan Köhler, Fraunhofer Institute for Systems and Innovation Analysis, Germany
Copyright © 2023 Boile, Theofanis, Perra and Kitsios. This is an open-access article distributed under the terms of the Creative Commons Attribution License (CC BY). The use, distribution or reproduction in other forums is permitted, provided the original author(s) and the copyright owner(s) are credited and that the original publication in this journal is cited, in accordance with accepted academic practice. No use, distribution or reproduction is permitted which does not comply with these terms.
*Correspondence: Vasiliki-Maria Perra, dm1wZXJyYUBjZXJ0aC5ncg==