 Juwon Drake*
 Alessandra Vennema
 Lily SlonimEric Englin
 Alyssa Brodeur
 Alexander K. EpsteinDonald L. Fisher
- Volpe National Transportation Systems Center, United States Department of Transportation, Cambridge, MA, United States
Pedestrian fatalities have been increasing in the United States over the past decade; in 2021 they reached a 40-year high and together with an increasing number of bicyclist fatalities surged to over 8,400 vulnerable road users (VRUs) killed by motor vehicle crashes. There is widespread recognition of the link between passenger fleets transitioning from sedans to SUVs and pick-up trucks and the increase in vulnerable road user fatalities. Larger light-duty vehicles generally have larger blind zones, and larger blind zones are prominently linked to crashes with vulnerable road users. Heavy-duty commercial trucks, which comprise only four percent of vehicles on the road, are disproportionally associated with over eight percent of vulnerable road user deaths. With direct vision unregulated in the United States, there is a limited domestic market for large trucks with high direct vision despite research showing that one-quarter of the approximately 620 annual truck-involved pedestrian and bicyclist fatalities result from low-speed maneuvers with impaired direct vision and could be prevented by higher vision truck cabs. Communicating the seriousness of this problem is critical. This methods article presents an easy-to-use tool designed to give the public and fleet managers information to assess vehicle safety by quantifying driver blind zones using whatever driver eye positions are thought to be most applicable and with the option to standardize said eye position. Previously, measures of the percentage of volume surrounding the vehicle that cannot be seen or the number of people outside the vehicle that can fit in the blind zone could only be made with specialized instrumentation. The web-based application described, VIEW or visibility in elevated wide vehicles, can be used by anyone with a camera and access to the internet to obtain within approximately 15 min a reasonably accurate measure of the blind zone size, considerably faster than manual measurement methods. This article details the app usage procedure as well as the validation work conducted. In summary, the safety culture around SUVs, pickup trucks, and heavy-duty commercial trucks may change if drivers had an easy-to-use method to determine how much situational awareness they would be missing before they purchased a particular vehicle.
1 Introduction
Even at low speeds, large vehicles, such as trucks and buses, present specific, documented risks for people outside of a vehicle, often referred to as vulnerable road users (VRUs). Fatality rates for VRUs such as pedestrians and cyclists are rising faster than traffic fatalities overall, driven in part by an increase in fatalities involving large trucks (FMCSA, 2019). The percentage of VRU deaths involved in a crash with a large truck increased 9.1 percent between 2019 and 2020 (NHTSA, 2020), rising to 639 pedestrians and bicyclists killed (NHTSA, 2022). Truck sightlines present an especially challenging safety problem, as reflected in the overrepresentation of fatalities and injuries caused by right-turning trucks in low-speed urban settings (NYCDOT, 2010).
Direct vision refers to how much drivers can see directly through their vehicle’s windows, compared to indirect vision seen through mirrors, cameras, and other devices. Previous research has shown that drivers’ direct vision reaction times are approximately 0.7 s faster with direct vision than with indirect vision (Milner & Western Williams, 2016). Various authorities and industry organizations have increased their attention to direct vision as a determinant of VRU safety (Blower, 2006). This attention has led to the development of standardized methods for measuring the blind zone volume in front of the vehicle and to the rear of the vehicle. With respect to front of the vehicle, Transport for London (TfL) uses a Digital Human Modelling Software, SAMMIE, to assign visibility ratings to different trucks. The International Organization for Standardization developed a methodology for measuring blind zones through physical shadow tracing, focused on earth-moving equipment (ISO, 2006). SAE has created three methodologies for measuring forward blind zones. The Target Evaluation method uses a pair of eye points to determine what is visible to the driver. This method can be conducted in a physical layout or through CAD software (SAE, 2010). The Polar Plot method applies eyellipses, developed through SAE research, to determine the viewable fields for a percentage of the driving population (SAE, 2019). And the Horizontal Planar Projection method uses specific eyepoints to measure the field of view at a given elevation.
Methods for measuring the rearview blind zones have also been developed. These include laser fixtures used to simulate the line of sight of a 50th percentile male driver to the sides and out the rear window of a vehicle. The beam automatically produces an audible signal if it is sensed by a laser detector in the rear of the vehicle (Mazzae & Barickman, 2009). The methods also include seated individuals who judge the lowest height that they can see on a cone through different methods of direct and indirect vision (rear view and side view mirrors, backup cameras) (Kidd & Brethwaite, 2014).
While the above methodologies have helped advance blind zone research and detection, especially in the establishment of standards for how the seat should be positioned (e.g., horizontal track position, vertical height, seatback angle) and where the eyepoint should be located in space with respect to the seat position given the different anthropometric dimensions of drivers, they all require time and materials to produce an analysis. This is a barrier for individual consumers who may well not conform to the standard, for fleet managers who cannot afford the time or equipment required to take standardized measures, and for consumer organizations that analyze hundreds of new vehicles each year. The need for a simplified method to collect blind zone data should allow for further use by individuals and research by different groups with fewer resources.
The simplified method described in this article, VIEW, is a web-based application that uses individual images that drivers capture with a camera while seated in the driver’s seat facing forward (driver view images or DVIs) and a cloud-based, user-accessible image processing algorithm to estimate the size of a vehicle’s blind zone, the number of vulnerable road users (VRUs) obscured in the driver’s blind zone, and standard blind area diagrams. VIEW is the result of a collaborative effort between a team of students from the Franklin W. Olin College of Engineering in Needham, Massachusetts, the Santos Family Foundation for Traffic Safety, and the Volpe National Transportation Systems Center. The initial development of the application built upon the research conducted by Loughborough University and Transport for London (Summerskill, 2015).
This methods article analyzes the accuracy of VIEW as a tool for estimating vehicle blind zone volumes. The validation requires gathering predictions made by VIEW of the nearest visible point (NVP) and collecting ground truth measurements of NVP (the nearest visible point as seen by an observer having the same eye location as the VIEW app camera) at discrete points in front and to the side of a vehicle. These predictions and ground truth measurements are then compared.
Given the rise in both child and adult pedestrian deaths in the United States, now at a 40 year high (Machek, 2022), understanding a vehicle’s ability to provide drivers with direct vision of VRUs is important to measure and broadly communicate to the public. Such an understanding could contribute to better informed vehicle purchases by individuals and fleet managers and to developing new safety policy to regulate direct vision. Over time, these changes could lead to a safer transportation system for VRUs.
2 Materials and equipment
This analysis aimed to collect validation data by recreating the blind zone through field measurements on the surface of a parking lot (the observed nearest visible points) and comparing with the VIEW app output from the same driver in the same seating position (the predicted nearest visible points). The equipment and procurement cost required to conduct the field measurements and collect the validation data are as follows: The team needed one smartphone capable of panoramic photos, one aluminum 0.5-inch outer diameter pole with five horizontal markings positioned one foot apart starting from one foot above the ground, mounted to a 1-by-1-foot square of marine-grade plywood sheet via a floor flange and set screw (pole assembly costing $35.34), two pairs of scissors, one pack of jumbo sidewalk chalk costing $9.99, one outdoor broom costing $21.87, two 25-foot tape measuring tools costing $35.98, one 500 mm digital protractor costing $30.99, one green laser pointer costing $14.99, about 1,000 feet of white vinyl tape costing $83.94, one 328-foot roll of jute twine costing $5.99, two pairs of laser safety goggles costing $31.98, and one 65-foot laser distance measure costing $49.97. In total, the material costs were $432.96. The smartphone, pole, and scissors were already in the team’s possession and did not incur any procurement costs. If procured, the smartphone and scissors would have cost approximately $799.00 and $25.00, bringing the total cost to $1,256.96. Only the smartphone, pole, and measuring tape are required for the VIEW app measurements. The phone used was an Apple iPhone XR, with a 12-megapixel, f/1.8 aperture camera, including a panoramic mode capable of up to 63 megapixels. The remaining materials were required for the manual validation measurements.
3 Methods
The following method was used to validate the VIEW application’s calculation of the nearest visible point (NVP). A 2006 Chevrolet Suburban, the dimensions of which are 219.3 inches long, 78.9 inches wide, and 73.6 inches tall (Edmunds, 2023), was used as the test vehicle. The research team used one observer at three different seating positions: As far forward as possible, “Forward”; as far backward as possible while still being able to touch the steering wheel, “Rearmost”; and a comfortable middle seating position that the driver preferred, “Standard.” These different seating positions showed how the blind zone could theoretically differ across different types of seating positions within the same vehicle and the same driver.1
The validation method is fourfold. First, it consists of preparing the measurement area (Section 3.1.1)
Second, the research team obtained driver view images (DVIs) from the vehicles. These images together with measurements related to the vehicle and driver eyepoint (camera lens) were then uploaded to the cloud-based VIEW app and the driver was instructed to trace certain features of the digital, panoramic photograph that was presented to him or her. The VIEW app was then used to predict the NVP along each of the radial lines (Section 3.1.2).
Third, the method consists of ground truth measurements of the NVP as determined by an observer in the driver’s seat, taken along radial lines extending from the driver’s eye point at 5-degree increments across the driver’s view of the parking lot area laid out in polar coordinates. The 5-degree increments are indicated by the chalk dots in Figure 1. The driver then used a laser pointer to indicate the exact location of the nearest visible point that the driver could see with their naked eye on the ground at each five-degree increment (Section 3.1.3).
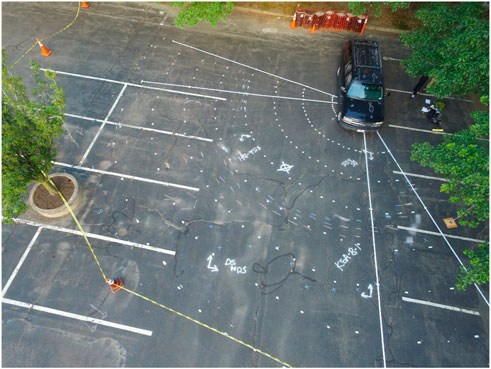
FIGURE 1. Drone imagery of the field measurement area with four distinct lines of tape for the edges of the driver field of view and the points directly in front and to the passenger side of the driver. Individual tape segments mark each five-degree point at five-foot increments from the driver.
Fourth, each of these sets of predicted NVP values could be paired with each group of ground truth measurements corresponding to a single height and seating position. These known pairs of predicted and observed values provided the necessary inputs for the team to conduct analyses of the accuracy of the VIEW application’s underlying methodology (Section 3.2).
3.1 Field measurements
The field measurements took place in a cordoned off area of a parking lot. The process began with preparing the measurement area by laying out a polar coordinate system on the pavement. With the polar coordinate system created, the research team could then record the measurements that are necessary for the statistical analysis.
3.1.1 Prepare the measurement area
The field measurement process required extensive preparation to accurately collect validation measurement data. The aerial imagery of the measurement process is shown in Figure 1. Four distinct lines of tape are visible, two for the edges of the driver field of view and two for the points directly in front and to the passenger side of the driver. Individual tape segments mark each five-degree point at five-foot increments from the driver. There are five steps in the preparation process.
1) To start, the research team roped off an approximately 60-foot by 60-foot area in a parking lot. This would generally allow for tracking the nearest visible points around the driver field of view. A larger area may be needed for vehicles with larger blind zones.
2) Within this area, the team began by marking the driver eye position, the origin of the polar coordinate grid.
3) The team then used the protractor to lay out the markings using tape at key angles, marking the angles exactly in front of the driver and to the right of the driver (see long white lines extending from under the vehicle cab in Figure 1).
4) With these core measurements tracked on the parking lot, the research team filled in the remaining markings at every five degrees from −20° to 110°. At every five-degree increment, the research team placed tape at five-foot radial increments from the driver eyepoint origin marking (these tape marks appear as the white dashes in a circular pattern in Figure 1), extending out to 40 feet, the radius of the measurement area.
5) The team then moved the vehicle, a 2006 Chevrolet Suburban, the dimensions of which are 219.3 inches long, 78.9 inches wide, and 73.6 inches tall (Edmunds, 2023), so that the driver eye point aligned exactly above the polar grid origin for the first of three seating positions to be measured.
3.1.2 VIEW app measurements
After the preparation process, the VIEW app measurements were collected in each seating position. The passenger seat was kept in the same position, a comfortable track distance and seatback angle for an average height male, for all measurements across seating positions. As shown in Figure 2, the VIEW app measurements include the driver’s cyclopean eyepoint height from the ground (A in Figure 2), the distance from the cyclopean eyepoint to the passenger side window (B), the distance from the vehicle to a measurement pole (C), and the distance from the cyclopean eyepoint to the front of the vehicle (D). There are five steps in the VIEW app measurement process.
1) After the preparation of the markings for the measurement area, for each seating position, the team moved the vehicle directly over the driver eye point marking, corresponding to the point of intersection of the major axes, marked in solid white in Figure 1. The measurement team checked under the vehicle from the front and sides to ensure proper alignment of the axes with the driver seating position.
2) A researcher then moved the pole forward from the truck along the 0-degree radial line until the 1-foot mark was just visible over the hood line to the seated observer. Specifically, the measuring pole was set directly in front of the driver where the bottom of the pole was obscured but the one-foot mark on the pole, indicating a distance of one foot above the ground, was just visible over the hood of the vehicle.
3) A panoramic photo was taken from the driver’s cyclopean eyepoint out the front of the vehicle. An accurate panoramic picture was obtained by pivoting the camera immediately in front of the driver’s face from left to right with the lens always centered on the driver’s cyclopean eyepoint and the camera maintained on a vertical axis.
4) The panoramic photo was uploaded to the cloud-based VIEW app. The application requires the user to trace with a mouse on the digital, panoramic image the locations of the one-foot spaced markings on the vertical calibration pole (1, 2, 3, 4, and 5 feet from the ground), the 0-degree direction directly in front of the driver, the 90-degree direction to the right of the driver, the entire bottom of the forward field of view from A-pillar to A-pillar, and the entire bottom of the passenger window field of view from A-pillar to B-pillar.2
5) The image processing algorithm then takes as input the panoramic image with the tracings and other data and uses a series of trigonometric functions to calculate the ground-level NVP at each degree increment in a polar coordinate system with the driver’s cyclopean eyepoint as the origin. The program calculates, based on each NVP and its associated line of sight, a volumetric estimation of the driver’s viewable region as a percent of the assessment volume,3 as well as an estimation of the number of several types of vulnerable roads users4 that cannot be seen in the forward direction, passenger side direction, and in total.
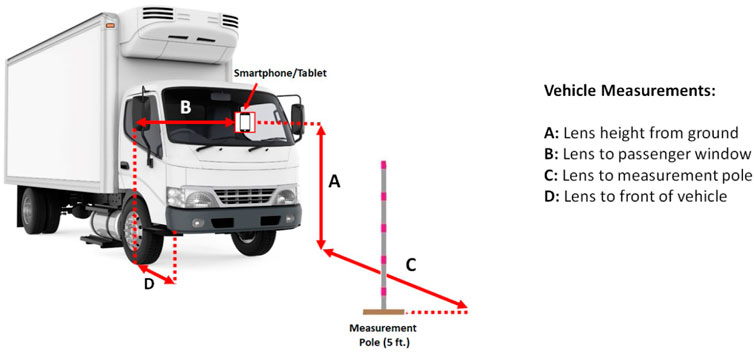
FIGURE 2. VIEW app measurement instructions showing the placement of the five-foot measurement pole, the smartphone or tablet in the driver seat, and the four measurements. (The lens position is assumed to be the location of the cyclopean viewpoint).
The tracing described in Step 3 above is intended to be completed using a computer mouse, and for this study all tracing tasks used a laser computer mouse. Given the potential for unintended variability from drawing styles in the output of the VIEW app, the research team opted for a standardized drawing style. Specifically, the team determined that the following drawing techniques produce the most consistent and accurate outputs: Draw slightly up the right-side A-pillar (the car frame between the driver and passenger window), but not past the height of the right-side mirror; and draw around the right-side mirror. Figure 3 shows the different panoramic pictures taken in three different positions. At the rearmost seat position, the steering wheel begins to obstruct the driver’s view.
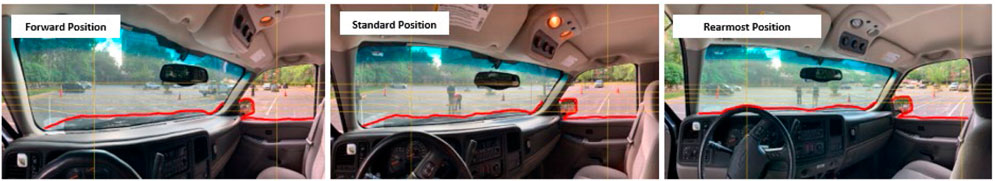
FIGURE 3. Panoramic picture taken in the forward, standard and rearmost seating position.
3.1.3 Ground truth measurements
The ground truth measurements were made with several individuals, one an observer seated in the cab and two researchers who recorded measurements of the NVP. There are three steps in the field measurement process.
1) After taking the panoramic photo and completing the VIEW app process at a given seat position, the same driver sitting in the cab used a hand held laser pointer to indicate the exact location of the nearest visible point that the driver could see on the ground with their naked eye on the ground at each five-degree increment.
2) The other researchers marked this location with chalk and recorded the radial measurement.
3) The team compiled these measurements at each degree into a corresponding dataset to be used in the analysis as the validation data.
3.2 Analysis
The field measurements obtained using the method described in Section 3.1 were used as the ground truth, or observed values, and values obtained from the corresponding vehicle imagery processed by the VIEW application were used as the predicted values. Both sets of values were used to calculate the Root Mean Square Error (RMSE) for each of the three seat positions for the average height participant that was used in this trial. In addition to RMSE, the mean of absolute errors, the percent difference between measured and predicted NVPs, and the percent difference between areas under the curves for each series of NVPs were also analyzed. All analysis was performed in R using R Studio, R Markdown, and the “jsonlite,” “dplyr,” “tidyverse,” and “ggplot2” packages for R.
3.2.1 Data processing
The results from the field measurements of the observer’s NVPs were digitized into a csv file, with non-visible points coded as 1,061 ft, which was well beyond the furthest measured points among the NVPs.
To obtain predicted values for the NVPs, the photos that accompany the three seating positions for an individual of average height were input into the VIEW app using the preferred drawing method that was established previously. The VIEW app produces a JSON object file containing the phi values and corresponding NVPs, which were placed into a data frame and merged with the observer’s NVP data.
For the forward seating position, the non-visible points around the A-pillar and passenger side mirror span the length of the orange line in Figure 4, corresponding to phi values of 60–85°. These A-pillar and mirror points were excluded from the data set. For the standard seating position, the NVPs corresponding to phi values between 65 and 80° were excluded. For the rearmost seating position, the NVPs correspond to phi values between 45 and 75° were excluded. In addition to these exclusions, any points that were coded by either the app or the field measurements as non-visible points were excluded from the validation analyses.

FIGURE 4. The non-visible points around the A-pillar in the forward seating position.
Figure 5 is a plot of the measured (blue dots) and predicted (red dots) NVPs against the phis in degrees, with the shaded blue area illustrating the A-pillar and mirror area points that were excluded.
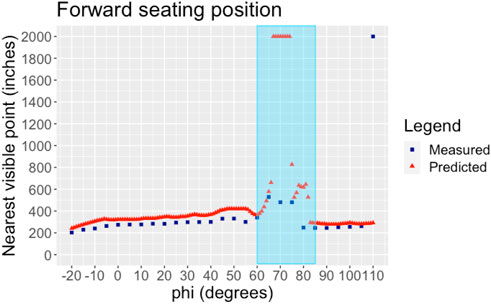
FIGURE 5. Forward seating position NVP and phis, with blue shading showing excluded points.
Since the field measurements occurred at only every fifth degree, all predicted points not at a multiple of five phi value were excluded for the RMSE, the mean of absolute errors, and the percent difference between predicted and field measured NVPs. The percent difference between areas under the NVP vs. phi curves retained all phi values for the predicted NVPs.
3.2.2 Root mean square error (RMSE)
Let N equal the number of radial lines spaced 5° apart. In this case, N = 26 since phi ranges between −20 and 110. The RMSE was calculated using the following equation.
3.2.3 Mean of absolute errors
The mean of absolute errors was calculated using the following equation.
3.2.4 Percent difference of NVPs
The percent difference of NVPs was calculated at each phi using the following equation.
3.2.5 Percent difference of areas
The area under the curve in which NVP is plotted against phi represents the area of the blind zone formed by the plane of the bottom of the driver’s view, henceforth referred to as the NVP area, plus the area occupied by the vehicle’s hood and interior. Since the vehicle area is constant between predicted and measured, the difference in the NVP areas is simply the difference of the areas under the curves. The equation used to calculate the NVP areas is as follows, where
4 Results
4.1 App outputs and field measurements
The measurements of the observer’s NVP are shown in the Supplementary Appendix SA1.
A, B, C, and D, as shown in Figure 2, are listed for each of the seating positions. A was 60 inches, 57 inches, and 60 inches, for forward, standard, and rearmost seating positions, respectively. B was 53 inches for all positions. C was 248 inches, 250 inches, and 408 inches for forward, standard, and rearmost seating positions, respectively. D was 90 inches, 93 inches, and 104 inches for forward, standard, and rearmost seating positions, respectively.
The VIEW app outputs for the three different seating positions, furthest back, standard, and furthest forward, are visualized below in Figure 6. The perimeters of the black zones are the predicted NVPs. The VIEW app fills in everything between the NVP and the vehicle (blackened area, Figure 6). The number of adults in the blind zone is the predicted number of standing adults that could fit shoulder-to-shoulder within the footprint of the blind zone such that the driver cannot see their head and shoulders. For smaller vehicles, adults typically only fit in the passenger A-pillar blind zone, but for larger and heavier vehicles, multiple standing adults can be obscured by the hood or passenger door.
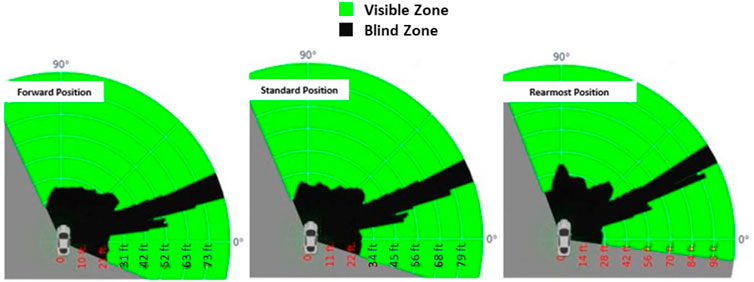
FIGURE 6. Predicted blind zone generated by the VIEW app for the forward, standard, and rearmost seating position.
The field measurements for the average height participant in the three different seating positions are visualized in Figure 7. The blind zone corresponding to the forward seating position is shaded in pink, while that of the standard seating position is shaded in purple, and that of the rearmost seating position is shaded in lavender. Notice the “spike” corresponding to the location of the passenger side A-pillar. The furthest circumferential line marking is at 40 feet, measured from the driver eye point. The measurements extend beyond the 40-foot marking in several locations, illustrating a limitation of the field measurement method.
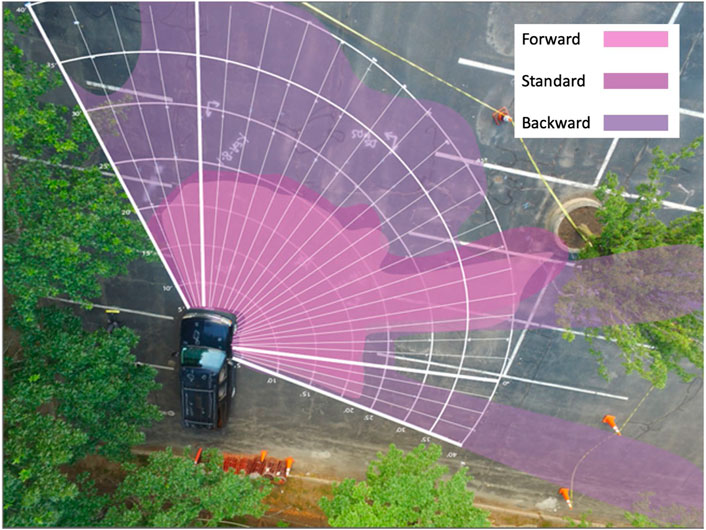
FIGURE 7. Nearest visible points for the one participant at the three different seating positions.
The VIEW app outputs and field measurements are plotted against each other in Figures 8, 9, 10, prior to exclusion of the non-visible points, the A-pillar, and the mirror areas. Notice the “spikes” in each of the plots between approximately 60 and 80°. This area is the passenger A-pillar and mirror region. The treatment of these points is further elaborated upon in the Discussion section. Notice that for the forward and standard seating positions, the VIEW app overestimated the NVP distance, while for rearmost position, the VIEW app both underestimated or overestimated, with many points being close to the field measurement value. For all seating positions, the gap between the predicted and measured values appears to widen near the zero degree and 45° points. The NVP distance never exceeds 650 inches, and it never falls below 200 inches.

FIGURE 8. Forward seating position: Measured and predicted.
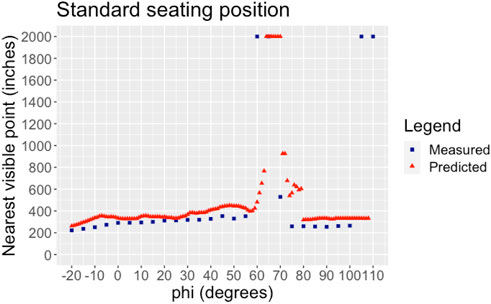
FIGURE 9. Standard seating position: Measured and predicted.

FIGURE 10. Rearmost seating position: Measured and predicted.
4.2 Analysis
The RMSE, mean of absolute error, and percent difference in areas results are as follows in Table 1. The highest RMSE, Mean of absolute error, and difference of areas occurred for the Standard seating position. The lowest of each error measure occurred at the Rearmost seating position. Notice that the Standard error values are extreme, and the average error values deviate considerably from the median values except for the RMSE.
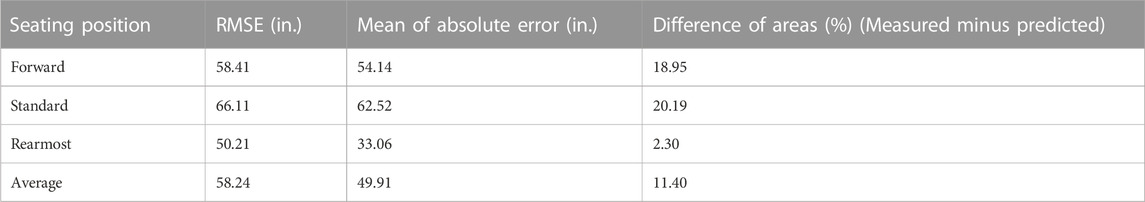
TABLE 1. RMSE, mean absolute error, percent difference in areas.
The plot of percent difference between NVPs at each degree of phi is shown in Figure 11. The percent difference varied from −15% to 40%. The forward and standard seating position measurements appear to follow a similar trend with large spikes in difference near the −10 and 50° phis, while the rearmost seating position measurements do not follow that trend.
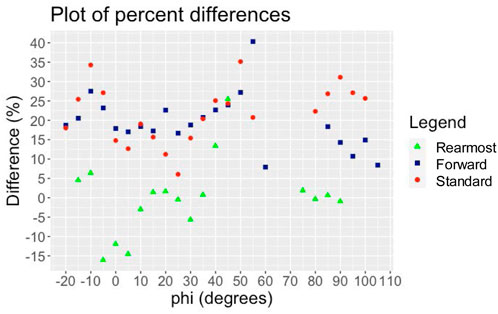
FIGURE 11. Percentage difference between NVPs.
5 Discussion
5.1 Interpreting the results
The VIEW app performed best in the rearmost seating position. The nearest visible point RMSEs for the forward, standard, and rearmost seating positions are, respectively, 58.41, 66.11, and 50.21 inches. The mean absolute errors (average of the difference in the absolute values of the predicted and observed measures) follow the same trend as the RMSE, with the forward, standard, and rearmost seating positions having mean absolute errors, respectively, of 54.14, 62.52, and 33.06 inches. The predicted area under the NVP curve is larger than the observed area under the NVP curve for the forward, standard and rearmost seating positions by, respectively, 18.95%, 20.19%, and 2.30%, following the same trend. The question is why this is the case.
The answer is observable in the three figures depicting the drawings of the bottoms of the forward and passenger side fields of view, from the forward, standard and rearmost seat positions. The visual contrast of the dashboard and steering wheel against the pavement in front of the vehicle is much sharper in the rearmost seat position (Figure 3) than the contrast between the dark vehicle hood and the pavement in the forward and standard seat positions shown. Therefore, it was presumably easier for the observer to trace an accurate red line representing the NVPs in the rearmost seating position as compared to the other positions, where the edge of the field of view showed lower contrast. Additional research is needed to understand the effects of the panoramic photo quality on the accuracy of the VIEW app outputs.
The impact of the tracing on the difference in the predicted and observed NVPs can be observed at a more microscopic level. Consider Figure 9, predicted and observed, and the tracing (Figure 3, right panel). Note the predicted NVPs form a semicircle at the same position as the steering wheel (Figure 9, from −5 to +5°). The A pillar position is also clear. For example, consider the A pillar in the forward seat position (Figure 5). The two leftmost dots represent the A pillar. They are, respectively at 65 and 70° in Figure 5. The A-pillar does not fully obscure a human adult and can be seen on either side of the A pillar, which is why the two blue dots (observed NVPs) are relatively near at 65 and 70° whereas the red dots (predicted NVPs) are at infinity, graphed here as 2,000 inches.
The noise of any measurement methodology should be considered in the context of the signal it is intended to measure. The absolute sizes of the errors in the various measures of how well the observed and predicted NVPs agree should likewise be considered in the context of blind zone variation among those vehicles that may reasonably be compared. Specifically, a difference in the area under the NVP curve of 2% in the rearmost seat position is relatively small in the context of blind zone variation among similar vehicles. And compared to the three-fold or 200% range of the NVPs among six Class 8 trucks that the research team has measured (see VIEW app website at https://blindzonecalculator.herokuapp.com/), even a 20% difference between the predicted and measured NVPs, as observed in the standard seat position, is indeed relatively small. These results support the validity of VIEW as a screening or estimation tool for comparing the blind zone size and associated VRU safety risk of different vehicles on the road and on the market for a given driver; and, conversely, for comparing the same among different drivers and seating positions for a given vehicle.
5.2 Policy and practice implications
The sheer number of vehicles with large blind zones is on the increase, as are the number of VRU fatalities. Not only do trucks contribute to this count, but there is widespread recognition of the link between passenger fleets transitioning from sedans to SUVs and pick-up trucks (Federal Reserve, 2022) and the increase in vulnerable road user fatalities (Auffhammer, 2014).
The VIEW app offers a fast way to obtain estimated blind zone measurements. Comparing the VIEW app to this study’s manual measurement method, which required at least three people and 5 hours, the VIEW app takes about 1.5% of the person-hours to obtain the measurements. The VIEW app has now been used by individuals from a spectrum of organizations, including federal, state and municipal government agencies in the United States, Australia, and Canada, truck and bus companies, public foundations, and consumer organizations. Feedback has been incorporated into the VIEW app, and it is continually updated based on stakeholder engagement. The use of crowdsourcing to enter the data means ultimately that with enough users information will be available on the blind zone size for a large range of different seat positions, heights, males and females, and other demographic variables on the full range of vehicle makes and models. Averaged across the various users, random variation in entry of the data should even out, and systematic errors can then be removed.
At an individual consumer’s level, the VIEW app can prove useful, offering a driver a quantitative visualization of the blind zones particular to that driver, vehicle make, vehicle model, seat position the driver assumes, and so on. At a fleet level, the VIEW app can be used in conformity with standards set by TfL (Summerskill, 2015), ISO (ISO, 2006), SAE (SAE, 2019), or the United Nations Regulation 125 (Official Journal of the European Union, 2010) and Regulation 167 (United Nations Economic Commission for Europe, 2022) for standardizing the driver eyepoint, to quickly compare the blind zones of existing vehicles and help fleets incorporate direct vision into purchasing decisions. At scale with crowdsourcing or in partnership with key organizations, the VIEW app methodology can serve to foster blind zone awareness, support market analysis, and drive fleet selection of vehicles with improved direct vision. The tool may also inform future vehicle safety rating programs or procurement standards that could potentially help address the safety threat to VRUs of increasingly large vehicle blind zones.
5.3 Limitations
This study has two general limitations. First, the field measurement method was prone to human error and bias. Human error during the field measurements could consist of inaccurately recorded data, inconsistency in the setup of the measurement area, and equipment error. A possible bias toward points in the vicinity of the A-pillar as visible instead of non-visible may have resulted in recording fewer non-visible points than the VIEW prediction shows. This bias is a result of the natural tendency of a driver to shift to get a better view, whereas the VIEW app assumes a stationary cyclopean point. Second, there are also limitations due to the fact that only one vehicle body type and one participant, for consistency, were used to record and trace the photographic input for the app.
5.4 Future research
Additional research is needed on the VIEW app’s validity across vehicle body types and weight classes. In addition, the effect that photo quality has on the VIEW app outputs will need to be explored in order to inform future efforts in training a machine learning algorithm to automatically process panoramic photos (European Parliament, 2019).
Data availability statement
The original contributions presented in the study are included in the article/Supplementary Material, further inquiries can be directed to the corresponding author.
Author contributions
All authors listed have made a substantial, direct, and intellectual contribution to the work and approved it for publication.
Conflict of interest
The authors declare that the research was conducted in the absence of any commercial or financial relationships that could be construed as a potential conflict of interest.
Publisher’s note
All claims expressed in this article are solely those of the authors and do not necessarily represent those of their affiliated organizations, or those of the publisher, the editors and the reviewers. Any product that may be evaluated in this article, or claim that may be made by its manufacturer, is not guaranteed or endorsed by the publisher.
Supplementary material
The Supplementary Material for this article can be found online at: https://www.frontiersin.org/articles/10.3389/ffutr.2023.1003175/full#supplementary-material
Footnotes
1Note that because the predictions of the VIEW app are compared with the driver’s estimate of the NVP at the same eye point, the exact driver seat position and angle are not relevant to this study and were not measured. Clearly, were the VIEW app to be used as a measure corresponding to a standard, the seat position, seat angle, and driver eye point would need to be the same as that used by the standard and both measured and reported.
2Full instructions are available on the VIEW app website, https://blindzonecalculator.herokuapp.com/addvehicle.
3In the VIEW algorithm, assessment volume is defined as within 15 feet of the front and passenger side of the vehicle, extending from the driver A-pillar to the passenger B-pillar, and from the ground to six feet, two inches elevation. Fifteen feet was selected based on research for defining the TfL Direct Vison Standard, specifically identifying a driver response time of approximately 1 s when seeing a pedestrian through direct vision and the observation that a truck traveling at a low urban speed of 10 mph travels 15 feet in one second. See https://content.tfl.gov.uk/assessing-drect-vision-in-hgvs-technical.pdf.
4The app enables estimation and visualization of preschool children, elementary school age children, adults, adults in wheelchairs, adults on bicycles, and elementary school age children on bicycles that are obstructed by a measured vehicle’s blind zone.
References
Auffhammer, M. L. (2014). Pounds that kill: The external costs of vehicle weight. Rev. Econ. Stud. 81. doi:10.3386/w17170
Blower, D. (2006). Truck driver vision and pedestrian/nonmotorist crashes in low speed maneuvers. Chicago, IL, USA: Commercial Vehicle Engineering Congressand Exhibition.
Edmunds, (2023). Used 2006 chevrolet suburban specs & features. Retrieved from edmunds.com https://www.edmunds.com/chevrolet/suburban/2006/features-specs/.
European Parliament Council of the European Union, (2019). Regulation (Eu) 2019/2144 of the European parliament and of the council. Belgium, Europe: Official Journal of the European Union.
Federal Reserve (2022). Motor vehicle retail sales: Light weight trucks. Retrieved from FRED: https://fred.stlouisfed.org/series/LTRUCKSA.
Fmcsa, (2019). Large truck and bus crash facts. Federal motor carrier safety administration (FMCSA). Washington, DC, USA: U.S. Department of Transportation. Retrieved from https://www.fmcsa.dot.gov/safety/data-and-statistics/large-truck-and-bus-crash-facts-2019.
Iso, (2006). Earth-moving machinery: Operator's field of view: Test method and performance criteria. London, USA: International Organization for Standardization ISO. Retrieved from https://www.iso.org/standard/45609.html.
Kidd, D., and Brethwaite, A. (2014). Visibility of children behind 2010–2013 model year passenger vehicles using glances, mirrors, and backup cameras and parking sensors. Accid. Analysis Prev. 66, 158–167. doi:10.1016/j.aap.2014.01.006
Machek, K. (2022). Pedestrian traffic fatalities by state: 2021 preliminary data. Governors Highway Safety Association (GHSA). Retrieved from https://www.ghsa.org/sites/default/files/2022-05/Pedestiran%20Traffic%20Fatalities%20by%20State%20-%202021%20Preliminary%20Data.pdf.
Mazzae, E., and Barickman, F. (2009). Direct rear visibility of passenger cars: Laser-based measurement development and finding for late model vehicles (DOT HS 811 174). Washington, DC, USA: National Highway Traffic Safety Administration. Retrieved March 4, 2023, from https://www.nhtsa.gov/document/direct-rear-visibility-passenger-cars-laser-based-measurement-development-and-findings-late.
Milner, R., and Western Williams, H. (2016). Exploring the road safety benefits of direct vs indirect vision in hgv cabs. Direct vision vs indirect vision: A study exploring the potential improvements to road safety through expanding the hgv cab field of vision. London, UK: Transport for London. Retrieved March 4, 2023, from https://tfl.gov.uk/cdn/static/cms/documents/road-safety-benefits-of-direct-vs-indirect-vision-in-hgv-cabs-technical.pdf.
Nhtsa, (2022). Fatality and injury reporting system tool. Retrieved July 7, 2022, from https://cdan.dot.gov/query.
Nhtsa, (2020). National Highway traffic safety administration. Washington, DC: U.S. Department of Transportation. Retrieved from https://crashstats.nhtsa.dot.gov/Api/Public/ViewPublication/813266.Overview of motor vehicle crashes in 2020
Nycdot, (2010). NYC pedestrian safety study & action plan. New York, NY, USA: New York City Department of Transportation. Retrieved from https://www.nyc.gov/html/dot/downloads/pdf/nyc_ped_safety_study_action_plan.pdf.
Official Journal of the European Union, (2010). Regulation no 125 of the economic commission for Europe of the united nations (un/ece) —Uniform provisions concerning the approval of motor vehicles with regard to the forward field of vision of the motor vehicle driver. Retrieved from https://eur-lex.europa.eu/LexUriServ/LexUriServ.do?uri=OJ:L:2010:200:0038:0062:EN:PDF.
Sae, (2010). Describing and evaluating the truck driver's viewing environment. Retrieved from https://www.sae.org/standards/content/j1750_201010/.
Sae, (2019). Describing and measuring the driver's field of view J1050. Retrieved from https://www.sae.org/standards/content/j1050/.
Summerskill, S. (2015). Understanding direct and indirect driver vision in heavy goods vehicles: Final report prepared on behalf of Transport for London. Loughborough, UK: Loughborough University. Retrieved from https://content.tfl.gov.uk/understanding-direct-and-indirect-vision-in-hgvs-full-technical-report.pdf.
United Nations Economic Commission for Europe, (2022). Proposal for a new UN regulation on uniform provisions concerning the approval of motor vehicles with regard to their direct vision. Retrieved from https://unece.org/sites/default/files/2022-10/ECE_TRANS_WP.29_2022_140r1e.pdf.
Keywords: blind zones, direct vision, road safety, vulnerable road user (VRU), vehicle safety, fleet management
Citation: Drake J, Vennema A, Slonim L, Englin E, Brodeur A, Epstein AK and Fisher DL (2023) Evaluating the performance of a web-based vehicle blind zone estimation application: Validation and policy implications. Front. Future Transp. 4:1003175. doi: 10.3389/ffutr.2023.1003175
Received: 27 July 2022; Accepted: 22 March 2023;
Published: 04 April 2023.
Edited by:
Wesley Kumfer, University of North Carolina at Chapel Hill, United StatesReviewed by:
David Kidd, Insurance Institute for Highway Safety (IIHS), United StatesWesley Marshall, University of Colorado Denver, United States
David Hurwitz, Oregon State University, United States
Copyright © 2023 Drake, Vennema, Slonim, Englin, Brodeur, Epstein and Fisher. This is an open-access article distributed under the terms of the Creative Commons Attribution License (CC BY). The use, distribution or reproduction in other forums is permitted, provided the original author(s) and the copyright owner(s) are credited and that the original publication in this journal is cited, in accordance with accepted academic practice. No use, distribution or reproduction is permitted which does not comply with these terms.
*Correspondence: Juwon Drake, anV3b25kcmFrZUBnbWFpbC5jb20=