
94% of researchers rate our articles as excellent or good
Learn more about the work of our research integrity team to safeguard the quality of each article we publish.
Find out more
ORIGINAL RESEARCH article
Front. Future Transp., 12 October 2022
Sec. Connected Mobility and Automation
Volume 3 - 2022 | https://doi.org/10.3389/ffutr.2022.972133
This article is part of the Research TopicTransport Demand Management in the Era of App-influenced MobilityView all 4 articles
 Jorge Ubirajara Pedreira Junior1*
 Ernesto Pereira Galindo2
 Augusto Herrmann Batista3
 Cira Souza Pitombo1
 Antonio Nelson Rodrigues da Silva1
The COVID-19 pandemic has brought about considerable changes to human mobility. Although circulation restrictions are being lifted worldwide following the mitigation of the crisis, the understanding of its long-term effects is still limited. This paper addresses the situation of business meeting trips made by public officials in Brazil by gauging the level shift in the number of trips, the pace of recovery in the aftermath and whether there is any perspective of returning to a pre-pandemic baseline in the near future. To answer these questions, more than 420,000 trips comprising 5 years of operation of the “TaxiGov” ridesourcing system were evaluated in the framework of a dynamic regression model based on an Interrupted Time Series analysis with Autoregressive Integrated Moving Average errors. We found that the baseline level of meeting trips plummeted more than 80% with the onset of the COVID-19 pandemic, an unprecedented effect that was not matched by any major external shock in recent human history. Based on a counterfactual scenario, more than 138,000 expected trips did not occur considering only the first year of the pandemic (April 2020 to March 2021), which is roughly three times as much as the actual number of trips in the same period. Furthermore, based on the time series’ characteristics, a forecast for the following year indicates that the number of business trips will be still behind the baseline figures of 2018 and 2019. We provide solid evidence that the COVID-19 might have produced longstanding (and perhaps irreversible) effects in business meeting trips in the Brazilian public sector. Important policies implemented throughout this period, such as the regulation of teleworking in the public sector, and the incorporation of new working habits after an extended period of adaptation are probably the main reasons behind these findings. Finally, we emphasize that the reduced environmental impacts ensuing from this decreased mobility could be further expanded by substituting car trips with microbus/van lines serving the main origin-destination trip pairs or by adding ridesharing/carpooling options within the existing ride sourcing system.
Business meetings are a universal practice in the everyday life of any organization. Defined as a synchronous interaction of two or more people to coordinate tasks and achieve a shared objective (Standaert et al., 2016), these gatherings provide a forum for creative thinking, information sharing, problem-solving and decision-making (Karl et al., 2021). In a globalized economy, face-to-face meetings are often performed by workforce allocated in dispersed business units, thereby producing a significant number of trips (Faulconbridge and Beaverstock, 2008; Jones, 2009). Since this demand is often supplied by long-distance journeys (Aguilera, 2008; Beaverstock et al., 2009), their environmental impacts are a major by-product of such a phenomenon (Aguiléra, 2014). In fact, although trip distances greater than 100 miles accounts for less than 1% of all vehicle trips in the United States, their contribution to the overall household-based vehicle miles traveled (VMT) are higher than 15% (Li et al., 2022).
Nevertheless, the unprecedented progress on Information and Communication Technologies (ICTs) has fostered a long-standing debate about the potential for face-to-face business meetings to be replaced by synchronous distance communication (Green and Hansell, 1984; Arvai, 1994; Mokhtarian and Salomon, 2002; Salomon and Mokhtarian, 2007; Aguilera, 2008; Andreev et al., 2010; Li et al., 2022). Some advantages of meeting virtually are cost savings and increased business responsiveness, which was thought to considerably affect companies’ competitiveness (Green and Hansell, 1984). Therefore, it was predicted that business travel substitution could reach 25% by 2010 and 35% by 2020, owing to further technological advances and lifestyle changes (Arvai, 1994). Although cross-elasticities of communications with private and public transport calculated in the period of 1960–1986 indicated a modest substitution (Selvanathan and Selvanathan, 1994), the uptake of teleconferencing observed in the 1990s was still sluggish (Button and Maggi, 1995). A possible explanation relates to the expressive fixed and variable costs of telecommunications at that time, in which only meetings involving long distances, short duration and many participants made travel worthy of substitution by teleconferencing (Salomon et al., 1991). Furthermore, early empirical evidence showed that the impact of teleconferencing was more likely to be complementarity (or modification) than substitution (Mokhtarian, 1988; Mette, 1995; Denstadli, 2004). Indeed, with the increased opportunity of accessing closer videoconference rooms, a rise in meeting attendance was expected, which could more than compensate the alternative of long-distance trips with a lower number of participants, in VMT terms (Mokhtarian, 1988). Another reason stems from the fact that the expansion of social relationships provided by increased virtual interactions might stimulate new travel that would not occur if teleconferences did not occur in the first place (Denstadli, 2004).
In the 21st century, the analysis of such a phenomenon is challenged by two major difficulties. First, the research landscape has changed considerably as many technological innovations have made telecommunications much cheaper and more readily available (Salomon and Mokhtarian, 2007; Denstadli et al., 2013). In this new era, household and mobile broadband Internet has become increasingly faster and more reliable, free software with multiple functionalities were launched (including web-based chats, presentation tools and multimedia streaming) and new devices, such as rapidly adopted PC web-cameras and smartphones (Andreev, Salomon and Pliskin, 2010; Denstadli et al., 2013). These advances have moved the bar of teleconferencing from being exclusive to expensive in-company videoconference rooms and have led to its “domestication” (Salomon and Mokhtarian, 2007). Unsurprisingly, amidst this unceasing technological evolution, research concerning the effects of video conferencing on business travel have become rapidly obsolete (Andreev et al., 2010). Throughout this period, empirical studies have proven that the choice of ICTs is contingent upon multiple aspects, such as organizational characteristics, individuals’ attitudes and technological features (Arnfalk and Kogg, 2003; Andreev et al., 2010; Denstadli et al., 2013; Julsrud et al., 2014). Moreover, actual figures show that global business travel spending increased steadily from US$ 601.7 billion, in 2000, to nearly US$ 1.3 trillion, in 2019 (López, 2022), showing little evidence of substitution throughout this period (Denstadli, 2004; Denstadli et al., 2013). As for 2019, more than 147 million business trips were made in the European Union, whereas 464 million of these trips were made in the United States (Eurostat, 2022; Flynn, 2022)—corresponding to roughly 11% and 14% of the total number of trips in each case, respectively.
The second research challenge is associated with the unanticipated effects of the COVID-19 pandemic, which produced a 60% cut in business travel expenditures in 2020 (López, 2022). In the past, it was shown that major external shocks, such as the Oil Crises (1973 and 1979), the Gulf Wars (1991 and 2003), the September 11 terrorist attack (2001), the SARS epidemic (2003) and the 21st century global financial crisis (2007-2008), imposed significant setbacks on business travel—which also led to surges in videoconferencing—but with limited long-term sustained effects (Arvai, 1994; Button and Maggi, 1995; Denstadli, 2004; Njegovan, 2006; Salomon and Mokhtarian, 2007; Vorndran, 2011). Although the recovery of business travel is ongoing and market research agencies expect a considerable growth to a worldwide US$ 2.0 trillion spending on business trips by 2028 (Valuates Reports, 2022), the impact of the COVID-19 pandemic cannot be compared to previous cases. Admittedly, the temporal and geographical extension of the current crisis are substantially higher, representing a life-changing episode that may induce new habits and lifestyles (Gardner, 2009; Larouche et al., 2020).
As circulation restrictions emerged at the beginning of the pandemic, teleconferencing—more than any other teleactivity—remarkably replaced its physical counterpart (de Haas et al., 2020; Mouratidis and Papagiannakis, 2021; Mouratidis and Peters, 2022). This was unequivocally reflected in the boom of videoconferencing platforms (Marks, 2020): Zoom grew from 10 million users in December 2019 to 200 million users at the end of March 2020; Skype increased 70% (up to 40 million users) from February to March 2020; and Microsoft Teams usage boosted 200% in the overall duration of video calls within only 15 days (from 16 March to 31 March), increasing from 900 million to 2.7 billion minutes. Besides recording the changes on both physical meetings and teleconferencing, researchers were also concerned about other issues such as the forced transition to a new organizational lifestyle (Richter, 2020), the digital security troubles—e.g., the “zoombombing” virtual attacks—(Marks, 2020; Elmer et al., 2021), the physiological implications of long and repeated exposition to virtual meetings—which have been popularly coined as “Zoom fatigue”—(Baker and Murphy, 2021; Karl et al., 2021) and the individuals’ attitudes and intentions toward virtual meetings (Hiselius and Arnfalk, 2021; Prasetyo et al., 2022). As a response to these drawbacks, many guidelines on how to plan and conduct virtual meetings have been proposed (Rubinger et al., 2020; Standaert et al., 2021a; Standaert et al., 2021b), which could enhance the acceptability of this practice in the long-term.
Although this topic has been widely investigated, there are still important gaps to be filled in the literature. First, most studies are particularly focused on business air travel, especially those produced before the pandemic (Mette, 1995; Denstadli, 2004; Lu and Peeta, 2009; Haynes, 2010; Denstadli et al., 2013). Arguably, very little is known about the effects on business meetings trips considering the intra-urban or regional travel context, which has also been extremely impacted by the COVID-19 pandemic. Second, while attitudes and intentions are considered strong markers of future behavior, these variables can sometimes lead to imprecise predictions. An example can be drawn from the study carried out by Hiselius and Arnfalk (2021), wherein 45% of the individuals of a group of public officials in Sweden claimed that none of their meetings could be replaced by teleconferencing in a survey conducted before the pandemic. During the crisis, 90% of them managed to complete most of their business tasks within virtual collaboration (only 3% were canceled) and had their perceptions about virtual working drastically changed (90% stated that they would become much better at collaborating virtually). Third, no study (to the best of the authors’ knowledge) measured the dynamics of business meeting trips spanning all the pandemic phases. Indeed, only the first wave of the pandemic or the period immediately after—the first half of 2020 or the beginning of the second half of 2020—were investigated (de Haas et al., 2020; Hiselius and Arnfalk, 2021; Mouratidis and Papagiannakis, 2021; Mouratidis and Peters, 2022). Lastly, the authors are also not aware of any study addressing business meeting trips in the Global South context, although its metropolises have experienced numerous mobility problems due to their hasty urbanization in the 20th century (Smit, 2021), thereby deserving considerably more attention.
Given the aforementioned limitations, the present study addresses the following questions:
• How severe was the COVID-19 pandemic impact on the volume of business meeting trips?
• How did these trips recover 2 years after the onset of the crisis?
• Based on the recovery characteristics, what are the prospects for the business meeting trips made by public officials in the near future?
This was done by analyzing a comprehensive trip dataset from a ridesourcing system designed for public officials from the Federal Government of Brazil (FGB), known as “TaxiGov.” We focus on the metropolitan region of the capital Brasília, whereby more than 420,000 trips for meeting purposes were recorded between January 2017 and February 2022, corresponding to roughly 2,452,000 km traveled. The variable of concern is the number of such trips performed each month. Therefore, the main objective of this study is to estimate the dynamics of the volume of these trips in the timespan under study to answer the research questions raised. By considering actual trip data from both before and during all of the COVID-19 pandemic phases, we expect to provide a more detailed picture of this phenomenon. It is important to highlight that we did not address the contribution of specific factors such as the epidemic evolution (e.g., surges due to virus variants), level of government response, resilience of the local healthcare system and individuals’ risk perception in the fluctuation of these trips. Indeed, our interest lies in the net effect of the pandemic on the public officials’ meeting trips, taking into account all of its inherent time-related features.
Beyond this introduction, this paper is structured as follows. Section 2 explains the ridesourcing system, its dataset and the methodological procedure to meet the paper’s objectives. Next, Section 3 presents the resulting model and its forecasts, which is followed by a discussion of these results in Section 4. Finally, Section 5 concludes with a summary of the objectives achieved, the main contributions, limitations, and opportunities for future research.
At the beginning of 2017, the FGB launched a ride-hailing system named “TaxiGov,” designed to meet the intra-urban and regional travel demand for more than 530,000 public agents (Normative Instruction No. 10 of 23 November 2018; Ministry of Economy - FGB, 2022). This initiative is part of a broader FGB program aiming at progressively eliminating self-owned car fleets in the state bureaucracy and shifting the transport management of the public sector to a Mobility-as-a-Service (MaaS) paradigm. The service was first introduced in the Integrated Development Region of the Federal District and Surroundings (in Portuguese: Região Integrada de Desenvolvimento do Distrito Federal e Entorno, or RIDE), which encompasses the Federal District (where the federal capital Brasília is located) and other 22 neighboring cities (map of Figure 1).
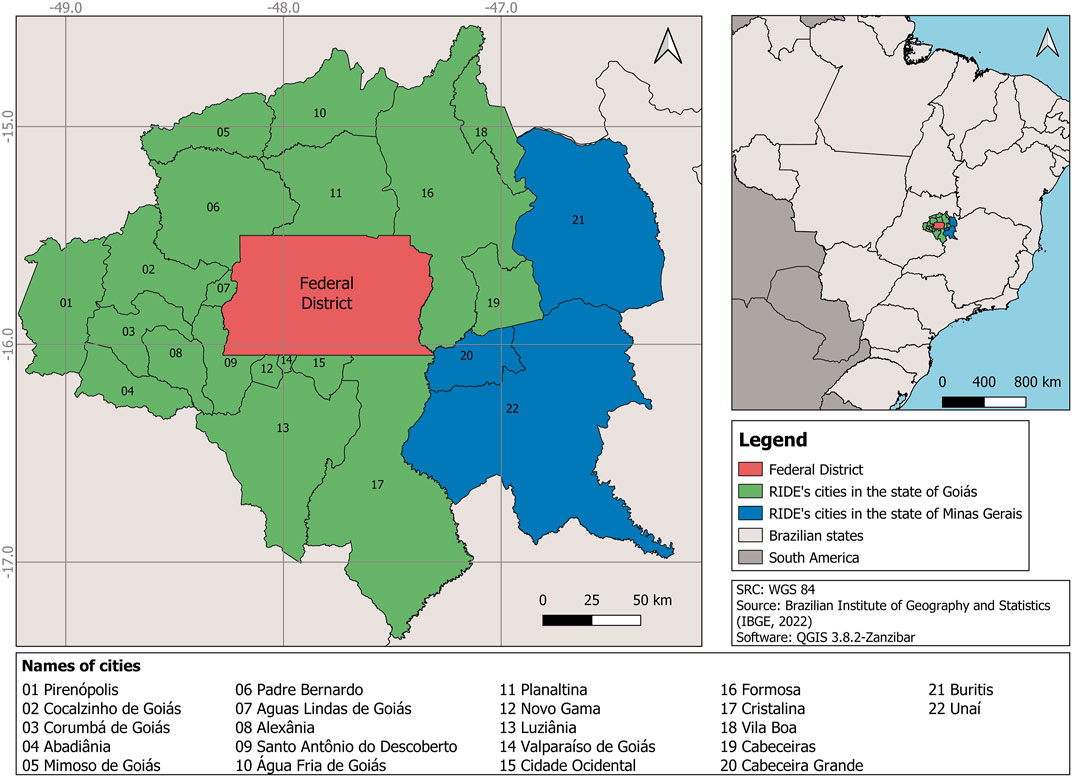
FIGURE 1. Map of the integrated development region of the federal district and surroundings (RIDE).
In January 2018, the TaxiGov system was defined as the exclusive means of contracting intra-urban or regional land transportation services for the direct public administration of the Executive branch of the FGB in the RIDE (Executive Order No. 6 of 15 January 2018). By April 2018, all public agencies in this scope had fully transitioned to the TaxiGov service (Lopes, 2019). As of 2019, it was also implemented in public agencies operating outside the RIDE, such as Rio de Janeiro and São Paulo (although the exclusive service provision by the TaxiGov system has not been yet imposed in these cities). Similar to other ride-hailing systems (e.g., Uber, Lyft), TaxiGov is an on-demand transport service whereby available registered drivers are designated to individual travelers through a mobile- and web-based application. The provision of the service is carried out by a private company which is contracted in each city/region by means of a public tendering procedure.
Besides managing the system, the service provider collects and stores important data regarding each trip, such as its purpose (e.g., meeting attendance, courier service, technical visits), time of boarding and unboarding, distance traveled, ride cost and the geographical coordinates of its origin and destination. Data concerning the usage of the system by each public agent is also registered, although these are not the focus of the present study. This database is regularly audited by a team of Data Engineering (DE) specialists from the Ministry of Economy to ensure its consistency and timely public availability. The data can be downloaded from the TaxiGov dataset webpage (https://dados.gov.br/dataset/corridas-do-taxigov, last accessed on 30 March 2022), which is updated on a daily basis.
Since its launching, three different companies have been awarded with the contract of the service in the RIDE. The first lasted from February 2017 to February 2019, the second from March 2019 to August 2019 and the third has been operating since September 2019. Because the TaxiGov webpage only provides data from the third period, previous data were obtained from a direct request to the TaxiGov management team from the Ministry of Economy of the FGB.
To answer the research questions regarding the study objectives, the methodological procedure depicted in Figure 2 was proposed. Given the dynamic nature of the data, a time series modeling approach was chosen as the main analytical framework of the study.
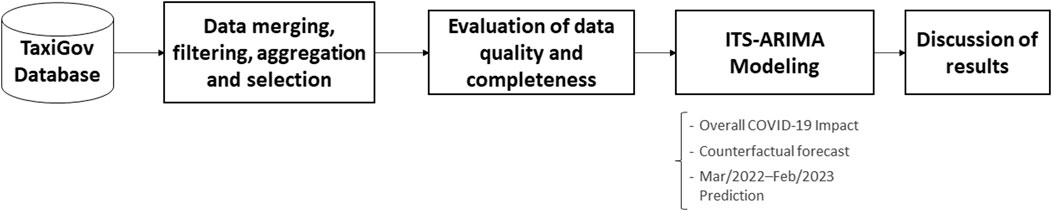
FIGURE 2. Flowchart of the methodological procedure.
First, the datasets obtained from both origins were row-wise merged into a single data table. Next, this dataset was filtered according to the trip status (only completed rides were selected), to the location of the service provision (only trips in the RIDE) and to the trip purpose (only meeting trips). Then, a temporal aggregation of trips was carried out to produce a time series of the number of meeting trips by month. This monthly aggregation was chosen for a better tractability of seasonality (when compared to daily or weekly data) and to avoid issues related to small values when treating count data as continuous (Hyndman and Athanasopoulos, 2018). Next, the dataset was evaluated according to its quality and completeness. If any inconsistency was found, the issue was brought to both the TaxiGov management team and the DE support from the Ministry of Economy to be discussed. Whenever needed, data correction and/or imputation was carried out to enable the later analytical steps.
To meet the research objectives, a dynamic regression model represented by an Interrupted Time Series (ITS) using autoregressive integrated time series model (ARIMA) analysis was carried out. An ITS analysis, also known as “intervention analysis,” is a statistical technique designed to assess the effects of an intervention or an event of interest on a dynamic dependent variable (Ferron and Rendina-Gobioff, 2005). This quasi-experimental design is commonly used when randomized controlled trials are not feasible or ethically admissible (Shadish et al., 2001), which are largely used in the context of healthcare research (Bernal et al., 2016; Hudson et al., 2019; Hategeka et al., 2020). Although it is less common within the transportation literature, some applications can also be found, such as the evaluation of the impacts of public transportation strikes on bicycle use (Fuller et al., 2012; Fuller et al., 2019), the enforcement of mandatory helmet use laws (Wang et al., 2013; Bonander et al., 2014) and the assessment of external shocks on air passenger traffic (Ito and Lee, 2005a; Ito and Lee, 2005b; Njegovan, 2006).
In an ITS analysis, the effects of an event/intervention on the outcome
For the present analysis,
As the coefficients are related to the natural log of
An alternative model considering a decreasing growth rate after the pandemic was also adjusted. In this case, the stepwise function
To incorporate the autocorrelation characteristics of the time series in the model, the error term (
where
The values of
Having the estimated parameters of the ITS-ARIMA model, two forecasts were produced. The first was formulated to conceive a counterfactual scenario of almost 2 years after the pandemic, in the timespan of April 2020 to February 2022. This was done by considering the values of the intervention variables as zero when estimating the number of trips (i.e.,
It is also worth mentioning that the median trip distance presented a slight increase during the pandemic, probably due to the elimination of short-distance trips. Indeed, it is possible that routine meeting trips made by workers from different FGB agencies, which are located nearby in the Esplanada dos Ministérios region (see Figures 3, 4), decreased more than other non-routine long-distance trips during the pandemic due to them being replaced by teleconferencing. However, this median trip distance returned to the pre-pandemic figure throughout the pandemic period of analysis (2 years after its onset). Although this could be a source of contradictory results, all the statistical procedures were also carried out for the variable total distance traveled, which resulted in similar findings.
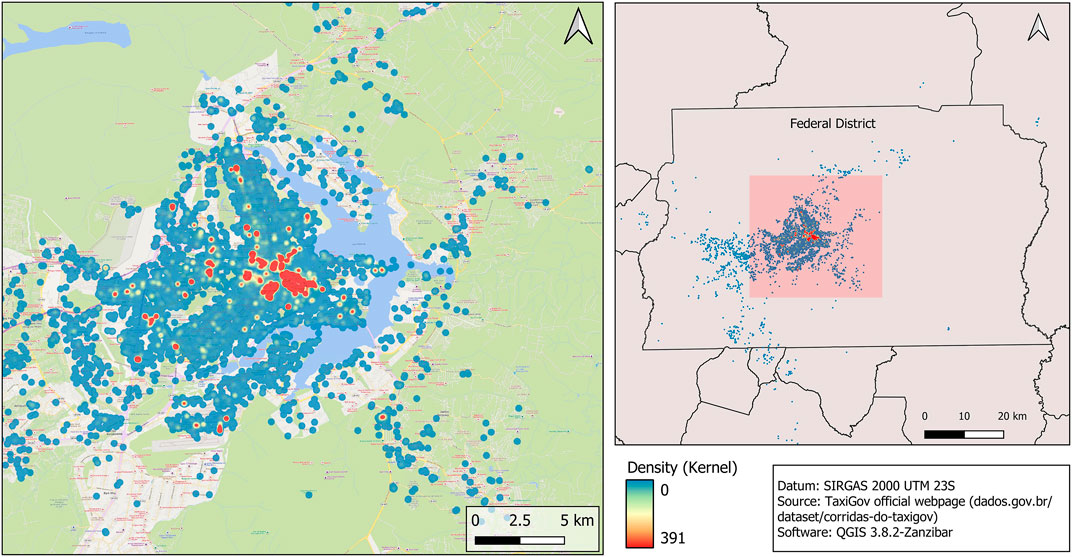
FIGURE 3. Heatmap of the most common origins of meeting trips in the RIDE.
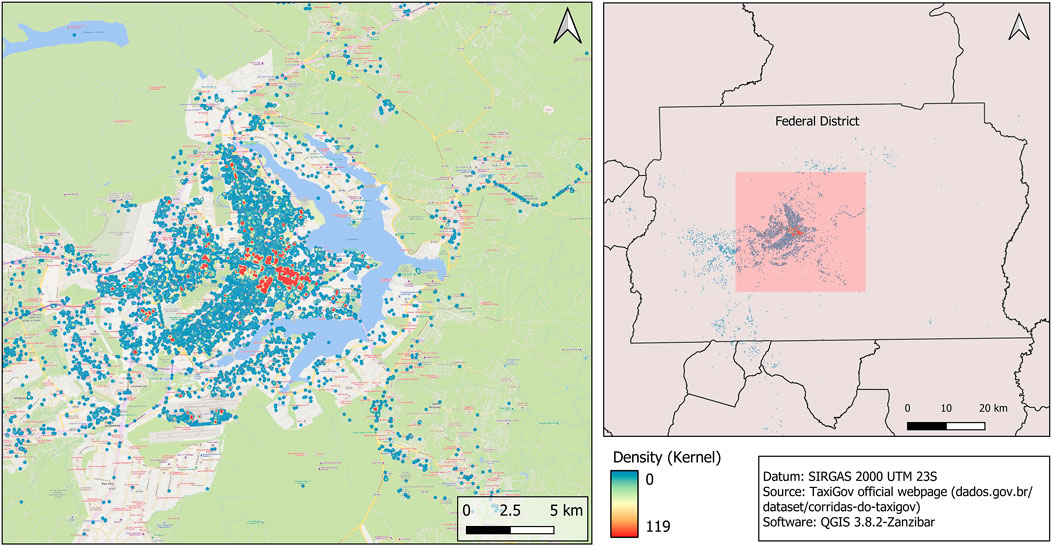
FIGURE 4. Heatmap of the most common destinations of meeting trips in the RIDE.
Both the data preparation and analytical steps from this methodological section were computationally performed using the “fable” and the “fabletools” packages for the R programming language (O’Hara-Wild et al., 2021a; O’Hara-Wild et al., 2021b).
From the launching of the service (February 2017) until the end of February 2022, more than 716,000 rides have been made in the TaxiGov service, totaling roughly 5,600,000 km traveled. The main trip purposes were business meetings (59.5%) and documentation handling (20.8%), followed by training (2.9%), technical visits (2.7%), commuting (1.2%), court hearings (0.6%) and inspection (0.3%). The purposes of the remaining trips were not specified. Out of this total, almost 686,000 trips were made in the RIDE (95.7%), which corresponded to 5,043,972 km traveled (89.9%). This difference in proportions between the number of trips and total distance can be attributed to the fact that the median distance traveled in the RIDE (4.2 km) is considerably lower than in São Paulo (16.4 km) or in Rio de Janeiro (12.3 km). Indeed, although any trip starting and ending within the large area of RIDE is allowed (Figure 1), approximately 99.74% of them occur in the Federal District. More specifically, these trips’ origins and destinations are mainly situated in the center region of Brasília, as shown in the heatmaps of Figures 3, 4 (produced by Kernel density estimation), which coincides with the location of the FGB buildings (known as Esplanada dos Ministérios). In the RIDE, 61.5% of the trips were produced for physical meeting purposes, making a total of 422,277 rides and 2,452,061 km traveled, which are the focus of the present study.
The evolution of trips for meeting purposes in the RIDE along with important events throughout the period of analysis are summarized in Figure 5. It is important to highlight that for the months of transition between different service providers (March-April 2018 and September-October 2019), a reduced number of trips was registered, which did not correspond to the reality according to the TaxiGov management team. This inconsistency was attributed to operational issues occurring during these transitions, when the old company’s system had to be replaced by the new company’s system. Therefore, an imputation of the data for these months were carried out based on a seasonal ARIMA model adjusted to the time series between spanning the launching of the system (February 2017) to the last month before the pandemic (March 2020). For these months of transition, the unrealistic values were considered missing. Then, the model
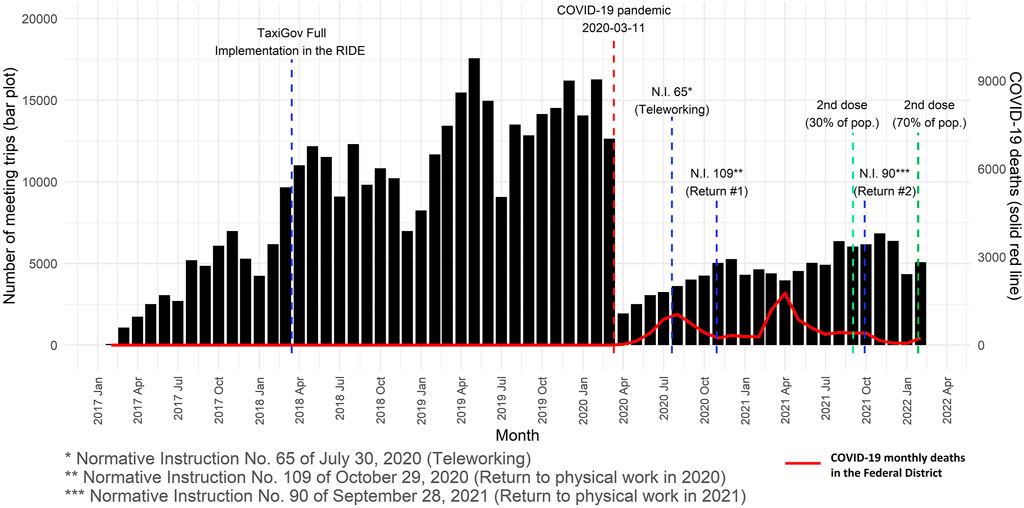
FIGURE 5. Evolution of the number of meeting trips and important events in the time series.
After the declaration of the pandemic status on 11 March 2020, by the World Health Organization, a remarkable drop in trips for meeting purposes in the RIDE can be noticed. A positive growth trend is also seen thereafter, but still unable to recover the pre-pandemic mobility levels. Important events occurring during the pandemic were the enactment of normative instructions issued by the FGB, such as the regulation of remote work in the FGB administration on 20 July 2020 (Normative Instruction No. 65 of 30 July 2020). Its main aspects refer to the authorization of partial and full teleworking for public officials according to the type of activity (only those occupations which did not affect the capacity to serve internal and external public or did not strictly demand physical presence were allowed), the procedures for managing activities in this new setting (e.g., definition of workplans, goals, performance appraisal) and orientations on continuously monitoring the overall working regime in each sector. Although teleworking had already been an option before the beginning of the pandemic, the new practice was made official and might constitute an irreversible long-term change in the FGB administration with important mobility implications. After the end of the first and second pandemic waves in Brazil, the FGB also issued guidelines on how to gradually return to in-person work on 29 October 2020 (Normative Instruction No. 109 of 29 October 2020) and on 28 September 2021 (Normative Instruction No. 90 of 28 September 2021). These standards guided sanitation measures, workplace crowding, individual prioritization for continuing remote work (according to COVID-19 comorbidities) and recommendations for conducting meetings and events remotely. Therefore, even when returning to the workplace, the FGB employees were officially advised to not meet physically. It is also important to mention that by 2 November 2021, 30% of the Brazilians had been fully vaccinated, following a significant acceleration in the vaccination rate in the next months to reach 70% on 27 January 2022 (Ritchie et al., 2022). Consequently, the mortality rate was severely reduced thereafter, which induced a widespread relaxation of social distancing measures. Despite these positive recent facts, meeting trips have not yet recovered to pre-pandemic mobility levels.
As mentioned in the methodological section, an ITS-ARIMA model was adjusted to the data in the period of April 2018 to February 2022. A summary of the models selected by the Hyndman-Khandahar algorithm for both versions (the constant growth change and the decreasing growth change) is shown in Table 1. In both cases, the error term of the ITS part of the model (
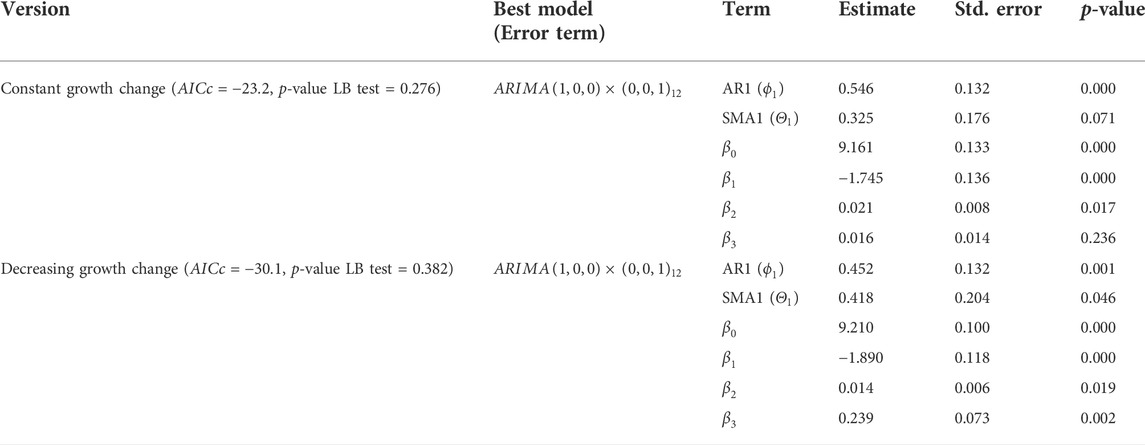
TABLE 1. Coefficients of the ITS-ARIMA models.
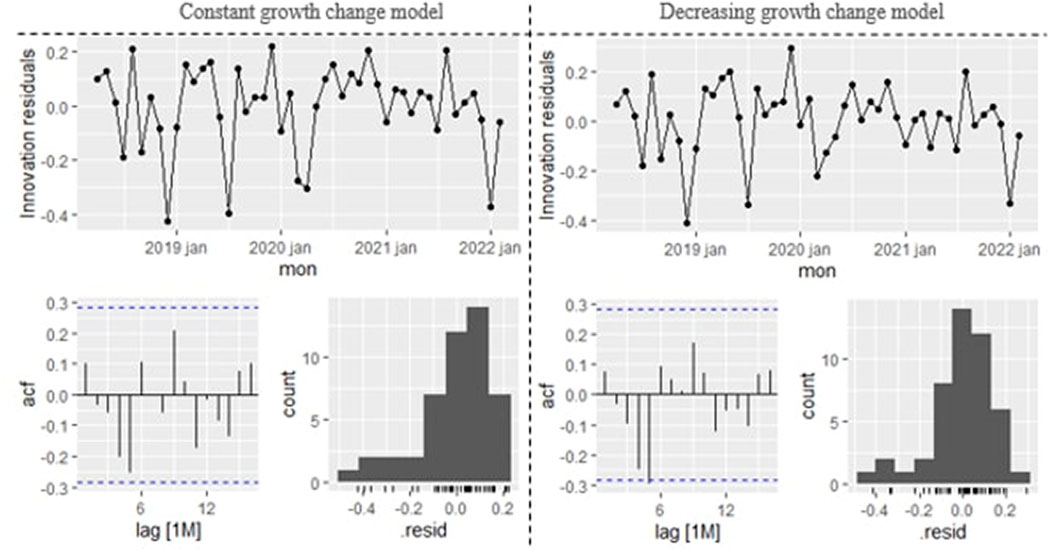
FIGURE 6. Residuals’ diagnosis plots of the models (time series, autocorrelation function, and histogram).
As the version with a decreasing growth change produced the best AICc value, this model was used in the following analyses. Admittedly, a visual inspection in the time series during the pandemic in Figure 5 clearly shows that the recovery in the number of trips does not seem to be steadily increasing during the pandemic.
In its equation form, the chosen model can be shown as:
As can be seen in Table 1, the error term (
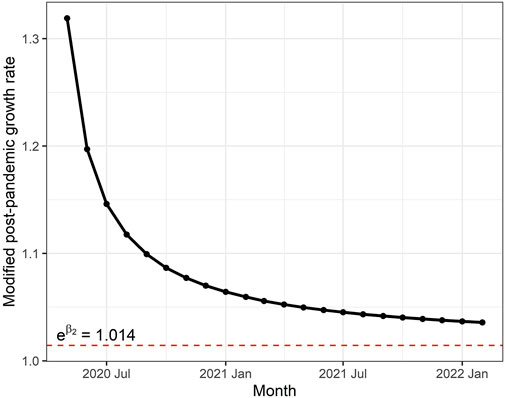
FIGURE 7. Modified post-pandemic trend throughout the pandemic period:
Using this model to hypothesize the counterfactual scenario of almost 2 years when there was no pandemic (from April 2020 to February 2022), one can clearly notice the magnitude of the crisis effect in Figure 8. Comparing the actual number of trips to the monthly point forecast estimates only in the first year (from April 2020 to March 2021)—where the prediction interval is more precise—nearly 138,000 “lost” trips are found in this period, corresponding to almost three times of what really occurred (approximately 46,000 trips). For the following 11 months (from April 2021 to February 2022), this number is even higher, as more than 155,000 trips were not taken, which is still considerably greater than the actual number in the same period (almost 60,000 trips).
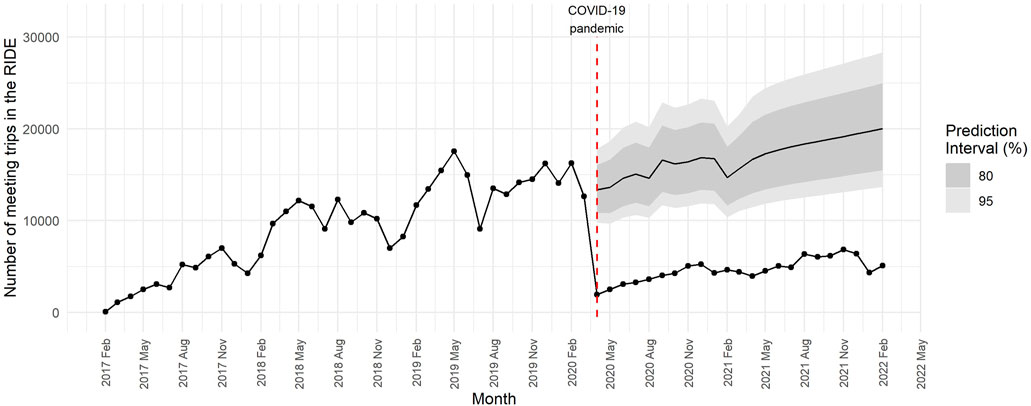
FIGURE 8. Counterfactual scenario of the number of meeting trips when there was no COVID-19 pandemic.
Finally, considering the forecast for the following 12 months (March 2022 to February 2023), it can be ascertained that these figures are closer to what happened in 2018, although the predicted number of trips still lag far behind those levels of 2019 (Figure 9). It is important to mention that the model considers that the number of trips increases indefinitely over time, as the post-pandemic growth asymptotically approaches the secular monthly growth (1.4%), but never subsides this value. Therefore, the prediction can only be supported if this trend holds for the horizon under analysis (i.e., if meeting trips do not either level off, accelerate or decrease).
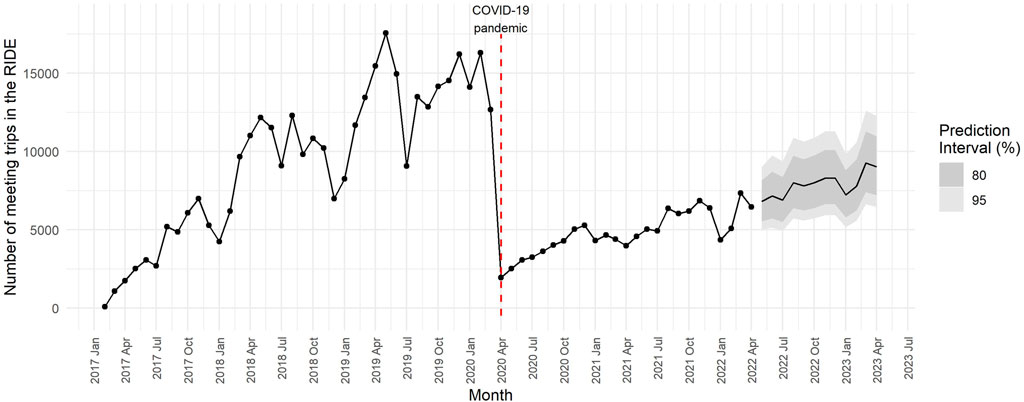
FIGURE 9. Forecast of the number of meeting trips for the following year (March 2022 to February 2023).
It is important to contrast these results with other major exogenous shocks reported by previous studies. Although none of them refer specifically to business meeting trips and are limited to the air transport industry, they are still the best reference of comparison. Considering level changes in the first Gulf War (1991), air passenger flow decreased 6.1% in the UK (Njegovan, 2006) and 6%–7% in Norway (Lian and Denstadli, 2004). In Spain, this effect was indirectly measured by the 14% drop in the number of nights spent in hotels (Garín-Muñoz and Amaral, 2000). For the September 11 terrorist attack (2001), the same rate of decrease on air passenger flow was again observed in Norway (Lian and Denstadli, 2004), whereas the US suffered a major setback, with a 30% fall in the number of trips (Ito and Lee, 2005a). Interestingly, air traffic grew 0.6% in the UK in 2001 despite the terrorist attack (Njegovan, 2006). Although evidence for other crises is scant, one can also mention the joint effect of the SARS outbreak with the second Gulf War in Iraq, in 2003, in which air traffic decreased 4% in the US (Ito and Lee, 2005a). Comparing these results with the COVID-19 pandemic impact, the 60% contraction in global air passenger traffic in 2020 (World Bank, 2022) is unprecedented and is not even close to being matched by any of these former crises. The correlated outcomes of the present study endorse this claim, with the number of trips for meeting purposes in the urban/regional trips of public officials plummeting more than 80% in Brazil.
Regarding the recovery in the aftermath of each crisis, a great variability of outcomes can be observed. For Norway, the impacts of both the Gulf War and the September 11 terrorist attack were rapidly overcome, with air passenger traffic returning to normality after 4–5 months (Lian and Denstadli, 2004). Considering domestic flights in the US, research concerning the September 11 attack with data up to the end of 2002 (Blunk et al., 2006) or until the end of 2003 (Ito and Lee, 2005a) found that market was struggling to return to pre-crisis levels. However, a later study covering trips up to 2007 showed that after overcoming subsequent crises (the joint SARS outbreak and second Gulf War crises in 2003), a recovery to normality in air passenger services was close to being reached (Clark et al., 2009). The same case was observed for Europe, while the long-term trend for domestic flights from Canada and Japan were not affected by the 9/11 terrorist attack (Ito and Lee, 2005b). For the COVID-19 pandemic, global passenger traffic was 60% lower than a counterfactual scenario by mid-2021 and there is an expectation that the demand will still be 30% behind by the end of 2022, as estimated in a study by the Airports Council International (AIC, 2021). This is also in line with our findings, which demonstrated that the recovery in business meeting trips of public officials at the urban/regional level is far from sufficient to return to a pre-crisis baseline (let alone a counterfactual scenario for the present moment). Indeed, considering only the first year of the pandemic in Brazil, only 1/4 of the expected trips took place, and the growth rate appears to have decreased over time.
Several reasons are claimed to justify these differences between countries in previous crises. The first two are related to the dynamics of the individuals’ risk perception during and after the external shock in each nation. First, how directly the population was affected by the event (such as the epidemic SARS in Asian countries and the September 11 terrorist attack in the US) influences both the effect size and the recovery rate (Ito and Lee, 2005b). Second, the level of geopolitical involvement of each nation with the crisis, like the protagonist role of the US in the Gulf War (Thomchick, 1993), prolongs the sensation of ongoing threat of further terrorist attacks (Vlahov et al., 2002; Ito and Lee, 2005b). Third, the presence of substitute travel modes is determinant when analyzing the impacts on a specific mode, such as the availability of a dense rail network in Europe which has delayed the return of air passenger traffic to normality therein (Ito and Lee, 2005b). Fourth, internal affairs—such as the 1989-1993 economic recession in the UK which overlapped with the first Gulf War in 1991 (Njegovan, 2006)—might happen concurrently and, thus, must be considered in the evaluation. Against this background, COVID-19 presents a challenging scenario of recovery to be investigated. Multiple waves of increased mortality, while vaccines were not available throughout almost 2 years or by virtue of low vaccination rates even after that, dragged out circulation restrictions or voluntary precautionary behavior for a considerable amount of time (Rahmandad et al., 2021). Meanwhile, individuals continued to resort to new ways of dealing with the crisis and keeping the economy running, such as remote work and teleconferencing (Mouratidis and Papagiannakis, 2021). This lengthened process has probably helped to consolidate a permanent incorporation of teleactivity habits that may not be easily reversed to pre-crisis levels (Hiselius and Arnfalk, 2021; Carraher-Wolverton, 2022). In the Brazilian public sector, the regulation of remote work (Normative Instruction No. 65 of 30 July 2020), for example, was not meant to be a palliative measure when it was conceived, but a shift to a new paradigm even after overcoming the crisis. Similarly, a consistent uptake of teleconferencing was registered in the US and in the UK during the Gulf War of 1991, which became part of the base figure in the following years (Arvai, 1994; Button and Maggi, 1995). On the other hand, wherever recovery took place more rapidly, such as in Norway, the impact of this practice was only marginal (Denstadli, 2004). Although the intensity of virtual meetings was not measured in the present study, the reduced number of trips after 2 years associated with the currently milder state of the pandemic indicates that the momentum gained by teleconferencing may not be transitory.
Finally, it is important to highlight that the consequences of the meeting trips were analyzed at an aggregated level. Nevertheless, research on substituting physical meetings by teleconferencing recognizes important peculiarities concerning this phenomenon. For example, each type of meeting requires distinct levels of capabilities, from more trivial features such as hearing attendees’ voices to more complex ones such as experiencing co-location, discerning social cues (such as facial expressions and body gestures) or seeing what attendees are looking at (Standaert et al., 2021b). Usually, meeting objectives, such as building trust or resolving conflicts and disagreements within a group require more advanced capabilities that simple settings, such as audioconferencing and standard videoconferencing cannot deliver. Accordingly, the richness of the medium must match the level of ambiguity in the message to achieve the meeting objective. In these cases, it is claimed that face-to-face meetings or telepresence systems (wherein each person’s voice comes from the direction of their screen image, and lighting and furniture across locations are matched for a seamless look) are the most recommended choices (Standaert et al., 2016). Since our results indicate that meeting trips are still far behind pre-pandemic levels, this can be an indication that these types of meetings are probably not predominant in the data. In any case, an appropriate investigation should be carried out to verify this claim.
This paper evaluated the COVID-19 pandemic impacts on the mobility of Brazilian public officials. By studying a rich official database with more than 420,000 ridesourcing trips for meeting purposes occurring both before and during the crisis, we highlight the main research findings as follows:
• A severe baseline reduction of approximately 15% compared to the pre-pandemic level was observed, an unprecedented effect on this type of activity not matched by any other previous crises.
• The return occurred slowly and with a decreasing rate of recovery, indicating that new working habits, such as teleworking and teleconferencing, might have turned into habitual choice and is preventing the pre-crisis level from returning.
• A forecast carried out for the following year suggests that the number of trips will be still far from closing the gap of the 2019 baseline.
Considering the research background on this topic, the contributions of the present study are fourfold:
a) While the literature is disproportionately focused on air passenger transport, the consequences of the pandemic to meeting trips in the urban/regional context was first revealed and discussed.
b) All the pandemic phases were assessed in the present analysis, in contrast to the current state of knowledge that only considered the impact of the first wave or shortly after.
c) The actual number of trips were measured and not the intentions of performing them, which are prone to serious biases.
d) To the best of the authors’ knowledge, this is the first study to consider these kinds of trips in the Global South context, in which serious urban and mobility problems are frequent and must often be solved with limited resources.
A potential limitation of the study is not having accounted for heterogeneity between different public agencies or sub-types of meeting purposes, as only aggregate data is analyzed (i.e., the overall number of meeting trips across agencies). It might be the case that some of these agencies are more often involved in meetings that strictly requires face-to-face meetings (and/or lack telepresence systems to adequately replace them), whereas others deal mainly with routine exchange of information that are easily managed with virtual gatherings. Thus, these distinct instances might be following opposite trajectories that the model is unable to identify. To circumvent this issue, the use of ITS associated with mixed-effect models is often recommended in the literature (Saeed et al., 2018; Ewusie et al., 2021), which should be taken into consideration in future studies. Another possible drawback is ignoring the business cycle’s specificities of the ridesourcing system in the time series, although this issue was probably attenuated by analyzing only the months in which the system was fully implemented on all agencies. Assessing other types of trips (such as those for documentation purposes) and monitoring the evolution of meeting trips are also highly suggested.
As a final note, it is important to remember that this dataset provides crucial information to understand the mobility of more than half a million Brazilian public agents. Thus, relevant policy-making regarding the transportation demand originating from governmental activity can be designed considering both the supply and the demand sides. Indeed, by knowing the most important origin-destination pairs and their time of occurrence, the reduction in emissions resulting from the pandemic effects could be further amplified by substituting car trips by microbus/van lines or the implementation of ridesharing/carpooling schemes within the existing ridesourcing system. Moreover, given the probable habitual effect resulting from 2 years of pandemic on the choice of teleconferencing, corporate business leaders should not overlook issues related to videoconference fatigue and difficulties in exchanging complex and ambiguous messages. Even considering that meeting trips will not reach pre-pandemic figures within the next 12 months, they are still expected to increase as indicated in the forecasting procedure. Therefore, this trend should be regularly monitored to ascertain whether this practice will still hold in the future. Admittedly, there is an important window of opportunity in this field, which should be pursued by improving the planning and organization of meetings and adopting new technologies such as telepresence systems. By gaining employees’ support with these measures, the benefits of reduced emissions during the pandemic could be incorporated permanently, avoiding a return to an unnecessary increased mobility ensuing from physical meetings.
Publicly available datasets were analyzed in this study. This data can be found here: https://dados.gov.br/dataset/corridas-do-taxigov.
The authors confirm contribution to the paper as follows. Study conception and design: JP, EG, and CP; Data collection and curation: JP, EG, and AB; Analysis and interpretation of results: JP, EG, and CP; Draft manuscript preparation: JP, EG, AB, AR, and CP. All authors reviewed the results and approved the final version of the manuscript.
This research was carried out with the financial support from the Coordination for the Improvement of Higher Education Personnel (CAPES—Finance Code 88887.505770/2020-00) and from the Brazilian National Council for Scientific and Technological Development (CNPq—Finance Codes 308436/2015-6 and 304345/2019-9).
We would like to thank the public officials from the Ministry of Economy of the Federal Government of Brazil for the data concession and availability for supporting our research efforts.
The authors declare that the research was conducted in the absence of any commercial or financial relationships that could be construed as a potential conflict of interest.
All claims expressed in this article are solely those of the authors and do not necessarily represent those of their affiliated organizations, or those of the publisher, the editors and the reviewers. Any product that may be evaluated in this article, or claim that may be made by its manufacturer, is not guaranteed or endorsed by the publisher.
Aguilera, A. (2008). Business travel and mobile workers. Transp. Res. Part A Policy Pract. 42 (8), 1109–1116. doi:10.1016/j.tra.2008.03.005
Aguiléra, A. (2014). “Business travel and sustainability,” in Handbook of sustainable travel (Dordrecht: Springer), 215–227. doi:10.1007/978-94-007-7034-8_14
AIC (2021). The impact of COVID-19 on the airport businessand the path to recovery. Available at: https://aci.aero/2021/11/01/the-impact-of-covid-19-on-the-airport-business-and-the-path-to-recovery-3/(Accessed May 5, 2022).
Andreev, P., Salomon, I., and Pliskin, N. (2010). Review: State of teleactivities. Transp. Res. Part C Emerg. Technol. 18 (1), 3–20. doi:10.1016/j.trc.2009.04.017
Arnfalk, P., and Kogg, B. (2003). Service transformation - managing a shift from business travel to virtual meetings. J. Clean. Prod. 11 (8), 859–872. doi:10.1016/S0959-6526(02)00158-0
Arvai, E. S. (1994). Telecommunications and business travel: The revolution has begun. Transp. Res. Circular 425, 28–31.
Baker, E. L., and Murphy, S. A. (2021). Conducting successful virtual meetings while managing COVID fatigue. J. Public Health Manag. Pract. 27 (2), 208–212. doi:10.1097/PHH.0000000000001335
Beaverstock, J. V., Derudder, B., Faulconbridge, J. R., and Witlox, F. (2009). International business travel: Some explorations. Geogr. Ann. Ser. B Hum. Geogr. 91 (3), 193–202. doi:10.1111/j.1468-0467.2009.00314.x
Bernal, J. L., Cummins, S., and Gasparrini, A. (2016). Interrupted time series regression for the evaluation of public health interventions: A tutorial. Int. J. Epidemiol. 46 (1), 348–355. doi:10.1093/ije/dyw098
Blunk, S. S., Clark, D. E., and McGibany, J. M. (2006). Evaluating the long-run impacts of the 9/11 terrorist attacks on US domestic airline travel. Appl. Econ. 38 (4), 363–370. doi:10.1080/00036840500367930
Bonander, C., Nilson, F., and Andersson, R. (2014). The effect of the Swedish bicycle helmet law for children: An interrupted time series study. J. Saf. Res. 51, 15–22. doi:10.1016/j.jsr.2014.07.001
Button, K., and Maggi, R. (1995). Videoconferencing and its implications for transport: An anglo‐Swiss perspective. Transp. Rev. 15 (1), 59–75. doi:10.1080/01441649508716901
Carraher-Wolverton, C. (2022). The co-evolution of remote work and expectations in a COVID-19 world utilizing an expectation disconfirmation theory lens. J. Syst. Inf. Technol. 24 (1), 55–69. doi:10.1108/jsit-05-2021-0085
Clark, D. E., McGibany, J. M., and Myers, A. (2009). “The effects of 9/11 on the airline travel industry,” in The impact of 9/11 on business and economics. The day that changed everything? (New York: Palgrave Macmillan), 75–86. doi:10.1057/9780230100060_7
de Haas, M., Faber, R., and Hamersma, M. (2020). How COVID-19 and the Dutch ‘intelligent lockdown’ change activities, work and travel behaviour: Evidence from longitudinal data in The Netherlands. Transp. Res. Interdiscip. Perspect. 6, 100150. doi:10.1016/j.trip.2020.100150
Denstadli, J. M., Gripsrud, M., Hjorthol, R., and Julsrud, T. E. (2013). Videoconferencing and business air travel: Do new technologies produce new interaction patterns? Transp. Res. Part C Emerg. Technol. 29, 1–13. doi:10.1016/j.trc.2012.12.009
Denstadli, J. M. (2004). Impacts of videoconferencing on business travel: The Norwegian experience. J. Air Transp. Manag. 10 (6), 371–376. doi:10.1016/j.jairtraman.2004.06.003
Elmer, G., Neville, S. J., Burton, A., and Ward-Kimola, S. (2021). Zoombombing during a global pandemic. Soc. Media Soc. 7 (3), 205630512110353. doi:10.1177/20563051211035356
Eurostat (2022). Number of trips by purpose. Available at: https://ec.europa.eu/eurostat/databrowser/view/tin00188/default/bar?lang=en (Accessed April 7, 2022).
Ewusie, J., Beyene, J., Thabane, L., Straus, S. E., and Hamid, J. S. (2021). An improved method for analysis of interrupted time series (ITS) data: Accounting for patient heterogeneity using weighted analysis. Int. J. Biostat. doi:10.1515/ijb-2020-0046
Executive Order No. 6 of January 15 (2018). Ministry of planning, development and management - Federal Government of Brazil. Brasilia: Federal Government of Brazil.
Faulconbridge, J. R., and Beaverstock, J. V. (2008). “Geographies of international business travel in the professional service economy,” in Mobility and technology in the workplace (London: Routledge), 99–114. doi:10.4324/9780203894354-16
Ferron, J., and Rendina-Gobioff, G. (2005). “Interrupted time series design,” in Encyclopedia of statistics in behavioral science. John Wiley & Sons. doi:10.1002/0470013192.BSA312
Flynn, J. (2022). 25 essential business travel statistics [2022]: Facts about business travel in the U.S. Available at: https://www.zippia.com/advice/business-travel-statistics/(Accessed April 7, 2022).
Fuller, D., Luan, H., Buote, R., and Auchincloss, A. H. (2019). Impact of a public transit strike on public bicycle share use: An interrupted time series natural experiment study. J. Transp. Health 13, 137–142. doi:10.1016/j.jth.2019.03.018
Fuller, D., Sahlqvist, S., Cummins, S., and Ogilvie, D. (2012). The impact of public transportation strikes on use of a bicycle share program in London: Interrupted time series design. Prev. Med. 54 (1), 74–76. doi:10.1016/j.ypmed.2011.09.021
Gardner, B. (2009). Modelling motivation and habit in stable travel mode contexts. Transp. Res. Part F Traffic Psychol. Behav. 12 (1), 68–76. doi:10.1016/j.trf.2008.08.001
Garín-Muñoz, T., and Amaral, T. P. (2000). An econometric model for international tourism flows to Spain. Appl. Econ. Lett. 7 (8), 525–529. doi:10.1080/13504850050033319
Green, D., and Hansell, K. J. (1984). Videoconferencing. Bus. Horizons 27 (6), 57–61. doi:10.1016/0007-6813(84)90094-6
Hategeka, C., Ruton, H., Karamouzian, M., Lynd, L. D., and Law, M. R. (2020). Use of interrupted time series methods in the evaluation of health system quality improvement interventions: A methodological systematic review. BMJ Glob. Health 5, e003567. doi:10.1136/bmjgh-2020-003567
Haynes, P. (2010). Information and communication technology and international business travel: Mobility allies? Mobilities 5 (4), 547–564. doi:10.1080/17450101.2010.510337
Hiselius, L. W., and Arnfalk, P. (2021). When the impossible becomes possible: COVID-19’s impact on work and travel patterns in Swedish public agencies. Eur. Transp. Res. Rev. 13 (1), 17–10. doi:10.1186/s12544-021-00471-9
Hudson, J., Fielding, S., and Ramsay, C. R. (2019). Methodology and reporting characteristics of studies using interrupted time series design in healthcare. BMC Med. Res. Methodol. 19 (1), 137–7. doi:10.1186/s12874-019-0777-x
Hyndman, R. J., and Athanasopoulos, G. (2018). Forecasting: Principles and practices. Melbourne: OTexts.
Hyndman, R. J., and Khandakar, Y. (2008). Automatic time series forecasting: The forecast package for R. J. Stat. Softw. 27 (3), 22. doi:10.18637/jss.v027.i03
Ito, H., and Lee, D. (2005a). Assessing the impact of the September 11 terrorist attacks on U.S. airline demand. J. Econ. Bus. 57 (1), 75–95. doi:10.1016/j.jeconbus.2004.06.003
Ito, H., and Lee, D. (2005b). Comparing the impact of the September 11th terrorist attacks on international airline demand. Int. J. Econ. Bus. 12 (2), 225–249. doi:10.1080/13571510500127931
Jones, A. (2009). Theorizing global business spaces. Geogr. Ann. Ser. B Hum. Geogr. 91 (3), 203–218. doi:10.1111/j.1468-0467.2009.00315.x
Julsrud, T. E., Denstadli, J. M., and Hjorthol, R. J. (2014). Business networking, travel tiredness, and the emergent use of video conferences. Int. J. Sustain. Transp. 8 (4), 262–280. doi:10.1080/15568318.2012.662580
Karl, K. A., Peluchette, J. V., and Aghakhani, N. (2021). Virtual work meetings during the COVID-19 pandemic: The good, bad, and ugly. Small Group Res. 53 (3), 343–365. doi:10.1177/10464964211015286
Kwiatkowski, D., Phillips, P. C., Schmidt, P., and Shin, Y. (1992). Testing the null hypothesis of stationarity against the alternative of a unit root. J. Econ. 54 (1–3), 159–178. doi:10.1016/0304-4076(92)90104-Y
Larouche, R., Charles Rodriguez, U., Nayakarathna, R., and Scott, D. R. (2020). Effect of major life events on travel behaviours: A scoping review. Sustain. Switz. 12 (24), 10392. doi:10.3390/su122410392
Li, R., Kockelman, K. M., and Lee, J. (2022). Reducing greenhouse gas emissions from long-distance travel business: How far can we go? Transp. Res. Rec. 2676 (1), 472–486. doi:10.1177/03611981211036682
Lian, J. I., and Denstadli, J. M. (2004). Norwegian business air travel-segments and trends. J. Air Transp. Manag. 10 (2), 109–118. doi:10.1016/j.jairtraman.2003.08.001
Ljung, A. G. M., and Box, G. E. P. (1978). On a measure of lack of fit in time series models. Biometrika 65 (2), 297–303. doi:10.1093/biomet/65.2.297
Lopes, V. B. (2019). Taxi gov: Mobilidade de Servidores no governo federal, escola nacional de Administração pública. Available at: https://repositorio.enap.gov.br/handle/1/4154 (Accessed May 13, 2022).
López, A. M. (2022). Business tourism spending worldwide from 2000 to 2020. Available at: https://www.statista.com/statistics/1093295/business-travel-spending-worldwide/#professional (Accessed April 7, 2022).
Lu, J. L., and Peeta, S. (2009). Analysis of the factors that influence the relationship between business air travel and videoconferencing. Transp. Res. Part A Policy Pract. 43 (8), 709–721. doi:10.1016/j.tra.2009.07.001
Marks, P. (2020). Virtual collaboration in the age of the coronavirus. Commun. ACM 63 (9), 21–23. doi:10.1145/3409803
Mette, M. (1995). Impact of videoconferencing on the demand for air travel. Cambridge: Massachusetts Institute of Technology, Dept. of Aeronautics and Astronautics.
Ministry of Economy - FGB (2022). X-ray of the federal government (written in Portuguese). Available at: https://raiox.economia.gov.br/ (Accessed April 21, 2022).
Mokhtarian, P. L. (1988). An empirical evaluation of the travel impacts of teleconferencing. Transp. Res. Part A General 22 (4), 283–289. doi:10.1016/0191-2607(88)90006-4
Mokhtarian, P. L., and Salomon, I. (2002). “Emerging travel patterns: Do telecommunications make a difference?,” in Perpetual motion: Travel behaviour research opportunities and application challenges. Amsterdam: Pergamon, 143–182.
Mouratidis, K., and Papagiannakis, A. (2021). COVID-19, internet, and mobility: The rise of telework, telehealth, e-learning, and e-shopping. Sustain. Cities Soc. 74, 103182. doi:10.1016/j.scs.2021.103182
Mouratidis, K., and Peters, S. (2022). COVID-19 impact on teleactivities: Role of built environment and implications for mobility. Transp. Res. Part A Policy Pract. 158, 251–270. doi:10.1016/j.tra.2022.03.007
Njegovan, N. (2006). Are shocks to air passenger traffic permanent or transitory? Implications for long-term air passenger forecasts for the UK. J. Transp. Econ. Policy 40 (2), 315–328.
Normative Instruction No. 10 of November 23 (2018). Ministry of planning, development and management - Federal Government of Brazil.
Normative Instruction No. 109 of October 29 (2020). Ministry of economy - Federal Government of Brazil.
Normative Instruction No. 90 of September 28 (2021). Ministry of economy - Federal Government of Brazil.
O’Hara-Wild, M., Hyndman, R., and Wang, E. (2021a). fable: Forecasting models for tidy time series. Available at: https://cran.r-project.org/package=fable (Accessed April 25, 2022).
O’Hara-Wild, M., Hyndman, R., and Wang, E. (2021b). fabletools: Core tools for packages in the “fable” framework. Available at: https://fabletools.tidyverts.org/(Accessed April 25, 2022).
Prasetyo, Y. T., Montenegro, L. D., Nadlifatin, R., Kurata, Y. B., Ong, A. K. S., and Chuenyindee, T. (2022). The influence of organizational commitment on the perceived effectiveness of virtual meetings by Filipino professionals during the COVID-19 pandemic: A structural equation modeling approach. Work 71 (1), 19–29. doi:10.3233/WOR-210040
Rahmandad, H., Lim, T. Y., and Sterman, J. (2021). Behavioral dynamics of COVID-19: Estimating underreporting, multiple waves, and adherence fatigue across 92 nations. Syst. Dyn. Rev. 37 (1), 5–31. doi:10.1002/sdr.1673
Richter, A. (2020). Locked-down digital work. Int. J. Inf. Manag. 55, 102157. doi:10.1016/j.ijinfomgt.2020.102157
Ritchie, H., Mathieu, E., Rodés-Guirao, L., Appel, C., Giattino, C., Ortiz-Ospina, E., et al. (2022). Coronavirus pandemic (COVID-19), our world in data. Available at: https://ourworldindata.org/coronavirus (Accessed September 13, 2021).
Rubinger, L., Gazendam, A., Ekhtiari, S., Nucci, N., Payne, A., Johal, H., et al. (2020). Maximizing virtual meetings and conferences: A review of best practices. Int. Orthop. 44 (8), 1461–1466. doi:10.1007/s00264-020-04615-9
Saeed, S., Moodie, E. E. M., Strumpf, E. C., and Klein, M. B. (2018). Segmented generalized mixed effect models to evaluate health outcomes. Int. J. Public Health 63 (4), 547–551. doi:10.1007/s00038-018-1091-9
Salomon, I., and Mokhtarian, P. L. (2007). “Can telecommunications help solve transportation problems? A decade later: Are the prospects any better?,” in Handbook of transport modelling. Editors D. A. Hensher, and K. J. Button. 1st edn. (Bingley: Emerald Group Publishing Limited), 519–540.
Salomon, I., Schneider, H. N., and Schofer, J. (1991). Is telecommuting cheaper than travel? An examination of interaction costs in a business setting. Transportation 18 (4), 291–318. doi:10.1007/BF00186562
Schaffer, A. L., Dobbins, T. A., and Pearson, S. A. (2021). Interrupted time series analysis using autoregressive integrated moving average (ARIMA) models: A guide for evaluating large-scale health interventions. BMC Med. Res. Methodol. 21 (1), 58–12. doi:10.1186/s12874-021-01235-8
Selvanathan, E. A., and Selvanathan, S. (1994). The demand for transport and communication in the United Kingdom and Australia. Transp. Res. Part B Methodol. 28 (1), 1–9. doi:10.1016/0191-2615(94)90027-2
Shadish, W. R., Cook, T. D., and Campbel, D. T. (2001). Experimental and quasi-experimental designs for generalised causal inference. Boston: Houghton Mifflin.
Smit, W. (2021). “Urbanization in the Global South,” in Oxford Research Encyclopedia of Global Public Health. doi:10.1093/ACREFORE/9780190632366.013.251
Standaert, W., Muylle, S., and Basu, A. (2016). An empirical study of the effectiveness of telepresence as a business meeting mode. Inf. Technol. Manag. 17 (4), 323–339. doi:10.1007/s10799-015-0221-9
Standaert, W., Muylle, S., and Basu, A. (2021a). Business meetings in a postpandemic world: When and how to meet virtually. Bus. Horizons 65 (3), 267–275. doi:10.1016/j.bushor.2021.02.047
Standaert, W., Muylle, S., and Basu, A. (2021b). How shall we meet? Understanding the importance of meeting mode capabilities for different meeting objectives. Inf. Manag. 58 (1), 103393. doi:10.1016/j.im.2020.103393
Thomchick, E. (1993). The 1991 Persian Gulf war: Short term impacts on ocean and air transportation. Transp. J. 33 (2), 40–53.
Valuates Reports (2022). Business travel market size to reach USD 2,001.1 billion by 2028 at CAGR 13.2%. Available at: https://www.prnewswire.com/news-releases/business-travel-market-size-to-reach-usd-2-001-1-billion-by-2028-at-cagr-13-2---valuates-reports-301404559.html (Accessed April 7, 2022).)
Vlahov, D., Galea, S., Resnick, H., Ahern, J., Boscarino, J. A., Bucuvalas, M., et al. (2002). Increased use of cigarettes, alcohol, and marijuana among Manhattan, New York, residents after the September 11th terrorist attacks. Am. J. Epidemiol. 155 (11), 988–996. doi:10.1093/aje/155.11.988
Vorndran, S. (2011). “Business travel management: Everything remains different! Post-crisis strategies,” in Trends and issues in global tourism 2011 (Berlin, Heidelberg: Springer), 231–235. doi:10.1007/978-3-642-17767-5_23
Wang, J. J. J., Walter, S., Grzebieta, R., and Olivier, J. (2013). “A comparison of statistical methods in interrupted time series analysis to estimate an intervention effect,” in Proceedings of the 2013 Australasian Road Safety Research, Policing & Education Conference, 1–13.
World Bank (2022). Air transport, passengers carried | Data. Available at: https://data.worldbank.org/indicator/IS.AIR.PSGR?end=2020&start=2000&view=chart (Accessed May 4, 2022).
Keywords: travel demand, business meeting, teleconference, interrupted time series, forecasting
Citation: Pedreira Junior JU, Galindo EP, Batista AH, Pitombo CS and Rodrigues da Silva AN (2022) The panorama of public officials’ meeting trips after the COVID-19 pandemic: Impact level, recovery, and prospects. Front. Future Transp. 3:972133. doi: 10.3389/ffutr.2022.972133
Received: 17 June 2022; Accepted: 14 September 2022;
Published: 12 October 2022.
Edited by:
Milad Haghani, University of New South Wales, AustraliaReviewed by:
Rezwana Rafiq, University of California, Irvine, United StatesCopyright © 2022 Pedreira Junior, Galindo, Batista, Pitombo and Rodrigues da Silva. This is an open-access article distributed under the terms of the Creative Commons Attribution License (CC BY). The use, distribution or reproduction in other forums is permitted, provided the original author(s) and the copyright owner(s) are credited and that the original publication in this journal is cited, in accordance with accepted academic practice. No use, distribution or reproduction is permitted which does not comply with these terms.
*Correspondence: Jorge Ubirajara Pedreira Junior, am9yZ2UudWJpcmFqYXJhQHVmYmEuYnI=
Disclaimer: All claims expressed in this article are solely those of the authors and do not necessarily represent those of their affiliated organizations, or those of the publisher, the editors and the reviewers. Any product that may be evaluated in this article or claim that may be made by its manufacturer is not guaranteed or endorsed by the publisher.
Research integrity at Frontiers
Learn more about the work of our research integrity team to safeguard the quality of each article we publish.