 Tomoya Kawasaki
 Hoshi Tagawa
 Yui-yip Lau
95% of researchers rate our articles as excellent or good
Learn more about the work of our research integrity team to safeguard the quality of each article we publish.
Find out more
ORIGINAL RESEARCH article
Front. Future Transp. , 13 October 2022
Sec. Freight Transport and Logistics
Volume 3 - 2022 | https://doi.org/10.3389/ffutr.2022.913765
Truck platooning is defined as a convoy of freight vehicles operated using an electronic coupling system, and has several advantages, particularly in terms of cost savings for fuel consumption and labor. Platooning technology is introduced by discussing several issues: the distance between trucks, number of trucks convoyed, waiting time at the platooning center, and distance between the origin and destination, all of which are variables that influence the transport costs. Important is to identify the extent to which these factors affect borderline conditions for single or platooning freight transport operations. Therefore, this study aims to develop a cost function of platooning operations, compare transport costs between single and platooning operations, determine the factors that affect the transport costs and identify the borderline conditions for single or platooning operations. The cost functions in the hypothetical network were developed by considering the important factors that contribute to the transport costs in Japanese road freight transport. A scenario analysis was conducted to investigate the impact of the inter-vehicle distance and the number of platooned trucks on the borderline conditions. Our results revealed that the platooning operation would offer a comparative advantage with a shorter inter-vehicle distance. For example, for an inter-vehicle distance of 49 m and a distance of 800 km between the origin and destination, the platooning operation is not advantageous compared with manned driving unless the waiting time at the platooning center is less than 30 min. In addition, a platooning operation is feasible even with a travelling distance of 100 km if the trailing vehicles are unmanned. The highest cost contributor is the cost of labor, the reduction of which can significantly reduce the total transport costs.
The importance of freight transport is increasing with the increase in freight volumes due to economic growth and the global development of e-commerce all over the world (Rehimi et al., 2021; Kawasaki et al., 2022). However, the stable supply of freight transport services faces several problems, such as the shortage of truck drivers (Hirata and Fukaya, 2020). Therefore, it is important to pursue a sustainable transport system for future freight transport (Borca et al., 2021; Mohri and Thompson, 2022). In Japan, truck haulage plays a key role in freight transport, accounting for approximately 90% (by ton) and 50% (ton-kilometers) of Japan’s annual freight volume (JTA, 2018). However, the shortage and aging of drivers and soaring fuel costs have become serious problems in recent years. According to the Ministry of Land, Infrastructure, and Tourism (MLIT), a shortage of approximately 240 thousand truck drivers is anticipated by 2027 (MLIT, 2015). In Japan, truck platooning was introduced in 2008 as a national intelligent transport system (ITS) project named “Energy ITS” to achieve energy savings and environmental protection (Tsugawa, 2013) as well as to address problems caused by the shortage of drivers. Truck platooning is a convoy of multiple freight vehicles that use an electronic coupling system, and has several advantages, particularly in terms of cost savings for fuel consumption and labor (Janssen et al., 2015; Theophilus et al., 2021). The trucks in the formation communicate through a cooperative adaptive cruise control (CACC) system, and the trailing truck(s) automatically replicate the braking, acceleration, steering, and other behaviors of the lead truck. Using the CACC system, the time gap between trucks can be shortened to 0.3 s, with shorter response times compared with that of operation by a human driver, which contributes to a larger decrease in fuel consumption owing to lower air resistance (Janssen et al., 2015).
To examine the effect of platooning operations, experimental studies have been conducted in several countries, including the United States, Europe, and Japan (Watanabe et al., 2021). In the United States, field platooning trials with unmanned operations were conducted, and key performance measures for evaluating truck platooning deployments were proposed by the government (Department of Transportation, 2020). In Europe, Netherlands has conducted large-scale operational tests in the field (Aarts and Feddes, 2016), and Germany and the United Kingdom have conducted field tests of platooning operations (Han et al., 2022). By 2025, Japan plans to commercialize platooning in the form of semi-unmanned or unmanned driving. Since 2018, social experiments have been conducted on the Tomei Expressway, which connects three major cities with the heaviest traffic volumes: Tokyo, Nagoya, and Osaka. In February 2022, a successful platooning test involving a three-truck convoy with two unmanned trucks was conducted at 80 km/h and a 9-m distance between vehicles. However, in practice, the use of unmanned follow-up trucks is still being debated. Although a greater reduction in fuel consumption can be achieved by shortening the distance between vehicles and increasing the number of trucks, the regulations on the distance between vehicles and the number of trucks forming a platoon are still controversial from the viewpoint of social acceptance (e.g., sustainability and electromobility), security, technology, infrastructure, and traffic safety issues (Janssen et al., 2015). In addition, truck platooning may have limited use in mixed traffic situations with an intra-platooning gap, and this may adversely affect the market penetration rate, platoon size, and demand (Wang et al., 2019).
The number of studies on truck platooning has increased in recent years. Sun and Yin (2019) measured the energy-saving effect of truck platooning. Zhang et al. (2017) focused on the operation of truck platooning and optimized the scheduling problem for multiple truck operations. Watanabe et al. (2021) discussed the location of platooning centers by considering unmanned trucks. Calvert et al. (2019) analyzed the impact of truck platooning on traffic congestion using a traffic engineering approach. The existing research on truck platooning is mainly related to three areas: fuel consumption (environmental effects), operational management, and traffic flow. However, few studies have investigated the transport costs associated with the number of trucks platooned, distance between trucks, and driving with or without a driver, which are significant concerns for introducing new transport means. In addition, the origin and destination (OD) distance and waiting time at the platooning center would differ because the spatial-temporal conditions of the OD pair differ for each haulage operation. The objectives of this study are as follows: 1) to compare the transport costs between single and platooning operations, 2) to reveal the factors influencing transport costs, and 3) to derive borderline conditions where platooning operations are more cost-effective than a single operation. Establishing borderline conditions enables logistics companies to make decisions regarding truck platooning operations and can be useful for policymakers to introduce regulations. Logistics companies and policymakers must understand the factors that influence transport costs before platooning is commercialized. In this study, we formulated cost models for three cases: single-truck operation, truck platooning with operation by human drivers, and truck platooning with unmanned operation for the following trucks. The models were developed based on a hypothetical network of simplified Japanese truck transport and an attempt to generalize borderline conditions. Using the developed model, we identified the borderline conditions between each operation, particularly with variables such as the distance between trucks, number of trucks, waiting time at the platooning center, OD distance, and manned/unmanned driving.
The remainder of this paper is organized as follows. Section 2 reviews existing literature on truck platooning. Section 3 explains the methodology and formulation of the cost functions. A cost comparison and borderline conditions are presented in Section 4. Finally, Section 5 concludes the paper and provides directions for further research.
Several studies have analyzed truck platooning in terms of fuel consumption, operation and scheduling problems, and traffic engineering. Among these, fuel consumption-related studies, including those on environmental issues, are the main concerns in truck platooning. According to Janssen et al. (2015), the benefits of truck platooning can be categorized into commercial and social values. Commercial value consists of saving by reducing fuel consumption and the cost of labor, and by effective asset utilization, whereas social value includes road capacity utilization, road safety, and environmental protection. Browned et al. (2004) demonstrated fuel savings of 10%–12% for trailing trucks and 5%–10% for the leading truck when the inter-vehicle spacing was 3–10 m in a two-truck platoon system. Zhang et al. (2020) conducted a study relevant to the fuel savings effect for platooning operations, coordination methods to improve the platooning rate, and look-ahead control strategies to generate fuel-efficient speed profiles for each vehicle driving in a platoon under different road conditions. Boysen et al. (2018) investigated the impact of the diffusion of platooning technology, maximum platoon length, and tightness of time windows. These studies demonstrated that these factors can considerably reduce the positive effects of truck platooning, particularly regarding fuel savings. Larsson et al. (2015) presented several heuristics for determining optimal or near-optimal solutions for the platooning operation of the German Autobahn Road network. Fuel savings of 1%–2% can be achieved via platooning, with savings growing progressively as the number of trucks increases, assuming a fuel reduction factor of 10%. Larsen et al. (2019) presented a model for optimizing truck platoons formed at a platooning hub using a dynamic-programming-based local search heuristic. Fuel efficiency through air drag reduction is widely known to be one of the benefits of truck platooning (Zabat et al., 1995; Wang et al., 2019; Zhang et al., 2020; Song et al., 2021). Furthermore, studies on fuel consumption in truck platooning on a test track and along an expressway showed that an inter-truck distance of 10 m resulted in fuel savings of 13% (Tsugawa, 2013). These studies mainly discussed the fuel savings arising from a reduction in fuel consumption by platooning; however, only a few studies discussed the reduction of specific costs and borderline conditions in relation to single-truck operations based on cost analysis. Jornod et al. (2022) examined the effect of introducing the concept of maneuver reference to distribute the maneuvering effort in truck platooning. Eitrheim et al. (2022) investigated the opportunities and barriers for truck platooning on Norwegian rural freight routes and identified several prerequisites for deploying platooning and achieving economic savings.
Several surgery-related studies have been conducted on this topic. Bhoopalam et al. (2018) categorized platooning into three types: scheduled, real-time, and opportunistic platooning. Scheduled platoon planning is a basic platooning method in which all track fleet information is announced before departure and all formation plans are made in advance. Liang et al. (2016) proposed a coordination algorithm to form platoons of several vehicles that coordinate neighboring vehicles pairwise, resulting in significant fuel savings. Sun and Yin (2019) investigated optimal platoon formation to maximize the platooning benefit and determined a mechanism to redistribute the benefit to incentivize vehicles to form and maintain the desired platoon formation. Zhang et al. (2017) formulated departure-time scheduling problems under travel time uncertainty for freight transport platoon coordination and showed that platooning was beneficial only when the scheduled arrival times differed by less than a certain threshold. Hirata and Fukaya (2020) studied methods for estimating the vehicle-matching potential of freight trucks for platooning operations in eastern Japan. Fritz et al. (2004) examined efficient transport with empty trucks using platooning. These studies addressed operational issues related to platooning formation and scheduling problems. In our study, we considered scheduled platoon planning to develop the cost models. Several studies have been conducted on the effects of traffic flow from the perspective of traffic engineering. Lioris et al. (2017) investigated the effects of platooning on the traffic flow at intersections. Vehicles crossing intersections in platoons increased the saturation flow rates by a factor of two to three. Calvert et al. (2019) demonstrated the negative effects of truck platooning on traffic flow, particularly in saturated states, whereas small platoons were shown to have minimal impact. Neubauer and Schildorfer (2022) addressed the requirements related to energy-efficient truck platooning, road users and other road user requirements, road safety requirements, and technical requirements. Specifically, we focused only on expressway/highway settings in this study. Previous studies on platooning also mentioned congestion on highways/expressways. Jin et al. (2018) suggested a new fluid queuing model that described the macroscopic effect of platooning operations on highway congestion. Wang and Du (2022) identified that vehicle platoons can contribute to innovations in automated highway systems, which would further reduce the burden on the highway system. Beaver and Malikopoulos (2021) used highway platooning as a case study to integrate constraint-driven optimal control of multiagent systems. This would enable vehicles to lower their energy consumption on highways.
Previous research on truck platooning mainly examined fuel consumption and operation/scheduling problems. However, in cost comparison studies, the impact of the waiting time for platoon formations and the total distance travelled have not yet been investigated, which are important factors impacting operational costs. In particular, research to determine the borderline conditions for single or platooned haulage by varying the inter-vehicle distance and the number of trucks that are platooned has not been reported to date. In this study, we formulated a cost function that considers the distance between trucks, number of trucks, waiting time at the platooning center, OD distance, and manned/unmanned driving.
In this study, we compared the costs of single and platooning operations and identified key factors affecting transport costs by changing various conditions, such as the distance between vehicles and number of trucks in the platoon in a hypothetical network. A hypothetical network is useful because various conditions, such as the OD distance, can be changed. To analyze the cost reduction across the entire network, data from actual networks were used as input into our cost model to verify the difference between the costs of single and platooning operations under several conditions.
Figures 1A,B show the hypothetical single and platooning networks, respectively. Both networks involved n shippers and n trucks. The single-truck network is a conventional basic transport network in which freight is transported directly between the origin and destination. In contrast, in a platooning network, n trucks gather at platooning center A to form a convoy, which is a major forming method referred to as scheduled platoon planning (Bhoopalam et al., 2018). In this study, we vary the OD d and attempt a cost comparison for each individual truck passing through the same interchange (i.e., platooning center), regardless of the operation. Note that we do not assume a detour to meet other trucks for platooning. In this method, all track OD information is announced before departure and all formation plans are made in advance. This method is considered highly feasible in several countries, including Japan, owing to its ease of performance compared with real-time and opportunistic platooning. A platooning center is a facility in which trucks gather to wait for other trucks to form and disperse a platoon. In Japan, platooning centers are planned to be located at rest areas (referred to as parking areas in Japan) or at an interchange along expressways, and platooned trucks will only be driving on expressway sections (METI, 2021). In addition, dynamic matching systems and platooning operations on partial segments of expressways are not planned in the initial stage of the platooning operation (Watanabe et al., 2021). In most cases, trucks arriving at a platooning center would be forced to wait for other trucks to create a formation (matching). The waiting time can vary because of the uncertainties in the travel time as a result of the traffic conditions (Kawasaki et al., 2014). Shorter waiting times result in lower time costs and more feasible platooning operations. Thus, several scenarios were set for the waiting time at formation center A. Subsequently, the platooned trucks travelled on the expressway and disbanded at platooning center B to continue to their separate destinations. Note that following several studies (e.g., Kawasaki et al., 2015) only one-way haulage was considered because several scenarios could be considered for return haulage. For example, some trucks proceed to other destinations without returning to their point of origin. Therefore, in our study, we considered only the transport cost of one-way haulage.
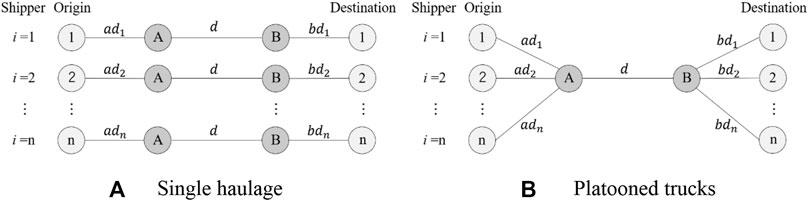
FIGURE 1. Hypothetical networks of single and truck platooning haulage. (A) Single haulage, (B) Platooned trucks.
In this study, the following cases were examined to compare the transport costs.
Case 0: Single truck haulage.
Case 1: Truck platooning with drivers.
Case 2: Truck platooning with a driver in the leading truck and without drivers in the following trucks.
First, Case 0 was prepared for comparison with truck platooning. This case required each truck to be driven by a driver and was applied to a single-truck network, as shown in Figure 1A. Cases 1 and 2 involved truck platooning and were applied to the platooned network, as shown in Figure 1B. In Case 1, all the platooned trucks were operated by human drivers, whereas in Case 2, the trucks were operated unmanned driving. In the unmanned operation of truck platooning (Case 2), according to an interview survey with logistics companies, because there are backhaul trucks that return to their origin from the destination, the relocation of drivers is generally unnecessary. For example, in Case 2, each truck is driven to platooning center A to form a platoon, and subsequently proceeds to platooning center B in a unmanned truck platoon, whereas some drivers remain at platooning center A. These drivers at platooning center A wait for the back haul trucks returning from platooning center B before driving them to their points of origin. This is the expected truck operation in the unmanned truck platooning operations in a logistics network. In both Cases 1, 2, trucks were required to wait at platooning center A to form the convoy. However, waiting time at platooning center B was only required in Case 2, as the platoon was only accompanied by one driver between A and B. Thus, n-1 trucks could not depart from the platooning center to their destinations until all n-1 drivers arrived at platooning center B. In addition, the distance travelled by each truck was constant in all cases because the platooning center was located along the expressway. The distance is the sum of the following three distances: from the origin of each truck i to the platooning center A
The cost function was formulated for single and platooned haulages using the hypothetical network shown in Figure 1. Cost components that belonged to both single and platooning operations were not considered. For example, the expressway toll costs per truck for single and platooning operations are considered equal. Although discounts may apply to trucks driving in a platoon, these discounts have a minimal effect on the cost. Therefore, these discounts were not considered. Further, other costs, such as maintenance costs and insurance fees, are different between the two operations because of the differences in their mechanical systems. However, these costs were set equally for both operations. The following parameters and notations are used for the formulation:
The average transport cost (ACm) of a logistics company is calculated using Eq. 1:
where LCm is the total labor cost, FCm is the total fuel cost, and n is the number of trucks. The transportation costs are expressed in JPY/truck haulage, the average cost of transporting n trucks for a one-way trip.
LCm is computed as the product of the cost of labor per hour
In a single-truck network, trucks do not participate in platooning; thus, tp, tf, and tr are set to zero. The labor cost (
where v is the average driving speed.
In Cases 1 and 2, the labor costs (
The fuel cost (
Equation 5 expresses the total fuel cost in Case 0 (
In the case of a truck platooning network, the fuel costs for Cases 1 and 2 (
The reduction ratio changes depending on the inter-truck distance
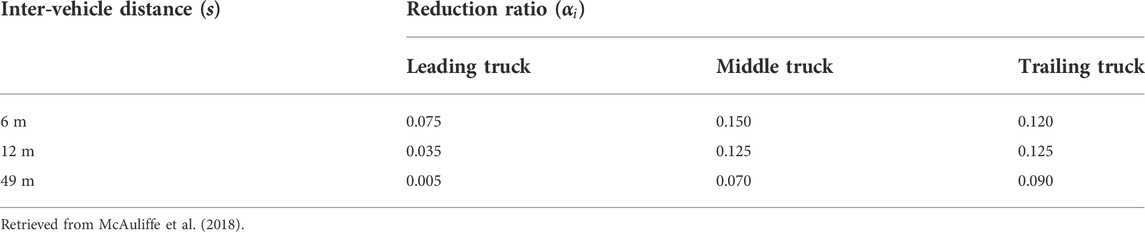
TABLE 1. Reduction ratio of fuel consumption (
The reduction ratio also changes depending on the position of the trucks in the formation (leading, middle, or trailing) [McAuliffe et al. (2018)]. The fuel cost savings were the highest for trucks travelling in the middle (Table 1). The greater the number of vehicles in the platoon, the greater the number of trucks traveling in the middle of the formation, and the lower the fuel consumption becomes. The number of vehicles at each position depends on the number of trucks. Specifically, for n = 2, the truck is either leading or trailing. For
Using the developed cost models, the transport costs of each case were calculated by changing several parameters to observe their impact on the borderline conditions between single and platooning operations and influential factors. The input values used in this study are listed in Table 2. Among the input values, some were determined based on interview surveys or assumptions, as truck platooning is not yet implemented on a commercial basis in Japan. For example, the data on tp is insufficient; thus, they are set based on interview surveys with expressway companies (i.e., NEXCO Central). These times can be varied by improving the operational efficiency in the future; however, forming and dispersing a platoon generally needs to happen in a short time. Therefore, multiple values were not prepared as scenarios. The average driving speed v is determined based on National Survey of Roads and Streets Traffic Conditions (NSRSTC) in 2015, According to this survey, the average speed on all expressways was 78.3 km/h in 2015. Thus, we set the average driving speed, v, to 80 km/h. The distances
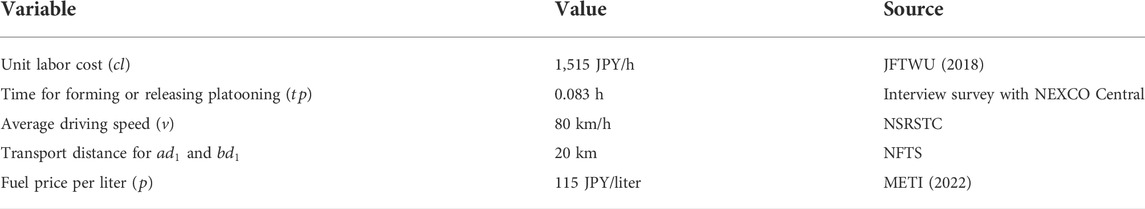
TABLE 2. Input data.
Using the above input values, we compared the transportation costs of single and platooning operations. We believe that the comparative advantages of both operations vary according to several conditions. In this study, we consider the average OD (
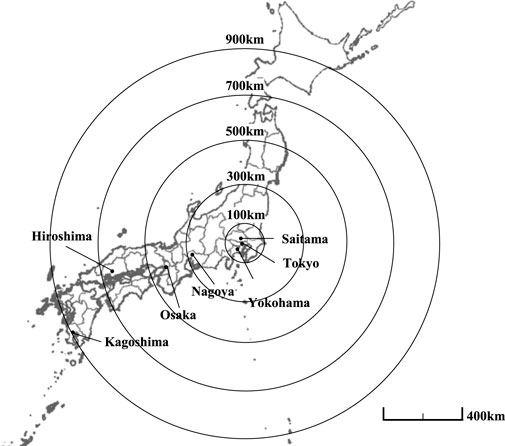
FIGURE 2. Maps with a concentric circle centered at Tokyo.
Regarding the waiting time at platooning centers, the transport cost is expected to decrease as the waiting time decreases. This variable is assigned values from 0 to 4 h in 30-min increments because it depends on the spatial-temporal relationship of freight OD demand and company efforts. Zero hours indicates that there is no waiting time at the platooning center, which means that multiple trucks arrive at the platooning center simultaneously, indicating that transport planning and operation are perfectly managed. However, the inter-vehicle distance between vehicles (s) and the number of trucks (n) depend partly on the regulations. For these values, multiple input values are also set. Three values were considered for the inter-vehicle distance, 6, 12, and 49 m, as described in Section 3.2.2. When considering the introduction of truck platooning, restrictions on this distance are a major concern. Shorter distances lower the fuel costs owing to the reduction in aerodynamic drag, thereby lowering truck operating costs. However, shorter distances may also increase safety concerns and drivers’ psychological resistance. Therefore, the Japanese government is currently carefully studying and discussing the regulation of the distance between vehicles (Watanabe et al., 2021). The relationship between the number of trucks in a platoon (n) and transport cost is also a significant concern. In Japan, two to four trucks are considered ideal for platooning. This variable is important because the more trucks there are in a platoon, the higher the fuel cost savings that can be achieved. However, the larger the number of vehicles in a platoon, the more difficult it is to overcome social resistance and matching issues. Therefore, in our calculations we considered two, three, and four trucks, in accordance with on-going discussions in Japan. Consequently, the scenarios were set as listed in Table 3.
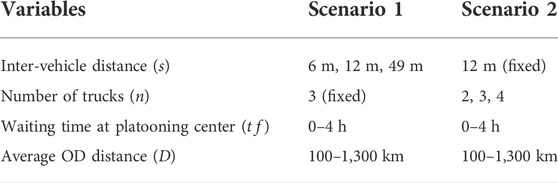
TABLE 3. Scenarios examined.
The results of the cost differences between Cases 0 and 1 and Cases 0 and 2 for changing inter-vehicle distances are shown in Figures 3, 4, respectively. The colored cells represent the regions where the platooning operation has a comparative advantage in terms of transport costs compared to single-truck operation. The results show that the comparative advantage of the platooning operation increases as the distance between vehicles decreases in all the cases. This result is expected because shorter distances between vehicles lead to lower transport costs owing to the reduction in aerodynamic drag.
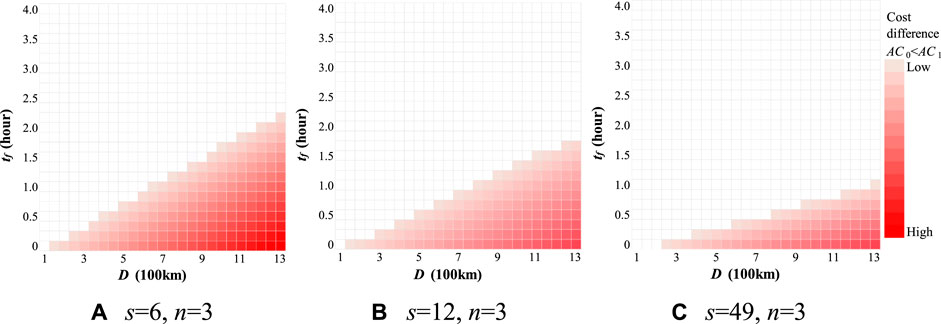
FIGURE 3. Cost comparison between Case 0 (single truck) and 1 (truck platooning) with changing inter-vehicle distance (s). (A) s = 6, n = 3 (B) s = 12, n = 3 (C) s = 49, n = 3.
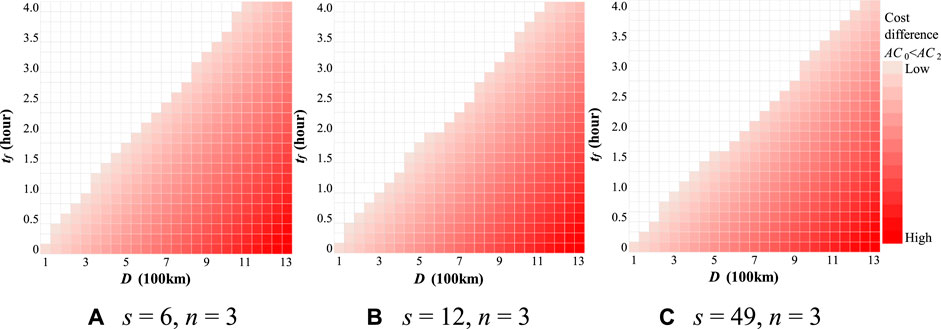
FIGURE 4. Cost comparison between Case 0 (single truck) and 2 (truck platooning) with changing inter-vehicle distance (s). (A) s = 6, n = 3 (B) s = 12, n = 3 (C) s = 49, n = 3.
The boundary that changes the comparative advantage in terms of transport costs changes with the inter-vehicle distance. Specifically, when s = 49 m and D = 800 km, the comparative advantage of the platooning operation cannot be secured unless the waiting time at the platooning center is within 30 min for platooning with human drivers and with n = 3 (Case 1) (Figure 3C). Nevertheless, when s = 6 m and D = 800 km, the comparative advantage of platooning was secured for a waiting time at the platooning center as long as 75 min (Figure 3A). When s = 49 m and D = 1,300 km, the comparative advantage of platooning is lost if the waiting time at the platooning center exceeds 1 h (Figure 3C). Platooning does not offer any advantage for transport distances of 100 km for s = 6 m (Figure 3A) and 12 m (Figure 3B) and 150 km for s = 49 (Figure 3C), and the platooning operation has a cost advantage only for operations with OD distances greater than those in Case 1. When Tokyo is considered as the origin of haulage, destinations within a distance of 100 km include Yokohama City, which has an international port, and northern Saitama Prefecture, where factories and logistics companies are agglomerated.
Figure 4 shows that the platooning operation is feasible even with a transport distance of 100 km in all cases of s because unmanned trailing vehicles can significantly reduce labor costs, which can also be observed from Figure 5. In Case 1, the cost reduction is more strongly affected by changes in the inter-vehicle distance (s) than in Case 2. The labor cost in Case 2, which increases with transport time, is much lower than in Case 1 because the trailing vehicle is unmanned. Although the size of the regions in which platooning operations offer a comparative advantage varies depending on the inter-vehicle distance in Case 2, the effect is not as significant as in Case 1.
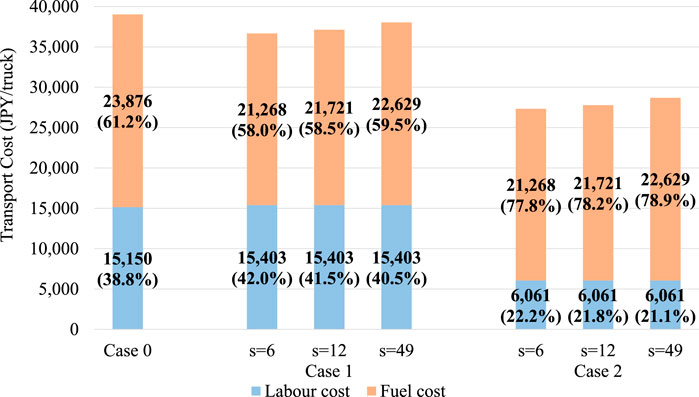
FIGURE 5. Breakdown of cost components for each inter-vehicle distance and operation case when n = 3, D = 800 and tf = 0.
Figures 6, 7 show the effect of n on the cost differences between Cases 0 and 1, and Cases 0 and 2, respectively. Higher values of n correspond to a larger region in which platooning operations constitute a comparative advantage, as shown in Figures 6, 7. This is an expected result, albeit insignificant. For example, when the transport distance is 800 km (e.g., Tokyo-Hiroshima) in Case 1, the maximum waiting time at the platooning center to maintain the cost advantage of platooning, is 30 min for n = 2 (Figure 6A), but can only be extended up to approximately 45 min for n = 4 (Figure 6C), indicating that the number of trucks has relatively little influence on the transport cost per truck. However, as shown in Figure 8, a slight cost reduction can be achieved by increasing the number of platooned trucks.
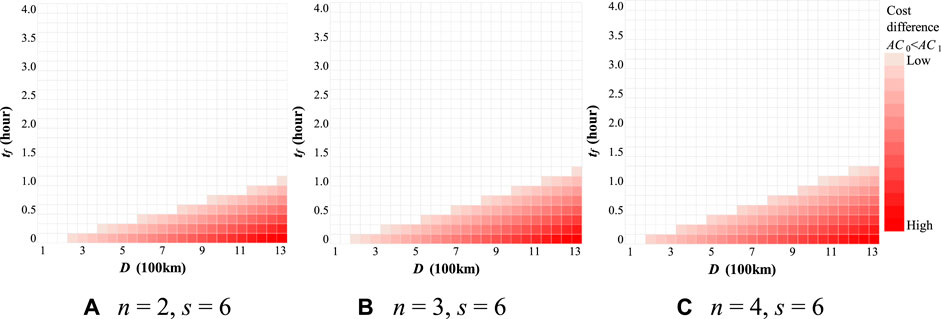
FIGURE 6. Cost comparison between Case 0 (single truck) and 1 (truck platooning) for a different number of platooned trucks (n). (A) n = 2, s = 5 (B) n = 3, s = 6 (C) n = 4, s = 6.
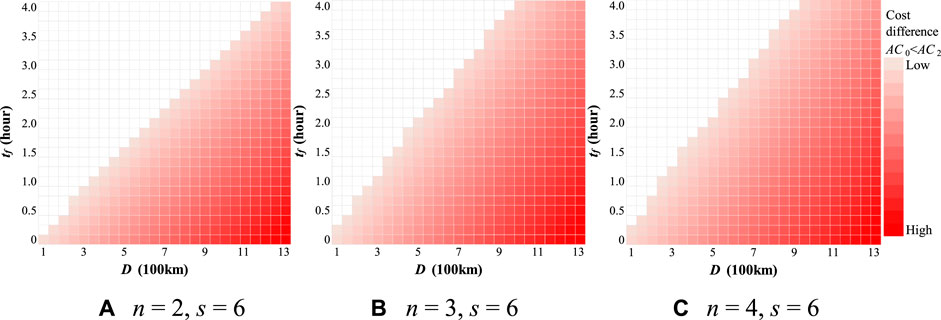
FIGURE 7. Cost comparison between Case 0 (single truck) and 2 (truck platooning) for a different number of platooned trucks (n). (A) n = 2, s = 6 (B) n = 3, s = 6 (C) n = 4, s = 6.
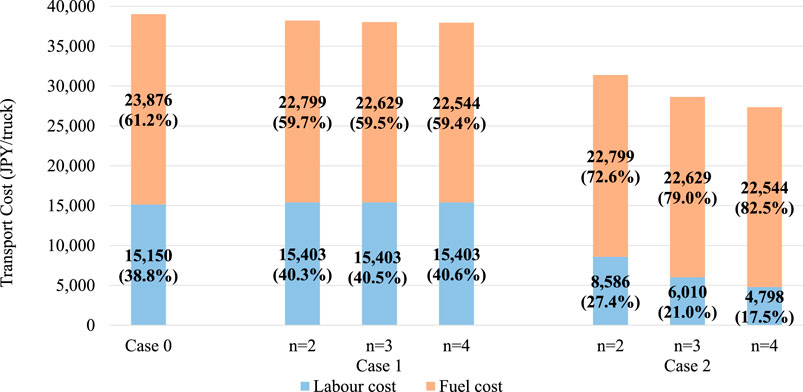
FIGURE 8. Breakdown of cost components for each inter-vehicle distance and operation case when s = 6, D = 800 and tf = 0.
As for the comparison between Cases 1 and 2, in Figure 6, the platooning operation has no comparative advantage over single-truck operations at D shorter than 200 km. At the same time, as shown in Figure 7, the platooning operation has a comparative advantage over single-truck operations at D greater than 100 km. Thus, the minimum OD distance at which the platooning operation has a cost advantage compared with a single operation is lower in Case 2 than in Case 1. This can be attributed to the advantages of using unmanned trailing vehicles. As shown in Figure 8, the labor cost in Case 2 was significantly lower than that in Case 1. Scenario 1 also shows that unmanned following vehicles have a significant cost-saving effect (Figure 5).
A comparison of the slopes (boundaries between Cases 0 and 1 and Cases 0 and 2) in Figures 6, 7 shows that the slopes in Figure 7 are steeper, indicating that the platooning operation rapidly increases the cost advantage of unmanned trailing trucks, and longer waiting times (tf) are required at the platooning center. For example, when n = 2 and D = 800, the comparative advantage of the platooning operation is secured at tf = 30 min for Case 1 and tf = 2.5 h for Case 2.
The relationship between a single truck and platooning at the point at which the cost difference is zero is linear for both D and tf. These relationships are used as equations for the borderline conditions for the single and platooning operations, and can be used to support decision-making for logistics operators and policymakers in implementing platooning operations. The borderline conditions are listed in Table 4. The positive slopes of a indicate that higher D values correspond to higher tf values. The value of slope a increases with increasing n. However, the values of the y-intercept b are all negative, indicating that the cost advantage of the platooning operation cannot be maintained with low D values.
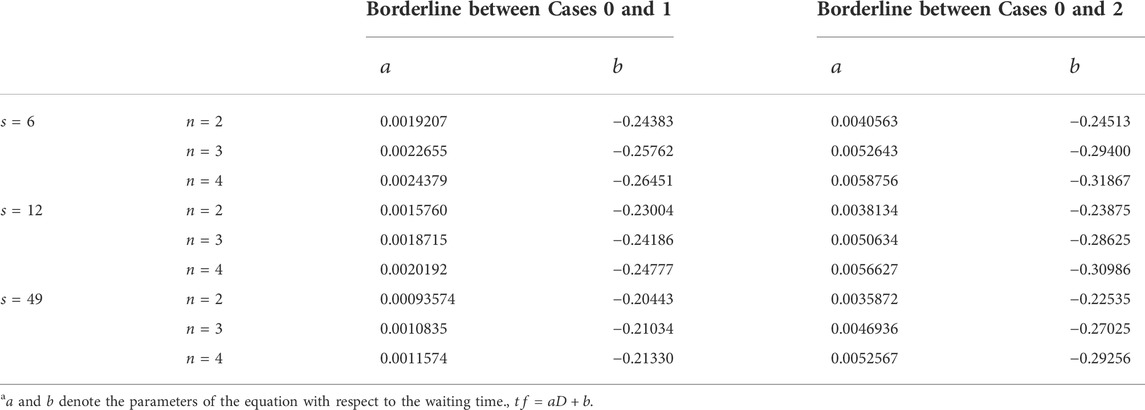
TABLE 4. Borderline conditions between single (Case 0) and platooning operation (Case 1 and 2).
The conditions under which the platooning operation offers a comparative advantage in terms of transport costs are summarized on the basis of the equations for the borderline conditions listed in Table 4. Figure 9 shows the minimum D at tf = 0, whereas Figure 10 shows the maximum tf at D = 100 km, where truck platooning has a comparative advantage over single-truck operation.
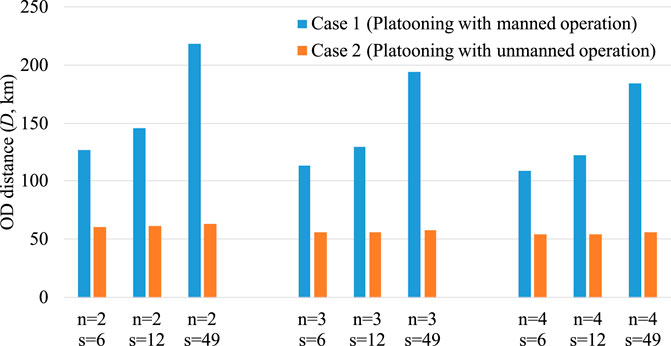
FIGURE 9. Minimum distance between origin and destination (D) at tf = 0 where truck platooning has a comparative advantage over single truck operation.
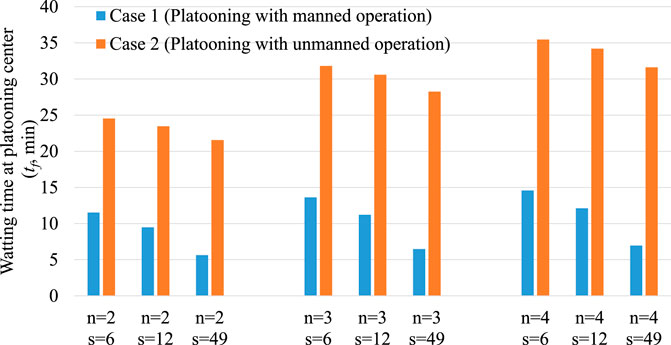
FIGURE 10. Maximum waiting time at platooning center (tf) at D = 100 km where truck platooning has a comparative advantage over single truck operation.
Based on Figure 9, to maintain the cost advantage of the platooning operation, platooning should be introduced when the OD distance is more than 100–200 km in Case 1. The distance increases when tf is set to a longer value (tf = 0 in Figure 10). However, the minimum required OD distance varies significantly depending on the inter-vehicle distance (s). As discussed in Section 4.3, for short distances below these values (approximately 100–200 km), a platooning operation with drivers is costlier than driving alone, regardless of the reduction in matching waiting time (tf). In Case 2, the conditions were more relaxed than those in Case 1, requiring a transport distance of approximately 60 km in all the cases. Sixty kilometers is a slightly shorter range than the distance to the border of the Kanto region centered in Tokyo, indicating that the influence of unmanned trailing vehicles can significantly reduce labor costs.
As shown in Figure 10, the maximum waiting time that can be spent at the platooning center is very short. Specifically, this time was less than 15 min for all combinations of variables in Case 1. However, in Case 2, the waiting time increased to 20–35 min. Thus, for the same OD distance (D), Case 1 permits a shorter waiting time for matching, which is approximately 20%–50% shorter than that of Case 2. However, it can be understood that in both cases, the waiting time would have to be short if the platooning operation was to have a comparative cost advantage over single-truck operations.
This study aimed to compare and analyze the transport costs between single and platooning operations, determine the factors that influence the transport costs and identify borderline conditions between single and platooning operations. We formulated the cost function for a hypothetical network by considering several factors that affect transport costs. In the scenario analysis, the impacts of the inter-vehicle distance and the number of platooned trucks on the borderline conditions between single and platooned operations, including unmanned driving, were discussed. The scenario analysis has the following implications:
First, the platooning operation offers a comparative advantage of with a shorter inter-vehicle distance. Specifically, an inter-vehicle distance of 49 m and an OD distance of 800 km demonstrated that the platooning operation no longer offers an advantage over manned driving unless the waiting time at the platooning center is within 30 min. Nevertheless, when the inter-vehicle distance is 6 m and the OD distance is 800 km, the platooning operation has a lower cost per haulage for waiting times at the platooning center of at most 75 min. Second, platooning holds no advantage for transport distances of 100 km for inter-vehicle distances of 6 and 12 m, and 150 km for an inter-vehicle distance of 49 m. Additionally, the platooning operation only has a cost advantage for operations with OD distances greater than these distances with manned driving. A platooning operation is feasible in terms of the operating cost, even with a transport distance of 100 km, when unmanned operation is introduced. Unmanned trailing vehicles can significantly reduce labor costs and make it feasible to introduce platooning operations for short-distance trips. Additionally, the cost advantage of platooning operations rapidly increases by introducing unmanned platooning operations. Third, a larger number of trucks in platooning expand the conditions under which platooning operations offer a comparative advantage. This is an expected result, albeit insignificant, indicating that the number of trucks has a relatively small influence on cost reduction. Fourth, platooning operations should be introduced when the OD distance is more than 100 km manned operations, although it varies under several conditions. For unmanned platooning operations, the conditions are more relaxed, requiring a transport distance of approximately 60 km in all the cases.
This research could be expanded in two major directions in future:
This study was conducted by considering the Japanese situation. Several of the input values and truck operations were based on Japanese guidelines, driving conditions, and distances. Thus, it is preferable to conduct case studies in other countries. This is the first limitation of this study and a future research direction.
Actual networks and demands should be applied to observe the total cost reduction by introducing platooning in a real network. For example, the distribution of the OD would affect the waiting time at platooning center A because a denser truck area is expected to shorten the waiting time for matching trucks. However, a study such as this in a real network is hampered by the issue of data unavailability. In Japan, detailed data are available on freight transport, such as those gathered in surveys such as the National Freight Transport Survey. These data are composed of spatial-temporal information on truck haulage, such as their real origin and destination, departure and arrival times, and preferred arrival time.
In our model, several input values were used to calculate the transport cost of each platooning operation. Our model and its results are valid if the input data are sufficiently accurate. Some of the input values were set based on the findings of interview surveys; for example, the times for forming and dispersing platoons were set based on interview surveys with expressway companies. As such, the results obtained in this study may have varied; however, forming and dispersing platoons generally require a short time; thus, the interpretations discussed in this study would not be significantly affected. Additionally, the fuel consumption rate is expected to improve in the future. In this case, because the fuel consumption of a platooning operation is lower than that of a single operation, the comparative advantage of the platooning operation might decrease in the future. The data used as input is an important future task for this study.
The cost of manned and unmanned trucks may differ because the mechanical and electrical compositions of the trucks are different. However, because unmanned operation is not popular and the development of relevant technology is currently underway, the specific cost difference between manned and unmanned trucks remains unknown. Thus, our study did not reveal any such cost differences. This is also an important topic for future work.
The original contributions presented in the study are included in the article/supplementary material, further inquiries can be directed to the corresponding author.
Conception or design of the work; TK, analysis or interpretation of data for the work; TK, HT, Y-YL, drafting the work or revising it critically for important intellectual content; TK.
The authors declare that the research was conducted in the absence of any commercial or financial relationships that could be construed as a potential conflict of interest.
All claims expressed in this article are solely those of the authors and do not necessarily represent those of their affiliated organizations, or those of the publisher, the editors and the reviewers. Any product that may be evaluated in this article, or claim that may be made by its manufacturer, is not guaranteed or endorsed by the publisher.
Aarts, L. O., and Feddes, G. E. (2016). “European truck platooning challenge-Creating next generation mobility,” in Proceedings of the HVTT14: International symposium on heavy vehicle transport technology. 15–18 November 2016 (Rotorua, New Zealand: The Dutch Ministry of Infrastructure and the Environment).
Beaver, L., and Malikopoulos, A. (2021). Constraint-driven optimal control of multiagent systems: A highway platooning case study. IEEE Control Syst. Lett. 6, 1754–1759.
Bhoopalam, A. K., Agatz, N., and Zuidwijk, R. (2018). Planning of truck platoons: A literature review and directions for future research. Transp. Res. Part B Methodol. 107, 212–228. doi:10.1016/j.trb.2017.10.016
Bishop, R. (2020). New moves, new markets for truck platooning revealed at AVS2020. Available at: https://www.forbes.com/sites/richardbishop1/2020/09/27/new-moves-new-markets-for-truck-platooning-revealed-at-avs2020/?sh=9eb2c6a62974 (Accessed on February, 2021).
Borca, B., Putz, L. M., and Hofbauer, F. (2021). Crises and their effects on freight transport modes: A literature review and research framework. Sustainability 13 (10), 5740. doi:10.3390/su13105740
Boysen, N., Briskorn, D., and Schwerdfeger, S. (2018). The identical-path truck platooning problem. Transp. Res. Part B Methodol. 109, 26–39. doi:10.1016/j.trb.2018.01.006
Browned, F., McArthur, J., and Radovich, C. (2004). Fuel saving achieved in the field test of two tandem trucks. California: University of Southern California. PATH Research Report, UCB-ITS-PRR-2004-20.
Calvert, S. C., Schakel, W. J., and Van Arem, B. (2019). Evaluation and modelling of the traffic flow effects of truck platooning. Transp. Res. Part C Emerg. Technol. 105, 1–22. doi:10.1016/j.trc.2019.05.019
Department of Transportation (2020). Truck platooning early deployment assessment–independent evaluation: Performance measures for evaluating truck platooning field deployments. Washington, DC, USA: The United States. Available at: https://rosap.ntl.bts.gov/view/dot/50551 (Accessed on March, 2022).
Eitrheim, M. H. R., Log, M. M., Tørset, T., Levin, T., and Pitera, K. (2022). Opportunities and barriers for truck platooning on Norwegian rural freight routes, transportation research record. J. Transp. Res. Board. 2676 (6), 810–824.
Fritz, H., Bonnet, C., Schiemenz, H., and Seeberger, D. (2004). “Electronic tow-bar based platoon control of heavy duty trucks using vehicle communication: Practical results of the CHAUFFEUR2 project,” in Proc. Of 11th ITS world congress.
Han, Y., Kawasaki, T., and Hanaoka, S. (2022). The benefits of truck platooning with an increasing market penetration: A case study in Japan. Sustainability 14 (15), 9351. doi:10.3390/su14159351
Hirata, T., and Fukaya, T. (2020). Potential of truck platooning for transporting empty trucks considering intercity freight demand imbalances. LogForum 16 (3), 373–383. doi:10.17270/j.log.2020.450
Janssen, G. R., Zwijnenberg, J., Blankers, I. J., and De Kruijff, J. S. (2015). Truck platooning: Driving the future of transportation. TNO.523175.
Japan Federation of Transport Workers' Unions (JFTWU) (2018). Actual situation of truck driver’s wage. Tokyo, Japan: Japan Federation of Transport Workers' Unions. (in Japanese). Available at: https://www.unyuroren.or.jp/home/report/handbook/handbook2018.pdf (Accessed on January, 2022).
Japan Truck Association (JTA) (2018). Current situation and issues in truck industry in Japan. Tokyo, Japan: Japan Truck Association. (in Japanese). Available at: http://www.jta.or.jp/coho/yuso_genjyo/yuso_genjo2018.pdf (Accessed in December, 2021).
Jin, L., Cicic, M., Amin, S., and Johansson, K. H. (2018). “Modeling the impact of vehicle platooning on highway congestion: A fluid queuing approach,” in 21st ACM international conference on hybrid systems: Computation and control, Porto.
Jornod, G., Pfadler, A., Carreira, S., El Assaad, A., and Kürner, T. (2022). “Fuel efficient high-density platooning using future conditions prediction,” in IEEE open journal of intelligent transportation systems. doi:10.1109/ojits.2022.3172908
Kawasaki, T., Hanaoka, S., and Nguyen, X. L. (2015). Inland cargo flow modelling considering shipment time variability on cross-border transport. Transp. Plan. Technol. 38 (6), 664–683. doi:10.1080/03081060.2015.1048947
Kawasaki, T., Hanaoka, S., and Nguyen, X. L. (2014). The valuation of shipment time variability in Greater Mekong Subregion. Transp. Policy 32, 25–33. doi:10.1016/j.tranpol.2014.01.001
Kawasaki, T., Wakashima, H., and Shibasaki, S. (2022). The use of e-commerce and the COVID-19 outbreak: A panel data analysis in Japan. Transp. Policy 115, 88–100. doi:10.1016/j.tranpol.2021.10.023
Larsen, R., Rich, J., and Rasmussen, T. K. (2019). Hub-based truck platooning: Potentials and profitability. Transp. Res. Part E Logist. Transp. Rev. 127, 249–264. doi:10.1016/j.tre.2019.05.005
Larsson, E., Sennton, G., and Larson, G. (2015). The vehicle platooning problem: Computational complexity and heuristics. Transp. Res. Part C Emerg. Technol. 60, 258–277. doi:10.1016/j.trc.2015.08.019
Liang, K. Y., Mårtensson, J., and Johansson, K. H. (2016). Heavy-duty vehicle platoon formation for fuel efficiency. IEEE Trans. Intelligent Transp. Syst. 17 (4), 1051–1061. doi:10.1109/tits.2015.2492243
Lioris, J., Pedarsani, R., Tascikaraoglu, F. Y., and Varaiya, P. (2017). Platoons of connected vehicles can double throughput in urban roads. Transp. Res. Part C Emerg. Technol. 77, 292–305. doi:10.1016/j.trc.2017.01.023
McAuliffe, B., Lammert, M., Lu, X. Y., Shladover, S., Surcel, M. D., and Kailas, A. (2018). Influences on energy savings of heavy trucks using cooperative adaptive cruise control. SAE Technical Paper 2018-01-1181.
Ministry of Economy, Trade and Industry (METI) (2021). Report and policy on initiatives for the realization and dissemination of automated driving: Version 5. Tokyo, Japan: Ministry of Economy, Trade and Industry. (in Japanese).
Ministry of Economy, Trade and Industry (METI) (2022). Survey on fuel price. Tokyo, Japan: Ministry of EconomyTrade and Industry. (in Japanese). Available at: https://www.enecho.meti.go.jp/statistics/petroleum_and_lpgas/pl007/results.html (Accessed in March, 2022).
Ministry of Land, Infrastructure and Tourism (MLIT) (2008). Calculation method of unit value of time and unit travel cost, Ministry of Land, Infrastructure and Tourism. Tokyo, Japan. (in Japanese). Available at: https://www.mlit.go.jp/road/ir/ir-council/hyouka-syuhou/4pdf/s1.pdf (Accessed in December, 2021).
Ministry of Land, Infrastructure and Tourism (MLIT) (2015). Current situation of freight transport: Current situation and logistics policies in Japan, Ministry of Land, infrastructure and tourism. Tokyo, Japan. (in Japanese). Available at: https://www.mlit.go.jp/common/001089688.pdf (Accessed in December, 2021).
Mohri, S. S., and Thompson, R. (2022). Designing sustainable intermodal freight transportation networks using a controlled rail tariff discounting policy – the Iranian case. Transp. Res. Part A Policy Pract. 157, 59–77.
Neubauer, M., and Schildorfer, W. (2022). “Towards truck platooning deployment requirements,” in Energy-efficient and semi-automated truck platooning. Lecture notes in intelligent transportation and infrastructure. Editors A. Schirrer, A. L. Gratzer, S. Thormann, S. Jakubek, M. Neubauer, and W. Schildorfer (Cham: Springer). doi:10.1007/978-3-030-88682-0_3
Rahimi, A. M., Dulebenets, M. A., and Mazaheri, A. (2021). Evaluation of microsimulation models for roadway segments with different functional classifications in northern Iran. Infrastructures 6 (3), 46. doi:10.3390/infrastructures6030046
Shladover, S., Lu, X. Y., Yang, S., Ramezani, H., Spring, J., Nowakowski, C., et al. (2018). Cooperative adaptive cruise control (CACC) for partially automated truck platooning: Final report. UC Berkeley: California Partners for Advanced Transportation Technology.
Song, M., Chen, F., and Ma, X. (2021). Organization of autonomous truck platoon considering energy saving and pavement fatigue. Transp. Res. Part D Transp. Environ. 90, 102667. doi:10.1016/j.trd.2020.102667
Sun, X., and Yin, Y. (2019). Behaviorally stable vehicle platooning for energy savings. Transp. Res. Part C Emerg. Technol. 99, 37–52. doi:10.1016/j.trc.2018.12.017
Theophilus, O., Dulebenets, M. A., Pasha, J., Lau, Y. Y., Fathollahi-Fard, A. M., and Mazaheri, A. (2021). Truck scheduling optimization at a cold-chain cross-docking terminal with product perishability considerations. Comput. Industrial Eng. 156, 107240. doi:10.1016/j.cie.2021.107240
Tsugawa, S. (2013). An overview on an automated truck platoon within the Energy ITS Project. IFAC Proc. Vol. 46 (21), 41–46. doi:10.3182/20130904-4-jp-2042.00110
Wang, C., and Du, Y. (2022). ELM-based non-singular fast terminal sliding mode control strategy for vehicle platoon. Sustainability 14, 4020. doi:10.3390/su14074020
Wang, M., van Maarseveen, S., Happee, R., and van Arem, B. (2019). ToolBenefits and risks of truck platooning on freeway operations near entrance ramp. Transp. Res. Rec. 2673 (8), 588–602. doi:10.1177/0361198119842821
Watanabe, D., Kenmochi, D., and Sasa, K. (2021). An analytical approach for facility location for truck platooning—a case study of an unmanned following truck platooning system in Japan. Logistics 5 (2), 27. doi:10.3390/logistics5020027
Zabat, M., Stabile, N., Frascaroli, S., and Browand, F. (1995). The aerodynamic performance of platoons: A final report, California path research report. UCB-ITS-PRR-95-35.
Zhang, L., Chen, F., Ma, X., and Pan, X. (2020). Fuel economy in truck platooning: A literature overview and directions for future research. J. Adv. Transp. 2020, 1–10. doi:10.1155/2020/2604012
Keywords: truck platooning, borderline conditions, freight transport, cost comparison, fuel cost
Citation: Kawasaki T, Tagawa H and Lau Y-y (2022) Borderline conditions for single or platooning operations in freight transport on expressways: Case study in Japan. Front. Future Transp. 3:913765. doi: 10.3389/ffutr.2022.913765
Received: 06 April 2022; Accepted: 24 August 2022;
Published: 13 October 2022.
Edited by:
Ruibin Bai, The University of Nottingham Ningbo, ChinaReviewed by:
Maxim A. Dulebenets, Florida Agricultural and Mechanical University, United StatesCopyright © 2022 Kawasaki, Tagawa and Lau. This is an open-access article distributed under the terms of the Creative Commons Attribution License (CC BY). The use, distribution or reproduction in other forums is permitted, provided the original author(s) and the copyright owner(s) are credited and that the original publication in this journal is cited, in accordance with accepted academic practice. No use, distribution or reproduction is permitted which does not comply with these terms.
*Correspondence: Tomoya Kawasaki, a2F3YXNha2lAc3lzLnQudS10b2t5by5hYy5qcA==
Disclaimer: All claims expressed in this article are solely those of the authors and do not necessarily represent those of their affiliated organizations, or those of the publisher, the editors and the reviewers. Any product that may be evaluated in this article or claim that may be made by its manufacturer is not guaranteed or endorsed by the publisher.
Research integrity at Frontiers
Learn more about the work of our research integrity team to safeguard the quality of each article we publish.