- 1Department of Computational Data Science and Engineering, North Carolina A&T State University, Greensboro, NC, United States
- 2Department of Civil, Architectural, and Environmental Engineering, North Carolina A&T State University, Greensboro, NC, United States
This research focuses on reducing traffic congestion using the competing strategies between informed and uninformed drivers. Under a mixed information framework, a navigation app provides within-day route suggestions to informed drivers using predicted information about the time-varying route habits of uninformed drivers. The informed users detour from initially proposed routes to minimize network congestion after traffic disruptions, pushing the system toward optimal equilibrium, while uninformed drivers make day-to-day decisions which push the system toward user equilibrium. Simulations considering varying fractions of informed drivers show that congestion is reduced during abrupt phase transition before reaching equilibrium by approximately 59.2% when 20% of drivers are informed, and is nearly eliminated when 80% of drivers are informed, which could be achieved through connected vehicle technologies. Shared memory multi-core parallelization improved the computational efficiency.
1 Introduction
Dynamic Traffic Assignment (DTA) algorithms have been used to capture dynamic interaction between supply and demand under equilibrium and non-equilibrium conditions in a transportation network. The two optimal conditions for a transportation network are Dynamic User Equilibrium (DUE) and Dynamic System Optimal (DSO) equilibrium (Yu et al., 2020). Most DTA algorithms solve for one of Wardrop’s equilibrium conditions using a single group of drivers who share a common objective of minimizing their own travel cost or the total system cost. This research considers a novel application of DTA which realistically simulates a transportation network in which drivers have different objectives and different time scales over which they make decisions in an attempt to optimize the system. We define informed drivers as the ones who are given predictive route guidance from a system manager (e.g., traffic operation center) through GPS-based applications and assume that these drivers will make a bounded route choice with the provided guidance. Informed drivers are expected to comply with the provided guidance if they are given sufficient incentives and/or if the new route is not noticeably different from the original choice in terms of the cost. Such compliance will become more practical with shared autonomous vehicles that are expected to lower traveler’s disutility of travel time through credits from the company for following those suggestions.
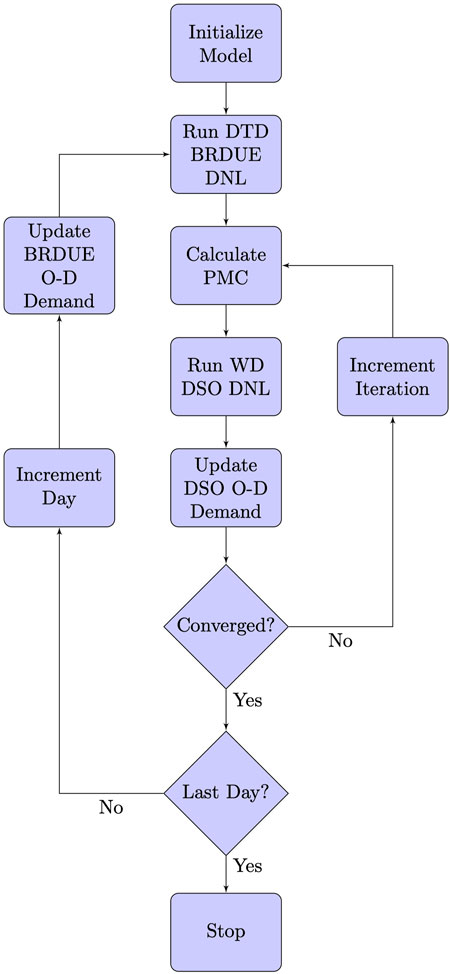
The role of information is especially relevant under expected and unexpected disruptions to infrastructure. Transportation networks are commonly impacted by short-term and long-term disruptions caused by natural or man-made events. For example, a multi-day construction zone on a highway can increase the travel time if travelers continue to follow the same route. Similarly, a post disaster event such as flooding of neighborhood streets or a tree collapse may result in reduced capacity on certain links. In this study, we propose a mixed objective framework (Figure 1) that provides a method for a group of informed drivers to reduce the within-day congestion caused by uninformed drivers who are making choices based on day-to-day habits on route and departure time after a traffic disruption. Informed drivers are provided with the within-day route guidance based on the anticipated behaviors of uninformed drivers on the network day-to-day, by adjusting route choices toward system optimum. We assume that day-to-day evolution follows the same framework as the iterative process of DTA models and accurately simulates the iterative day-to-day transition of the adaptive and bounded behavior of uninformed drivers during the disruption of a transportation network. The resulting congestion patterns are caused by uninformed drivers’ discrete decision-making processes before reaching equilibrium. The day-to-day decision-making of uninformed drivers may result in congestion depending on levels of perturbations and network congestion. This research presents a methodology to reduce the congestion caused by uninformed users making day-to-day decisions by strategically rerouting informed drivers. The within-day traffic dynamics are incorporated into the simulation at the end of the day to reoptimize (offline) next day’s informed driver strategy considering day-to-day dynamics of uninformed drivers. For an application to a post disaster event, day 1 of the model is after loading within-day travel behaviors of the day of the collapse. The methodology applied to inform human drivers in this research is also applicable to Connected Autonomous Vehicles (CAVs) operating in mixed autonomy networks.
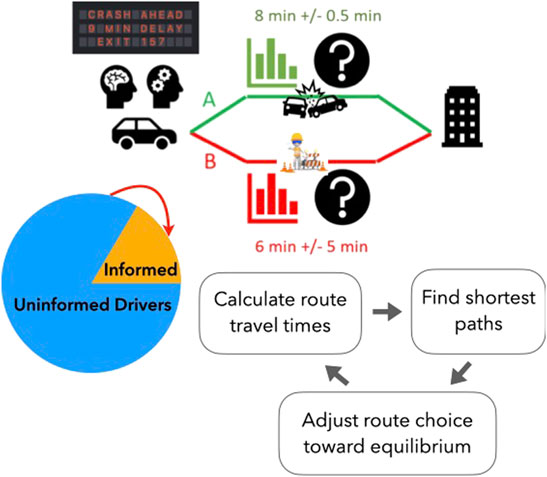
FIGURE 1. Concept DTA flow diagram where informed drivers make choices in anticipation of uninformed driver behavior driving the system towards system optimal.
Modern DTA algorithms use a Dynamic Network Loading (DNL) procedure to simulate traffic dynamics on a transportation network (Osorio et al., 2011). The procedure incorporates a cell or link transmission model and considers junction dynamics. In the presented model, the DNL procedure is used for two separate groups of drivers who are seeking different objectives over different time scales. Uninformed drivers make route choices to seek Day-to-Day (DTD) Boundedly Rational (BR) DUE. Informed drivers take detours to seek Within-Day (WD) DSO equilibrium within their indifference band, not blindly following the recommendation from a phone app or system manager. This assumption is justified because the routes for informed travelers can be selected by the system manager such that system efficiency improves, while the uninformed travelers choose routes selfishly to minimize their own time. The approach taken in this research is an upper-level algorithm that solves for Day-to-Day BRDUE and a lower-level algorithm that solves for WD DSO equilibrium. Each DTD BRDUE iteration considers the prior day’s route and departure time choices and uses this information to solve for the next day. A DTD BRDUE algorithm will not achieve equilibrium on day one, because each user must complete their trip on a given Origin-Destination (O-D) pair to make an informed decision on their next trip, which occurs the following day. This method more accurately simulates the way that a transportation network approaches BRDUE following a perturbation to the network dynamics, such as construction or a change in signal timings.
When the network is perturbed, users will experience significant delays on the day of the perturbation because the route and departure time choices for uninformed drivers are based on their experience with the prior day’s trip and their memory of other trips. If a serious delay occurs, their route and departure time choice the next day will consider this new information. In order to improve this framework by addressing Within-Day delays, a WD DSO algorithm that reacts to predictable delays caused by the behavior of DTD BRDUE seeking users is proposed. The WD DSO algorithm influences the decision-making of a subset of the population of drivers by providing them with predictive information in order to push the system toward DSO equilibrium. The rest of article is organized as follows: Section 2 highlights the main contribution of this paper against the literature. Section 3 describes the proposed mixed objective framework for uninformed and informed decision making. Section 4 describes congestion reduction for varying fraction of informed drivers. Finally, we conclude with future research directions.
2 Literature Review
Mathematical methods of achieving time-dependent User Equilibrium (UE) and System Optimal (SO) equilibrium conditions in transportation networks were established by Peeta and Mahmassani (1995). The authors found that when congestion becomes very high, the ability to reroute vehicles decreases due to gridlock. Under these conditions, rerouting vehicles fail to substantially reduce congestion. Recently, information sharing between Day-to-Day (DTD) Boundedly Rational Dynamic User Equilibrium (BRDUE) seeking agents in a DTA simulation has been explored (Han et al., 2019; Yu et al., 2020). Within-Day (WD) Dynamic System Optimal (DSO) DTA problems have also been solved using a novel projection model in conjunction with a cell transmission model (Doan and Ukkusuri, 2015). A mixed behavior model of UE and stochastic UE in DTD route flow evolution was modeled (Zhou et al., 2017). In line with those advances, in this paper, we provide the drivers with predicted information of the future state during the critical period when they can change the decision before reaching equilibrium, especially when we still have room to reroute a subset of vehicles that can reduce congestion. Below, we review proactive routing guidance under uncertain information to reach BRDUE and BRDSO considering time-varying route habits of drivers.
A proactive route guidance was proposed to assign users to a small subset of all the possible paths considering the maximum travel inconvenience allowed (Angelelli et al., 2018), then the solution was extended to column generation algorithm to improve the exponentially increasing size of the path (Angelelli et al., 2021). The Predictive DUE (PDUE) condition in which a user chooses a route that minimizes the actual travel time along the route to the user’s destination while anticipating the future traffic state has been explored (Varia et al., 2013). The PDUE concept has been successfully applied to macroscopic pedestrian flow models (Jiang et al., 2016). The possibility to solve for a PDUE condition in congested capacity-constrained networks using DTA and the method of successive averages (MSA) has been demonstrated (Yildirimoglu and Geroliminis, 2014; Yildirimoglu et al., 2015; Yu et al., 2020). DTA using mesoscopic fundamental diagram dynamics has been applied to a multi-region network composed of 3 regions and 19 sub-regions (Yildirimoglu et al., 2015). Results showed that using route guidance to push a network toward a system optimal condition does not penalize a significant proportion of drivers. The route choice behavior with information under uncertainty was investigated (Avineri and Prashker, 2006). Analysis of the effects on transportation networks by human drivers operating under mixed information on simple single Origin-Destination (O-D) networks with two route choices was performed (Litescu et al., 2015; Litescu et al., 2016b). Prior research examining the effects of informed and uninformed drivers indicated that the stability of the network is dependent upon the percentage of informed drivers (Litescu et al., 2015). In a network in which drivers are given a choice over the route, but not departure time, the authors demonstrated that a level of approximately 40% informed drivers provides optimal network performance; however, network instability arises when the number of informed drivers deviates from the optimal percentage (Litescu et al., 2015). The authors did not investigate predictive decision making by informed drivers, rather the authors assumed that informed drivers make instantaneous decisions based on the current state of the network.
Additional evaluation of the effects of information uncertainty under the same network and conditions was performed (Litescu et al., 2015; Litescu et al., 2016b). The authors determined when informed drivers receive imperfect information, the equilibrium condition for a transportation network is still highly correlated with the fraction of informed drivers, with the level of 40% informed drivers being the most robust to information inaccuracy under the conditions of the study. Agent-based behavioral models of driver compliance with Variable Message Sign (VMS) suggestions based on survey data have been developed (Litescu et al., 2015). The author considered the effects of VMS on drivers in a simulation of the Brisbane Western corridor. Several model application areas were identified, including varying the type and accuracy of the presented information, as well as varying the fraction of users provided with information. Research has demonstrated that dynamic perturbations to traffic light timing can negatively impact congestion under light traffic loads, due to drivers’ difficulty in predicting the behavior of the traffic light (Litescu et al., 2016a). DTA literature has focused on estimating the impact of information on bounded choice and mitigating traffic congestion under DUE and DSO conditions, either within-day or day-to-day.
Mahmassani and his colleagues have shown that the “indifference band” of commuters may cause them not to switch to shorter paths even all path cost information is available to travelers (Mahmassani and Jayakrishnan, 1991; Mahmassani and Liu, 1999; Mahmassani, 2001). Boundedly rational dynamic user equilibrium (BRDUE) and variable tolerance boundedly rational dynamic user equilibrium (VT-BRDUE) problems have been analyzed (Simon, 1962; Han et al., 2015). In the latter problem, the path used and actual departure rates determine the tolerances of boundedly rational users in system. A comprehensive review of models and methodologies for boundedly rational route choice behavior was composed by Di and Liu (2016). The authors note that models which assume perfect rationality suffer from estimation and prediction errors. Additionally, human behavior under stable situations is myopic as well as significantly based upon formed habits (Jotisankasa and Polak, 2006; Di and Liu, 2016). Unified methods for determining driver route choice behavior with models that consider bounded rationality and learning mechanisms have been considered (Di and Liu, 2016). The use of thresholds has been considered for updating driver perceptions when a discrepancy between perceived travel time and experienced travel time exists (Jotisankasa and Polak, 2006). The consequences of BRUE on the Braess paradox, which describes the paradoxical discovery that the addition of more links to a transportation network can worsen travel times, have been explored (Di et al., 2014). The Braess paradox is largely addressed by bounded rationality, but can still occur for travel demands which fall within a certain range. The authors found that the Braess paradox can be avoided by reducing discrepancies between selfish routing and optimal routing.
Real-world agents have been shown to repeat habitual behavior until prompted to search for alternatives, for example, when searching for different mechanisms of meeting their travel demand (Xiong et al., 2015) with data-driven methods (Zhu et al., 2010). Bias caused by self-reporting preference data and driving simulators’ impact of en-route diversion decisions under real-time information has been considered (Xiong and Zhang, 2013a). Modeling of agent level departure time choice under uncertainty has demonstrated that under high uncertainty, agents do not easily converge on an optimized equilibrium (Xiong and Zhang, 2013b). Research has demonstrated that flexible work schedules allow departure times to vary more greatly which reduces congestion in a transportation network (Zhu et al., 2015). The authors found that congestion could be reduced even when a relatively small percentage (10–20%) of road users had flexible work schedules. Agent-based simulations of an interstate corridor in Washington, D.C. have revealed that 6.2% of trips during peak-hours will switch departure times to avoid congestion (Zhang et al., 2013).
To summarize, there are four contributions of this study:
• This paper extends the mixed information framework by providing within-day route suggestions to informed drivers using predicted information about the time-varying route habits of uninformed drivers. The informed users detour from initially proposed routes to minimize network congestion after traffic disruptions, pushing the system toward optimal equilibrium, while uninformed drivers make day-to-day decisions which push the system toward user equilibrium.
• This paper predicts the delay caused by random perturbation through DTD BRDUE simulation and provides WD DSO decision-making for informed drivers, while considering their bounded rationality. Rather than computationally intensive MSA, we only suggest a small subset of feasible alternative paths within small changes of original utility.
• This paper introduces a new predictive and mixed information framework of competing strategies between informed and uninformed drivers and further reduces traffic congestion.
• This paper captures the effect of perturbation by approximating path marginal cost (PMC) for each path and solve BRDSO DTA while avoiding overestimation (Peeta and Mahmassani, 1995) and underestimation of PMC (Qian and Zhang, 2011; Qian et al., 2012).
3 Methodology
3.1 Novel Mixed Objective Framework
Unlike prior research, the presented model contains a mixture of informed and uninformed drivers with different routing behaviors towards reaching equilibrium across different time scales. Uninformed drivers make their route and departure time choices based on the memory of their own prior effective travel cost (Han, Eve, and Friesz, 2019) and selfishly seek to minimize their own travel time (Wardrop, 1952). If all drivers are uninformed, the route choices will iteratively converge to the BRDUE conditions. The informed drivers in the presented model are assumed to be accessing an app, which they use to determine their route and departure time choice. The informed drivers make within-day decisions based on the information presented by the app, which suggests the best routes based on the predicted network state for that day. Unlike the uninformed drivers, informed drivers are given routes that seek to push the system toward WD DSO equilibrium. Informed drivers’ route and departure time choices are calculated using a separate within-day DNL procedure. The within-day DNL procedure is used to calculate the PMC for each route and departure time. PMC considers the additional delay on all other drivers when an informed driver chooses a given route and departure time.
• Group 1 (Uninformed): Choose route and departure time based on Effective Path Delay simulated in Figure 2), using DTD BRDUE DTA algorithm, influenced the transition between the presence of perturbations and after removal of perturbations. Details on the network is in the scenario design of result section. These drivers are selfishly seeking to minimize their own travel time (Wardrop, 1952).
• Group 2 (Informed): Choose route and departure time using a smart phone navigation app, which suggests routes with the least PMC. This is calculated using a within-day DTA algorithm. These drivers are directed to push the system toward DSO, mitigating congestion caused by the inability of uninformed drivers to predict perturbations in the network.
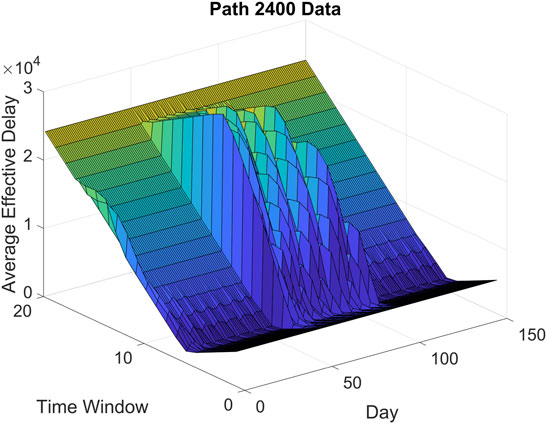
FIGURE 2. Sioux Falls Network average Effective Path Delay for path 2,400, out of 6,180 paths, for each day and departure time window for uninformed drivers under bounded rationality. src = d1
The extent to which Group 2 (Informed drivers) can be rerouted is subject to additional constraints based on information gained for other informed drivers and their own indifference bands. Informed drivers need to be convinced to choose a system optimal route and it will only work over time if the maximum deviation from a user optimal route is within their indifference band, which is defined as a range of total travel times over which the informed travelers are indifferent. For example, if the shortest travel time at DUE between an OD pair is Z units and the indifference band for an informed traveler is z units, then informed travelers are convinced to switch their routes and departure times based on their experienced travel time such that their resulting travel time is at most Z + z. In our simulations, we assume the range of indifference band is up to 400 s following Han et al. (2019). This system more closely approximates the mixed autonomy and mixed information conditions that are likely to be encountered in transportation networks during the next decade. This research is particularly applicable to smaller and mid sized cities where less information is available and uninformed drivers are more likely to repeatedly use the same route based only on past experience. The total system costs are then compared across the two scenarios: (a) the DTD BRDUE algorithm alone and (b) the mixed information group using the DTD BRDUE and WD DSO algorithms. A flow diagram in Figure 3 outlines the general framework. The mixed objective model starts from the initialization of the demand for each O-D pair at each departure time without informed drivers switching routes, run day to day and within-day DNL until the minimum solution is found in DSO with informed drivers strategy for a fixed number of days.
3.2 Dynamic Network Loading Model
Han et al. (2019) described the BRDUE DNL framework presented in this section in their research.
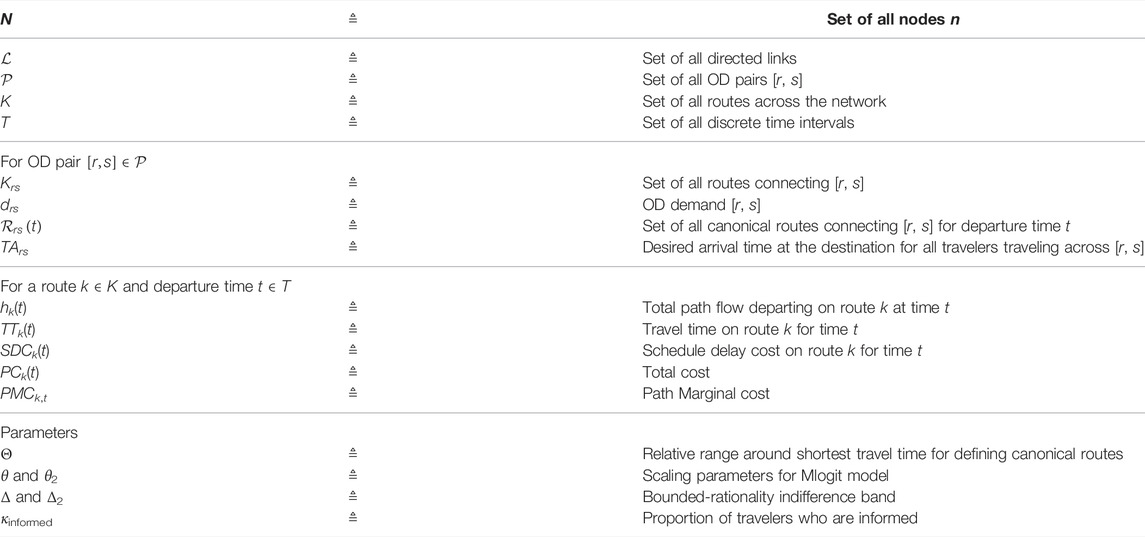
Table of notations (Table 1) summarizes all the notations used in this paper.
Consider a traffic network represented by a directed graph
Let
Next, we describe the dynamic network loading model. Eq. 2 denotes the link occupancy (Figure 4), or the number of vehicles on a given link
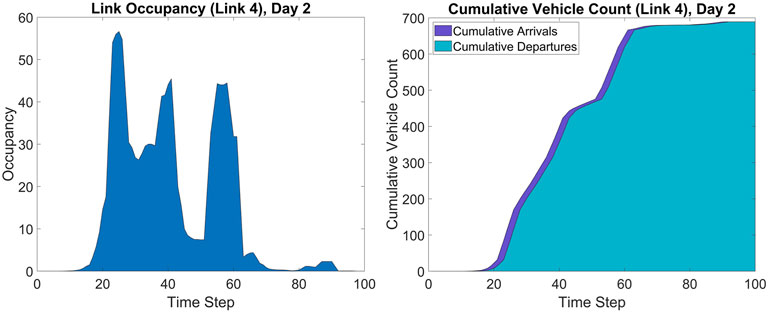
FIGURE 4. Example Link (Left) Occupancy curve for one of the links in the Sioux Falls network and (Right) Cumulative Arrival and Departure curves.
The density ρl(t) on link l at time t is denoted by Eq. 3 as a function of the number of lanes on the link (denoted by nl) and the length of the link (denoted by Ll).
This density function can be generalized for any spatial location x measured along the length of a link l at time t, represented as ρl (t, x), by taking the limit of the ratio of total time with the total area in the time space diagram as the area of the region becomes infinitely close to zero centered at point (t, x) (?).
Models for traffic flow determine the variation of density for different times and locations. The Lighthill-Whitham-Richards (LWR) model (Lighthill and Whitham, 1955; Richards, 1956) assumes a deterministic relationship between density and flow expressed as fundamental diagram and denoted by fl (⋅) for all links
where xl is any point along the length of the link
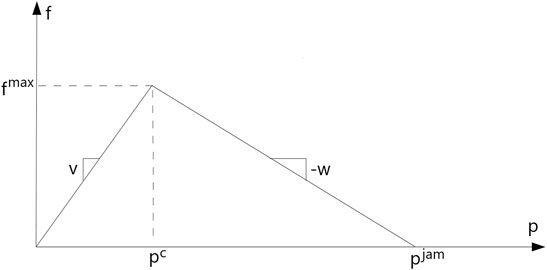
In our model, we assume the flow function fl (⋅) in the LWR model is given by a triangular fundamental diagram as shown in Figure 5. This fundamental diagram uses two linear functions to approximate the relationship between flow and density on any given link. The intercept of the two functions is the critical density
To solve the PDE in Eq. 4 we need to know the time-varying rates of maximum flow that can enter each link (link demand) and the time-varying rates of maximum flow that can exit each link (link supply). The time-varying supply and demand functions for each link, denoted by S (ρl(t)) and D (ρl(t)) respectively, can then be approximated using the triangular fundamental diagram (Lebacque and Khoshyaran, 2013), where C is the link capacity.
The flow model on each link can be extended to networks with multiple links meeting at junctions, which are nodes with at least one incoming and one outgoing link (Han et al., 2019). Let
where
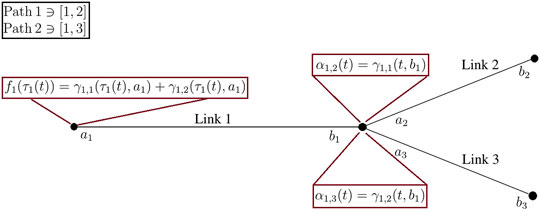
Various junction dynamics determine how flows split at each junction. In our model, we consider a path-based DNL that tracks flow on each path. The decision making of users who pass through each junction are considered in Figure 6 to calculate the actual supply and demand on each of the connecting links. This is accomplished by calculating the proportion of users on an incoming link m ∈ M who will select the outgoing link q ∈ Q. Given the cumulative arrival and departure curves, it is possible to determine an entry time for each link τm(t) based on the exit time (t) for a link m. Let γm,k (t, bm) denote the proportion of flow leaving link m from its exit point bm along route k at time t. Following the first-in-first-out principle and using the link entry time for a given exit time, the proportional contribution of an individual path flow to the total flow on a given link at time t can be estimated as follows:
In other words, the proportion of flow leaving link m along path k at time t is equal to the proportion of flow entering link m at time τm(t). The sum of these proportions on link m over each path containing two connected links m and q gives the total proportion αm,q(t) of flow entering link q from link m at time t as shown in Figure 6. That is,
A distribution matrix
The non-junction nodes such as source nodes with no incoming links and sink nodes with no outgoing links consider a simplified traffic dynamics. Sink nodes are assumed to have infinite sink capacity allowing the flow on routes terminating at the sink node to exit. On contrary, source nodes may not be able to load the entire demand if the outgoing links experience queue spillback. A point-queue model is used to account for the dynamics at origin nodes (which includes source nodes or junctions that also act as origins). We skip the details for brevity and refer the reader to Han et al. (2019) for more details. In the following section, the uninformed and informed driver models are introduced.
3.3 Uninformed Driver Model
We model the day-to-day behavior of drivers after a disruption to the network where drivers adapt their departure time and route choice. Let
First, to circumvent exponentially high number of routes, we narrow the set of possible routes over which travelers consider updating their routes. We define canonical routes as the set of routes that deviate from the fastest path (i.e., minimum travel time path) within a specified tolerance. For a traveler departing from O-D pair
where TTk(t) is the travel time on route k for departure time t,
Building on the BRDUE model proposed by (Han et al., 2015), we update the route and departure time decisions for uninformed drivers using a Multinomial Logit Model (Mlogit). Let (k,t)d denote the choice tuple representing the route and the departure time on day
The utility of a choice is approximated using the perceived cost (Figure 7) of each route and departure time choice for every O-D pair. We assume homogeneity across all travelers between an origin-destination pair.
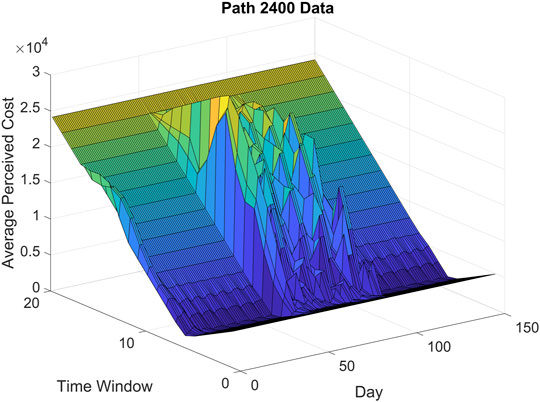
FIGURE 7. Sioux Falls Network perceived cost in seconds for path 2,400, out of 6,180 paths, for each day and departure time window.
The perceived cost for each route and departure time, in terms of both travel time and schedule delay (early or late arrival), is calculated in Eq. 13
where SCDk(t) is the schedule delay cost for path k and departure time t, given by Eq. 14,
where ATk(t) = t + TTk(t) is the actual arrival time at the destination for route k and departure time t, TArs is the desired arrival time for all travelers associated with the OD pair [r, s](a single value assumed to be known apriori for each OD pair), ϕe is the coefficient of early arrival penalty, and ϕl is the coefficient of late arrival penalty. Eq. 13 can now be incorporated into the Mlogit model.
The Mlogit model estimates the probability of choosing an alternative given the utilities across all alternatives. Let Crs be the set of all alternatives for all travelers across an OD pair
For the Mlogit model, the utility of an alternative (k, t) ∈ Crs is given by U(k,t) = −PCk(t) + ɛ(k,t), where ɛ(k,t) are the error terms associated with the utilities that are assumed to be independent and identically distributed as a Gumbel distribution with a scale parameter θ > 0 and location parameter assumed to be 0. Given the assumptions, the probability of choosing alternative (k, t) ∈ Crs for travelers between OD pair [r, s] is given by:
and the path flows for a given departure time is computed as:
To model the boundedly-rational behavior of travelers, we consider an indifference band Δ that increases the utility of current alternative thus increasing the likelihood that the traveler continues to stay on the currently chosen alternative over the next day. Adding a superscript d denoting the day of travel, we denote by
Equation 17 shows the update of flow from one day to the next.
where
and
It is easy to verify that if Δ = 0, then
3.4 Informed Driver Model
Informed drivers in the presented model are given route suggestions that minimize a cost function representing the total system cost. These users seek to reduce congestion faced by all other drivers in the network, but without noticeably penalizing themselves. Such a cost function needs to consider both the system-level cost and the cost to the user when selecting a path and departure time.
3.4.1 DSO Computation
Let h = {hk(t)|k ∈ K, t ∈ T} denote the departure-rate pattern as a vector of all path flows at different departure times. The DSO formulation is defined using the following optimization problem (Doan and Ukkusuri, 2015)
subject to the following constraints:
where hk(t) is the departure rate, and PCk,t is the perceived cost for route k at time t, and TSC is the total system cost.
As shown in Doan and Ukkusuri (2015), a departure rate pattern h is a DSO solution if and only if it is equilibrated based on the corresponding path marginal cost (PMC). The PMC is defined as the increase in total system cost incurred when an additional unit of flow is added to the departure rate pattern hk(t). The PMC for route k at time t is calculated in Eq. 23
where
Naively using a DNL algorithm to calculate the PMC for each path and departure time is computationally demanding for anything beyond small-scale toy networks with the limited route and departure time choices. For a set of all time periods, the naive method requires
We approximate the
Let’s assume that an estimate for the travel time on route k at departure time t can be calculated using the BPR function (24) (Bureau of Public Roads (BPR), 1964)
where t0,k is the free flow travel time (defined as the sum of free flow travel time on path links), hk(t) is the flow (e.g. veh/hr) on route k at time t,
While the congested links and time of congestion are computed from DNL, we consider the revised BPR to approximate the change in cost to all other paths due to change in flow on path k. To compute the impact of one unit of flow with and without the presence of congestion, we find all the paths that go through congested links in route k and iterate through all of the links in route k. Once the value of
Substantial computational improvements are made by only calculating PMC for paths and times which incur congestion and which propagate congestion onto other paths and departure times (Doan and Ukkusuri, 2015). This is accomplished by avoiding computing PMC for all uncongested paths and times, since these paths and times are assumed to be traversed at the free flow travel time and have no marginal cost on other paths or departure times. In addition, no PMC calculations are required for other paths and departure times which are unaffected by congestion on a given path at a given time. As shown in the triangular fundamental diagram (Eq. 5), there is no impact of an additional vehicle below critical density for the link. Using these methods, the total number of paths and departure times requiring PMC calculation is minimized for a given spatiotemporal distribution of congestion in the network. After PMC for each path is solved, informed drivers make an updated decision using the Informed Driver Mlogit Model (IDMM) described in the next subsection, then the DNL model is executed to generate a new congestion pattern based on the decisions of informed drivers.
3.4.2 Informed Driver Mlogit Model (IDMM)
Finding DSO for informed drivers requires multiple iterations of route and departure time decisions. Unlike the MSA and quadratic programming models presented by Doan and Ukkusuri (2015), in each subiteration i of DSO computations route and departure time decisions for informed drivers are made using the Mlogit model. Mlogit models are used for alternative-invariant problems, meaning that the regressor does not vary over the alternatives but does vary over the individual. Since the PMC already accounts for the effect that selecting an alternative has on all other alternatives and presents it as a cost which varies only over the individual, the IDMM described in this section can be treated as alternative-invariant.
Informed drivers also consider route choice over a limited canonical set of routes as defined in Eq. 12. For the informed drivers, the utility of an alternative (k, t) ∈ Crs is given by U(k,t) = −PMCk,t + ɛ(k,t). The PMC for each path k and departure time t available to the O-D pair p is calculated for use in the IDMM. As in the previous section, the selection of base alternative for each solution is sequentially selected from the set of paths between the O-D pair and the set of possible departure times.
where
The update of flow from one iteration to the next is governed by the IDMM model. For each OD pair
Path flow update from iteration i to i + 1 for computing DSO is computed as follows. First, adding a superscript i, DSO denoting the subiteration of DSO computation, we denote by
Equation 26 shows the update of flow from one iteration to the next.
where
and
The iterative process of shifting travelers along different alternatives continues until convergence criteria is met. While convergence guarantees are hard to establish, for our experiments, we terminate the iterative process after a fixed number of DSO iterations.
3.5 Parallelization
An additional convenient property of the WD DSO methodology is that it is easily parallelized, allowing further computational improvements over the serial method. The ease of parallelization comes from the fact that each calculation of PMC only considers the effect of one path and departure time on all other paths and departure times. Each PMC calculation is independent of other PMC calculations. Therefore, parallelization can be applied to make the problem more computationally tractable on the Sioux Falls Network with 6,180 paths and 100 departure time windows. Without using parallelization and other methods to reduce the number of required DNL solutions, solving the problem requires sequentially executing the DNL algorithm 618,000 times per DSO iteration, with a large number of DSO iterations required to converge using MSA.
Simulations were performed using an Intel® I7-8700K 6 core, 12 thread CPU running at 4.3GHz continuously on all cores and 32GB of DDR4 memory at 3200MHz implemented in MATLAB® (MATLAB, 2019). With parallelization on a 12 threads CPU, the expected speedup relative to a single core can be estimated using Amdahl’s Law (Amdahl, 1967) in Eq. 29
where S is the speedup, s is the number of threads, and f is the fraction of the algorithm which benefits from parallelization. Figure 8 shows the relationship between the number of processors and the speedup, and the fraction of parallelizable code and the speedup, respectively.
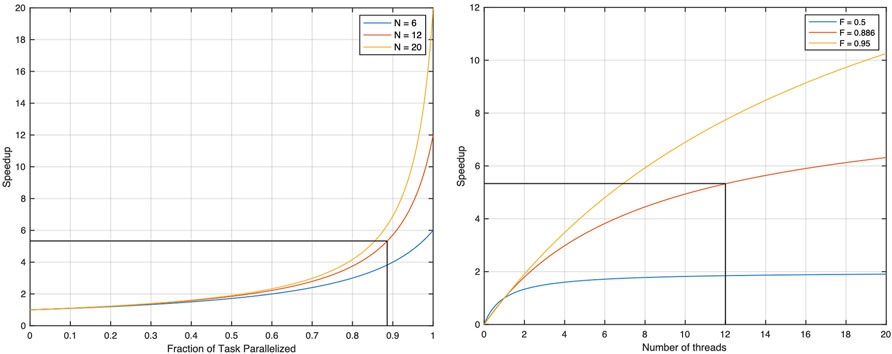
FIGURE 8. Effect of varying the number of threads and the fraction of parallelizable code on speedup.
As a result of several simulation, observed speedup of 5.3 by using 12 threads provides us the 0.886 as the fraction of the algorithm which benefits from parallelization.
Original computational times were projected to take approximately 30 h based on the number of iterations required and several hours of testing with smaller numbers of DSO iterations. Compute times were first reduced through the careful use of constraints that avoid computations for non-congested routes to approximately 8 h. After parallelization the computational time required to generate a solution averaged approximately 1.5 h.
4 Results
4.1 Experimental Design and Procedure
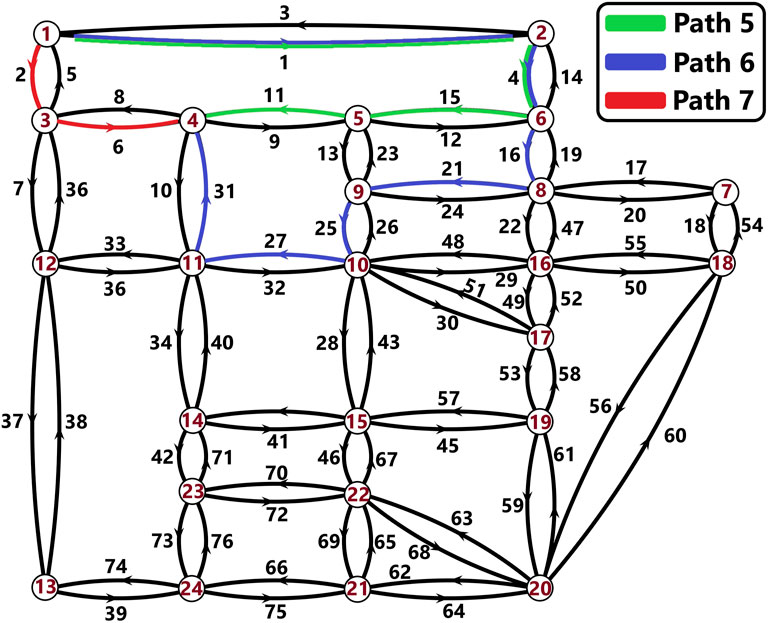
The experiment is conducted on the Sioux Falls Network using a DTA algorithm by extending the DTD BRDUE package developed by Han et al. (2019) with the addition of a WD DSO algorithm and another group of drivers who use a competing WD DSO strategy. The Sioux Falls Network contains 24 nodes, 76 links, 528 O-D pairs, and 6,180 routes. There are 20 departure time windows containing 5 departure times each, for a total of 100 possible departure times. Figure 9 shows three possible paths from Node 1 to Node 4 in the Sioux Falls Network, which are paths 5, 6, and 7 in the list of 6,180 routes. Two of these paths contain shared links, and users choosing paths 5 or 6 will contribute to congestion on links 1 and 4. Therefore, users choosing path 5 can worsen congestion for users on path 6, and the opposite is also true. Users choosing path 7 should not contribute to congestion for paths 5 and 6 because there are no shared links in the paths.
For the first day, demand for each O-D pair at each departure time is initialized and the DNL algorithm calculates the delay for each route and departure time. Two groups of drivers are initialized by multiplying total demand by a user defined informed driver fraction. If this fraction is 1/5, then 80% of the demand will be assigned to Group 1 and 20% will be assigned to Group 2. Group 1 drivers are uninformed and work toward DTD BRDUE, while Group 2 drivers are informed and push the network toward WD DSO equilibrium. Informed and Uninformed demand are always summed as an input to the DNL procedure, but the groups make separate route and departure time choices, while switching to predicted alternate routes will be based on the bounded rationality of drivers.
The first run through the DNL procedure generates the expected delay for the day based on the initialized O-D demand without the informed-decision strategy. Using the anticipated delay, the marginal cost of each route is estimated as the increase in the cost of each route for a small change in the OD demand for the associated route’s OD pair. Informed drivers are recommended routes and departure times using the marginal cost of each route such that the total system cost is minimized. The new route and departure time choices for the informed group of drivers are the informed group demand. This demand is summed with the uninformed group demand and input into the DNL algorithm to determine the actual route delays for the day.
4.2 Scenario Design
The simulation is run for two consecutive days, with the first day representing a perturbation in O-D demand. Uninformed users lack the ability to predict the effects of this perturbation and thus create severe delays on the first day of the perturbation. Additionally, once the perturbation is removed, uninformed drivers require additional time to return to their previous behavior patterns. The presented model is expected to perform best during these perturbations; however, if no significant congestion is present, then most informed drivers will not switch routes because the opportunity for congestion reduction is minimized and the network will approach a BRDUE condition.
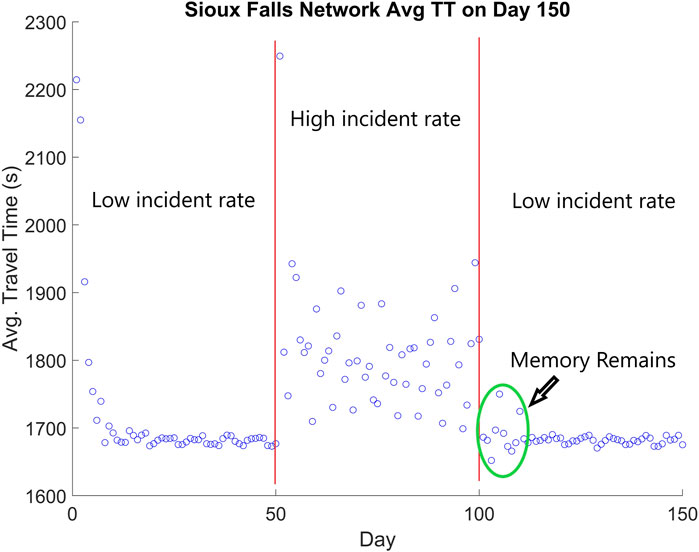
Figure 10 display average travel time and effective path delay after a 150 days simulation for uninformed drivers. Because daily route choices are influenced by the weighted experience of the past 3 days and its tasks for travelers to adapt to a new equilibrium, this research focuses specifically on the transition between the presence of perturbations and after removal of perturbations. We focus on perturbations caused by disruption such as random incidents, traffic crashes, and work zones, having an impact to cause a change in travelers’ route choices. In the first 50 days, the incident rate is low and the uninformed drivers quickly reach a BRDUE condition after several days. During the second 50 days, a period of daily perturbations is caused by high incident rates. As shown in samples in the green circle in Figure 10, the uninformed users are unable to adapt to these perturbations, because their daily route choices are dictated by the weighted experience of the past 3 days. The final 50 days show a return to the low incident rate; however, the uninformed drivers require several days to adjust before again achieving a BRDUE condition, which is the focus of this study. The effects of the informed decision are highlighted on the day when the perturbation occurs and the next day when the memory still remains. While planned construction sites will provide us enough time to compute long-term dynamics of the system, updates on short-term dynamics from random event will be challenging. We are not running this computationally demanding simulation in real-time, but the app provides the already simulated information in real-time. The online update and real-time validation/correction of travel time is outside of the scope of this study.
Given an initial departure rate on the Sioux Falls Network, the effects of varying the fraction of informed drivers on network congestion, O-D gap, and average travel time are considered. The informed drivers make within-day decisions which reduce the congestion caused by uninformed drivers who are following the DTD BRDUE model. The O-D gap is defined as the difference between the maximum and minimum travel time TT for each path k between O-D pair p, as shown in Eq. 30
Starting from the initial O-D demand, the initial departure rate is determined. This departure rate can be considered as a substantial perturbation from the equilibrium state of the system e.g., even when 20% of drivers on a path with congestion are informed. Figure 11 shows the Day 1 congestion when 20% of the users are informed and switch their route and departure time in order to reduce congestion on all other paths. The perturbation occurs on Day 1 and uninformed users decide to switch their route and departure time choices on Day 2, based on their perceived travel times for the previous day. If no additional perturbations occur, a system of uninformed users will reach a stable BRDUE equilibrium after several days; however, within day delays will occur prior to the system equilibrating. This paper focuses on the within-day transition of traffic state on Day 1 and day-to-day transition of traffic state on day 2, with informed and uninformed decision making strategy. For uninformed drivers, it is expected to take several days to realize the removal of the perturbation in the first day. The departure rates for Day 1 are input to the DTD BRDUE DNL algorithm. This DNL algorithm generates the predicted delay for the network given the initialized demand, assuming that all departures seek DTD BRDUE, as shown in Figure 11.
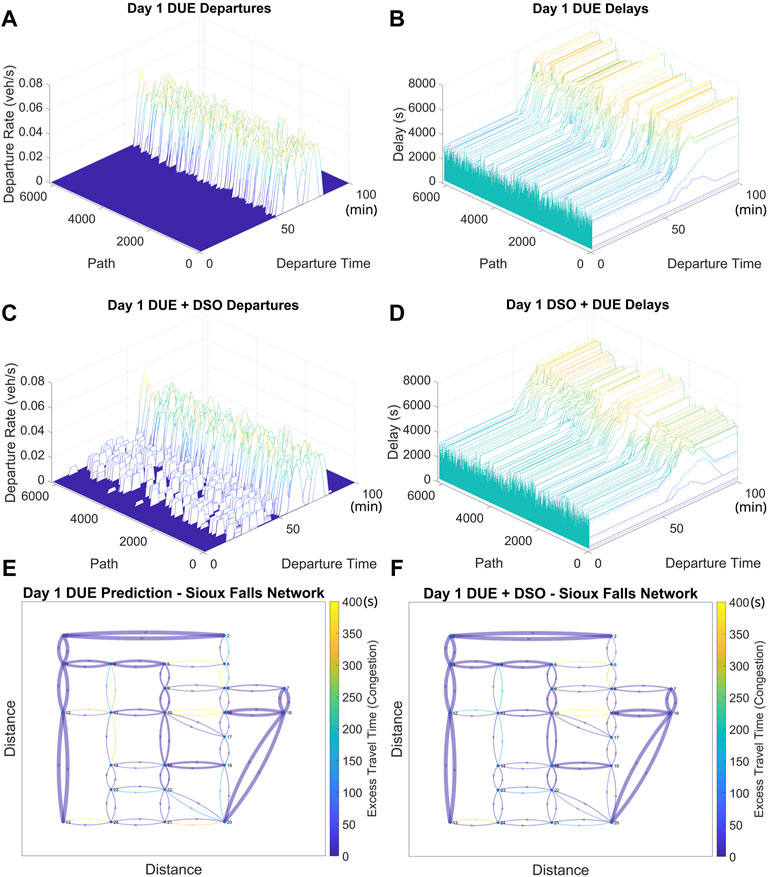
FIGURE 11. (A) Initial network departures on Day 1 based on initialized O-D demand, prior to informed drivers switching routes. (B) Initial delays on Day 1 based on initialized O-D demand, prior to informed drivers switching routes. (C) Network departures on Day 1 with DSO seeking route choices by the informed driver group. (D) Network delays on Day 1 with DSO seeking route choices by the informed driver group. (E): Uninformed DUE Avg. Excess TT on Day 1. (F) Mixed Objective Avg. Excess TT on Day 1.
In this scenario, the perturbation is caused by a large number of drivers departing within a short period of time Figure 11A. The network does not have sufficient capacity for this number of departures and the significant delays shown in Figures 11B,E will be incurred unless some drivers change their route and departure time choices. Many of the drivers whose departure time is DT > 70 will not complete their trip prior to the end of the final departure time window. This is indicated by the constant delay values for departure times of 70 < DT ≤ 100 on most of the congested paths.
The predicted delays are used as an input to the DSO algorithm, which outputs a PMC for each path and departure time. Using the PMC information, the informed driver group makes route and departure time choices which seeks to minimize congestion and delays for all other drivers. The DSO algorithm then outputs a new path departure rate (Figure 11C). The final adjusted delay (Figures 11D,F) for the network on Day 1 is the total contribution of the uninformed group (80% of drivers), which does not change their original route and departure choice, and the informed group (20% of drivers on a path with congestion), who do change their route and departure time choice in order to minimize congestion and delays in the network. Compared with the BRDUE only prediction, the paths with constant delay extending to the final DT window have less delay overall when 20% of informed drivers are rerouted. Additionally, the departure times which will not reach the destination before the final departure time window are moved closer to the final departure time window. The scenario will have 6 days of memory remaining to drivers, with the weight of 0.7, while a total number of days are set to be 2 days to show the effect of informed strategy for the first and second day.
The predicted congestion, represented as average excess travel time, incurred on individual links within the Sioux Falls Network given the initial 100% uninformed departure rate is given by Eq. 31
where TTk,t is the actual travel time and FFTk,t is the free flow travel time for route k and departure time t. The edge weights in Figures 11E,F represent the capacity for each link, with thicker edges indicating links with greater capacity.
The initial departures for Day 2 assume that all users are seeking BRDUE (Figures 12A,B). This new departure rate pattern (Figures 12C,D) is calculated based on the BRDUE + DSO departure rate pattern from Day 1. Some congestion exists in departure time windows closer to the middle of the evaluation period for Day 2, but because less congestion exists on Day 2, the potential improvement in average travel time by using DSO algorithm is less. Nonetheless, the adjusted departure rates after executing the DSO algorithm further reduce this mid-period congestion noticeably.
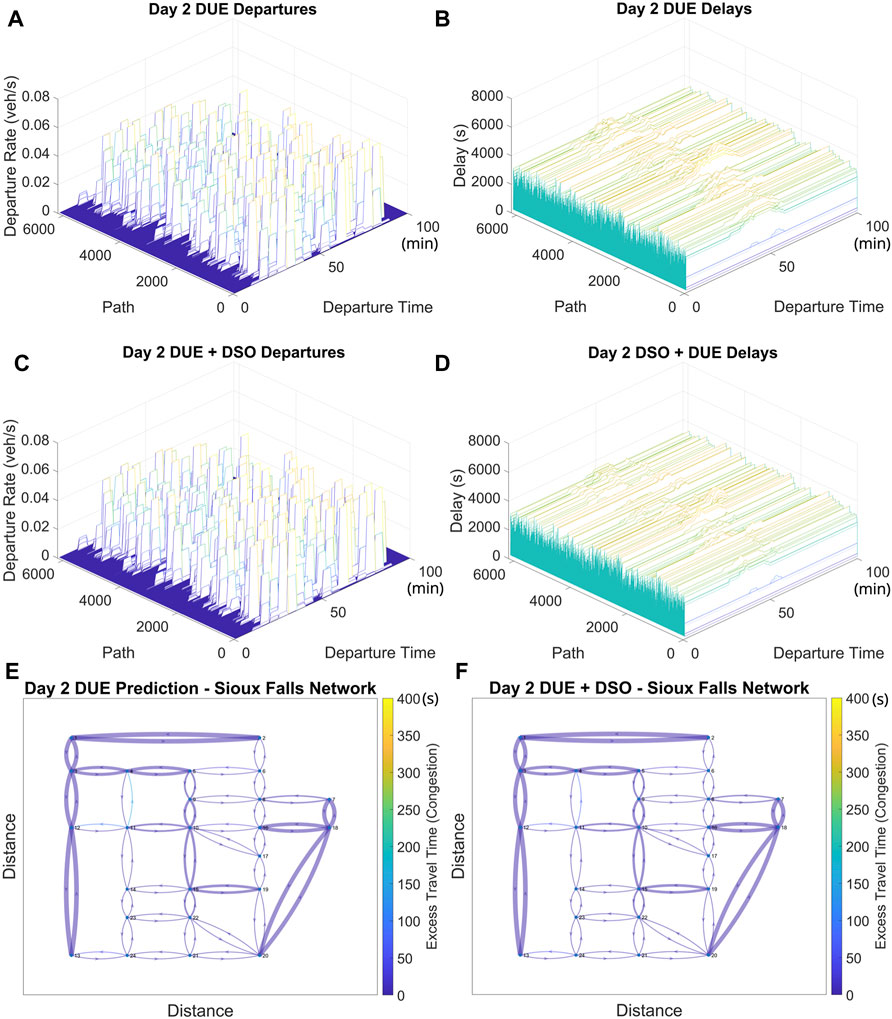
FIGURE 12. (A) Initial network departures on Day 2 based on initialized O-D demand, prior to informed drivers switching routes. (B) Initial delays on Day 2 based on initialized O-D demand, prior to informed drivers switching routes. (C) Network departures on Day 2 with DSO seeking route choices by the informed driver group. (D) Network delays on Day 2 with DSO seeking route choices by the informed driver group. (E) Uninformed DUE Avg. Excess TT on Day 2. (F) Mixed Objective Avg. Excess TT on Day 2.
Figures 12E,F shows the predicted Day 2 average excess travel time (Eq. 31) for the Sioux Falls Network if all users seek BRDUE and the average excess travel time for the BRDUE + DSO departure rate pattern. A comparison of the two figures shows a reduction in excess travel time for the two links which were predicted to be congested prior to executing the DSO algorithm.
Figure 13 contains histograms of the travel time gaps in units of hours for Day 1 given 0%, 20%, 40%, and 80% informed drivers. The gaps in each histogram are provided for all paths instead of limiting the gaps to each O-D pair, as this more clearly demonstrates overall network congestion levels for different levels of informed drivers. Figure 13 shows that when 0% of drivers are informed, excess travel times can be as high as 1.5 h with many paths having travel times of 30 min to 1 h. When 20% of drivers are informed, excess travel time is reduced by 30 min and most paths require less than 30 min. Additional improvements occur when 40% and 80% of drivers are informed, with the latter case reducing excess travel time to below 12 min.
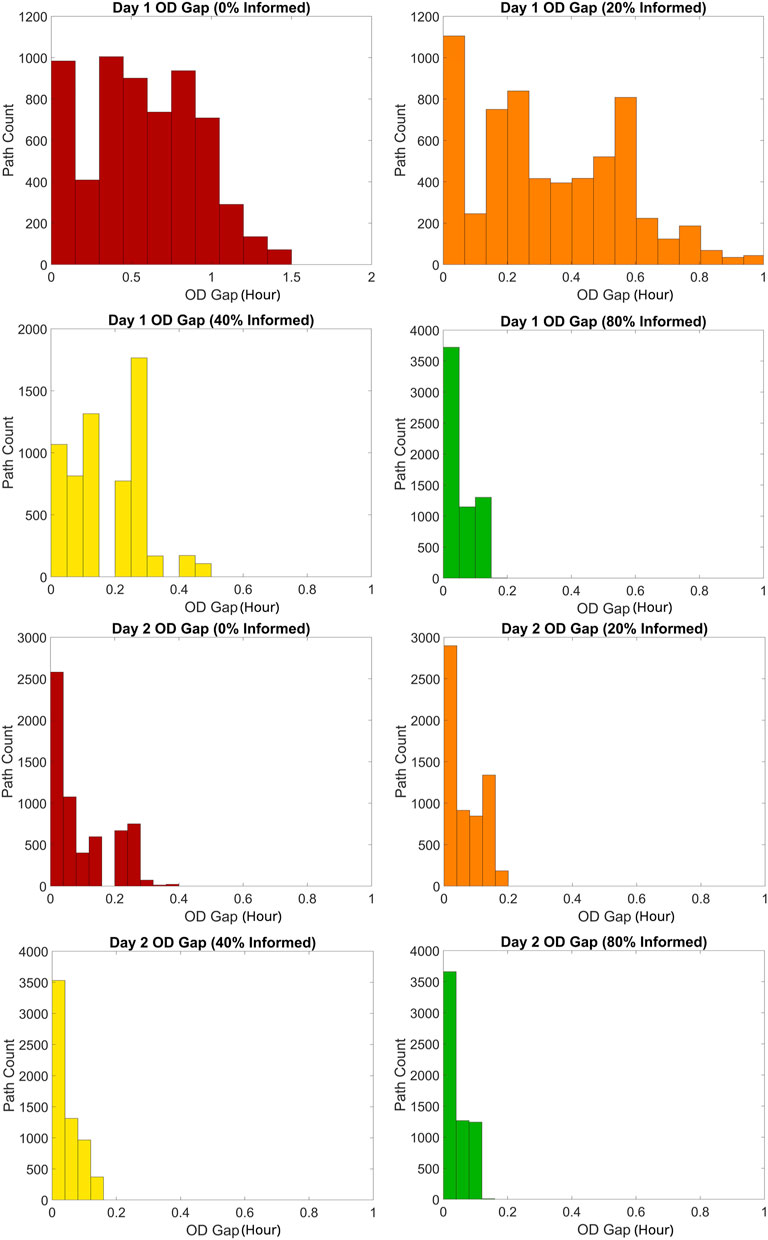
FIGURE 13. Day 1 and Day 2 O-D Gap for all paths with 0% informed drivers, 20% informed drivers, 40% informed drivers, and 80% informed drivers.
Figure 13 shows histograms of the travel time gaps for Day 2 given 0%, 20%, 40%, and 80% informed drivers. On Day 2 when 0% of drivers are informed the maximum travel time is less than 30 min. When 20% of drivers are informed, the maximum travel time is reduced to 12 min. When 40% and 80% of drivers are informed the results improve further in terms of median travel time, with the maximum travel time remaining at approximately 10 min.
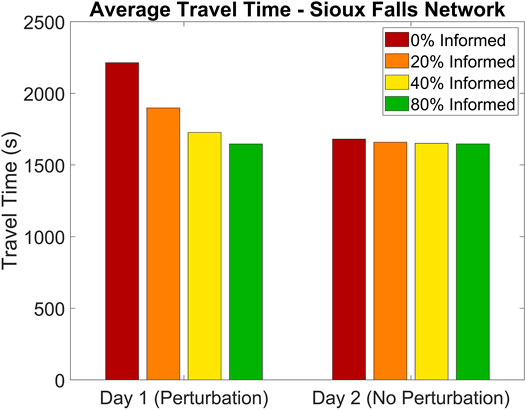
Figures 14, 15 compare the average travel time for Day 1 and Day 2 before and after executing the within-day DSO algorithm. Figure 14 shows that as the number of informed drivers increases, the O-D gap for Day 1 decreases significantly. Less improvement is available on Day 2 because the congestion level is much lower due to the adaptations of BRDUE seeking drivers.
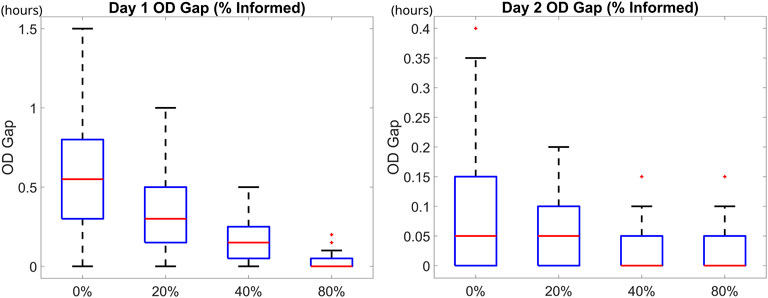
FIGURE 14. Left: Day 1 O-D gap for all paths under varying fractions of informed drivers. Right: Day 2 O-D gap for all paths under varying fractions of informed drivers.
The red bars in Figure 15 show the expected average travel time given the predicted BRDUE departure rates for Days 1 and 2, while the orange bars show the average travel time with departure rate pattern composed of 80% BRDUE seeking uninformed users and 20% DSO seeking informed users. Similarly, the yellow and green bars show average travel time for 60% BRDUE and 20% BRDUE, respectively. Day 2 BRDUE departure decisions are based on the actual travel times for Day 1, which are the result of the Day 1 BRDUE + DSO departure rate pattern. The results for Day 2 are very similar for each case because the perturbation is now anticipated by BRDUE users’ experience on Day 1, leaving only small optimality improvements to be made by informed drivers. In a real-world scenario, each day will present its own unique perturbations and having a percentage of DSO seeking informed drivers who can be rerouted to reduce congestion will benefit the average travel time for all users of the network.
5 Conclusion
This research develops novel techniques for informed and uninformed multi-agent route and depature time choice in midsize city environments. The unstable equilibrium conditions encountered in prior informed driver research are resolved using a strategy which ensures that informed drivers only seek DSO when it is necessary to reduce congestion. Even with a small fraction of informed drivers, results show that congestion can be significantly reduced. Adding parallelization to the DSO algorithm reduces the computational time required from more than one day to less than 2 hours. Additional speedup is expected by developing the code in a faster programming language and pursuing further multi-core optimization.
The Within-Day delays incurred in a system which follows a DTD BRDUE model can be improved by including informed drivers whose route and departure time choices seek to push the system toward DSO equilibrium. Results show that even with relatively low numbers of drivers seeking Within-Day DSO, significant improvements in average travel time can be obtained. In the cases of severe congestion caused by perturbations, having 20% informed WD DSO seeking drivers can improve the Day 1 average travel time by 59.2% relative to the next day’s DTD BRDUE equilibrium solution. As the number of informed drivers increases, the robustness of the system to perturbations improves. Additionally, because informed drivers do not detour unless significant congestion is present, the model always approaches a DTD BRDUE condition for any fraction of informed drivers, rather than having informed drivers naively seek a DSO equilibrium condition.
6 Limitations and Future Study
The main limitation of the study is the computational time required to solve the within-day DSO algorithm due to path-based formulation of BRDUE. For the Sioux Falls network under high congestion, each DSO iteration can take up to 1.5 h to solve. When congestion is less severe, the DSO iterations are faster because fewer paths and departure times need to be solved. While those extra information gain are considered as random in this study, the future study can maximize removing uncertainty by considering the standard deviation (Folsom et al., 2021) and spatiotemporal correlations (Darko et al., 2020).
Future research goals include using a region-based model with a mesoscopic fundamental diagram (Yildirimoglu et al., 2015). A mesoscopic region-based model could improve traffic state observability, improve computational efficiency on larger networks incorporating highways and freeways, and reduce uncertainty compared with microscopic link-level frameworks and macroscopic frameworks (Aghamohammadi and Laval, 2018). While this research focused on drivers, the informed driver model can also be applied to Connected Autonomous Vehicles (CAVs) in a mixed autonomy network where the centralized framework improves the efficiency with which DSO equilibrium is reached.
Additionally, by considering the spatiotemporal correlation between paths based on historical data or prior simulations, it may be possible to further improve DSO computational time. The number of calculations required to estimate the path marginal cost would be reduced in this case, since the path marginal cost can be inferred from the spatiotemporal correlation between various routes. Including spatiotemporal correlation in a region based model which includes between-region marginal costs could further improve performance by reducing the number of calculations needed to determine the marginal cost within each region and providing additional methods of parallelization such as network partitioning (Yahia et al., 2018).
While the benefit of the proposed informed decision after the first day is much less, there are still remaining memory impacting the choice, influenced by the first day. This paper targets the DSO before converging to equilibrium, but by finding the percentage of drivers that should be informed, we could lower the within-day delays and converge equilibrium sooner. By using the output from this study, future studies could optimize the percentage of drivers to be informed to minimize within-day delays.
The informed decision making also can be applied to other system decision-making to mitigate traffic congestion. While predictive sensor location (Park and Haghani, 2015; Park et al., 2018) and emergency allocation (Park et al., 2016) problems with anticipated future depended on simulation of uninformed drivers, how information would change the driving behavior to change the system optimal decisions can provide more practical solutions.
Data Availability Statement
The original contributions presented in the study are included in the article/Supplementary Material, further inquiries can be directed to the corresponding author.
Author Contributions
All authors listed have made a substantial, direct, and intellectual contribution to the work and approved it for publication.
Funding
This document is the results of the research project funded by the National Science Foundation Robust Intelligence Program #1910397, North Carolina Department of Transportation #TCE 2020-01, and NASA JPL RSA #1625294.
Conflict of Interest
The authors declare that the research was conducted in the absence of any commercial or financial relationships that could be construed as a potential conflict of interest.
Publisher’s Note
All claims expressed in this article are solely those of the authors and do not necessarily represent those of their affiliated organizations, or those of the publisher, the editors and the reviewers. Any product that may be evaluated in this article, or claim that may be made by its manufacturer, is not guaranteed or endorsed by the publisher.
Acknowledgments
Part of the content of the manuscript appears in a thesis. The authors also express thanks to all editors and reviewers of this article.
References
Aghamohammadi, R., and Laval, J. A. (2020). Dynamic Traffic Assignment Using the Macroscopic Fundamental Diagram: A Review of Vehicular and Pedestrian Flow Models. Transp. Res. Part B Methodol. 137, 99–118. doi:10.1016/j.trb.2018.10.017
Amdahl, G. M. (1967). “Validity of the Single Processor Approach to Achieving Large Scale Computing Capabilities,” in Proceedings of the April 18-20, 1967, Spring Joint Computer Conference (New York, NY, USA: Association for Computing Machinery, AFIPSSpring) 67. 483–485. doi:10.1145/1465482.1465560
Angelelli, E., Morandi, V., Savelsbergh, M., and Speranza, M. G. (2021). System Optimal Routing of Traffic Flows with User Constraints Using Linear Programming. Eur. J. Operational Res. 293, 863–879. doi:10.1016/j.ejor.2020.12.043
Angelelli, E., Morandi, V., and Speranza, M. G. (2018). Congestion Avoiding Heuristic Path Generation for the Proactive Route Guidance. Comput. Operations Res. 99, 234–248. doi:10.1016/j.cor.2018.07.009
Avineri, E., and Prashker, J. N. (2006). The Impact of Travel Time Information on Travelers' Learning under Uncertainty. Transportation 33, 393–408. doi:10.1007/s11116-005-5710-y
Bureau of Public Roads (BPR) (1964). Traffic Assignment Manual. Urban Planning Division, U.S. Department of Commerce.
Darko, J., Folsom, L., Park, H., Minamide, M., Ono, M., and Su, H. (2020). A Sampling-Based Path Planning Algorithm for Improving Observations in Tropical Cyclones. Earth Space Sci. Open Archive 17doi. doi:10.1002/essoar.10504807.1
Di, X., He, X., Guo, X., and Liu, H. X. (2014). Braess Paradox under the Boundedly Rational User Equilibria. Transp. Res. Part B Methodol. 67, 86–108. doi:10.1016/j.trb.2014.04.005
Di, X., and Liu, H. X. (2016). Boundedly Rational Route Choice Behavior: A Review of Models and Methodologies. Transp. Res. Part B Methodol. 85, 142–179. doi:10.1016/j.trb.2016.01.002
Doan, K., and Ukkusuri, S. V. (2015). Dynamic System Optimal Model for Multi-OD Traffic Networks with an Advanced Spatial Queuing Model. Transp. Res. Part C Emerg. Technol. 51, 41–65. doi:10.1016/j.trc.2014.10.011
Folsom, L., Ono, M., Otsu, K., and Park, H. (2021). Scalable Information-Theoretic Path Planning for a Rover-Helicopter Team in Uncertain Environments. Int. J. Adv. Robotic Syst. 18, 172988142199958. doi:10.1177/1729881421999587
Han, K., Eve, G., and Friesz, T. L. (2019). Computing Dynamic User Equilibria on Large-Scale Networks with Software Implementation. Netw. Spat. Econ. 19, 869–902. doi:10.1007/s11067-018-9433-y
Han, K., Szeto, W. Y., and Friesz, T. L. (2015). Formulation, Existence, and Computation of Boundedly Rational Dynamic User Equilibrium with Fixed or Endogenous User Tolerance. Transp. Res. Part B Methodol. 79, 16–49. doi:10.1016/j.trb.2015.05.002
Jiang, Y.-Q., Guo, R.-Y., Tian, F.-B., and Zhou, S.-G. (2016). Macroscopic Modeling of Pedestrian Flow Based on a Second-Order Predictive Dynamic Model. Appl. Math. Model. 40, 9806–9820. doi:10.1016/j.apm.2016.06.041
Jotisankasa, A., and Polak, J. W. (2006). Framework for Travel Time Learning and Behavioral Adaptation in Route and Departure Time Choice. Transp. Res. Rec. 1985, 231–240. doi:10.3141/1985-2510.1177/0361198106198500125
Lebacque, J. P., and Khoshyaran, M. M. (2013). A Variational Formulation for Higher Order Macroscopic Traffic Flow Models of the GSOM Family. Procedia - Soc. Behav. Sciences20th Int. Symposium Transp. Traffic Theory (ISTTT 2013) 80, 370–394. doi:10.1016/j.sbspro.2013.05.021
Lighthill, M. J., and Whitham, G. B. (1955). On Kinematic Waves II. A Theory of Traffic Flow on Long Crowded Roads. Proc. R. Soc. Lond. A 229, 317–345. doi:10.1098/rspa.1955.0089
Litescu, S. C., Viswanathan, V., Aydt, H., and Knoll, A. (2016b). Information Dynamics in Transportation Systems with Traffic Lights Control. Procedia Comput. Sci. 80, 2019–2029. International Conference on Computational Science 2016, ICCS 2016, 6-8 June 2016, San Diego, California, USA. doi:10.1016/j.procs.2016.05.522
Litescu, S. C., Viswanathan, V., Aydt, H., and Knoll, A. (2016a). The Effect of Information Uncertainty in Road Transportation Systems. J. Comput. Sci. 16, 170–176. doi:10.1016/j.jocs.2016.04.017
Litescu, S., Viswanathan, V., Lees, M., Knoll, A., and Aydt, H. (2015). Information Impact on Transportation Systems. J. Comput. Sci. Sci. A. T. Gates Nat. 9, 88–93. doi:10.1016/j.jocs.2015.04.019
Mahmassani, H. S. (2001). Dynamic Network Traffic Assignment and Simulation Methodology for Advanced System Management Applications. Netw. Spatial Econ. 1, 267–292. doi:10.1023/a:1012831808926
Mahmassani, H. S., and Jayakrishnan, R. (1991). System Performance and User Response under Real-Time Information in a Congested Traffic Corridor. Transp. Res. Part A General 25, 293–307. doi:10.1016/0191-2607(91)90145-G
Mahmassani, H. S., and Liu, Y.-H. (1999). Dynamics of Commuting Decision Behavior under Advanced Traveler Information Systems. Transp. Res. Part C-emerging Technol. 7. doi:10.1016/s0968-090x(99)00014-5
MATLAB (2019). MATLAB and Signal Processing Toolbox Release 2019b. Natick, Massachusetts: The MathWorks Inc.
Newell, G. F. (1993a). A Simplified Theory of Kinematic Waves in Highway Traffic, Part I: General Theory. Transp. Res. Part B Methodol. 27, 281–287. doi:10.1016/0191-2615(93)90038-C
Newell, G. F. (1993b). A Simplified Theory of Kinematic Waves in Highway Traffic, Part II: Queueing at Freeway Bottlenecks. Transp. Res. Part B Methodol. 27, 289–303. doi:10.1016/0191-2615(93)90039-D
Newell, G. F. (1993c). A Simplified Theory of Kinematic Waves in Highway Traffic, Part III: Multi-Destination Flows. Transp. Res. Part B Methodol. 27, 305–313. doi:10.1016/0191-2615(93)90040-H
Osorio, C., Flötteröd, G., and Bierlaire, M. (2011). Dynamic Network Loading: A Stochastic Differentiable Model that Derives Link State Distributions. Transp. Res. Part B Methodol. 45, 1410–1423. Select Papers from the 19th ISTTT. doi:10.1016/j.trb.2011.05.014
Park, H., Haghani, A., Gao, S., Knodler, M. A., and Samuel, S. (2018). Anticipatory Dynamic Traffic Sensor Location Problems with Connected Vehicle Technologies. Transp. Sci. 52, 1299–1326. doi:10.1287/trsc.2018.0838
Park, H., and Haghani, A. (2015). Optimal Number and Location of Bluetooth Sensors Considering Stochastic Travel Time Prediction. Transp. Res. Part C Emerg. Technol. 55, 203–216. doi:10.1016/j.trc.2015.03.023
Park, H., Shafahi, A., and Haghani, A. (2016). A Stochastic Emergency Response Location Model Considering Secondary Incidents on Freeways. IEEE Trans. Intell. Transp. Syst. 17, 2528–2540. doi:10.1109/TITS.2016.2519043
Peeta, S., and Mahmassani, H. S. (1995). System Optimal and User Equilibrium Time-dependent Traffic Assignment in Congested Networks. Ann. Oper. Res. 60, 81–113. doi:10.1007/BF02031941
Qian, Z., Shen, W., and Zhang, H. M. (2012). System-optimal Dynamic Traffic Assignment with and without Queue Spillback: Its Path-Based Formulation and Solution via Approximate Path Marginal Cost. Transp. Res. Part B Methodol. 46, 874–893. doi:10.1016/j.trb.2012.02.008
Qian, Z., and Zhang, H. M. (2011). Computing Individual Path Marginal Cost in Networks with Queue Spillbacks. Transp. Res. Rec. 2263, 9–18. doi:10.3141/2263-02
Richards, P. I. (1956). Shock Waves on the Highway. Operations Res. 4, 42–51. doi:10.1287/opre.4.1.42
Simon, H. A. (1962). Models of Man, Social and Rational: Mathematical Essays on Rational Human Behavior in a Social Setting. J. Philosophy 59, 177–182.
Varia, H. R., Gundaliya, P. J., and Dhingra, S. L. (2013). Application of Genetic Algorithms for Joint Optimization of Signal Setting Parameters and Dynamic Traffic Assignment for the Real Network Data. Res. Transp. Econ. Sustain. Transp. India 38, 35–44. doi:10.1016/j.retrec.2012.05.014
Wardrop, J. G. (1952). Road Paper. Some Theoretical Aspects of Road Traffic Research. Proc. Institution Civ. Eng. 1, 325–362. doi:10.1680/ipeds.1952.11259
Xiong, C., Chen, X., and Zhang, L. (2015). Multidimensional Travel Decision-Making: Descriptive Behavioural Theory and Agent-Based Models. Emerald Publ., 213–231. chap. 10. 213–231. doi:10.1108/978-1-78441-072-820151012
Xiong, C., and Zhang, L. (2013a). A Descriptive Bayesian Approach to Modeling and Calibrating Drivers' En Route Diversion Behavior. IEEE Trans. Intell. Transp. Syst. 14, 1817–1824. doi:10.1109/TITS.2013.2270974
Xiong, C., and Zhang, L. (2013b). Positive Model of Departure Time Choice under Road Pricing and Uncertainty. Transp. Res. Rec. 2345, 117–125. doi:10.3141/2345-15
Yahia, C. N., Pandey, V., and Boyles, S. D. (2018). Network Partitioning Algorithms for Solving the Traffic Assignment Problem Using a Decomposition Approach. Transp. Res. Rec. 2672, 116–126. doi:10.1177/0361198118799039
Yildirimoglu, M., and Geroliminis, N. (2014). Approximating Dynamic Equilibrium Conditions with Macroscopic Fundamental Diagrams. Transp. Res. Part B Methodol. 70, 186–200. doi:10.1016/j.trb.2014.09.002
Yildirimoglu, M., Ramezani, M., and Geroliminis, N. (2015). Equilibrium Analysis and Route Guidance in Large-Scale Networks with MFD Dynamics. Transp. Res. Procedia 9, 185–204. Papers selected for Poster Sessions at The 21st International Symposium on Transportation and Traffic Theory Kobe, Japan, 5-7 August, 2015. doi:10.1016/j.trpro.2015.07.011
Yu, Y., Han, K., and Ochieng, W. (2020). Day-to-day Dynamic Traffic Assignment with Imperfect Information, Bounded Rationality and Information Sharing. Transp. Res. Part C Emerg. Technol. 114, 59–83. doi:10.1016/j.trc.2020.02.004
Zhang, L., Chang, G.-L., Zhu, S., Xiong, C., Du, L., and Mollanejad, M. (2013). Integrating an Agent-Based Travel Behavior Model with Large-Scale Microscopic Traffic Simulation for Corridor-Level and Subarea Transportation Operations and Planning Applications. J. Urban Plan. Dev. 139, 94–103. doi:10.1061/(asce)up.1943-5444.0000139
Zhou, B., Xu, M., Meng, Q., and Huang, Z. (2017). A Day-To-Day Route Flow Evolution Process towards the Mixed Equilibria. Transp. Res. Part C Emerg. Technol. 82, 210–228. doi:10.1016/j.trc.2017.06.018
Zhu, S., Levinson, D., Liu, H. X., and Harder, K. (2010). The Traffic and Behavioral Effects of the I-35w mississippi River Bridge Collapse. Transp. Res. Part A Policy Pract. 44, 771–784. doi:10.1016/j.tra.2010.07.001
Keywords: informed routing, predictive informatics, bounded rationality, mixed information, congestion phase
Citation: Folsom L, Park H and Pandey V (2022) Dynamic Routing of Heterogeneous Users After Traffic Disruptions Under a Mixed Information Framework. Front. Future Transp. 3:851069. doi: 10.3389/ffutr.2022.851069
Received: 09 January 2022; Accepted: 19 April 2022;
Published: 18 May 2022.
Edited by:
Luigi Dell'Olio, University of Cantabria, SpainReviewed by:
Hooi Ling Khoo, Universiti Tunku Abdul Rahman, MalaysiaFlorian Dandl, Technical University of Munich, Germany
Copyright © 2022 Folsom, Park and Pandey. This is an open-access article distributed under the terms of the Creative Commons Attribution License (CC BY). The use, distribution or reproduction in other forums is permitted, provided the original author(s) and the copyright owner(s) are credited and that the original publication in this journal is cited, in accordance with accepted academic practice. No use, distribution or reproduction is permitted which does not comply with these terms.
*Correspondence: Hyoshin Park , aHBhcmsxQG5jYXQuZWR1
 Larkin Folsom1
 Hyoshin Park
 Venktesh Pandey