 Emanuel Febrianto Prakoso
 Yousef Maknoon
 Adam Pel2
 Lóránt A. Tavasszy
 Ratnaji Vanga
- 1Faculty of Technology, Policy, and Management, Delft University of Technology, Delft, Netherlands
- 2Faculty of Civil Engineering and Geosciences, Delft University of Technology, Delft, Netherlands
Due to the uncertain and dynamic environment around scheduling systems, timely revisions or reschedules of the master plans are essential for achieving optimal utilization. With the recent development of Industry 4.0 technologies, many researchers perceive the creation of cyber-physical systems as a solution for managing systems under uncertainty. This article focuses on a loading facility under uncertain truck arrivals due to road congestion and proposes utilizing real-time truck location information to improve performance. We do this by developing an integrated system consisting of a predictive model using machine learning (MC) classifiers and a mathematical model for real-time slot rescheduling. The ML classifier is used to predict the presence probabilities of all the incoming trucks at a particular slot based on the historical traffic data and the real-time truck location. Subsequently, a Mixed-Integer Quadratic Programming (MIQP) model is developed to solve a Probabilistic Slot Rescheduling Problem (P-SRP), which uses the estimated truck presence probabilities and minimizes the total expected cost of rescheduling. We implemented this by first testing multiple ML classifiers and selected the ANN classifier for prediction as it outperformed others. Our limited experiments showed that the proposed method reduced the total rescheduling cost by 42%. Furthermore, our sensitivity analysis with different congestion levels, complexity, and rescheduling strategy also showed the practicality of the proposed approach.
1 Introduction
Disruptions during transportation result in uncertain travel times and contribute to nearly one-third of total operational costs (Chira, 2014). In the petrochemical industry, efficient and robust downstream supply chain systems play an essential role in achieving a competitive edge (Lababidi et al., 2004). Loading facilities play a crucial role in the success of transportation systems as they connect production and distribution systems (Raj et al., 2019).
At the operational level, the performance of the loading facility is dependent on truck arrival times. Due to unpredictable road congestions, the deviations of truck arrivals from the planned ones are inevitable (Sanchez-Rodrigues et al., 2010). These arrival deviations create problems for the facility managers and reduce the operational efficiency of loading facilities. In terms of business, it increases total operation costs for all the stakeholders. Due to the limited parking space available around the gate area, there is a higher risk of accidents and lower site productivity. Also, a large number of queued trucks at any time emit pollutant gases that could endanger the surrounding livelihood (Zehendner and Feillet, 2014).
According to Zehendner and Feillet (2014), Zhao and Goodchild (2013), and Ramírez-Nafarrate et al. (2017), the implementation of Truck Appointment System (TAS) can help in streamlining the arrivals for better management of the loading facilities. The TAS is a web-based platform for carrier companies to reserve a time slot in advance and come accordingly for service. However, disruptions on the road are unpredictable and affect truck arrivals at the plant. Due to these road congestions, some trucks might arrive late and miss their reserved slots prompting rescheduling.
But in the literature, less attention was paid to the stochastic nature of arrivals, thus limiting the practicality of the proposed models (Huiyun et al., 2018). In most cases, rescheduling of a delayed truck is done manually under the assumption that the incoming trucks will arrive on time. Lack of information in the hand of planners will lead to inefficiencies (Pang et al., 2015) and increase the number of reschedules that need to be done.
Due to the recent growth in cyber-physical systems and ICT (Information and Communication Technology) technologies, it is now possible to track vehicle locations using GPS or RFID and share information in real time with partners. Furthermore, the availability of historical traffic data along with real-time updates enables the accurate prediction of ETAs (estimated time of arrival) (Larbi et al., 2011). Furthermore, ETAs are dynamic and will change over time. So, additional information on the presence probabilities of the trucks based on the ETA status can aid in further improvement of the rescheduling process (van Schaijk and Visser, 2017). These ETA-related predictions with the combination of proactive rescheduling can help slot managers increase facilities’ utilization. In this article, we propose a predictive–proactive approach for the rescheduling of trucks based on ETA-related predictions and compare its performance against the current rescheduling approach (we refer to this as the base case).
The remainder of this paper is organized as follows. Section 2 presents the relevant literature. The proposed rescheduling approach is described in Section 3. Section 4 describes the original and modified (synthetic) data set used to train the prediction model. Section 5 explains the steps involved in training and selecting the best ML classifier among the ones tested. The proposed probabilistic mathematical model is presented in Section 6. Section 7 discusses different experiment settings and the subsequent analysis to evaluate the proposed approach. Lastly, we gave conclusions and further directions in Section 8.
2 Literature Review
This section provides recent literature related to schedule management. We first provide the survey of research articles related to the prediction of arrival time followed by the optimization of scheduling systems.
2.1 Uncertainty in Truck ETAs
In scheduling systems, truck arrival deviations have a significant effect on the operational efficiency and can make the initial master schedules infeasible (Nasiri et al., 2022). These arrival deviations will negatively affect all the relevant stakeholders. To deal with the uncertainty in truck arrivals, researchers proposed robust master plans (Chen et al., 2013; Konur and Golias, 2013), reactive rescheduling (Li et al., 2018), predictive–reactive rescheduling (Nasiri et al., 2022), etc. Nasiri et al. (2022) proposed a predictive–reactive method for the management of the uncertain truck arrivals at a cross-docking considering both the inbound and outbound truck arrivals. At a predetermined point of time, they propose to check the status in terms of truck arrival deviations from the current schedule and reactively modify the previous schedule to minimize the instability in the truck loading and unloading process. Ralf and Felix (2021) proposed a slot exchange mechanism to trade suitable reserved slots among truck owners to optimize the costs and emissions. They report the importance of these exchange platforms to be cross-provider and explore the data point requirements for the feasibility of the proposed exchange mechanism. Our research proposes an alternative approach to the loading problem by utilizing real-time information on truck location. We proposed to use a predictive–proactive rescheduling approach in which the prediction happens in real time about the truck ETAs, and the rescheduling happens proactively using the ETA predictions.
2.2 Predictive Model
Predictive models were commonly proposed to address the issue of the inherent uncertainty in the transport domain. In general, these predictive models require historical and real-time data in predicting arrival times. Boswell and Evans (1997) stated that delays could be modeled using discrete probability functions. Mueller and Chatterji (2002) extended the study by exploring Normal and Poisson distributions in modeling delays using their probability density functions. Exponential growth in technologies to share information prompted researchers to use the real-time ETA to make delay predictions. Larbi et al. (2011) showcased the value of information in a comparative study including the scenario of no information, partial information, and full information, leading to the conclusion that distant information yields a small contribution in improving the schedule optimization model.
As the technology rapidly advances, the number of studies involving machine learning as a supporting tool to predict delay has exponentially increased. Most of these studies are focused on the domain of airport operation and railway management. Machine learning is deemed powerful to provide accurate prediction in which the concept requires a learning process based on historical data (Carvalho et al., 2020). Various popular algorithms, namely RF (Random Forest) (Rebollo and Balakrishnan, 2014; Lee et al., 2016), k-NN (k-Nearest Neighbor) (Pongnumkul et al., 2014), SVR (Support Vector Regression) (Marković et al., 2015; Barbour et al., 2018), and ANN (Artificial Neural Network) (Dutrieux, 2021; Vorage and Mitici, 2021), could be applied to predict arrival time. However, there is no such generalization to determine the best algorithm as it depends on the characteristic of datasets or conditions. Thus, a comparative approach should be taken in selecting an appropriate ML algorithm.
2.3 Optimization Model
In general, optimization models have been extensively used to address the problems in scheduling systems. Earlier, most of the studies (Jing-lei and Ding, 2006; Wu and Zhang, 2011; Xiaoju et al., 2013) rely on queuing theory as the tool to model the truck scheduling problem. However, Huiyun et al. (2018) claimed that the queuing model is not sufficient in providing improvement in the rescheduling system as it only helps in analyzing the current schedules but could not aid in decision-making related to scheduling systems management. Furthermore, most recent research on truck schedule management utilized the MIP (Mixed Integer Programming) model, which allows better quantitative evaluation.
Various studies applied deterministic MILP models in the slot management of loading facilities with different objectives. Some researchers constructed models with a single-objective function to minimize emission cost prompted from idle trucks (Li et al., 2018), to minimize penalty cost due to delay in arrival time (Caballini et al., 2018), to minimize turn over time of trucks (Chen and Yang, 2010), and to maximize slot efficiency (Chen and Yang, 2010; Zehendner and Feillet, 2014; Caballini et al., 2018). In all those studies, regardless of the variation in the measurement indicator used, the optimization model was used to enable better operations. Some researchers considered multiple objectives (Wibowo and Fransoo, 2020) or a generalized cost function (Schulte et al., 2017) to capture the interests of various stakeholders. Most studies in truck scheduling systems assumed that arrival time is a deterministic variable that limits their applicability.
Several studies developed stochastic mathematical models to capture the uncertainty in different parameters. For example, Şeker and Noyan (2012) incorporated disruptions such as delay in arrival time, idle time, and buffer time as random variables, which are integrated into the constraints of an MILP optimization model. They quantified total conflicting slots and idle slots as robustness measures.
Stochastic models that directly consider the uncertainty using discrete probabilistic distributions are also an alternative approach in dealing with stochastic variables. Meng and Zhou (2011) worked on railway schedule management where many attributes associated with a high degree of uncertainty, such as travel time, arrival time, and departure time, are considered a stochastic variable; thus, it is represented by probability distributions. However, the distributions used in these experiments are not empirical, thus limiting the applicability.
Furthermore, van Schaijk and Visser (2017) transformed the deterministic slot assignment method to be able to consider stochastic elements by replacing the binary constraint representing scheduled arrival times with presence probability to capture the inherent stochastic delay. This approach would assign arriving flights to a particular location based on the maximum permissible overlap probability. The higher permissible value would result in a more compact schedule, therefore, lower assignment cost. However, this research does not incorporate specific assignments in which arrival can be universally assigned to any available slots. This approach could not be directly applied in the current problem context as we have additional complexity that limits the loading of specific products on each loading bay. The literature reviews have pointed out that most optimization models developed to solve truck rescheduling problems are designed in a deterministic fashion. Even though few papers have addressed the uncertain arrival time by applying exact methods, yet to the author’s best knowledge, there is no article in the context of truck scheduling at a loading facility that uses real-time ETA predictions for proactive rescheduling. Moreover, almost all the research in truck rescheduling has not incorporated a predictive model based on an ML algorithm to capture the uncertainty of arrival time. Because this approach proved beneficial in similar cases in other domains, applying it in this research might be a promising direction.
First, this article contributes to the literature by developing ML-based prediction models based on historical data to determine the truck arrival classes. Second, we integrate the arrival predictions with a stochastic optimization model that optimizes the slot rescheduling process to maximize efficiency and study the impact of ETA information.
3 Predictive–Proactive Rescheduling Approach
This article focuses on a loading facility at a petrochemical loading facility whose logistics operations are similar to the one presented in Wibowo and Fransoo (2020). As shown in the characteristics diagram [in Wibowo and Fransoo (2020)], the carriers reserve a loading slot in advance using the TAS portal and arrive at the plant accordingly for loading. After reaching the plant, trucks wait at the parking area till the time of their assigned loading slot. Based on the latest schedule at that time, trucks will be allowed to cross the gate and enter the facility area for loading operation.
Failure of trucks to adhere to the reserved slots will result in the accumulation of trucks in the parking area and is a severe problem for all stakeholders. Early arrivals increase gate waiting times for trucks, creating safety and pollution concerns for the facility and its neighborhood area, respectively. Late truck arrivals result in the under-utilization of slots and reduce the availability of free slots for other carriers.
To deal with the uncertainty of truck arrivals, we propose an intelligent rescheduling system that could provide more operational efficiency and robustness against real-time disturbance. The overview of the proposed system is illustrated in Figure 1. As shown, it considers arrival times as uncertain due to congestion and proposes to use real-time truck location information to proactively modify the reservations for optimal performance. We assume that the truck location information or ETA information will be available for slot managers either by the application of tracking technology on trucks or by the regular communication by the driver. In real time, truck location data will be fed to a predictive model that will determine the probability of whether a truck will be early, on-time, or delayed. Then, the optimization model could adjust the current schedule optimally based on the predicted probability information.
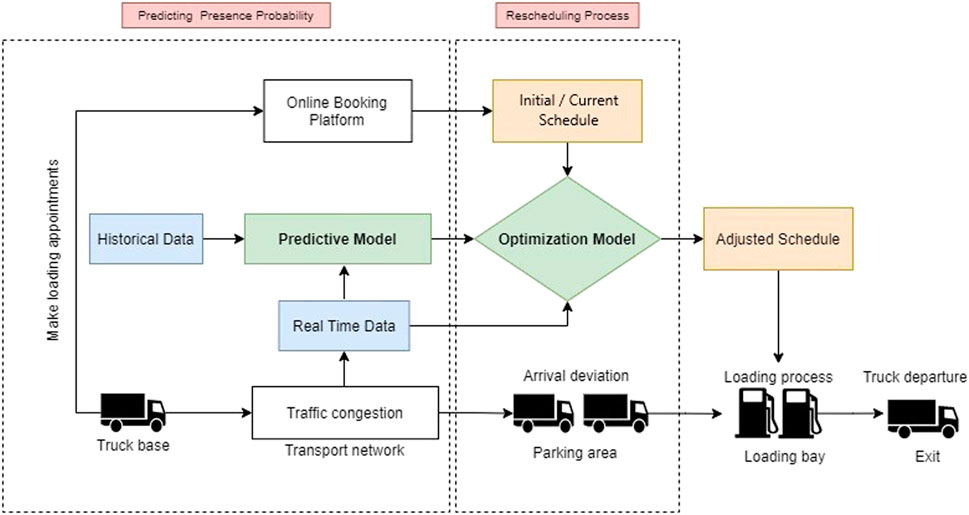
FIGURE 1. General flow of proposed rescheduling system.
The core idea of this framework is to input the real-time ETA information into the predictive model that would generate the probability of a certain truck being early, on-time, or late considering the trend/pattern of historical data learned by an ML algorithm. Subsequently, the result of the predictive model would be fed into the optimization model that would generate the adjusted schedule. The general flowchart of this process is detailed in Figure 2.
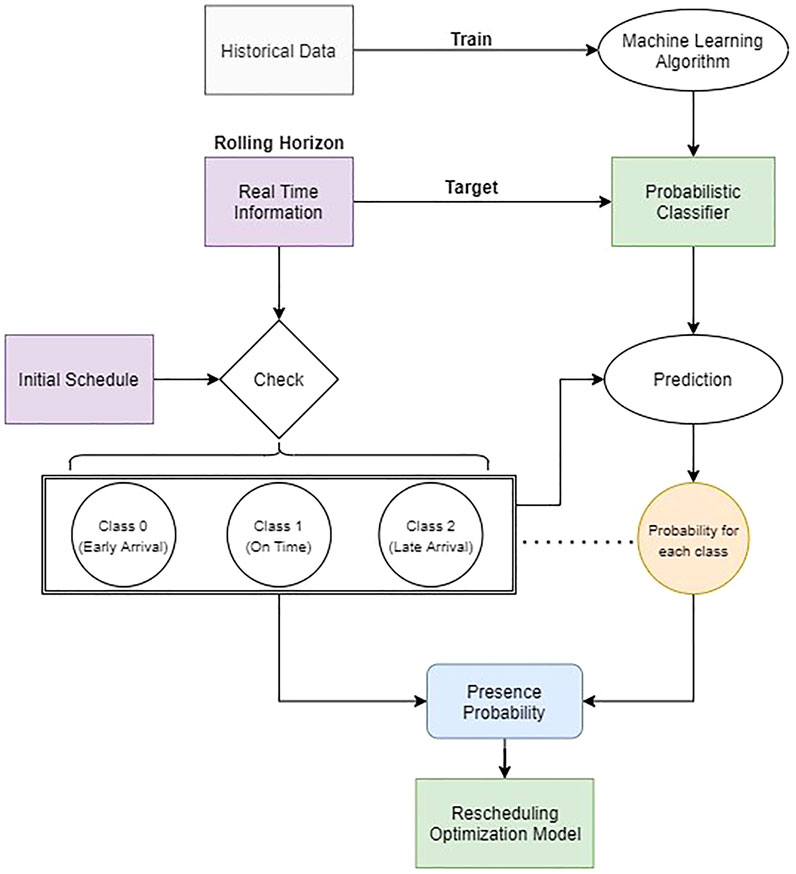
FIGURE 2. Conceptual framework of integration between the predictive model and the optimization model.
We propose to use this approach proactively in a rolling horizon manner. This means that the rescheduling (Optimization Model block in Figure 1) is triggered at uniform intervals. For example, we trigger rescheduling before the start of each slot start time so that reserved slots can be modified to optimize the system performance. Each time when rescheduling is triggered, we first determine the arrival class of each truck with respect to each slot in the immediate future. For this prediction, we defined three classes (class 0, class 1, and class 2) in our study in which class 0, class 1, and class 2 represent trucks that will arrive at least 30 min early, arrive on time (between up to 30 min early and exactly on-time), and arrive late, respectively. Based on this classification, it is decided logically that only trucks belonging to class 0 and class 2 will be allowed to reschedule while other trucks will stick to their current slot.
When rescheduling is triggered, the predictive model will be used to assign a probability value for each individual truck that indicates how likely a truck belongs to a certain class. This value is subsequently perceived as the presence probability of the truck at a certain timeslot. By doing this, the uncertainty embedded in the real-time ETA information is acknowledged and captured. As the final result, a pair of ETA information and its corresponding presence probability value is prepared to be inputted into the optimization model (further explained in Section 6).
In this research, it is assumed that the rolling horizon is 30 min. Therefore, there will be a new set of real-time ETA information every 30 min. For each period, the predictive model trained using the historical data would use the newly updated ETA information and all other features as the input data to predict the probability value of a particular truck to be present at a specified slot.
4 Data
This section presents the input dataset used to train the prediction model. It consists of a data generation phase where a historical dataset is synthetically generated and a data exploration phase that includes IDA (Initial Data Analysis) and EDA (Exploratory Data Analysis) used for pre-processing and analysis. Hence, the purpose of this section is not only to deliver a valuable insight derived from historical data, but also to ensure that the final data have a decent quality to be inputted into both the predictive model and the optimization model.
4.1 Original Data
The Bureau of Transportation Statistics of the US Department of Transportation is an open-source platform for the data on commercial aviation, multimodal freight activity, and transportation economics. It has data on commercial airline delays from all the airports in the United States. Even though truck arrival deviations are different from airline arrival deviations because of a number of factors, we adapted and customized the airline data for the demonstration of our research method in the trucking industry. The data are publicly accessible at the Bureau of Transportation Bureau of Transportation Statistics (2021) 1. We obtained airline data (containing all the features except product type presented in 1) from January 1, 2016, until March 31, 2021, from all the US airports. We further selected a single month (February) from each year’s data to eliminate the effects of seasonality, weather, and other effects on flight delays. Thus, we were left with 423,889, 410,517, 520,731, 533,175, and 574,268 data points from February of each year 2016, 2017, 2018, 2019, and 2020, respectively.
4.2 Synthetic Data
As we focus on truck arrivals at a single-loading facility, we filtered the dataset to have arrivals at a single airport (Atlanta international airport, ATL), thus further reducing the dataset to 141,517 rows and using it as a historical truck arrival information at the loading facility in this study. Each row in the synthetic data has the data on all the attributes described in Table 1.
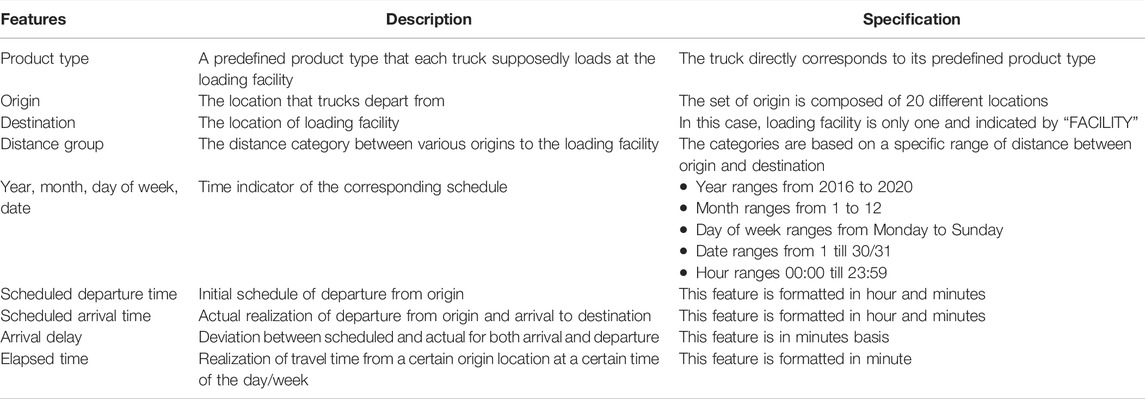
TABLE 1. Features in historical data.
4.3 Data Exploration
The IDA consisting of cleaning, transforming, and filtering is conducted to ensure that historical data is statistically sufficient. We performed the IDA process and also eliminated the data with the extremely late arrival time (more than 120 min late) and the extreme early arrival time (more than 15 min early). The resulting final dataset has 90,198 rows of data points.
Furthermore, EDA is conducted to profoundly analyze and investigate the underlying characteristics, such as pattern, trend, and anomalies of the large dataset beyond the obvious appearance and formal statistic method. It is designed to emphasize the arrival time variability based on different parameters. With respect to time of the day, the results show that late arrival is likely to occur in the afternoon, while the early arrival is evenly distributed across the operational hours. In regard to the time of the week, the median delay is almost the same for all days. Furthermore, comparing delays on a monthly basis illustrates a similar pattern for each month in a year. The selected data does not show a correlation between product type and truck origin, which is realistic. In conclusion, the results prove that the synthetic historical data are valid in alignment with existing theories and logical sense of the real world.
5 Predictive Model
5.1 Pre-Processing
Preprocessing steps are required to ensure that the data are adequate and suitable to input into the ML algorithm. The preprocessing is applied to historical datasets with and without the real-time ETA information. First, feature selection is conducted to remove multicollinearity variables that could render the ML model inefficient. A Pearson correlation method was used for this purpose. Second, since the ML algorithm is unable to process string or date-time data type, all values in the dataset are converted into numerical values. In other words, a feature encoding process is performed. This is done using a built-in Python library called Label Encoder, where features that are of data type such as string are consistently converted into numeric values. Lastly, due to the lack of ability to deal with features that vary in magnitudes, the dataset is scaled. When feature scaling is not done, there is a tendency of the ML algorithm to perceive greater values higher than smaller values, regardless of the unit of values. To solve this problem, standardization that transforms the data to ensure a mean value of 0 and the standard deviation of 1 is applied.
5.2 Model Training and Validation
The proposed solution is designed to perform rescheduling based on the predicted arrival classes: early, on-time, and late arrival. To realize this concept, a new feature called “Delay Level” is created as the target/output of the predictive model. In this case, the terms of being present could possibly be denoted by the arrival class of either “0” and “1,” and “2” in which Class 0 means that the truck would arrive earlier, Class 1 means that the truck would arrive on time, and Class 2 means that the truck would arrive late. The definition and requirements of each class are defined in Table 2.
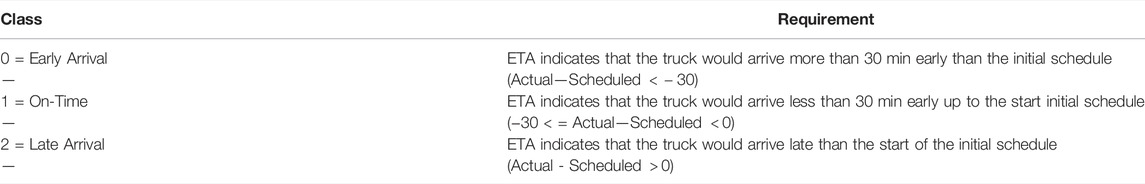
TABLE 2. Requirement for arrival classification.
Since there is no clear guideline in determining which ML algorithms would provide the best result, it is decided to explore 3 different algorithms, namely GBN (Gaussian Naive Bayes), LR (Logistic Regression), and ANN (Artificial Neural Network). To increase the efficiency of the prediction model, the features are selected according to their correlation value to minimize the negative impacts caused by the multicollinearity problem. The evaluation results according to the standardized KPI show the ANN is the best algorithm to fit the historical input data with an overall F1 score of 70%. In statistical analysis of binary classification, the F1 score combines the precision and recall into a single metric by representing the harmonic mean of them. The ANN model outperforms the LR model and the GBN model by 5 and 20% on average, respectively, in all the KPIs metrics.
To benchmark the result of the predictive models, a comparison with other predictive models found in similar studies is conducted. The ANN’s accuracy score of 0.70 is sufficient when compared with the predictive model proposed in Pongnumkul et al. (2014), Barbour et al. (2018), Vorage and Mitici (2021), Dutrieux (2021), Zonglei et al. (2008), Khaksar and Sheikholeslami (2019), van der Spoel et al. (2017), Bachu et al. (2014), Choi et al. (2016), and Parolas (2016) whose accuracy approximately ranges between 0.4 and 0.8. Considering the complexity level, the proposed predictive model even outperforms the ones in which the target classes are binary. However, this could not be stated with absolute certainty because the results could be affected by many factors, such as data quality, context, and computational power. Despite the potential flaws, it still can be concluded that the predictive model proposed in this research is acceptable.
5.3 Sensitivity Analysis
We created two scenarios that differ in features combination as shown in Table 3. The first scenario has only the features from historical data, while the second scenario additionally includes the real-time information enabled by ICT implementation.
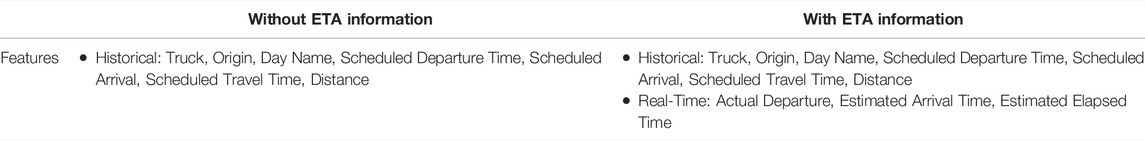
TABLE 3. Description of scenarios to investigate the added value of real time information.
Using these two scenarios, a comparative study is conducted to investigate the added value of real-time ETA information using the predictive model. For each defined KPI, a macro average is calculated. The evaluation results of the predictive model using the two scenarios are presented in Table 4.
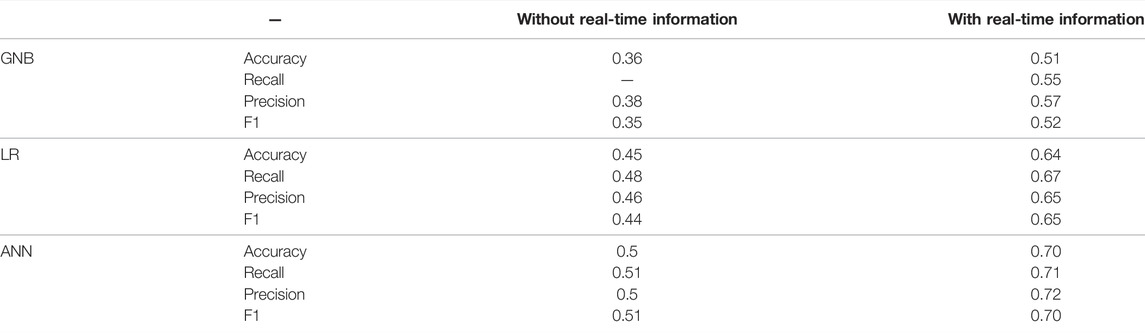
TABLE 4. Result of comparison between scenario of without and with real time information.
Based on the results, it is clear that the ANN algorithm, which is trained using the additional real-time information, is performing better. It is interesting to point out that the comparison results indicate a significant improvement in the prediction using the real-time data across all the 3 ML algorithms compared. The real-time features increase the prediction performance by approximately 20% in all KPIs. Thus, it is clear that real-time information certainly improves prediction accuracy.
Another key finding derived from the sensitivity analysis is that the inclusion of a feature having a larger than 0.5 correlation value (“Departure Delay”) with the prediction target (“Arrival Delay”) in the learning process is important to get the potentially best result. Hence, it is important to note that in building a predictive model, all features with significant correlation must be selected.
6 Probabilistic Mathematical Model
As described in Section 3, road congestions can affect the truck arrival times at the loading site and thus create conflicts in the master schedule. For example, an example plot that maps truck arrivals (both early and late) is illustrated in Figure 3. As can be observed, several overlapped arrivals have occurred, which are highlighted by orange background. These resulting conflicts need better adjustments to the master schedule in real time to optimize the overall performance. In the next subsection, we present a mathematical model that optimizes the rescheduling process based on the presence probabilities determined by the ANN classifier.
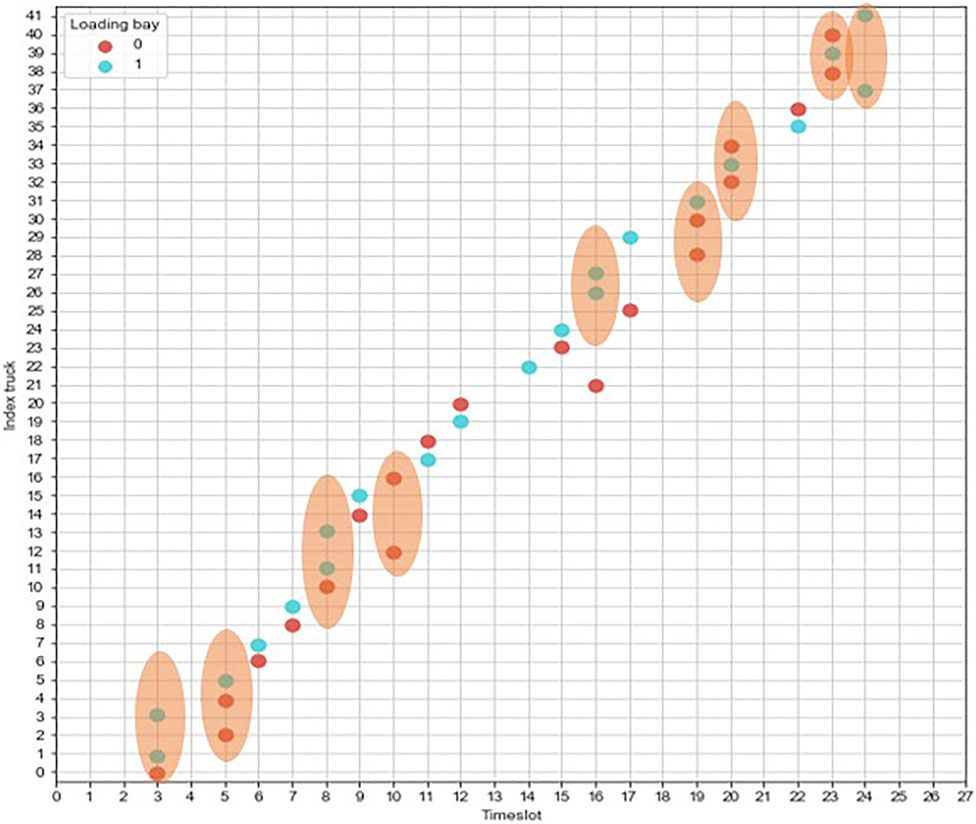
FIGURE 3. Hypothetical conflicts in current situation.
6.1 Mathematical Model
A generic formulation of the slot assignment problem (SAP) is adapted to develop the formulation of our rescheduling problem. In particular, we referred to the SAP formulation from Maknoon et al. (2017) in the literature and modified it to our requirements. We refer to the new formulation as slot rescheduling problem (SRP). In the deterministic sense, the presence of a particular truck in a certain time slot is assumed to be fully known, and the delay probability is not taken into account. To capture the stochastic nature of arrival time, the model needs to be adapted. As proposed by van Schaijk and Visser (2017), the idea of “presence probability” is incorporated into the deterministic SRP model. This modified model is further referred to as a Probabilistic Slot Rescheduling Problem (P-SRP). Instead of using the binary constraint to define the truck presence, the probability of the truck being present at a certain timeslot is used as a replacement. The changes represent the idea of allowing multiple trucks to be scheduled in a particular time slot as long as the overlapping probability does not violate the permissible threshold value.
We have considered the following assumptions in our model development. The rescheduling cost is the difference between the adjusted and initial schedules multiplied by a generalized cost, which is assumed as one monetary value per slot. All the other costs, namely the CO2 emission cost, space rent cost, site operation cost, etc., are omitted. The space inside the facility is adequate to accommodate all scheduled trucks within the planning horizon. The service of loading bays is constantly available over the planning horizon. In other words, disruptions such as machine breakdown or maintenance are not considered. The loading/service time is constant for all the timeslots in the planning horizon, which is 15 min per truck. Rescheduling is allowed only for trucks that are classified either as Class 0 (early arrival) or as Class 2 (late arrival). The sets of variables and parameters are presented in Table 5 and Table 6 respectively. The decision variable x is defined in Table 7.
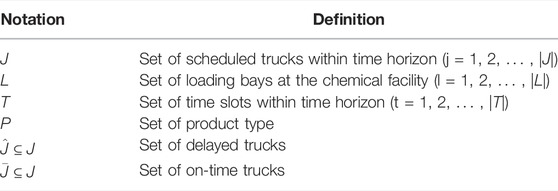
TABLE 5. Set of variables.
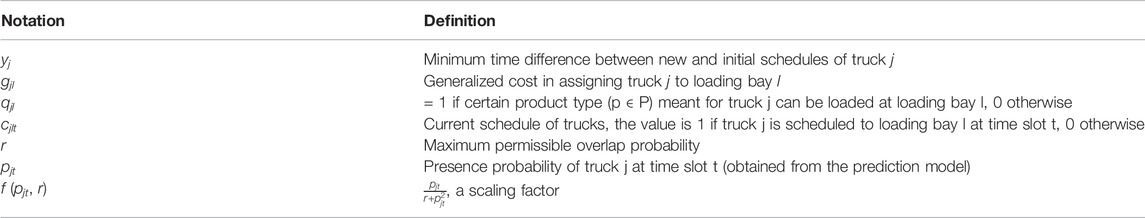
TABLE 6. Set of parameters.

TABLE 7. Decision variable.
The formulation of the mathematical model is as follows:
subject to
The objective function (Eq. 1) is to minimize the total expected rescheduling cost of the operation at the loading facility. The term ((xjlt × t)−(cjlt × t)) represents the difference between the new slot and the old slot. For example, if the second truck’s (j = 2) slot is changed from slot 8 on loading 1 to slot 9 on loading bay 3, then only c218 and x239 will be equal to 1. When we multiply these variables with t, it determines the difference between the new slot and the old slot. The expected cost (Z) is the accumulation of rescheduling costs of all trucks among all loading slots during the planning horizon. Thus, the expected cost is the difference between the adjusted and initial schedules multiplied by a generalized cost that is assumed to be one monetary value per slot. As the difference between the initial and adjusted slots could be either in a negative (in case a truck slot is shifted to earlier slots) or a positive value (in case a truck slot is shifted to later slots), a quadratic function (squared difference) is chosen. This will help the rescheduling process to adhere to the initial schedule instead of a linear form that would prefer rescheduling to earlier slots. This model is thus categorized as MIQP (Mixed Integer Quadratic Programming) problem.
Constraint 2 ensures that all trucks are assigned exactly once at a certain time horizon. Constraint 3 allows simultaneous assignment of trucks in a certain slot based on the presence probability. It is limited to be less than or equal to 1 as it would serve as a threshold indicating if there is a truck having a presence probability of 1, then no other truck should be assigned simultaneously. Constraint 4 limits the maximum number of trucks that can be simultaneously assigned to a slot. Constraint 5 enforces that the new slot of delayed trucks is different from the current slot while keeping the same slot for the on-time trucks. Constraint 6 ensures that trucks are loaded with their predetermined product type on loading bays that allow it. Constraint 7 ensures the satisfaction of the minimum time difference between the new and current slot. Constraint 8 represents the binary constraint of the decision variables.
6.2 Baseline Model (SRP)
A baseline model will be used as the benchmark to analyze the performance of the P-SRP model. The baseline model refers to the scheduling system of the loading facility that does not consider presence probabilities. In other words, the rescheduling process only considers deterministic ETA information and only allows a single-truck assignment at any particular slot. To obtain the baseline model, we replace Constraints Eq. 2, Eq. 3, Eq. 4, and Eq. 5 of P-SRP formulation with the below Constrains Eq. 9, Eq. 10, and Eq. 11. Furthermore, this model will be referred to as the Baseline model.
6.3 Verification
The proposed rescheduling system is completely applied and verified on a synthetic use-case sample. To measure the benefit of the P-SRP model, a baseline model that considers ETA as a deterministic variable is introduced for comparison (Figure 4 and Figure 5). The results clearly highlight the shortcoming of the baseline model in terms of preventing occurrence of idle slots and unnecessary schedule shifts. Consequently, the total rescheduling cost using the P-SRP model is estimated to be 42% lower than the baseline model.
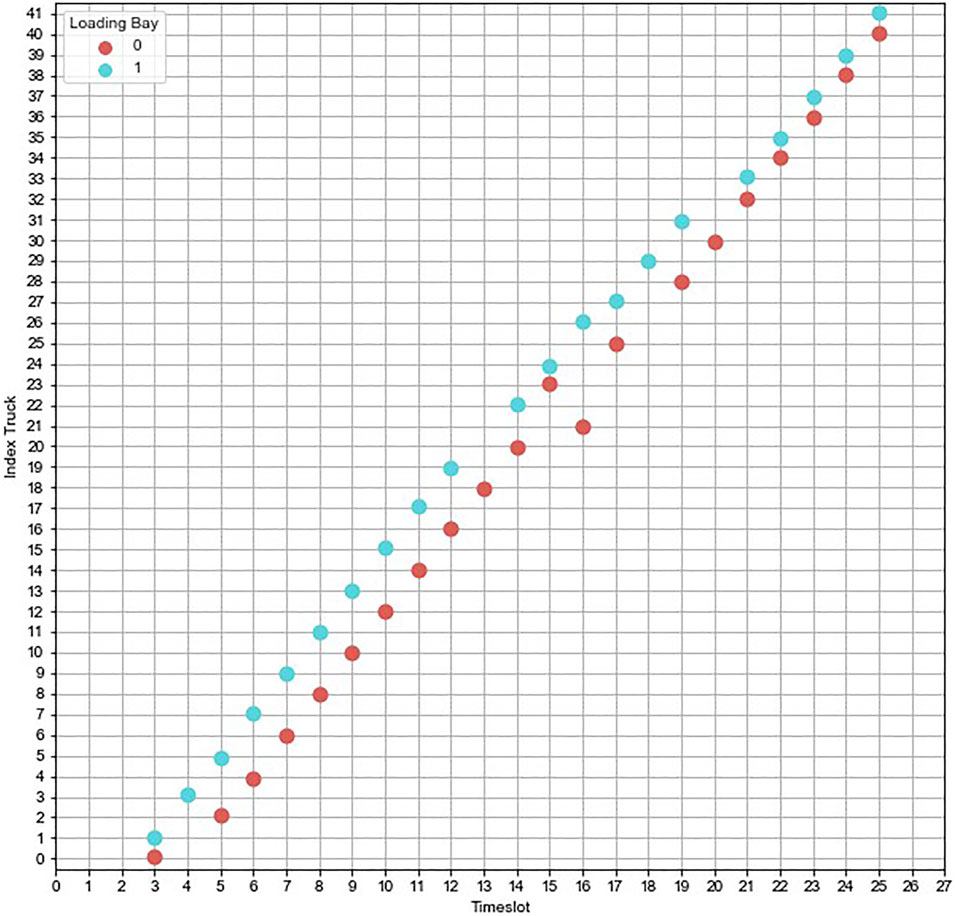
FIGURE 4. Sample output of baseline model.

FIGURE 5. Sample output of P-SRP.
Last, the proposed rescheduling system is tested on a dynamic experiment based on a rolling horizon to simulate the actual implementation and continuous update of real-time ETA data. Due to the limitation in this research, only two iterations with a period of 2 h are simulated. The results showcased the superiority of the P-SRP model compared with the baseline. On the top of the higher operational efficiency, the analysis indicates that P-SRP provides robustness against uncertain arrival time, whereby the adjusted schedule could withstand and anticipate the fluctuation of the actual arrival of an incoming truck. Hence, it can be concluded that the proposed approach of combined predictive and P-SRP model is practical to use and can improve schedule management efficiency. However, the current results are based on limited experiments and might be evaluated in each specific case with sufficiently large experiments.
7 Results and Discussion
In this section, we compare the performance of the P-SRP model against the SRP model. We do this by creating different scenarios by varying level of congestion, complexity of the operations and rescheduling objective criteria. This experimentation also helps in understanding the sensitivity of the rescheduling approach against any disruptions.
7.1 Scenarios for Congestion Level Effect
To understand the effect of varied congestion level on the rescheduling procedure, we conducted analysis on 3 levels of congestions namely mild, medium, and severe as shown in Table 8. To represent the congestion levels, we generated a set of random samples drawn using the triangular distribution.
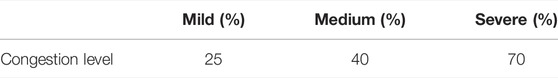
TABLE 8. Scenarios with different congestion levels.
7.2 Scenarios for the Effect of Complexity of Operations
It is known that the complexity of rescheduling increases with the number of loading bays and decreases with the increase in buffer slots or free slots. In this subsection, we test the sensitivity of the P-SRP model by changing the number of loading bays and buffer slots as shown in Table 9.

TABLE 9. Scenarios with varying complexity of operations.
7.3 Scenarios for the Effect of Rescheduling Strategy
The objective functions of a mathematical model impact its solution. The objective of the P-SRP model is to minimize the additional waiting time between the actual arrival time and the adjusted schedule. The quadratic objective function minimizes the squared differences between the new and old schedules. We also tested the model by replacing the quadratic objective function Eq. (1) with a linear equation that minimizes the difference between the initial and new schedules as shown in Table 10. In other words, the quadratic objective function does not allow any single truck to get a new slot with a large deviation from the initial slot, whereas the linear objective function can allow it. For example, when rescheduling two trucks, the quadratic function only allows both the trucks to have one slot deviation (objective function value = 12 + 12) over a single truck having two-slot deviations (objective function value = 22) with the other truck sticking to its current slot. With linear objective function, it depends on whether the truck slot is being preponed or postponed as it prefers preponing due to minimization of the objective function. In addition, another possible strategy is to have a dedicated loading bay to load delayed trucks so that the initial schedule will remain unchanged against disruptions. The resulting four scenarios related to the rescheduling strategy are shown in Table 10.
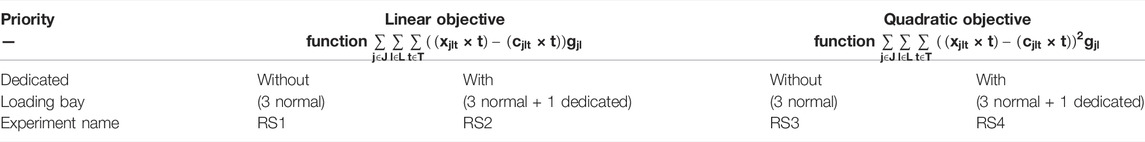
TABLE 10. Scenarios with different rescheduling strategies.
7.4 Analysis of Results
In the scenario of varied congestion levels, the comparison graphs in Figure 6 reveal that the P-SRP outperforms the baseline model in all KPI evaluations. The P-SRP offers equal improvements in terms of expected cost regardless of the congestion level. It reduces the expected cost by an average of 52.07% compared to the baseline model. With respect to the total number of rescheduled trucks, the P-SRP requires on an average 45.7% less rescheduling than the baseline model, and in the severe congestion level, the difference is 28%. In terms of idle slots (indicates slot utilization), the P-SRP decreases the buffer slots by 66.67% than the baseline model, and the reduction is 40 and 50% in mild and severe congestion levels, respectively. Hence, it can be concluded that the P-SRP model performs best at the medium congestion level.
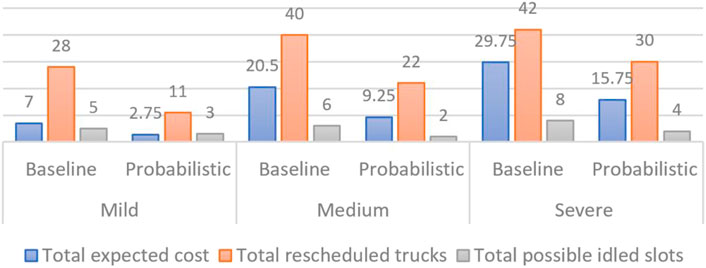
FIGURE 6. Result of varied congestion level.
In the scenario of varied complexity of operations, the results are presented in Figure 7 and show that the P-SRP induces significant benefits compared with the baseline model. With four loading bays, the P-SRP provides an average 54.84% lower expected cost compared with the baseline model, while the reduction is only 29.03% with two loading bays. These results indicate that the P-SRP is promising to be implemented in a large-scale operation. With respect to the utilization rate, a lower utilization rate reduces the performance gap between the probabilistic and baseline models, whereby in the situation of 100% utilization rate, it provides on an average 46.24% lower expected cost while the improvement is only 11.02 and 20.29% in case of 50 and 75% utilization rates, respectively. Hence, it can be derived that the P-SRP performs well as the complexity increases.
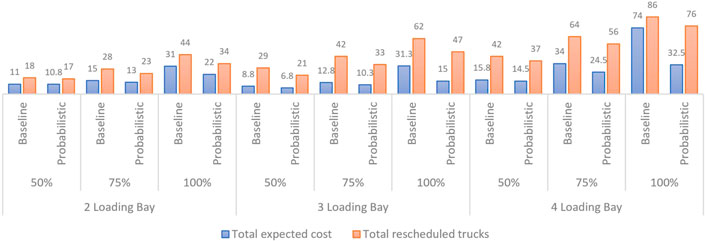
FIGURE 7. Result of varied specification of loading infrastructure.
In the scenario of a varied rescheduling strategy, the focus is on exploring the impact of different rescheduling preferences and on assessing the merit of having a stand-in loading bay as a dedicated facility. The results are presented in Figure 8. The results show that the P-SRP model performs well in both KPIs with the strategy of RS3 compared with RS1. It is interesting to note that the baseline model only reduces the total expected cost but increases the number of reschedules with the strategy of RS3 compared with RS1. The comparison between strategy RS2 and RS4 indicates that the stand-in loading bay is utilized only in the RS2 strategy and has no substantial impact on the RS4 strategy. Thus, it can be inferred that the optimal strategy is to use the quadratic objective function without any dedicated loading bay.
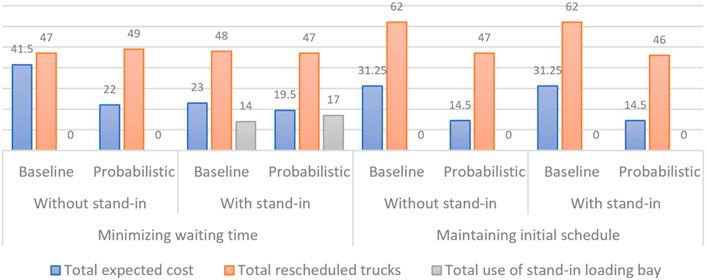
FIGURE 8. Result of varied rescheduling strategy.
7.5 Trade-off Between Efficiency and Robustness
Vlajic et al. (2012) defined supply chain robustness as the degree to which a supply chain shows an acceptable performance in (each of) its Key Performance Indicators (KPIs) during and after an unexpected event that caused disturbances in one or more logistics processes. In this study, the disturbances are caused by the early and especially late truck arrivals, which require rescheduling activity to improve the loading facilities’ performance (rescheduling cost and number of reschedules). Thus, the ability to reschedule the trucks during the arrival deviations within reasonable cost and number of reschedules is considered the robustness of this study. An inefficient rescheduling process can increase the number of reschedules done in a planning period due to the repetition of rescheduling for the same truck. In this study, we can capture the trade-off between scheduling efficiency and the number of reschedules by changing the maximum permissible overlap probability (r), which decides whether any two trucks can be scheduled to the same slot on a loading bay based on their presence probability (pjt) To test the sensitivity of the rescheduling process with respect to r, we selected 4 different scenarios by varying r value to 5, 20, 35, and 50%. Furthermore, we also tested these 4 scenarios under different congestion levels presented in Table 8.
The results from the above experiments are presented in Figure 9. It is evident from the figure that the rescheduling cost improves rapidly across all congestion levels when r value changes from 5 to 20% while the rate of improvement decreases for r value above 20%. To be specific, in the scenario of mild congestion level, the shift from 5 to 20% in r value provides a 60% improvement in the rescheduling cost, after which the gain is a constant. In the scenario of medium congestion level, raising r value from 5 to 20% yields 52% lower rescheduling cost, while further increase in the r value only results in 2.5% improvement on average. With the severe congestion level, the gain is approximately 32% till r value of 20% while the average improvement is reduced to 3% afterward.
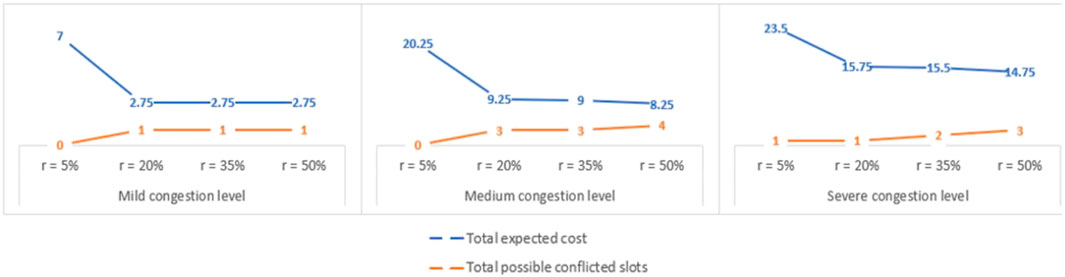
FIGURE 9. Trade-off between robustness and efficiency with respect to varied congestion level.
The total number of possible conflicted slots could be used as an indicator to measure how often a rescheduling is required, which represents less robustness in the long run. Results show that with the increase in r value, the number of conflicted slots also increases even though the rate of change is meager. It is logical as the higher r value allows more trucks to be scheduled together to the same slot, thus resulting in more conflicts. Hence, it is clear that improvement in efficiency at the loading operation does come at the expense of schedule robustness. Therefore, selecting the appropriate r value is advised by considering the trade-off between efficiency and robustness.
8 Conclusion
This article presents a solution to improve the operational efficiency of a petrochemical loading facility by focusing on the interconnection between logistic operations and traffic systems. We proposed a predictive–proactive rescheduling approach based on historical traffic data and real-time vehicle location information. The proposed method contains an ML prediction model to predict the incoming truck’s arrival class and presence probability and an optimization model to proactively reschedule assigned slots based on arrival class predictions to minimize the total rescheduling cost.
The proposed system works under a rolling horizon approach. It significantly outperforms the baseline model in terms of different performance measures such as expected cost of rescheduling, utilization rate, frequency of rescheduling, and robustness. Our sensitivity analysis showed that the proposed approach is suitable in higher congestion and complex situations. Lastly, as it is crucial to find the trade-off between operational efficiency and schedule robustness, the P-SRP model offers an advantage to balance them by altering the maximum value of permissible overlap. The results prove that shifting the r value from 5 to 20% yields the most significant operational efficiency improvement with negligible conflicted slots. However, it is up to a decision maker’s intuition to choose the suitable permissible overlap.
According to the main findings and acknowledged limitations of this research, there are few future research directions. First, it is required to conduct extensive large-scale experiments to improve the limited conclusions of this research. Also, as we have used synthetic data to test our use case, it will be interesting to try it in a real-world scenario. Other possible extensions are applying other assessment methods (such as cost-benefit analysis or multi-criteria decision method) to find the suitable trade-off. Also, it is possible to consider more stochasticity by allowing the dynamic length of loading slots, adding more features of a parameter in the predictive model (such as weather condition, type of road disruption, the occurrence of accidents, routes are taken by trucks, time records at a series of GPS coordinates), conducting hyperparameter-tuning to get a more precise prediction, and exploring the potential of stochastic programming that includes multiple recourse actions and set of scenarios to capture uncertainty.
Data Availability Statement
The original contributions presented in the study are included in the article/Supplementary Material, further inquiries can be directed to the corresponding author.
Author Contributions
EP: Methodology, Software, Validation, Investigation, Writing–original draft, Project administration, Formal analysis, Data collection, Data cleansing. YM: Conceptualization, Methodology, Supervision, Writing–review and editing. AP: Conceptualization, Methodology, Supervision. LT: Conceptualization, Methodology, Supervision. RV: Conceptualization, Methodology, Software, Supervision, Project administration, Formal analysis, Writing–review and editing.
Funding
The research was funded by NWO under grant agreement number 439.18.456 (project Freight Traffic Management as a Service - FTMAAS).
Conflict of Interest
The authors declare that the research was conducted in the absence of any commercial or financial relationships that could be construed as a potential conflict of interest.
Publisher’s Note
All claims expressed in this article are solely those of the authors and do not necessarily represent those of their affiliated organizations, or those of the publisher, the editors, and the reviewers. Any product that may be evaluated in this article, or claim that may be made by its manufacturer, is not guaranteed or endorsed by the publisher.
Acknowledgments
We thank Dr. Sarah Gelper from Eindhoven University of Technology, for her valuable insights that greatly assisted this research. We thank the anonymous reviewers and the editors for their valuable suggestions, which have greatly enhanced the quality of the manuscript.
Footnotes
1https://transtats.bts.gov/DL_SelectFields.asp?gnoyr_VQ=FGJ.
References
Bachu, A., Vanajakshi, L., and Subramanian, S. (2014). “Comparison of Model Based and Machine Learning Approaches for Bus Arrival Time Prediction,” in Proceedings of the 93rd Annual Meeting.
Barbour, W., Martinez Mori, J. C., Kuppa, S., and Work, D. B. (2018). Prediction of Arrival Times of Freight Traffic on Us Railroads Using Support Vector Regression. Transportation Res. C: Emerging Tech. 93, 211–227. doi:10.1016/j.trc.2018.05.019
Boswell, S. B., and Evans, J. E. (1997). Analysis of Downstream Impacts of Air Traffic Delay. Springfield, VA: Massachusetts Institute of Technology. Tech. rep..
[Dataset] Bureau of Transportation Statistics (2021). Reporting Carrier On-Time Performance (1987-present). Available at: https://transtats.bts.gov/DL_SelectFields.asp?gnoyr_VQ=FGJ.
Caballini, C., Mar-Ortiz, J., Gracia, M. D., and Sacone, S. (2018). “Optimal Truck Scheduling in a Container Terminal by Using a Truck Appointment System,” in 2018 21st International Conference on Intelligent Transportation Systems (ITSC). Maui, HI: IEEE, 2525–2530. doi:10.1109/ITSC.2018.8569623
Carvalho, L., Sternberg, A., Maia Gonçalves, L., Beatriz Cruz, A., Soares, J. A., Brandão, D., et al. (2020). On the Relevance of Data Science for Flight Delay Research: a Systematic Review. Transport Rev. 41, 499–528. doi:10.1080/01441647.2020.1861123
Chen, G., Govindan, K., and Yang, Z. (2013). Managing Truck Arrivals with Time Windows to Alleviate Gate Congestion at Container Terminals. Int. J. Prod. Econ. 141, 179–188. Meta-heuristics for manufacturing scheduling and logistics problems. doi:10.1016/j.ijpe.2012.03.033
Chen, G., and Yang, Z. (2010). Optimizing Time Windows for Managing export Container Arrivals at Chinese Container Terminals. Marit Econ. Logist 12, 111–126. doi:10.1057/mel.2009.21
Chira, R. (2014). The Role of Transport Activities in Logistics Chain. Knowledge Horizons - Econ. 6, 17–21.
Choi, S., Kim, Y. J., Briceno, S., and Mavris, D. (2016). “Prediction of Weather-Induced Airline Delays Based on Machine Learning Algorithms,” in 2016 IEEE/AIAA 35th Digital Avionics Systems Conference (DASC), 1–6. doi:10.1109/DASC.2016.7777956
Dutrieux, S. (2021). Predicting Flight Delay Distributions: A Machine Learning-Based Approach at a Regional Airport (Delft, Netherlands: Delft University of Technology). Master’s thesis.
Huiyun, Y., Xin, L., Lixuan, X., Xiangjun, L., Zhihong, J., and Zhan, B. (2018). “Truck Appointment at Container Terminals: Status and Perspectives,” in 2018 Chinese Control and Decision Conference (CCDC). Shenyang, China: IEEE, 1954–1960. doi:10.1109/CCDC.2018.8407446
Jing-lei, Y., and Ding, Y.-Z. (2006). Research on Optimal Equipment Allocation in Container Terminals by Using Closed Queueing Networks. Chin. J. Manage. Sci. 56, 56–60.
Khaksar, H., and Sheikholeslami, A. (2017). Airline Delay Prediction by Machine Learning Algorithms. Scientia Iranica 26, 2689–2702. doi:10.24200/sci.2017.20020
Konur, D., and Golias, M. M. (2013). Analysis of Different Approaches to Cross-Dock Truck Scheduling with Truck Arrival Time Uncertainty. Comput. Ind. Eng. 65, 663–672. doi:10.1016/j.cie.2013.05.009
Lababidi, H. M. S., Ahmed, M. A., Alatiqi, I. M., and Al-Enzi, A. F. (2004). Optimizing the Supply Chain of a Petrochemical Company under Uncertain Operating and Economic Conditions. Ind. Eng. Chem. Res. 43, 63–73. doi:10.1021/ie030555d
Larbi, R., Alpan, G., Baptiste, P., and Penz, B. (2011). Scheduling Cross Docking Operations under Full, Partial and No Information on Inbound Arrivals. Comput. Operations Res. 38, 889–900. doi:10.1016/j.cor.2010.10.003
Lee, H., Malik, W., and Jung, Y. C. (2016). “Taxi-Out Time Prediction for Departures at Charlotte Airport Using Machine Learning Techniques,” in 16th AIAA Aviation Technology, Integration, and Operations Conference. Washington, D.C: Aerospace Research Central. doi:10.2514/6.2016-3910
Li, N., Chen, G., Govindan, K., and Jin, Z. (2018). Disruption Management for Truck Appointment System at a Container Terminal: A green Initiative. Transportation Res. D: Transport Environ. 61, 261–273. doi:10.1016/j.trd.2015.12.014
Maknoon, M. Y., Soumis, F., and Baptiste, P. (2017). An Integer Programming Approach to Scheduling the Transshipment of Products at Cross-Docks in less-Than-truckload Industries. Comput. Operations Res. 82, 167–179. doi:10.1016/j.cor.2017.01.018
Marković, N., Milinković, S., Tikhonov, K. S., and Schonfeld, P. (2015). Analyzing Passenger Train Arrival Delays with Support Vector Regression. Transportation Res. Part C: Emerging Tech. 56, 251–262. doi:10.1016/j.trc.2015.04.004
Meng, L., and Zhou, X. (2011). Robust Single-Track Train Dispatching Model under a Dynamic and Stochastic Environment: A Scenario-Based Rolling Horizon Solution Approach. Transportation Res. B: Methodological 45, 1080–1102. doi:10.1016/j.trb.2011.05.001
Mueller, E. R., and Chatterji, G. B. (2002). “Analysis of Aircraft Arrival and Departure Delay Characteristics,” in AIAA’s Aircraft Technology, Integration, and Operations (ATIO) 2002 Technical Forum. Los Angeles, California: Aerospace Research Central. doi:10.2514/6.2002-5866
Nasiri, M. M., Ahmadi, N., Konur, D., and Rahbari, A. (2022). A Predictive-Reactive Cross-Dock Rescheduling System under Truck Arrival Uncertainty. Expert Syst. Appl. 188, 115986. doi:10.1016/j.eswa.2021.115986
Pang, L. Y., Li, Z., Huang, G. Q., Zhong, R. Y., Pan, Y., and Qu, T. (2015). Reconfigurable Auto-Id Enabled Software as a Service (SaaS) Shell for Real-Time Fleet Management in Industrial parks. J. Comput. Civ. Eng. 29, 04014032. doi:10.1061/(ASCE)CP.1943-5487.0000306
Parolas, I. (2016). ETA Prediction for Containerships at the Port of Rotterdam Using Machine Learning Techniques (Delft, Netherlands: Delft University of Technology). Master’s thesis.
Pongnumkul, S., Pechprasarn, T., Kunaseth, N., and Chaipah, K. (2014). “Improving Arrival Time Prediction of Thailand's Passenger Trains Using Historical Travel Times,” in 2014 11th International Joint Conference on Computer Science and Software Engineering (JCSSE). Chon Buri, Thailand: IEEE, 307–312. doi:10.1109/JCSSE.2014.6841886
Ralf, E., and Felix, R. (2021). Reducing Road Freight Transport Costs and Emissions by Means of a Data Platform for the Exchange of Time Windows in a Pick-Up and Delivery Process. BWL. Örebro, Sweden: Publications of darmstadt technical university, institute for business studies (bwl), Darmstadt Technical University, Department of Business Administration, Economics and Law, Institute for Business Studies.
Ramírez-Nafarrate, A., González-Ramírez, R. G., Smith, N. R., Guerra-Olivares, R., and Voß, S. (2017). Impact on Yard Efficiency of a Truck Appointment System for a Port Terminal. Ann. Oper. Res. 258, 195–216. doi:10.1007/s10479-016-2384-0
Rebollo, J. J., and Balakrishnan, H. (2014). Characterization and Prediction of Air Traffic Delays. Transportation Res. Part C: Emerging Tech. 44, 231–241. doi:10.1016/j.trc.2014.04.007
Raj, R., Maknoon, Y., Tavasszy, L., Verburg, R., and Radford, A. B. (2019). Resilient Logistics & Distribution System: A Conceptual Framework for ABC (Delft, Netherlands: Delft University of Technology). Master’s thesis.
Sanchez‐Rodrigues, V., Potter, A., and Naim, M. M. (2010). Evaluating the Causes of Uncertainty in Logistics Operations. Int. J. Logistics Manage. 21, 45–64. doi:10.1108/09574091011042179
Schulte, F., Lalla-Ruiz, E., González-Ramírez, R. G., and Voß, S. (2017). Reducing Port-Related Empty Truck Emissions: A Mathematical Approach for Truck Appointments with Collaboration. Transportation Res. E: Logistics Transportation Rev. 105, 195–212. doi:10.1016/j.tre.2017.03.008
Şeker, M., and Noyan, N. (2012). Stochastic Optimization Models for the Airport Gate Assignment Problem. Transportation Res. Part E: Logistics Transportation Rev. 48, 438–459. doi:10.1016/j.tre.2011.10.008
van der Spoel, S., Amrit, C., and van Hillegersberg, J. (2017). Predictive Analytics for Truck Arrival Time Estimation: a Field Study at a European Distribution centre. Int. J. Prod. Res. 55, 5062–5078. doi:10.1080/00207543.2015.1064183
van Schaijk, O. R. P., and Visser, H. G. (2017). Robust Flight-To-Gate Assignment Using Flight Presence Probabilities. Transportation Plann. Techn. 40, 928–945. doi:10.1080/03081060.2017.1355887
Vlajic, J. V., van der Vorst, J. G. A. J., and Haijema, R. (2012). A Framework for Designing Robust Food Supply Chains. Int. J. Prod. Econ. 137, 176–189. doi:10.1016/j.ijpe.2011.11.026
Vorage, L., and Mitici, M. (2021). Predicting Probabilistic Flight Delay for Individual Flights Using Machine Learning Models (Delft, Netherlands: Delft University of Technology). Master’s thesis.
Wibowo, B., and Fransoo, J. (2020). Joint-optimization of a Truck Appointment System to Alleviate Queuing Problems in Chemical Plants. Int. J. Prod. Res. 59, 3935–3950. doi:10.1080/00207543.2020.1756505
Wu, Z., and Zhang, J. (2011). Optimal Design of Container Terminal’s Gate System Based on M/G/K Queuing Model. 2671–2676. doi:10.1061/41184(419)441
Zehendner, E., and Feillet, D. (2014). Benefits of a Truck Appointment System on the Service Quality of Inland Transport Modes at a Multimodal Container Terminal. Eur. J. Oper. Res. 235, 461–469. Maritime Logistics. doi:10.1016/j.ejor.2013.07.005
Zhang, X., Zeng, Q., and Chen, W. (2013). Optimization Model for Truck Appointment in Container Terminals. Proced. - Soc. Behav. Sci. 96, 1938–1947. doi:10.1016/j.sbspro.2013.08.219
Zhao, W., and Goodchild, A. V. (2013). Using the Truck Appointment System to Improve Yard Efficiency in Container Terminals. Marit Econ. Logist 15, 101–119. doi:10.1057/mel.2012.23
Keywords: real-time ETA information, proactive rescheduling, truck ETA, probabilistic optimization, machine learning, uncertain arrivals
Citation: Prakoso EF, Maknoon Y, Pel A, Tavasszy LA and Vanga R (2022) A Predictive–Proactive Approach for Slot Management of a Loading Facility With Truck ETA Information. Front. Future Transp. 3:815267. doi: 10.3389/ffutr.2022.815267
Received: 15 November 2021; Accepted: 15 March 2022;
Published: 19 April 2022.
Edited by:
Thierry Vanelslander, University of Antwerp, BelgiumReviewed by:
Konrad Lewczuk, Warsaw University of Technology, PolandGianfranco Fancello, University of Cagliari, Italy
Copyright © 2022 Prakoso, Maknoon, Pel, Tavasszy and Vanga. This is an open-access article distributed under the terms of the Creative Commons Attribution License (CC BY). The use, distribution or reproduction in other forums is permitted, provided the original author(s) and the copyright owner(s) are credited and that the original publication in this journal is cited, in accordance with accepted academic practice. No use, distribution or reproduction is permitted which does not comply with these terms.
*Correspondence: Ratnaji Vanga, ci52YW5nYUB0dWRlbGZ0Lm5s