 Allister Loder1,2*
 Lea Bressan1
 Maria J. Wierbos3
 Henrik Becker1Andy Emmonds4Martin Obee4
 Victor L. Knoop3
 Monica Menendez5Kay W. Axhausen1
- 1Institute for Transport Planning and Systems, ETH Zurich, Zurich, Switzerland
- 2Technical University of Munich (TUM), Munich, Germany
- 3Transport & Planning, Faculty of Civil Engineering and Geosciences, TU Delft, Delft, Netherlands
- 4Surface Transport, Network Management Directorate, Transport for London, London, United Kingdom
- 5Division of Engineering, New York University (NYU) Abu Dhabi, Abu Dhabi, United Arab Emirates
Interactions among different modes or vehicle classes in urban road networks affect the network performance in different and complex ways. Thus, an answer to the question of “how many cars are too many for a city?” is not trivial. However, multi-modal macroscopic fundamental diagrams (MFD) offer a novel opportunity to answer this question. So far, no methodology exists to estimate multi-modal MFDs resulting from arbitrary multi-modal interactions. In this paper, we propose a methodology to capture additional delays in the shape of the MFD and derive an approach for estimating multi-modal MFDs thereof. The influence on the MFD shape is established using the two-fluid theory of urban traffic by defining pairwise copula functions between travel times of each mode. In contrast to many existing approaches, the presented approach retains individual mode's speed information. We show the applicability of the approach with a tri-modal case of bicycles, buses, and cars with empirical data from Amsterdam (The Netherlands) and London (United Kingdom). Although the approach is not limited to this specific tri-modal case, we use the example to discuss the initial policy question by deriving optimal modal splits for a given accumulation of travelers. Last, we compare the new approach to existing estimation methods for bi-modal MFDs describing car and bus traffic.
1. Introduction
On urban roads many different users and vehicles like bicycles, buses, cars, taxis, and pedestrians are present. Their interactions are complex and influence the network performance (measured in either passenger or vehicle throughput) in various different ways, e.g., while driving beyond a slow garbage truck. The macroscopic fundamental diagram (MFD) offers a novel approach for understanding and modeling these interactions physically consistent at the network level as it is generally mode-abstract (Daganzo, 2007), where some MFD parameters are mode-specific, leading to mode-specific MFD shapes Daganzo and Geroliminis (2008). The MFD describes a network as a relationship between vehicle accumulation and average network speed, production of vehicle-kilometer, and average vehicle flow. So far, literature has been primarily focused on a single mode: cars (Daganzo and Geroliminis, 2008; Geroliminis and Daganzo, 2008; Mahmassani et al., 2013; Loder et al., 2019a).1 Some studies are already investigating interactions between cars and buses (Geroliminis et al., 2014; Loder et al., 2017; Castrillon and Laval, 2018; Dakic et al., 2020; Tilg et al., 2020), and cars and pedestrians (Daganzo and Knoop, 2016), but no approach exists to derive multi-modal MFDs for a vector of vehicle accumulations with more than two modes (in most cases buses and cars). In this paper, we contribute with such a vector-based approach that is based on the idea of quantifying pairwise the interaction delays of interacting modes and link them to the MFD shape like a copula function. The proposed methodology uses a recently formulated functional form for the MFD (Ambühl et al., 2020) in conjunction with the two-fluid theory of urban traffic by Herman and Prigogine (1979). The latter theory sees traffic analogous to the Bose-Einstein condensation at low temperatures (Ardekani and Herman, 1982; Dixit, 2013). In contrast to existing three-dimensional (3D)-MFD estimation approaches (e.g., Geroliminis et al., 2014; Loder et al., 2017, 2019b), the proposed vector-based approach to estimate multi-modal MFDs retains the individual mode's speed information, it can be flexibly applied to any reasonable multi-modal situation with two or more modes, and it can incorporate any delay causing disturbances in urban traffic. The contributions of this paper are 4-fold. First, we propose a methodology to capture additional delays, other than the own mode's delays, in the shape of the MFD. Second, we extend this methodology to a vector-based approach to estimate multi-modal MFDs based on delays caused from interactions in multi-modal traffic, allowing to derive complex multi-modal MFD surfaces. Third, we show the applicability of this vector-based approach to a simplified multi-modal case of bicycles, buses, and cars, where we reveal with empirical data from Amsterdam (The Netherlands) and London (United Kingdom) the primary interaction effects. That being said, the proposed vector-based approach is not limited to the discussed specific example of bicycle-bus-car traffic. We then show how this vector-based approach can be used for policy making. Fourth, we contribute with a discussion and comparison of multi-modal MFD estimation methods. We organize this paper as follows. Section 2 introduces the methodology to account for additional external delays in the shape of the MFD. Based on this methodology, we propose in section 3, a vector-based approach to estimate multi-modal MFDs. Thereafter, we illustrate the applicability of this vector-based approach to the tri-modal case of bicycles, buses, and cars in section 4. We further show a possible policy application of the tri-modal MFD and thus of the proposed vector-based approach by discussing the question of optimal modal split in section 5. Then, we compare in section 6 the proposed and existing methods to estimate multi-modal MFDs. We finish this paper with an overall discussion and concluding remarks in section 7.
2. Accounting for Additional Delays in MFDs
The MFD is a mode-abstract concept in urban transportation networks. It represents the upper envelope to all possible states in the relationship between network's average flow, q, and density, k of a particular mode (Daganzo, 2007). Although originally defined for car traffic only (Daganzo and Geroliminis, 2008), it has already been shown that the MFD concept is also applicable to other modes that only differ from cars in propulsion and some operational characteristics (e.g., speeds, passenger occupancy, and vehicle size), but behave similarly in terms of the physics required for network level modeling (e.g., Geroliminis et al., 2014; Castrillon and Laval, 2018; Hoogendoorn et al., 2018; Yuan et al., 2019; Wierbos et al., 2020). In this section, we show how additional delays from any external origins, i.e., other than the own mode's delays, can be accounted for in the MFD using the two-fluid theory of urban traffic by Herman and Prigogine (1979). In contrast to the MFD, the latter theory was only proposed for cars and has not been yet extended to other modes in an urban road network. However, following the arguments for the MFD's applicability to other modes, we assume here that the two-fluid theory also applies to all modes that behave similarly to cars in an urban transportation network, e.g., buses, taxis, bicycles, motorbikes, trucks, urban delivery vehicles, etc. In this vector-based approach, we distinguish between the a-priori known upper MFD (uMFD) (Daganzo et al., 2018; Ambühl et al., 2020) that is the upper envelope to all physically possible traffic states, and the observed MFD that is always located below the uMFD due to traffic heterogeneity (e.g., Mazloumian et al., 2010; Daganzo et al., 2011; Gayah and Daganzo, 2011; Geroliminis and Sun, 2011; Muhlich et al., 2015), network dynamics (e.g., Mariotte et al., 2017), and as already mentioned interactions between different modes. Here, we use the functional form for the MFD proposed by Ambühl et al. (2020) that captures the gap between the a priori known uMFD and the observed MFD with just a single parameter, λ. In a perfectly homogeneously loaded and undisturbed network, it takes on its smallest value, λ0. Any increase from λ0 can then be attributed to network heterogeneity and between-vehicle interactions. Equation (1) shows this functional form for a trapezoidal uMFD. Note the analyst should be aware that when λ becomes too large, especially at very low or high densities, this functional form produces negative flows as emphasized by Ambühl et al. (2020).
Here, vf is the free flow speed in the network, Q is the network's capacity as defined by the most constraining intersection (Daganzo and Geroliminis, 2008), κ is the jam density in the network, and w is the wave speed. In Figure 1A, we illustrate the behavior of this MFD function for different values of λ0 in comparison with the uMFD as defined by the minimum operator with the trapezoidal shape (Equation 1). Here, each of the trapezoidal shape's three segments enters as an argument to the minimum operator. With λ0 approaching zero, the resulting curve approaches the uMFD, in this case the trapezoidal shape. When λ0 increases, the curve moves further down but still describes the familiar MFD shape.
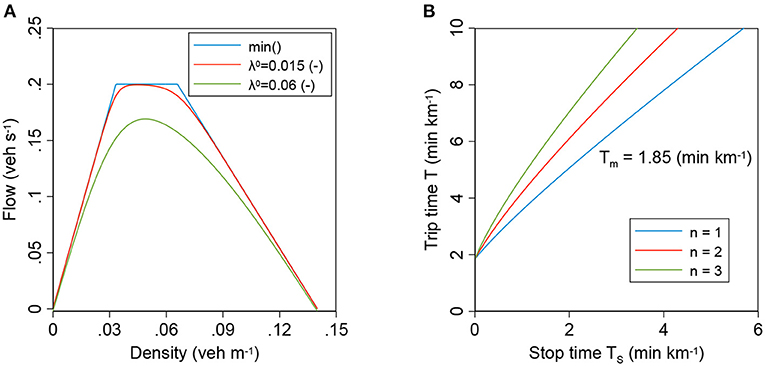
Figure 1. Fundamental relationships of urban-scale traffic. (A) Illustrates the λ-MFD function with a trapezoidal uMFD from Equation (1). The uMFD is shown by the min() operator. The larger λ0 becomes, the larger the distance between the observed or realized MFD and the uMFD, indicating a reduction in network performance; (B) the fundamental relationship of the two-fluid theory of urban traffic. The parameter n can be seen as a quality of service indicator of the road network and Tm is the minimum travel time in the network per unit distance.
We also define the pace (travel or trip time per unit length) T. It consists of two parts as given by Equation (2). The first term, T0(k), denotes the undisturbed pace given its current density levels, k, i.e., without any additional delays that can be derived using Equation (1) as it is the reciprocal of the space-mean speed from the MFD. The second term, Γ, captures additional delays, e.g., caused by interactions across modes.
The additional delays Γ will decrease the flow of vehicles as delays and interactions have always a negative effect. This means, that an increase in Γ will increase λ in Equation (1). The vector-based approach proposed in this paper calculates the change from λ to resulting from delays Γ. This ultimately allows the estimation of the MFD shape that includes interaction delays.
The link between the additional delays Γ and λ is established using the two-fluid theory of urban traffic (Herman and Prigogine, 1979; Ardekani and Herman, 1982; Dixit, 2013). The theory differentiates between running vehicles (subscript r) and stopped vehicles (subscript s) and predicts that the running speed of vehicles depends on the fraction of running vehicles and a network-wide constant n. The parameter n is assumed to result from driving behavior, network topology, and signal settings, which is usually econometrically estimated using measurements of Tr and T (Herman and Prigogine, 1979; Ardekani and Herman, 1985; Ardekani et al., 1992). Figure 1B shows how n influences the characteristic relationship between the stop time Ts and trip time T. Consequently, it is reasonable to assume that delays from multi-modal interactions influence n. We refer for further details on this theory to the seminal work by Herman and Prigogine (1979). Following this theory, we distinguish between additional running delays Γr and additional stopping delays Γs. Both add together to the total delay Γ ≡ Γr + Γs. They influence separately the running time and stopping time to Equations (3) and (4), respectively. Note that the superscript 0 indicates the travel time without additional delays as defined in Equation (2).
We can combine Equations (3) and (4) to express the total pace or trip time T that covers stopping and running as shown in Equation (5). Recall that T is the reciprocal of the space-mean speed in the MFD.
With Equations (3)–(5), we can then calculate the network-wide constant that includes the additional delays Γs and Γr following to Equation (6). Note that Equation (6) without additional delays equals Equation (13) from Ardekani and Herman (1985) solved for n.
Last, we calculate , which denotes the effects of the additional delays Γr and Γs on the MFD shape. is calculated by equalizing the two-fluid speed equation with and the MFD speed equation with as shown in Equation (7). Note that the two-fluid speed equations, the right-most term in Equation (7), results from Equations (3) and (16) from Herman and Prigogine (1979), where h is a network- and mode-specific constant.
3. A Vector-Based Approach for Multi-Modal MFDs
The vector-based multi-modal approach for the MFD considers that the additional delays Γ for stopping and running are resulting from interactions with other vehicle classes. There are two possibilities to quantify these delays as a function of the presence of interactions between vehicle classes. First, (analytical) traffic models or similar that are based on theory and are calibrated to data. Second, regression-based models or similar that are learnt from data, e.g., a linear regression model.
Multi-modal urban transportation networks usually have a set of modes , e.g., with elements m ∈ {bus; car; bike; bicycle}. The considered m modes then lead to the m dimensional multi-modal MFD. In this vector-based approach, we assume that each mode's MFD from Equation (1) describes the delays within each mode and that Γ captures all additional delays encountered by the interaction with other modes. Let us then consider that k is the vector of vehicle densities of all considered modes and that the additional stopping delays for mode m and additional running delays for mode m are functions of k, i.e., scalar functions with ℝm → ℝ. As aforementioned, these functions fs(k) for the stopping delays and fr(k) for the running delays can be either result from analytical traffic models or can be learnt from data.
To reduce the complexity of deriving m dimensional functions fs(k) and fr(k), one possibility is to assume additivity of pairwise delays as shown for stopping delays in Equation (8) and running delays in Equation (9). Here, the notation Γm′→m describes the additional delays caused by mode m′ on mode m, where the → operator indicates the direction of effects.
Importantly, the formulations so far assume that the own mode's MFD as well as the additional delays resulting from between vehicle interactions are homogeneously distributed in the network. Arguably, this is rarely the case in real large urban networks. Therefore, functions gs and gr are required that quantify for a given k the average expected additional delays in a real network as shown in Equations (10) and (11) for stopping and running delays, respectively. These functions must not only consider k, but also k's spatial distribution and the entire network topology.
With and defined, we can now calculate for each mode m the traffic performance measure from Equation (6) and then subsequently resulting for each mode using 7 that then gives the new resulting MFD shape. Then, all resulting MFDs for all considered modes capture the interaction effects and thus the resulting multi-modal MFD is estimated, where the total flow of the multi-modal MFD equals the sum of vehicle flows from each individual mode's MFD.
The problem formulated in Equation (7) must be solved for each mode m separately as the delay effects cannot be generalized. Due to the high non-linearity of the model, we propose to solve Equation (7) for each demand situation separately, i.e., for all possible values of k, instead of assuming constant n or λ values over all densities.
4. An Illustrative Application: The Tri-modal MFD
The vector-based approach to estimate multi-modal MFDs from section 3 is now illustrated for the case of bicycles, buses, and cars. There are many options to explicitly formulate the delay functions that quantify the interactions between modes. The vector-based approach presented in this paper is consequently one of many options. In this illustrative application, we use (analytical) traffic models and regression-based models to quantify the delays in order to show how these can be incorporated into our vector-based approach. In Appendix 1 we summarize the delay models used. There are clear limitations to these delay functions, but these do not interfere with the illustration of the vector-based approach's applicability.
The tri-modal MFD developed for illustration purposes in this section refers to a specific network topology, but as mentioned, the vector-based approach can be applied to various different delay causing settings and is not limited to this topology. In particular, the questions of bicycle network design and dedicated bicycle lanes could be discussed as it already has been done for buses (e.g., Dantsuji et al., 2017). Thus, all insights and implications derived from this particular tri-modal MFD may be altered when applied to a different network topology. Consequently, future research can use this vector-based approach to discuss recurring urban design questions like dedicated bus and bicycles lanes and their effect on the MFD.
We structure this section as follows: first, we introduce the delay functions in section 4.1. Second, we discuss the data used for the tri-modal MFD and its calibration in section 4.2. Third, we show in section 4.3 the resulting MFD shapes. As this section serves only as an illustrative application of the vector-based approach from section 3, we discuss here in the main part the key elements, but provide the modeling details in the appendix of this paper for the interested reader.
4.1. Delay Functions
We use four different delay models for the tri-modal MFD: A continuous multiclass fundamental diagram (FD) taken from Bliemer (2001), a discrete multiclass FD adopted from Wierbos et al. (2020), a bus dwelling behavior model based on Daganzo (2010), and a data-based regression model for the behavior of bicycles at intersections. For additional stopping delays caused by cars on buses and bicycles, we are not aware of an explicit (physical) mechanism and thus define Γs = f(Γr) that must be learnt from data or assumed. Appendix 1 provides more details on the models used, where in particular Appendix 1.5 summarizes the pairwise delay functions. Appendix 2 discusses how to account for the heterogeneity in the spatial distribution of additional delays, i.e., the function g from Equations (10)–(11). We do not use a continuous multiclass model for the interactions that involve bicycles as we assume that in the congested case of cars and buses, bicycle speeds do not converge to that of the other modes, i.e., bicycles can sneak through the vehicle queues. Therefore, we provide a separate discrete multiclass FD.
For the additional running delays, the general modeling idea is to express the additional delay as the difference in pace between the pace from the multi-modal FDs and the unimodal FDs, i.e., the difference between the case where both modes are interacting and the case without interaction. For the interaction stopping delays, the general modeling idea is to quantify the sources of additional stopping delays caused by the interactions. In this case, we do not need to subtract anything from these delays as they are fully additional, i.e., in the uninterrupted case, no such delays are to be expected.
4.2. Data and Calibration
The calibration of the tri-modal MFD as previously introduced to a specific context requires data. In previous vector-based approaches, multi-modal MFDs have been fitted to multi-modal observations (e.g., Geroliminis et al., 2014; Loder et al., 2017; Dakic and Menendez, 2018) that provide measurements of car and bus traffic from the same network at the same time. These kinds of observations at large urban scale are available for cars and buses, both from simulation and empirical data (e.g., Loder et al., 2017, 2019b). Unfortunately, no such data for bicycle interactions with buses and cars at large urban scale was available to us. Consequently, a global calibration by curve fitting to tri-modal observations like in Geroliminis et al. (2014) is not possible, and all delay models must be separately calibrated. For the bicycle interaction calibration, we collected data from Amsterdam (NL) and London (UK). Figure 2 shows the experimental sites. Although this separate calibration is a clear limitation of this empirical section, it does not restrict the methodological contributions of sections 2 and 3, as the empirical section is only an illustrative application of the proposed vector-based approach.
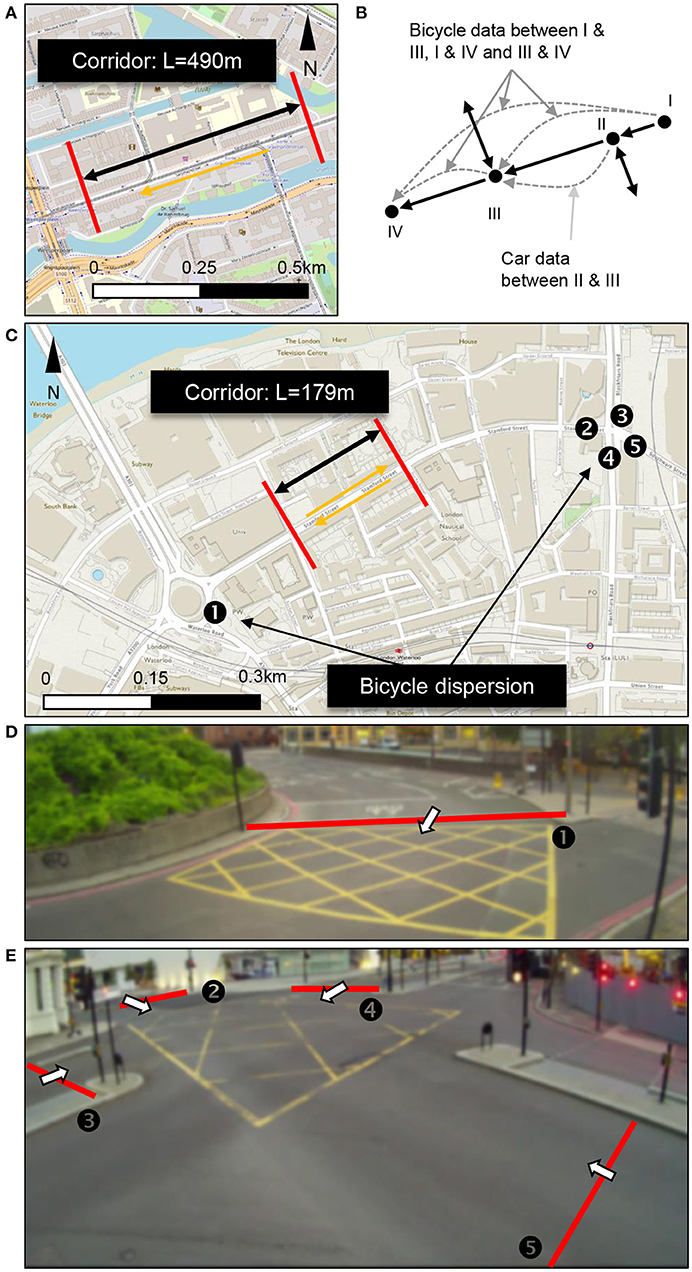
Figure 2. Experimental sites for the measurements of bicycle interactions. (A) Travel time corridor along Sarphatistraat in Amsterdam. Background map courtesy of https://www.openstreetmap.org/. (B) Locations between which travel times of cars and bicycles were recorded. There are several locations to account for in and outflow from site streets. The measurements used for the calibration are between locations II and III. (C) Measurement locations for the calibration of the bicycle interaction models along Stamford Street in London. Background map courtesy of https://osmaps.ordnancesurvey.co.uk/. (D,E) Show original footage from the installed cameras of the two sites in London to illustrate the layout of the bicycle stopping boxes. Box number 1 is shown in (D) and boxes 2–5 are shown in (E). All cameras are covered for blurring images to protect travelers' privacy.
For the calibration of the (bi-modal) discrete fundamental diagram, we measured travel times along Sarphatistraat in Amsterdam (see Figure 2A) and Stamford Street in London (see Figure 2C). We had to rely on two different experimental sites because the Amsterdam site did not have enough cars to identify an interaction effect of bicycles on cars, while the London site did not have enough bicycles. We further tested whether the Amsterdam data has enough variance to explain car and bicycle density effects on car pace and whether the London data has enough variance to explain car and bicycle density effects on bicycle pace. In neither of the cases, we were able to find statistically significant effects of the mode less present in that particular network. While the variance in Amsterdam allowed at least an estimation of a robust effect of car density on car pace, in London we did not find a robust relationship between bicycle density and bicycle pace. Thus, we consider that using both data sets for this illustrative application is appropriate as no more coherent data is available to infer the interaction delays. The Sarphatistraat is designed such that cyclists have priority but cars can ride along. Travel time data for cars and bicycles were collected in the westbound direction between Alexanderplein and Weesperplein as shown in Figure 2B. To account for vehicle entries and exits between both intersections, we use only the flows and travel times between locations II and III as shown in Figure 2B. Data have been collected in the morning peak between 8 and 9 a.m. on the June 5, 2018. While the total flows at each location were recorded, travel times were only obtained for some vehicles. Along Stamford Street in London, bicycles, buses, and cars share the same lane. Flow and travel time data were collected in both directions in the first week of June 2019. Again, we account for vehicle entries and exits. At all locations in London, as defined by Figure 2C, we measured the additional delay for cars as the difference between the bicycles started moving and motorized vehicles started moving once the space ahead of them was cleared. Figures 2D,E show the bicycle stop boxes at the five locations for measuring the additional delays.
Figure 2 shows that the monitored segments are around 200 m and 450 ms in length. These are typical distances between traffic signals found in European cities. We expect that the segment length used for measurements should be at least in the order of magnitude of a typical road segment of the modeled network, but not substantially shorter as many of the expected interactions between bicycles and cars might not be observed, especially in the oversaturated regime. Contrary, for substantially longer segments, the expected interactions will take place, and thus these observations can still be used.
In Appendix 3, we summarize the measurement results and report how they are used to calibrate all tri-modal MFD parameters. In Appendix Table 2, we then list all the parameters used.
4.3. Resulting MFDs
In Figure 3, we then show the resulting car MFDs where we illustrate the bi-modal interaction effects with buses [see panels (A) and (B)] and with bicycles [see panels (C) and (D)]. Note that each presented pair of figures is based on the parameters given in Appendix Table 2 and thus only the viewpoint differs. In all four panels of Figure 3, we clearly find the intuitive and expected effect that more interactions decrease the performance of car travel. The MFD for a single mode is considered to be a concave relationship Daganzo and Geroliminis (2008), which does not hold for high densities as seen in Figure 3 for the proposed functional form. This behavior was also observed for the exponential function for the MFD (Geroliminis et al., 2014; Ambühl et al., 2020). For both functional approaches, however, a concave relationship exists in the typical traffic regimes, implying their applicability for modeling purposes.
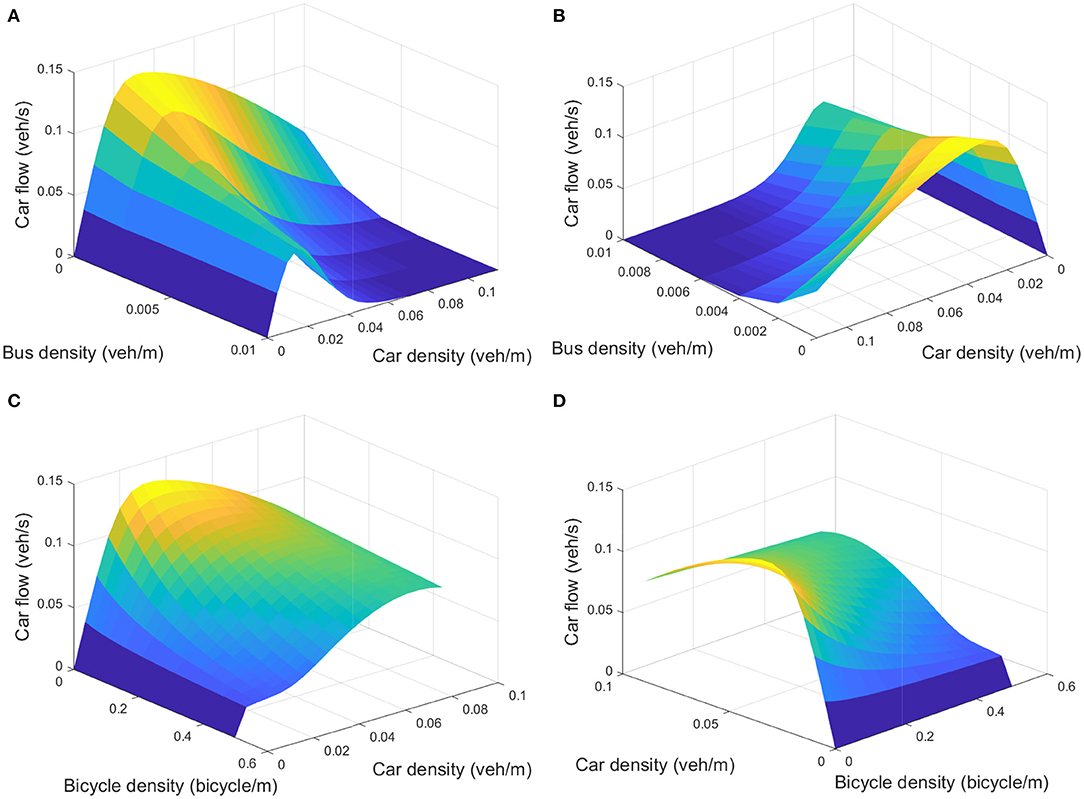
Figure 3. Car MFDs with interaction effects. (A,B) Show the bi-modal interaction effects between buses and cars on car flow; (C,D) show the bi-modal interaction effects between bicycles and cars on car flow. Each bi-modal pair of figures is numerically identical, but the perspective differs. All MFDs are based on the parameters listed in Appendix Table 2.
5. Policy Application: Optimal Modal Split
How many cars are too many for a city? This is a question with the intuitive answer “it depends.” In particular, it depends on the total demand or the passenger accumulation in the network. Consequently, it is important for decision makers to understand which proportional usage of modes (mode split) should be favored for a given demand. We use the previously calibrated tri-modal MFD to address this question at the network level.
We perform the analysis as follows. We define an urban network based on the parameters listed in Appendix Table 2, where we assume a two-way grid layout with a total diameter of 2 km and an intersection spacing of 250 m. We set the bus service headway to 7.5 min, which corresponds to a bus density of kb = 0.001 (bus/m). For simplicity, we assume that a single car and a single bicycle transport one passenger, while buses have no occupancy limit, i.e., if demand increases the agency would provide larger vehicles. We identify that for this size of network, a reasonable range of passenger accumulation levels is from 1,000 to 24,000 (in passenger bins of 1,000). For each bin, we iterate through all possible mode share combinations (from 0.05 to 0.90) and calculate the total travel time for a 3 km trip for each mode. We added half of the bus headway to the bus travel time to account for waiting (assuming uniform passenger arrivals). The optimal mode share is then obtained for each accumulation bin as the minimum total travel time. This analysis follows a social optimum perspective (minimum total travel time) and not Wardrop's user equilibrium (equal travel time on all routes), where the latter would lead to different results.
Figure 4 presents the results of the policy scenario. Note that the results are specific to the network topology listed in Appendix Table 2 and insights and implications may change for other network topologies. Figure 4 shows shares not totals. For example, for passenger accumulations between 5,000 and 10,000, the total number of cyclists increases, although its share. Intuitively, with larger passenger accumulation levels in the network, we see that the share of cars declines steadily. Up to an accumulation of 5,000 passengers the bicycle share is substantially increasing, while it declines beyond 5,000 passengers in exchange for an increase in the share of bus transport. Arguably, the observed tipping point results from the free-flow speed parameters of each mode. If buses were to be much faster compared to bicycles, the increase in bicycle share would not be that strong. The average journey speed, calculated as the mean journey speed weighted by passengers not vehicles, decreases with the number of passengers. The decrease is substantial until 10,000 passengers, arguably due to the congestion caused by cars. From 10,000 passengers onward, the numbers of cars and bicycles remain almost constant and congestion does not get worse, while the further decline in journey speeds can be attributed to boarding and alighting delays caused by bus passengers. We conclude that in the regime of around 5,000 to 10,000 passengers, bicycles become as good as cars in terms of achievable journey speeds in mixed traffic, but then public transport is needed to achieve satisfactory journey speeds.
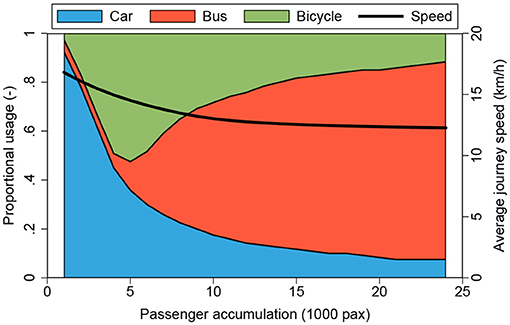
Figure 4. Optimal mode shares and average journey speed given the current vehicle accumulation based on the calibrated tri-modal MFD from Appendix Table 2.
The discussed policy scenario of the tri-modal MFD clearly emphasizes how the vector-based approach for multi-modal MFDs can be used. Nevertheless, other researchers and planners have to calibrate their multi-modal MFD to their real-site to derive meaningful insights. Here, as emphasized in sections 2 and 3, they can either derive analytical traffic models or use regression-based functions to describe the relationship between the presence of interactions and additional delays. With data becoming more widely available, the latter approach seems more favorable, but then any modeling is only valid within the observed variation.
6. Comparison of 3D-MFD Estimation Methods
The proposed vector-based approach to estimate multi-modal MFDs clearly differs from existing methods to estimate MFDs that capture bus–car interactions: the 3D-MFD. Importantly, we consider, in this study, the term MFD estimation as the means to model and quantify the behavior of the observed multi-modal traffic states. As usual, these traffic states can be either obtained via a traffic simulator (e.g., Geroliminis et al., 2014), from empirical observations (e.g., Loder et al., 2017) or using analytical methods (e.g., Castrillon and Laval, 2018; Loder et al., 2019b; Dakic et al., 2020). So far, three approaches have been suggested: (1) an exponential fit to simulation data by Geroliminis et al. (2014), (2) a linear speed model of empirical measurements by Loder et al. (2017), (3) a lower envelope approach suitable for simulation and empirical data by Loder et al. (2019b). Consequently, the proposed vector-based approach from section 3 is the fourth approach. In Table 1, we summarize the four estimation methods, and in Figure 5, we compare the four different approaches for empirical data from Zurich (CH) first used by Ambühl et al. (2017) and Loder et al. (2017).
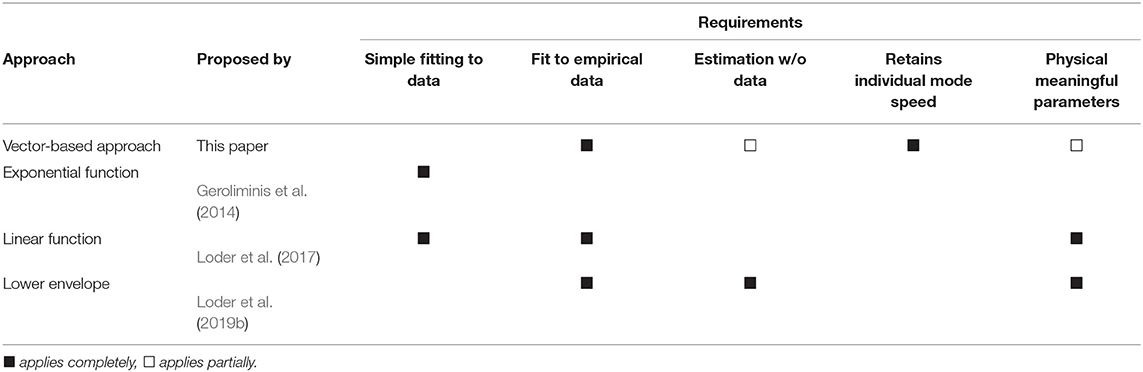
Table 1. Comparison of 3D-MFD estimation methods.
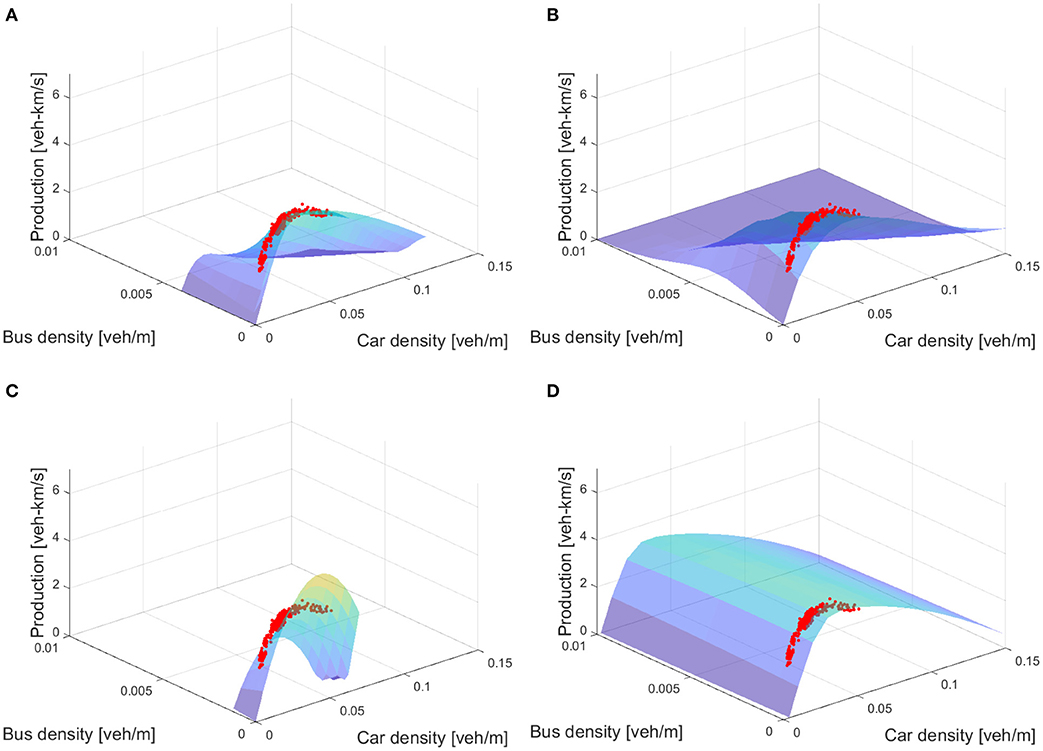
Figure 5. Comparison of 3D-MFD estimation methods. (A) Shows the vector-based approach 3D-MFD, (B) the exponential function 3D-MFD, (C) the linear model 3D-MFD, and (D) the lower envelope 3D-MFD.
We compare the four approaches across five dimensions qualitatively and their fit to observations. First, the four approaches differ in their simplicity of data fitting. Here, the simple linear and exponential model clearly outrank the more complex vector-based approach and the lower envelope. The latter models do not only have more parameters but are also characterized by more non-linear elements that make data fitting more difficult. Second, all approaches can be used with simulation data, but the exponential function has clear limitations when fitted to empirical data as emphasized by Loder et al. (2019b), while all three other approaches can be applied to empirical data. Third, the lower envelope approach by Loder et al. (2019b) showed that even without traffic state observations, the 3D-MFD shape—to be precise its lower envelope—can be reasonably well-approximated using network topology and fundamental traffic operation characteristics. This feature is not available for the linear and exponential function. Nevertheless, depending on the chosen delay functions, this vector-based approach can also estimate the MFD without traffic state observations. Fourth, none of the previous approaches are able to retain each individual mode's speed, but the vector-based approach does. Last, the linear function and the lower envelope have the clear advantage that all of their parameters have a clear physical interpretation, while this is less the case for the exponential function. For the proposed vector-based approach, it depends on the chosen delay models whether or not all of their parameters have a clear physical interpretation.
The visual comparison of the four approaches is given in Figure 5. Each 3D-MFD is estimated for the same road network in Zurich Wiedikon (CH) and is compared to the empirical observations used by Loder et al. (2017) and the network parameters used by Loder et al. (2019b). Figure 5A proposed vector-based approach 3D-MFD, Figure 5B the exponential function 3D-MFD, Figure 5C the linear model 3D-MFD, and Figure 5D the lower envelope 3D-MFD. Importantly, the 3D-MFDs in Figures 5B–D are fitted to the data, while the 3D-MFD from the proposed vector-based approach is calibrated to the data.
It can be clearly seen that all approaches lead to different MFD shapes, while all seem to describe the empirical observations quite well and obtain the expected 3D-MFD shape for the observed regimes. In particular, we can highlight four insights from these results. First, the lower envelope 3D-MFD in Figure 5D is the “highest” 3D-MFD. This is intuitive as it describes the best-case situation and all other approaches consider more between-vehicle interactions that are reducing total travel production. Thus, with little or no data available, this vector-based approach models well the observed speeds (Loder et al., 2019b), but overestimates network performance. Second, the linear and exponential model are robust for data fitting, but lack validity for predictions outside of the box of observed densities (Figures 5B,C). In both cases, the 3D-MFD shape follows the functional definition, but it is not clear whether this coincides with the physics of traffic or not. Third, the 3D-MFD based on the proposed vector-based approach in Figure 5A seems to fall in between the two previous extremes. Arguably, this 3D-MFD functional form could be better suited to describe the dynamics of traffic outside the box of empirically observed densities. However, without delay models that capture interaction effects at high densities, it is not surprising that the 3D-MFD in Figure 5A diverges from the lower envelope 3D-MFD, which is most likely referring to the ground truth MFD. Last, regarding the estimation error (RMSE) of the functional form compared to the empirical data, we find that the vector-based approach 3D-MFD has an RMSE = 0.396, the exponential function has an RMSE = 0.111, the linear model has an RMSE = 0.545, and the lower envelope of 0.184. These differences do not surprise and underline the previous findings. The exponential function is the most flexible in terms of curve fitting, while the linear model is the least flexible. Interestingly, although the vector-based approach 3D-MFD is not fitted to the 3D-MFD observations, but is only calibrated to the simplifying interaction models, it describes the observed variance better than the linear model.
7. Conclusions
In this paper, we proposed the first methodology to account for additional (external) delays in the shape of the MFD and derived a vector-based approach to estimate multi-modal MFDs. This is achieved by linking the two-fluid theory of urban traffic (Herman and Prigogine, 1979) to the travel times derived from a recently formulated functional form for the MFD (Ambühl et al., 2020). In contrast to previous approaches to estimate multi-modal MFDs, this vector-based approach retains the speed information of each individual mode, it is generic and applies to 2, 3, or more modes, and depending on the formulation of the delay function, it could be less data intensive. We illustrated the applicability of the proposed vector-based approach to the tri-modal case of bicycles, buses, and cars using basic empirical measurements from Amsterdam and London. Even with that basic data, we were able to estimate the primary interaction effects that we required to approximate the tri-modal MFD. We then showed how the policy relevant question of What is the optimal modal split for a given demand can be discussed with this calibrated tri-modal MFD. Last, we compared the proposed vector-based approach with existing approaches to estimate 3D-MFDs, i.e., the multi-modal MFD for the case of buses and cars. Unfortunately, no tri-modal data at the network level exist to derive appropriate delay functions and validate the proposed vector-based approach. This clearly limits the methodological contribution of this paper. However, the bi-modal validation with empirical data proves the general applicability of the proposed approach compared to other existing approaches in the bi-modal case of buses and cars. Nevertheless, new data sources like the pNEUMA drone data by Barmpounakis and Geroliminis (2020), which does not observe bicycles, are promising sources for estimating high dimensional multi-modal MFDs with cars, taxis, buses, and lorries with the proposed vector-based approach.
Next to the proposed vector-based approach's limitations discussed in section 6 and in the previous paragraph, it is worth highlighting some other avenues for future research. First, to apply the proposed vector-based approach at large scale, suitable and reasonable sets of delay functions are required and an assessment is necessary on which delay functions are best applicable. Consequently, future research should develop different delay functions and assess their performance and suitability for modeling traffic at large urban scale, e.g., by using large-scale drone data (e.g., Barmpounakis and Geroliminis, 2020; Bock et al., 2020). Second, the proposed tri-modal MFD is clearly context specific and implications thereof may be altered when applied to a different context and network topology. Therefore, future research could investigate the influence of different network typologies, e.g., bicycle and bus network design and dedicated infrastructure. In other words, addressing the important question of space allocation (e.g., Zheng and Geroliminis, 2013) and urban space consumption of cars and buses (e.g., Roca-Riu et al., 2020) in our cities. Third, the MFD underlies a strong assumption of traffic homogeneity in the network (see Ji and Geroliminis, 2012; Saeedmanesh and Geroliminis, 2016, 2017 for discussion) that we have not addressed so far as it would add unnecessary complexity to the proposed vector-based approach. Thus, future research can also explore how the issue of traffic homogeneity in the network can be described with the presented vector-based approach.
In closing, the proposed vector-based approach is general and flexible and can model a variety of multi-modal networks from the developing to the developed world. Especially for the complex and chaotic traffic in developing countries, the interaction delays captured in Γ, e.g., between tuk-tuks, jaywalking persons, and bicycles, can be learned from data and must not be formulated based on traffic flow models. Consequently, the proposed vector-based approach can still be applied in strategic planning and operations and help those cities to improve their transportation system.
Data Availability Statement
The Appendix for this work is available as Supplementary Material from the publisher. The underlying MATlab code and the data used to estimate the delay models and the MFD are available for non-commercial purposes at ETH Zürich's research collection https://www.research-collection.ethz.ch/handle/20.500.11850/479896. The code for the vector-based approach as well as the collected data used for calibration is available at https://www.research-collection.ethz.ch/ under the corresponding author's profile.
Author Contributions
Methodological idea and initial research design by AL. Bicycle delay model by AL, HB, and KA. Bus delay model by AL and MM. AL, HB, MW, and VK conceived the bicycle data collection and model analysis. AE and MO organized the data collection. LB developed the mathematical program. AL, MM, and KA wrote the manuscript. All authors contributed to the article and approved the submitted version.
Funding
AL was supported by the ETH Research Grant ETH-04 15-1. MM acknowledges the support of the NYUAD Center for Interacting Urban Networks (CITIES), funded by Tamkeen under the NYUAD Research Institute Award CG001 and by the Swiss Re Institute under the Quantum Cities™ initiative. VK was supported by the ALLEGRO project, which was financed by the European Research Council (Grant no. 669792) and the Amsterdam Institute for Advanced Metropolitan Solutions.
Conflict of Interest
The authors declare that the research was conducted in the absence of any commercial or financial relationships that could be construed as a potential conflict of interest.
Acknowledgments
The authors wish to thank Dragana Stojanovic, Alessio Walter, and Tim Wettstein for their assistance in data preparation. They also wish to thank Felix Becker for his statistical advice.
Supplementary Material
The Supplementary Material for this article can be found online at: https://www.frontiersin.org/articles/10.3389/ffutr.2021.665006/full#supplementary-material
Footnotes
1. ^In this paper, we use transport mode and vehicle class as synonymous. Moreover, we subsume under the term “vehicle” all modes although some modes might not be motorized or using a vehicle.
References
Ambühl, L., Loder, A., Bliemer, M. C., Menendez, M., and Axhausen, K. W. (2020). A functional form with a physical meaning for the macroscopic fundamental diagram. Transport. Res. B Methodol. 137, 119–132. doi: 10.1016/j.trb.2018.10.013
Ambühl, L., Loder, A., Menendez, M., and Axhausen, K. W. (2017). “Empirical macroscopic fundamental diagrams: new insights from loop detector and floating car data,” in 96th Annual Meeting of the Transportation Research Board (Washington, DC).
Ardekani, S., and Herman, R. (1982). Quality of Traffic Service. Technical Report 2, Center for Transportation Research, The University of Texas at Austin.
Ardekani, S. A., and Herman, R. (1985). A comparison of the quality of traffic service in downtown networks of various cities around the world. Traffic Eng. Control 26, 574–581.
Ardekani, S. A., Williams, J. C., and Bhat, S. (1992). Influence of urban network features on quality of traffic service. Transport. Res. Rec. 1358, 6–12.
Barmpounakis, E., and Geroliminis, N. (2020). On the new era of urban traffic monitoring with massive drone data: The pNEUMA large-scale field experiment. Transport. Res. C Emerg. Technol. 111, 50–71. doi: 10.1016/j.trc.2019.11.023
Bliemer, M. C. (2001). Analytical dynamic traffic assignment with interacting user-classes (Ph.D. thesis), TU Delft, Delft, Netherlands.
Bock, J., Krajewski, R., Moers, T., Runde, S., Vater, L., and Eckstein, L. (2020). “The ind dataset: a drone dataset of naturalistic road user trajectories at German intersections,” in 2020 IEEE Intelligent Vehicles Symposium (IV) (Las Vegas, NV), 1929–1934. doi: 10.1109/IV47402.2020.9304839
Castrillon, F., and Laval, J. (2018). Impact of buses on the macroscopic fundamental diagram of homogeneous arterial corridors. Transport. B Transport Dyn. 6, 286–301. doi: 10.1080/21680566.2017.1314203
Daganzo, C. F. (2007). Urban gridlock: macroscopic modeling and mitigation approaches. Transport. Res. B Methodol. 41, 49–62. doi: 10.1016/j.trb.2006.03.001
Daganzo, C. F. (2010). Structure of competitive transit networks. Transport. Res. B Methodol. 44, 434–446. doi: 10.1016/j.trb.2009.11.001
Daganzo, C. F., Gayah, V. V., and Gonzales, E. J. (2011). Macroscopic relations of urban traffic variables: bifurcations, multivaluedness and instability. Transport. Res. B Methodol. 45, 278–288. doi: 10.1016/j.trb.2010.06.006
Daganzo, C. F., and Geroliminis, N. (2008). An analytical approximation for the macroscopic fundamental diagram of urban traffic. Transport. Res. B Methodol. 42, 771–781. doi: 10.1016/j.trb.2008.06.008
Daganzo, C. F., and Knoop, V. L. (2016). Traffic flow on pedestrianized streets. Transport. Res. B Methodol. 86, 211–222. doi: 10.1016/j.trb.2015.12.017
Daganzo, C. F., Lehe, L. J., and Argote-Cabanero, J. (2018). Adaptive offsets for signalized streets. Transport. Res. B Methodol. 117, 926–934. doi: 10.1016/j.trb.2017.08.011
Dakic, I., Ambühl, L., Schümperlin, O., and Menendez, M. (2020). On the modeling of passenger mobility for stochastic bi-modal urban corridors. Transport. Res. C Emerg. Technol. 113, 146–163. doi: 10.1016/j.trc.2019.05.018
Dakic, I., and Menendez, M. (2018). On the use of Lagrangian observations from public transport and probe vehicles to estimate car space-mean speeds in bi-modal urban networks. Transport. Res. C Emerg. Technol. 91, 317–334. doi: 10.1016/j.trc.2018.04.004
Dantsuji, T., Fukuda, D., and Zheng, N. (2017). “A macroscopic approach for optimizing road space allocation of bus lanes in multimodal urban networks through simulation analysis: an application to the Tokyo CBD network,” in IEEE Conference on Intelligent Transportation Systems (ITSC) (Yokohama). doi: 10.1109/ITSC.2017.8317936
Dixit, V. V. (2013). Behavioural foundations of two-fluid model for urban traffic. Transport. Res. C Emerg. Technol. 35, 115–126. doi: 10.1016/j.trc.2013.06.009
Gayah, V. V., and Daganzo, C. F. (2011). Clockwise hysteresis loops in the macroscopic fundamental diagram: an effect of network instability. Transport. Res. B Methodol. 45, 643–655. doi: 10.1016/j.trb.2010.11.006
Geroliminis, N., and Daganzo, C. F. (2008). Existence of urban-scale macroscopic fundamental diagrams: some experimental findings. Transport. Res. B Methodol. 42, 759–770. doi: 10.1016/j.trb.2008.02.002
Geroliminis, N., and Sun, J. (2011). Properties of a well-defined macroscopic fundamental diagram for urban traffic. Transport. Res. B Methodol. 45, 605–617. doi: 10.1016/j.trb.2010.11.004
Geroliminis, N., Zheng, N., and Ampountolas, K. (2014). A three-dimensional macroscopic fundamental diagram for mixed bi-modal urban networks. Transport. Res. C Emerg. Technol. 42, 168–181. doi: 10.1016/j.trc.2014.03.004
Herman, R., and Prigogine, I. (1979). A two-fluid approach to town traffic. Science 204, 148–151. doi: 10.1126/science.204.4389.148
Hoogendoorn, S. P., Daamen, W., Knoop, V. L., Steenbakkers, J., and Sarvi, M. (2018). Macroscopic fundamental diagram for pedestrian networks: theory and applications. Transport. Res. C Emerg. Technol. 94, 172–184. doi: 10.1016/j.trc.2017.09.003
Ji, Y., and Geroliminis, N. (2012). On the spatial partitioning of urban transportation networks. Transport. Res. B Methodol. 46, 1639–1656. doi: 10.1016/j.trb.2012.08.005
Loder, A., Ambühl, L., Menendez, M., and Axhausen, K. W. (2017). Empirics of multi-modal traffic networks–using the 3D macroscopic fundamental diagram. Transport. Res. C Emerg. Technol. 82, 88–101. doi: 10.1016/j.trc.2017.06.009
Loder, A., Ambühl, L., Menendez, M., and Axhausen, K. W. (2019a). Understanding traffic capacity of urban networks. Sci. Rep. 9:16283. doi: 10.1038/s41598-019-51539-5
Loder, A., Dakic, I., Bressan, L., Ambühl, L., Bliemer, M. C., Menendez, M., et al. (2019b). Capturing network properties with a functional form for the three-dimensional macroscopic fundamental diagram. Transport. Res. B Methodol. 129, 1–19. doi: 10.1016/j.trb.2019.09.004
Mahmassani, H. S., Saberi, M., and Zockaie, A. (2013). Urban network gridlock: theory, characteristics, and dynamics. Transport. Res. C Emerg. Technol. 36, 480–497. doi: 10.1016/j.trc.2013.07.002
Mariotte, G., Leclercq, L., and Laval, J. A. (2017). Macroscopic urban dynamics: analytical and numerical comparisons of existing models. Transport. Res. B Methodol. 101, 245–267. doi: 10.1016/j.trb.2017.04.002
Mazloumian, A., Geroliminis, N., and Helbing, D. (2010). The spatial variability of vehicle densities as determinant of urban network capacity. Philos. Trans. R. Soc. A Math. Phys. Eng. Sci. 368, 4627–4647. doi: 10.1098/rsta.2010.0099
Muhlich, N., Gayah, V. V., and Menendez, M. (2015). An examination of MFD hysteresis patterns for hierarchical urban street networks using micro-simulation. Transport. Res. Rec. 2491, 117–126. doi: 10.3141/2491-13
Roca-Riu, M., Menendez, M., Dakic, I., Buehler, S., and Ortigosa, J. (2020). Urban space consumption of cars and buses: an analytical approach. Transport. B 8, 237–263. doi: 10.1080/21680566.2020.1749726
Saeedmanesh, M., and Geroliminis, N. (2016). Clustering of heterogeneous networks with directional flows based on “Snake” similarities. Transport. Res. B Methodol. 91, 250–269. doi: 10.1016/j.trb.2016.05.008
Saeedmanesh, M., and Geroliminis, N. (2017). Dynamic clustering and propagation of congestion in heterogeneously congested urban traffic networks. Transport. Res. B Methodol. 105, 193–211. doi: 10.1016/j.trb.2017.08.021
Tilg, G., Ul Abedin, Z., Amini, S., and Busch, F. (2020). Simulation-based design of urban bi-modal transport systems. Front. Future Transport. 1:581622. doi: 10.3389/ffutr.2020.581622
Wierbos, M. J., Knoop, V. L., Hänseler, F. S., and Hoogendoorn, S. P. (2020). A macroscopic flow model for mixed bicycle–car traffic. Transport. A Transport Sci. 17, 340–355. doi: 10.1080/23249935.2019.1708512
Yuan, K., Knoop, V. L., and Hoogendoorn, S. P. (2019). Multi-class traffic flow on a partially space-shared road. Transport. B 7, 1505–1520. doi: 10.1080/21680566.2019.1630689
Keywords: macroscopic fundamental diagram, two-fluid theory, multi-modal, bicycle, bus
Citation: Loder A, Bressan L, Wierbos MJ, Becker H, Emmonds A, Obee M, Knoop VL, Menendez M and Axhausen KW (2021) How Many Cars in the City Are Too Many? Towards Finding the Optimal Modal Split for a Multi-Modal Urban Road Network. Front. Future Transp. 2:665006. doi: 10.3389/ffutr.2021.665006
Received: 06 February 2021; Accepted: 24 March 2021;
Published: 07 May 2021.
Edited by:
Mehdi Keyvan-Ekbatani, University of Canterbury, New ZealandReviewed by:
Andy H. F. Chow, City University of Hong Kong, Hong KongMeead Saberi, University of New South Wales, Australia
Copyright © 2021 Loder, Bressan, Wierbos, Becker, Emmonds, Obee, Knoop, Menendez and Axhausen. This is an open-access article distributed under the terms of the Creative Commons Attribution License (CC BY). The use, distribution or reproduction in other forums is permitted, provided the original author(s) and the copyright owner(s) are credited and that the original publication in this journal is cited, in accordance with accepted academic practice. No use, distribution or reproduction is permitted which does not comply with these terms.
*Correspondence: Allister Loder, YWxsaXN0ZXIubG9kZXJAdHVtLmRl