 Sherrilene Classen
 James Wersal
 Justin Mason
 Jason Rogers
 Virginia Sisiopiku
94% of researchers rate our articles as excellent or good
Learn more about the work of our research integrity team to safeguard the quality of each article we publish.
Find out more
ORIGINAL RESEARCH article
Front. Future Transp. , 15 December 2020
Sec. Connected Mobility and Automation
Volume 1 - 2020 | https://doi.org/10.3389/ffutr.2020.596620
Introduction: Automated vehicle use is rapidly expanding globally. Florida is one of the leading states for researching, testing, implementing, and operating automated vehicles. Although driving simulators may create an opportunity to assess user behaviors related to automated vehicles, their use in this context is not well-documented.
Objectives: This study examined face and content validity of an on-road automated shuttle route and its congruence to a driving simulator scenario representing the on-road route.
Methodology: Face validity (i.e., clarity, understandability, congruence) was examined directly by members of the Institute for Mobility, Activity, and Participation. Content validity was assessed via a content validity index (CVI) based on inputs from experts who represented a variety of disciplines. These included computer and information science, engineering, transportation engineering, rehabilitation science, industrial and systems engineering, experimental psychology, and driver rehabilitation science.
Findings: Face validity resulted in feedback pertaining to traffic, environment, hazards, fidelity, and “other” recommendations. Six of the recommendations were used to enhance the simulator scenario. For content validity, the CVI scale was equal to 0.83 and was above the acceptable threshold of 0.80. However, on the item level, two items, i.e., traffic flow (I-CVI = 0.57) and seat direction (I-CVI = 0.67), were rated lower than anticipated. The ratings resulted in implementing enhancements to the driving simulator scenario.
Conclusion: Automated vehicle on-road routes can be replicated in a driving simulator scenario but require a process of examining the face and content validity and refining the developed scenario as needed to ensure reasonable accuracy.
Automated vehicles (AVs), a rapidly growing technology in transportation, hold promise to enhance traffic safety, reduce traffic congestion, and provide new mobility options (Department of Transportation and National Highway Safety Traffic Administration, 2016a; Society of Automotive Engineers International, 2018). Specifically, older drivers may benefit from the use of AVs to overcome current mobility and accessibility barriers. Current AV-related opportunities include access to automated public transportation with fixed routes and schedules, automated on-demand public transportation, fleet-based shared AVs, and privately owned AVs (Faber and van Lierop, 2020).
Simulators are often used to assess driving performance or to test interventions in a much safer (than on-road) yet realistic environment (Campos et al., 2017). Driving simulators are also frequently used to expose research participants to vehicle automation (Kauffmann et al., 2018). However, what is unclear is ensuring that there is close environmental representation between the simulator scenarios and the on-road route. Such congruence is critical if user acceptance and adoption practices are to be examined.
Environment, as a construct, needs to be understood in greater detail than just its geographical aspects. For example, environment may include a physical (e.g., road, vehicle, weather, etc.), social (e.g., interaction with other passengers), temporal (e.g., past exposures to different environments influencing experiences in current environments), and virtual (e.g., scenarios in a driving simulator) dimensions (Baum et al., 2015). Potential barriers and facilitators appearing in these dimensions may influence users' perceptions and, as such, must be examined in more detail if user acceptance and adoption practices are to be understood. Ultimately, such understanding will help to reveal if experience in a driving simulator, i.e., a drive in a virtual environment, can be an adequate and valid representation of a similar experience in an automated shuttle (AS) driving in real-world conditions (Classen et al., 2020). Specifically, environmental factors may affect engagement in the actual task of interacting with the AV in either virtual mode or on the road. Moreover, if an automated simulator is used, which is a representation of reality and not reality itself, careful examination is necessary before real-world inferences can be made about adoption practices. Thus, congruence comparisons between the on-road components of an AS and an automated simulator are inevitable if a driving simulator is to be used as a substitute for the on-road AV shuttle experience (Araújo et al., 2007).
There are different forms of validity, such as face and content, construct (e.g., convergent and discriminant), criterion (e.g., concurrent and predictive), and ecological validity. Face and content validity are means to judge and quantify a measurement that appears to be acceptable in what it aims to assess according to laypeople (face validity) and content experts (content validity; Streiner et al., 2015, p. 8). Construct validity is defined as the degree to which a measurement measures what it intends to measure (e.g., construct of interest) and is supported over time in comparison to related or unrelated measurements using similar (convergent) or opposing (divergent) constructs (Streiner et al., 2015, p. 235–240). Criterion validity is the relationship between the measurement of interest to another well-established measure that uses the same criterion variable, which can be performed at the same time (concurrent) or in the future (predictive; Streiner et al., 2015, p. 233). Finally, ecological validity addresses the context of the environment concerning the measurement (Streiner et al., 2015, p. 329). As such, we have used face and content validity as a starting point to embark upon the continuum of examining and establishing validity.
Face validity improves clarity, understandability, and congruence while minimizing dissatisfaction among individuals who may use the measurement (Streiner et al., 2015, p. 79). According to Lynn (1986), content validity is a two-stage process. The first stage addresses development of an instrument being used to measure a content domain of interest (e.g., a survey to examine the physical characteristics of a suburban environment and how that corresponds to the actual developed simulation scenario). The second stage judges and quantifies the measurement with the use of the content experts' ratings of the actual content of interest. Lynn identifies the need to have at least five expert raters to control for chance occurring in the agreement among raters. However, Lynn reports that this is not always plausible in certain content domains and suggests that as few as three expert reviewers can be used to perform the ratings. To our knowledge and from the studies reviewed, little is known about the influence of environmental components on users' perceptions in an AS and a driving simulator running in automated mode. Automated simulator research reveals that environmental components, such as weather or scenario design, can influence users' perceptions of the experience (Payre et al., 2016; Koglbauer et al., 2018). Therefore, empirical examination of environmental components may reveal a greater understanding of users' perceptions and, eventually, of how these factors influence adoption practices of AVs (Schoettle and Sivak, 2014b).
As part of a larger study testing older adults' perception of AV acceptance and adoption practices (Classen et al., 2020), this study examines face validity and quantifies content validity of a driving simulator scenario (Level 4; Society of Automotive Engineers International, 2018) and the on-road route of an AV shuttle (Level 4; Society of Automotive Engineers International, 2018). The rationale for this study derives from a few fronts. First, AV technology is receiving increased interest among researchers, localities, industry, and the public. As such, there is an increased need to understand how the environment influences consumer engagement. Second, literature is emerging to indicate that researchers are examining users' experiences or perceptions as they interact with the automated simulator as an adjunctive mode to ASs. However, a paucity exists in the literature to (a) clearly identify environmental variables, (b) document their potential impact on user experience, and (c) quantify the congruence among a simulator scenario designed for a driving simulator running in automated mode vs. an on-road route used by an AS.
Therefore, the objective of this study was 2-fold: (a) assess the face validity of an AV on-road route with a corresponding AV simulator scenario route and (b) quantify the congruence between the simulator scenario route and the on-road route. Our assumption is that greater congruence between the characteristics of the two routes will also lead to increased congruence in user perception and, as such, that the simulator may be used as a substitute or adjunctive mode for AV adoption and acceptance studies.
The University of Florida's institutional review board approved the study as exempt (IRB201902699). This study is a subsection of the parent study that investigated drivers' perceptions of AV technology when exposed to an AS and an automated driving simulator. This current study uses classical test theory techniques to examine the face and content validity of a simulator scenario that replicates the on-road route for an AS.
The face validation was performed via obtaining feedback from seven participants affiliated with the University of Florida's Institute for Mobility, Activity, and Participation. These participants included four Ph.D.-level doctoral students as well as three research faculty members.
The content validation was performed via inviting feedback from seven national experts who represented the fields of computer and information science and engineering, transportation engineering, rehabilitation science, industrial and systems engineering, experimental psychology and transportation, transportation research and development, and driver rehabilitation science.
The Realtime Technologies Inc. (RTI; Royal Oak, MI) RDS-2000 driving simulator is used in this study (see Figure 1). It is a high-fidelity and multisensory simulator configured on a computerized platform that is customizable and scalable. The driving simulator is an immersive full-car cab with seven visual channels, which provide high-fidelity graphic resolution of a realistic driving environment. Three of the visual channels are located in front of the vehicle providing a 180° field of view; one channel is in the rear of the vehicle (visible using the rear-view mirror), two are built into the side mirrors, and the remaining one is the virtual dash, which displays the instrument cluster. In addition, the driving simulator provides component modeling; steering feedback; spatialized audio with realistic engine, transmission, wind, and tire noises; and an automated driving system (Society of Automotive Engineers International, 2018, p. 3, 5, 29) feature to turn the simulator into AV mode. The visual display operates at a 60-Hz refresh rate to support smooth graphics projected onto three flat screens with high-intensity projectors. An operator station situated at the rear of the vehicle overlooks the driver, vehicle, and screens and allows the operator to control and monitor all aspects of the experiment.
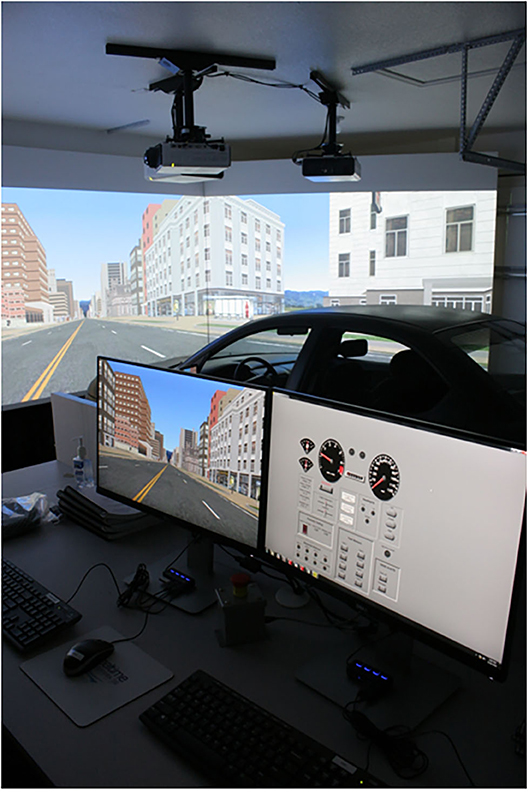
Figure 1. RTI high fidelity simulator.
The study uses a Transdev's EasyMile EZ10 AS (Level 4, Society of Automotive Engineers International, 2018) that can transport up to 12 passengers (see Figure 2). The AS is fully electric and embeds automated driving capabilities to be integrated in an automated road transport system for public transportation—in private areas or cities at a speed reaching 28 mph. Participants ride in this AS in a low-speed (≤15 mph) environment (see Route Description). A Transdev engineer developed the mission file, which specifies the desired goal points as the system autonomously generates a route and then executes the path. The AS uses Lidar, cameras, and GPS to survey the environment and continually decides upon the best motion behavior. The EZ10 can operate in two driving modes: (1) the automated mode in which the vehicle is self-driven and follows its programs and missions and (2) the manual mode, in which an operator drives the EZ10 manually with a remote control. The operator may shift the shuttle into manual mode if unplanned hazards (i.e., roadblock, construction, etc.) arise. Additionally, the operator is onboard to aid passengers that require mobility assistance, inspect and provide vehicle maintenance, and control the shuttle's climate.
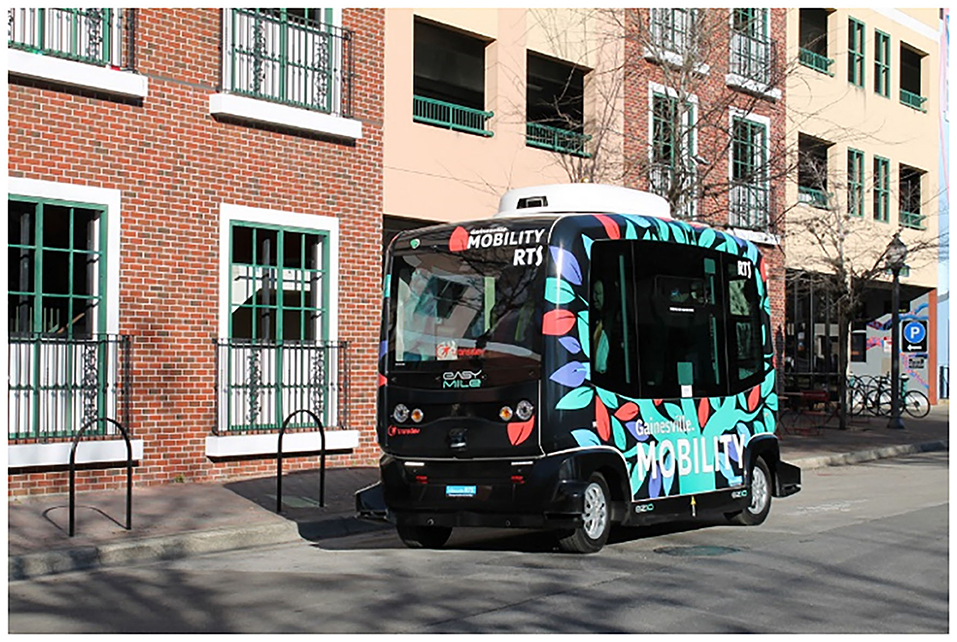
Figure 2. Gainesville automated shuttle.
This study utilized two routes. The first was traveled by the AS on-road. “On-road” refers to publicly accessible roadways (including parking areas and private locations that permit public access) that serve a mix of users of vehicles of all classes and driving automation levels (including no driving automation) as well as motorcyclists, cyclists, and pedestrians (Society of Automotive Engineers International, 2018). The second was a scenario built for the automated driving simulator based on the features and characteristics of the road course.
Route description (see Figure 3). The AS starts in the downtown parking garage (220 SE 2nd Ave., Gainesville, FL), exits the parking garage, and travels south on 2nd Ave. It turns right on SW 2nd Ave. and continues to the roundabout at 10th St., where it loops around and returns to the parking garage. This environment poses ambient traffic and may include interactions with pedestrians, cyclists, and other road users. For visual representation of the route see Figure 3. The route includes 7 crosswalks, 4 primary intersections (2 merge yields, 1 yielded left turn, and 1 stop), and 15 streets that intersect the route. Participants are expected to ride in the AS for 10 min at a low speed (≤15 mph).
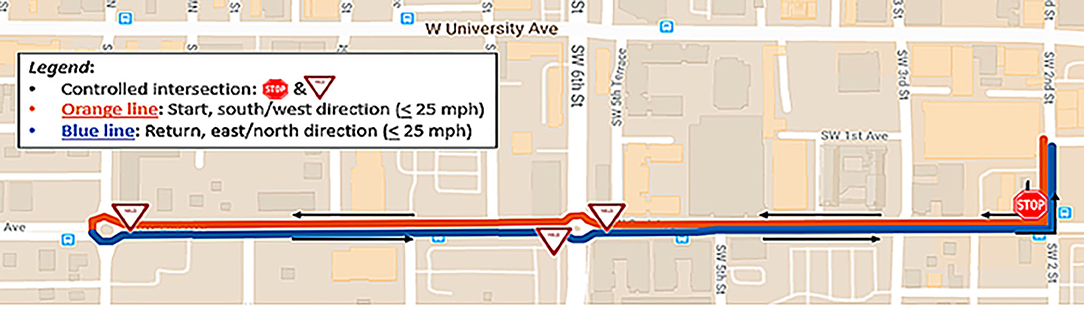
Figure 3. Road course for the automated shuttle in downtown Gainesville FL.
The computer science engineer on this research team developed a simulator scenario for the RTI driving simulator, driving in level 4 automated mode to represent the on-road route described. The simulated drive includes a combination of ambient and scripted traffic that interacts realistically with other road users based on human behavior/decision models and real-time, physics-based vehicle dynamics calculations. The simulator scenario for this study utilizes the automated driving systems for a 10-min automated drive, built to replicate the AS on-road experience described in Route description above. To build the scenario, the team consulted with the traffic operations manager, mobility manager, and the AS engineers and operators of TransDev; utilized Google maps to preview the projected route; recorded a video of the on-road route outside of peak traffic hours (8–6 pm), and performed an environmental analysis of the media to log the characteristics of the environment (e.g., road signs, road features, ambient traffic, buildings, glare from the sun, etc.). Next, an incremental procedure was used to lay out the roadway network, place static objects, apply custom texture-mapping to enhance congruency, script dynamic events, and adjust parameters to achieve the final scenario, which represented the on-road route and included low-to-moderate speed (15–30 mph) in the city area with realistic road infrastructure, buildings, and ambient traffic. The simulator system was capable of handling all aspects of the dynamic driving task (DDT; Society of Automotive Engineers International, 2018, p. 6) as per the level 4 SAE guidelines. The video of the simulator scenario can be viewed from https://www.youtube.com/watch?v=kDObiycJUxA&feature=youtu.be.
Nevo (1985) discusses three types of raters that may assist with assessing face validity (e.g., those who are intended to use the measurement, non-professionals who work with measurement, or the general public). As such, the authors followed standard procedures and used individuals who work with the measurement, seeking consensus among the raters on the measurement to improve clarity, understandability, and congruence. Face validity, a measure of whether an event truly represents what it intends to represent (Shah et al., 2018), was conducted via a PowerPoint presentation to seven members of the Institute for Mobility, Activity, and Participation as previously described (see Participants). The characteristics of the AS's on-road route and simulator scenario were presented using Microsoft PowerPoint® and video clips of both routes. The members were instructed that the recording of the simulator scenario was not intended to be an absolute replica of the on-road route, but rather a realistic representation of the on-road route. A list of the 10 incongruences between the on-road route and the simulator scenario were also presented to the group members (see Table 1).
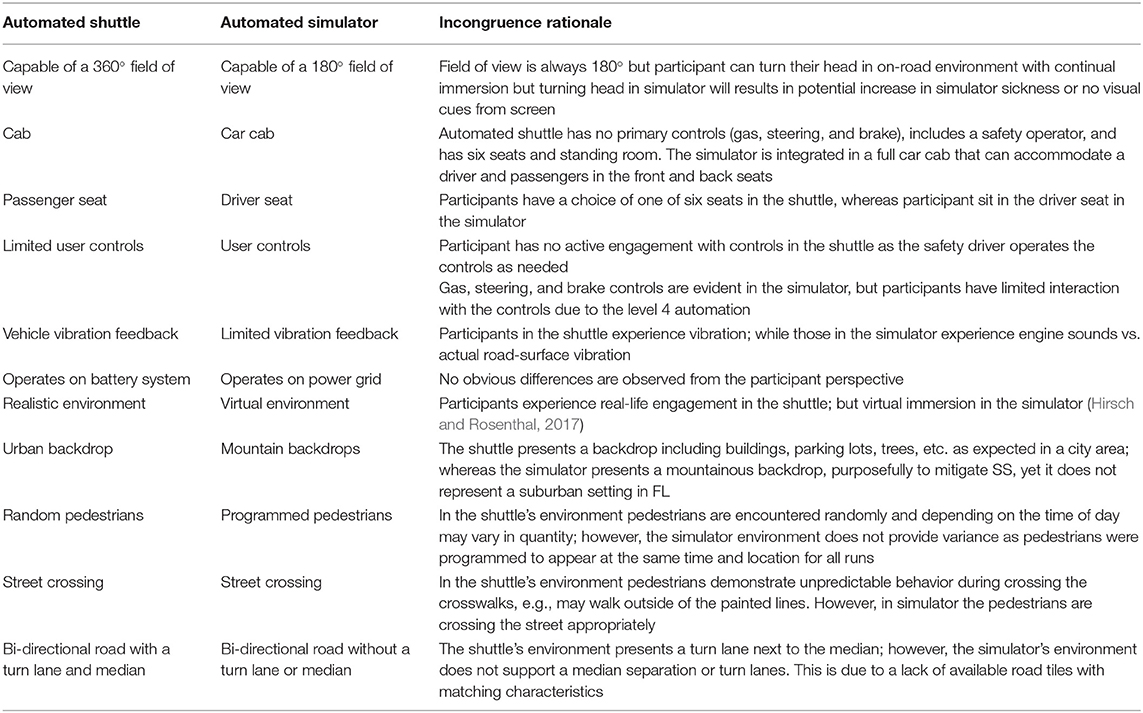
Table 1. Description of the difference between the environment design features for the automated shuttle vs. the driving simulator.
An independent facilitator encouraged discussion among the group members and solicited feedback. A guide was used to solicit input on the congruence of traffic conditions (e.g., number of vehicles on the road, intersections, crosswalk, or signage), aspects of the physical environment (e.g., suburbia, parking lots, building styles, vehicle type or presence), hazards (e.g., pedestrian crossing abruptly, car pulling out, work zone), physical and emotional fidelity (Hirsch and Rosenthal, 2017; i.e., believability of the scenario); and suggested modifications (i.e., recommendations to improve the scenario). The solicited feedback was documented, discussed with the computer science engineer, and used for further refinement of the simulator scenario. The refined version of the simulator scenario was discussed in team format for further input, prior to acceptance by the research team.
The authors used purposeful sampling, also known as purposive sampling, with seven national experts. Purposeful sampling is a valid method according to Maxwell (2012) for investigating and establishing (or not) the content validity of a measure. The team solicited feedback to examine the congruence and content validity of the routes, i.e., the characteristics of the simulator scenario as a believable representation of the on-road route (Lawshe, 1975; Lynn, 1986; Grant and Davis, 1997). The standard procedures outlined by Lynn (1986) were used to assess item-content validity index scores, and procedures from Polit and Beck (2006) were used to assess scale-content validity index scores. Lynn identifies that a 3-, 4-, or 5-point scale is an acceptable format for assessing the content validity index. To facilitate the process, the team developed a 17-item content validity survey on a 3-point Likert scale (1 = mildly alike, 2 = moderately alike, and 3 = mostly alike) using the Qualtrics platform. Each of the survey items compared the on-road route to the simulator scenario and provided a “congruence” strategy or a rationale for the item featured in the on-road route and the simulator scenario. For example, for item #16 “Environmental signage: Number of yields and stops,” the congruence strategy was “Programmed in the simulator scenario to be exactly the same as the on-road route.” Based on this information, the content experts rated each item and provided comments to support their rating. Each content expert received an e-mail outlining the instructions for participation, access to the content validity survey, and a PowerPoint presentation with video footage on the characteristics of the on-road route and the simulator scenario route. The content experts completed the survey and provided narrative feedback as they deemed appropriate. Data were collated and exported to Microsoft Excel®. The team sought a high level of agreement among the content experts as indicated by an item content validity index of >0.86 (Lynn, 1986) and scale content validity index of >0.80 (Polit and Beck, 2006).
Notes taken during the facilitated face validity discussion were analyzed via content and thematic analysis (Ravitch and Carl, 2016, p. 216–219, 244). Through this process, major themes were identified pertaining to environmental (in)congruence between the on-road route and the simulator scenario route. Through team discussions, the coded findings were displayed. Limitations of the simulator graphic software indicate that some incongruences (e.g., changing the size of the roundabout) could not be managed. Likewise, improving graphical detail (e.g., higher resolution and texture maps) to be more realistic would cause video rendering issues. As such, the team had to consider trade-offs for optimum congruence and reasonable expectations given the simulator software. Through an iterative team process and consensus (Cho and Trent, 2006), recommendations were made for refining the simulated scenario route.
The content experts' ratings were analyzed at both the item level of the content validity index (I-CVI) and the scale level (S-CVI). The I-CVI score reflected the proportion of the seven raters who scored an item as congruent (i.e., 3 = mostly alike). Acceptable I-CVI levels are calculated as a proportion of rater scores that are likely to be between 0.80 and 1.00 (Polit and Beck, 2006). For example, a score of 0.86 signifies that six out of the seven content experts rated the items as mostly alike, whereas a score of 0.71 or below indicates that five or fewer content experts rated the item as mostly alike. The S-CVI is the percentage of I-CVI that were acceptable, utilizing the >0.86 criterion (Polit and Beck, 2006).
The analysis yielded five themes with comments related to traffic conditions (five comments), environmental conditions (seven comments), hazards (three comments), physical and emotional fidelity (two comments), and “other” recommendations (four comments). Moreover, the group members commented on congruence (six comments) as well as incongruence (15 comments) and made valuable suggestions for improvements (15 comments) as well as “other recommendations” pertaining to these themes as summarized in Table 2.
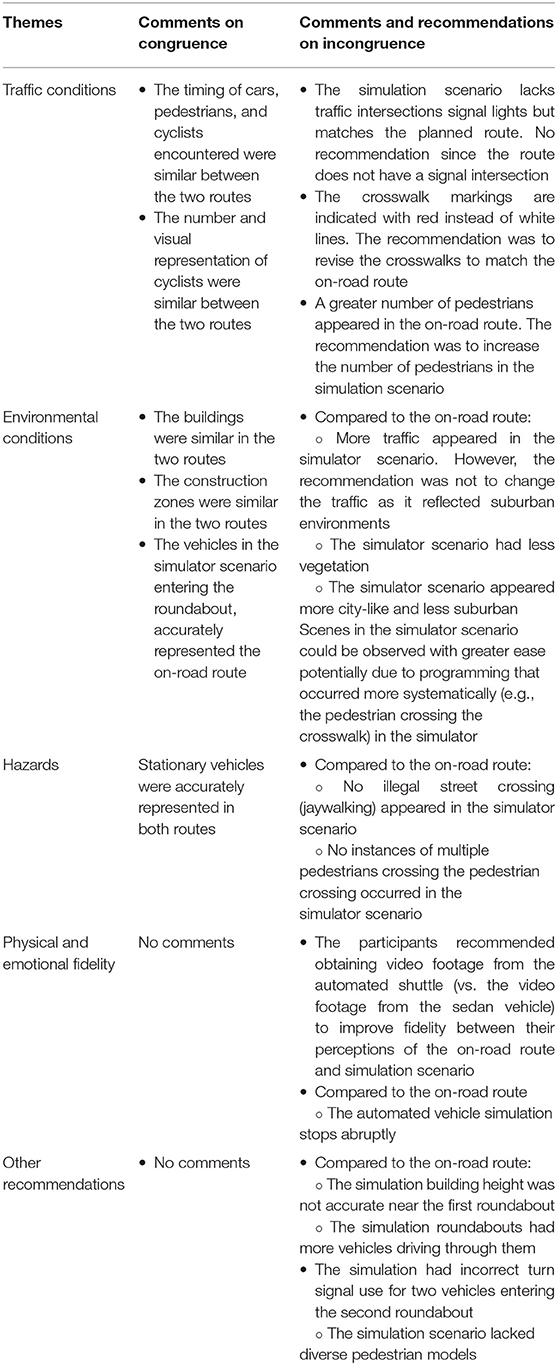
Table 2. Content and thematic analysis to determine face validity between the simulator scenario route and the on-road route.
In summary, group members' recommendations included modifying the quantity and variety of pedestrians and vehicles, addressing pedestrian and vehicle model behaviors (e.g., turn signals, jaywalking, etc.), improving pedestrian crosswalk design and signage, and adjusting the height of buildings and vegetation within the environment. In response to this input, the following six recommendations were implemented to refine the simulator scenario and improve congruence between the on-road route and the simulator scenario:
1. Diversified the type of crosswalks and added pedestrian crossing warning signs before each crosswalk.
2. Added more foliage to the simulation scenario to better separate the residential and suburban parts of the environment.
3. Adjusted the height of an apartment building to be more congruent with the environment view from the on-road route.
4. Changed the turn signals for two vehicles entering the second roundabout to represent appropriately the direction of travel.
5. Diversified the type (i.e., age, gender, and race) of pedestrians and added more pedestrians to the simulator scenario.
6. Added a pedestrian who was jaywalking.
The recommendation pertaining to having fewer vehicles in the roundabout of the simulator scenario was not addressed as the item adequately represented the traffic variability that may have occurred at various time points in the suburban environment.
The content experts rated the 17 items on the survey and provided qualitative feedback. The results indicate that there was a need for only one round of expert reviews (see Table 3) as the S-CVI indicated a score of 0.828, which was above the threshold of 0.80 (Polit and Beck, 2006). However, on the item level, the traffic flow (I-CVI = 0.571) and seat direction (I-CVI = 0.667) items were rated lower than anticipated. Experts rated the traffic flow question lower due to how the automated simulator stopped (e.g., braking abruptly) and because the pedestrians, for example, did not have smooth actions as they were crossing the road. The low rating for seat direction was due to the fact that the AS was moving bidirectionally and had seats that face toward the center of the AS although the driving simulation scenario proceeded unidirectionally with seats facing only forward toward the path of travel.
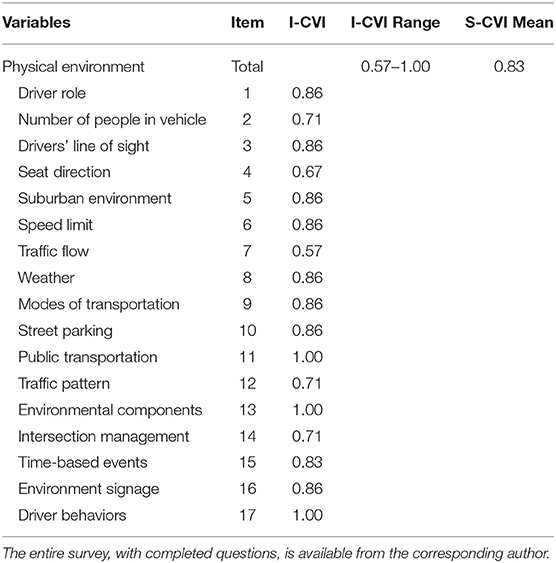
Table 3. Item Content Validity Index (I-CVI) and Scale Content Validity Index (S-CVI) Scores.
The three other items that represented a CVI score below 0.71, i.e., traffic patterns, intersection management, and number of people in the vehicle, were discussed to examine how the raters' recommendations can be implemented. First, reviewers recommended correcting the improper turn signals for the vehicles entering the roundabout. Second, reviewers discussed the size difference between roundabouts and the lack of a median with vegetation. Third, recommendations regarding seat direction were discussed in the question pertaining to number of people in the vehicle, which was previously covered in the seat direction item.
The qualitative feedback provided by the content experts addressed aspects of the driving simulator and the simulator scenarios as follows. First, two content experts identified a need to modify the quantity and variety of pedestrians and vehicles to be more representative of those appearing in the on-road route. Second, two content experts suggested making the roundabout smaller to be more representative of the on-road route. Next, three content experts suggested more realistically addressing user behaviors. For example, the experts suggested considering jaywalking or failure to use a turn signal when turning to be consistent with the on-road pedestrian and vehicle behaviors. In terms of the external environment, three content experts suggested improving the height of buildings and increasing the density and variety of vegetation within the simulated environment for greater consistency with the on-road route. Finally, two content experts noted that the AS followed a bidirectional route, whereas the simulator traveled on a unidirectional route. These experts recommended changing the route of the AS to indicate a unidirectional route, a recommendation that was not implemented due to limitations in the design. Additionally, two content experts noted the effect of sun glare that was not captured in the recording of the on-road route. Although an important observation, the effects of glare are mitigated in the shuttle via tinted windows. Last, another content expert observed visual distortions at the horizon while objects in the simulation appeared or disappeared as well as the lack of shadows and the need to improve the resolution of the graphics. As such, the qualitative feedback of the content experts was used to improve the congruence between the on-road route and the simulator scenario.
The purpose of this study was to assess the face and content validity of an AS on-road route and an automated simulation scenario.
Consistent with recommendations from the literature (Hardesty and Bearden, 2004), we included seven members to provide feedback on the face validity of the on-road route and the driving simulation scenario. A benefit was that the team members were affiliated with the driving institute where the study occurred and, as such, had content knowledge related to the actual scenario design and development. On the other hand, such a priori knowledge could have biased the members in their feedback. For example, no member discussed the mountain range (see Table 1) in the background of the simulator scenario. Most likely the team members were familiar with driving simulator technology, understood that this was a simulator design issue and a favorable mitigation strategy for simulator sickness reduction (Stern et al., 2017). Particularly, a backdrop against a foreground mitigates simulator sickness symptoms, such as dizziness, sweatiness, and queasiness (Lin et al., 2002). Nevertheless, the 15 comments from these members guided the refinement of the simulator scenario and promoted congruence between the on-road route and the simulator scenario.
The content experts represented academic, scientific, and/or industry fields appropriate to provide specialized knowledge pertaining to either automated vehicles and/or driving simulation and scenarios. As such, even though some feedback was similar to that presented by the members of the face validity focus group, other feedback was more specialized. For example, content experts specializing in transportation and simulation noted that bidirectional travel on the AS route as well as experiencing glare from the sun may alter the perceptions of the participants if they are not exposed to similar characteristics during the driving simulation scenario. Such specialty knowledge helped educate and inform the team on the potential impact of design features on participants' perspectives.
Overall, the findings of this study suggest that the face and content validity participants identified similar incongruence between the on-road route recording and the automated driving simulation. However, content experts were able to recommend additional content-specific recommendations based on their expertise. For example, one content expert who specializes in simulation noted the horizontal visual distortion that would appear and disappear. These unique expert perspectives provide valuable information that may consciously be missed by a layperson.
The current literature supports the notion that environmental components have implications for the user experience (Schoettle and Sivak, 2014a; Chapin et al., 2016; Eby et al., 2017). Specifically, the virtual environment is an important component in addressing fidelity to real-world context. In the absence of doing so, a challenge exists to capture realistic perceptions and behaviors of users exposed to it (Philips and Morton, 2015). Thus, programmers in collaboration with researchers must decide a priori on key design features to include for optimal programming of pedestrian, vehicle, and environmental features. Only then can the realism between the two modes increase to represent a high level of physical and emotional fidelity (de Winter et al., 2012).
During face and content validation, the participants noted incongruence in pedestrian behaviors, vehicle modeling behaviors, and environmental characteristics between the on-road route and the simulator scenario. Such attention to detail is expected to not only enhance the congruence between the road and the simulator routes, but also increase the user experience when exposed to the on-road route and the driving simulator scenario.
Even though sophistication in simulation scenario planning, development, and design exists, we have also encountered challenges. First, at the onset of the study, we were unable to record the AS road route from inside the shuttle due to federal restrictions (Department of Transportation and National Highway Safety Traffic Administration, 2016b). Therefore, experts viewed a video of the road course that was recorded in a standard vehicle traversing the route of the AS instead. Although it is a suitable alternative, some design features, e.g., tinted windows in the shuttle, were not available in the vehicle used for the recording, and as such, glare was identified as a challenge. Luckily, this was not a barrier or distractor in the actual shuttle due to its tinted window feature. Other limitations pertain to the size of the roundabout, graphical detail, lack of a dedicated turn lane or center median, limited animated models available to use as pedestrians, and the vehicle's direction of travel (e.g., bidirectional in the AS but unidirectional in the automated simulator). The researchers acknowledge that establishing face and content validity is a starting point in psychometric testing. As such, hypothetical bias, which may be present in this initial stage of the study, must be considered as the researchers embark upon further validity testing, which will include convergent and divergent construct validity, concurrent and predictive validity, and ecological validity. The team considered these limitations and the trade-offs for optimum congruence.
The study also features strengths. We collaborated with stakeholders, including the city manager and mobility manager of Gainesville, industry (e.g., Transdev, Inc.), and stakeholders at the University of Florida Transportation Institute for Knowledge Translation. The knowledge generated through this study supports the use of a driving simulator to expose individuals to AV technology. Through the process of examining and establishing face and content validity, valuable information was solicited from the group members and content experts, which enabled the team to improve the congruence of an on-road route and a representative simulator scenario—both necessary for using these modes in further AV acceptance and adoption studies.
We acknowledge that bias (Streiner et al., 2015) may be evident. Such biases include social desirability bias (answering a prompt in what is perceived as an appropriate way; p. 106), deviation bias (inclination to answer a prompt with a different response; p. 111), acquiescence bias (tendency to answer in a positive connotation, p. 115), and end-aversion bias (propensity to answer toward the anticipated norm and avoid uncommon responses; p. 115) to name a few. Although we chose seven experts from a variety of fields, who had no direct involvement with the authors' work, we acknowledge that we could not empirically control for all of the different forms of bias that may exist. However, measurement occurs over a continuous and prolonged period of time, and as such, further psychometric testing with which inferential statistics are used (e.g., to establish construct and criterion validity) will help to build and refine the current level of knowledge. Therefore, no generalizations can be made at this early stage of investigation, and no predictions or modeling can be implemented either. However, in our follow-up work (currently in progress), we will deploy a range of advanced psychometric testing (especially after we have the data of all the participants) and also employ regression models to understand how predictive the two autonomous modes are of actual acceptance and adoption of the AV technology.
Automated vehicle on-road routes can be replicated in a driving simulator scenario. However, to ensure reasonable accuracy and realism, a process of examining the face and content validity is recommended. In this study, inputs from face and content validity evaluators were used to identify deficiencies and to improve the developed driving simulation scenario, accordingly. Our initial research question, i.e., to examine if congruency can be established between the on-road route and the corresponding driving simulator scenario, has been answered in the affirmative. The most accurate approach to establishing congruency between these two modes is by obtaining participants' perspectives and lived experiences, which is also the next phase of this research.
The raw data supporting the conclusions of this article will be made available by the authors, without undue reservation.
The studies involving human participants were reviewed and approved by Univeristy of Florida Institutional Review Board 01. The patients/participants provided their written informed consent to participate in this study.
SC: study conception and design. SC, JR, JW, and JM: develop driving simulation. JW: data collection. SC and JW: analysis and interpretation of results. SC, JW, JM, VS, and JR: draft manuscript preparation. All authors reviewed the results and approved the final version of the manuscript. All authors contributed to the article and approved the submitted version.
This work was sponsored by the United States Department of Transportation Office of the Assistant Secretary for Research and Technology (OST-R) through the Southeastern Transportation Research, Innovation, Development, and Education (STRIDE) Center (Project D2).
The authors declare that the research was conducted in the absence of any commercial or financial relationships that could be construed as a potential conflict of interest.
The authors wish to acknowledge the following: The Institute for Mobility, Activity and Participation, which provided the infrastructure and support for this study; the City of Gainesville, Transdev, and Realtime Technologies for contributing knowledge, expertise, and support with the EasyMile Automated Shuttle, the RTI High Fidelity Simulator, and the planned on-road route; and the seven content experts who provided meaningful ratings and feedback for establishing content validity.
Araújo, D., Davids, K., and Passos, P. (2007). Ecological validity, representative design, and correspondence between experimental task constraints and behavioral setting: comment on Rogers, Kadar, and Costall (2005). Ecol. Psychol. 19, 69–78. doi: 10.1080/10407410709336951
Baum, C. M., Christiansen, C. H., and Bass, J. D. (2015). “The person-environment-occupation-performance (PEOP) model,” in Occupational Therapy: Performance, Participation, and Well-Being, 4th Edn (Thorofare, NJ: SLACK Incorporated), 49–56.
Campos, J. L., Bedard, M., Classen, S., Delparte, J. J., Hebert, D. A., Hyde, N., et al. (2017). Guiding framework for driver assessment using driving simulators. Front. Psychol. 8:1428. doi: 10.3389/fpsyg.2017.01428
Chapin, T. S. L., Crute, J., Crandall, J., Rokyta, A., and Washington, A. (2016). Envisioning Florida's Future: Transportation and Land Use in an Automated Vehicle Automated Vehicle World, Technical Report. Florida State University, Department of Urban & Regional Planning. Available online at: https://fpdl.coss.fsu.edu/sites/g/files/imported/storage/original/application/abfcc477779d0bc0ea825c8011011939.pdf
Cho, J., and Trent, A. (2006). Validity in qualitative research revisited. Qual. Res. 6, 319–340. doi: 10.1177/1468794106065006
Classen, S., Mason, J., Wersal, J., Sisiopiku, V., and Rogers, J. (2020). Older drivers' experience with automated vehicle technology: interim analysis of a demonstration study. Front. Sust. Cities 2:27. doi: 10.3389/frsc.2020.00027
de Winter, J. C. F., van Leeuwen, P. M., and Happee, R. (2012). “Advantages and disadvantages of driving simulators: a discussion,” in Conference Proceedings in Measuring Behavior (Utrecht). 47–50.
Department of Transportation National Highway Safety Traffic Administration. (2016a). “DOT/NHTSA Policy Statement Concerning Automated Vehicles” 2016 Update to “Prelminiary Statement of Policy Concerning Automated Vehicles.” 1–2. (Washington, DC). Available online at: https://www.google.com/url?sa=t&rct=j&q=&esrc=s&source=web&cd=&ved=2ahUKEwjz-P_2sZvtAhUtwlkKHZJqDV0QFjAAegQIAxAC&url=http%3A%2F%2Fwww.aamva.org%2FNHTSADOTAutVehPolicyUpdate_Jan2016&usg=AOvVaw0h2sJwnRmvkN7U_1rWuH2l
Department of Transportation National Highway Safety Traffic Administration. (2016b). Federal Automated Vehicle Policy: Accelerating the Next Revolution in Roadway Safety. Available online at: https://www.transportation.gov/sites/dot.gov/files/docs/AV%20policy%20guidance%20PDF.pdf (accessed June 10, 2020).
Eby, D. W., Molnar, L. J., Zakrajsek, J., Ryan, L., Zanier, N., St Louis, R. M., et al. (2017). Use, Learning and Perceptions of In-vehicle Technologies, and Vehicle Adaptations Among Older Drivers: A LongROAD Study (Research Brief), AAA Foundation for Traffic Safety. (Washington, DC).
Faber, K., and van Lierop, D. (2020). How will older adults use automated vehicles? Assessing the role of AVs in overcoming perceived mobility barriers. Transport. Res. A 133, 353–363. doi: 10.1016/j.tra.2020.01.022
Grant, J., and Davis, L. (1997). Selection and use of content experts for instrument development. Res. Nurs. Health 20, 269–274. doi: 10.1002/(SICI)1098-240X(199706)20:3<269::AID-NUR9>3.0.CO;2-G
Hardesty, D. M., and Bearden, W. O. (2004). The use of expert judges in scale development. implications for improving face validity of measures of unobservable constructs. J. Bus. Res. 57, 98–107. doi: 10.1016/S0148-2963(01)00295-8
Hirsch, P., and Rosenthal, T. J. (2017). “Pscyhological fidelity in driving simulation,” in Driving Simulation for Assessment, Intervention, and Training: A Guide for Occupational Therapy and Health Care Professionals, ed S. Classen (Bethesda, MD: AOTA Press), 75–84.
Kauffmann, N., Winkler, F., and Vollrath, M. (2018). What makes an automated vehicle a good driver? In Proceedings of the 2018 CHI Conference on Human Factors in Computing Systems - CHI'18 (New York, NY: Association for Computing Machinery).
Koglbauer, I., Holzinger, J., Eichberger, A., and Lex, C. (2018). Autonomous emergency braking systems adapted to snowy road conditions improve drivers' perceived safety and trust. Traffic Inj. Prevent. 19, 332–337. doi: 10.1080/15389588.2017.1407411
Lawshe, C. H. (1975). A quantitative approach to content validity. Personnel Psychol. 28, 563–575. doi: 10.1111/j.1744-6570.1975.tb01393.x
Lin, J., Abi-Rached, H., Kim, D.-H., Parker, D., and Furness, T. (2002). “A “natural” independent visual background reduced simulator sickness,” in Proceedings of the Human Factors and Ergonomics Society Annual Meeting, Vol. 46 (Sage, CA; Los Angeles, CA: SAGE Publications), 2124–2128. doi: 10.1177/154193120204602605
Lynn, M. R. (1986). Determination and quantification of content validity. Nurs. Res. 35, 382–385. doi: 10.1097/00006199-198611000-00017
Maxwell, J. (2012). Qualitative Research Design: An Interactive Approach. 3 Edn. Vol. 41. (Thousand Oaks, CA: Sage Publications).
Nevo, B. (1985). Face validity revisited. J. Educ. Meas. 22, 287–293. Available online at: https://www.jstor.org/stable/1434704
Payre, W., Cestac, J., and Delhomme, P. (2016). Fully automated driving: impact of trust and practice on manual control recovery. Hum Factors. 58, 229–241. doi: 10.1177/0018720815612319
Philips, B., and Morton, T. (2015). Making Driving Simulation More Useful for Behavioral Research-Simulator Characteristics Comparison and Model-Based Transofrmation Summary Report, Summary Report (FHWA-HRT-15-016). U. S. F. H. Administration.
Polit, D., and Beck, C. (2006). The content validity index: are you sure you know what's being reported? critique and recommendations. Res. Nurs. Health 29, 489–497. doi: 10.1002/nur.20147
Ravitch, S. M., and Carl, N. M. (2016). Qualitative Research: Bridging the Conceptual, Theoretical, and Methodological, 1 Edn. Sage Publications, Incorporated.
Schoettle, B., and Sivak, M. (2014a). A Survey of Public Opinion About Autonomous and Self-Driving Vehicles in the U.S., the U.K., and Australia, Technical Report. Available online at: https://deepblue.lib.umich.edu/bitstream/handle/2027.42/108384/103024.pdf?sequence=1&isAllowed=y
Schoettle, B., and Sivak, M. (2014b). A Survey of Public Opinion About Connected Vehicles in the U.S., the U.K., and Australia, Technical Report. Available online at: http://deepblue.lib.umich.edu/bitstream/handle/2027.42/106590/102996.pdf
Shah, N., Wells, C., O'Grady, G., Greenslade, M., and Stokes, B. (2018). Development of physical robotic surgery training exercises based on a systematic literature review. New Zeal. Med. Student J. 27, 13–21.
Society of Automotive Engineers International (2018). Taxonomy and Definitions for Terms Related to Driving Automation Systems for On-Road Motor Vehicles, Technical Report (J3016™). (Warrendale, PA).
Stern, E., Akinwuntan, A., and Hirsch, P. (2017). “Simulator sickness: strategies for mitigation and prevention,” in Driving Simulation for Assessment, Intervention, and Training: A Guide for Occupational Therapy and Health Care Professionals, 1st Edn (Bethesda, MD: AOTA Press), 107–120.
Keywords: automated shuttle, high-fidelity driving simulator, simulator scenario, on-road route, environmental congruence, face and content validity
Citation: Classen S, Wersal J, Mason J, Rogers J and Sisiopiku V (2020) Face and Content Validity of an Automated Vehicle Road Course and a Corresponding Simulation Scenario. Front. Future Transp. 1:596620. doi: 10.3389/ffutr.2020.596620
Received: 19 August 2020; Accepted: 28 October 2020;
Published: 15 December 2020.
Edited by:
Bilal Farooq, Ryerson University, CanadaReviewed by:
Milad Haghani, The University of Sydney, AustraliaCopyright © 2020 Classen, Wersal, Mason, Rogers and Sisiopiku. This is an open-access article distributed under the terms of the Creative Commons Attribution License (CC BY). The use, distribution or reproduction in other forums is permitted, provided the original author(s) and the copyright owner(s) are credited and that the original publication in this journal is cited, in accordance with accepted academic practice. No use, distribution or reproduction is permitted which does not comply with these terms.
*Correspondence: James Wersal, andlcnNhbEBwaGhwLnVmbC5lZHU=
Disclaimer: All claims expressed in this article are solely those of the authors and do not necessarily represent those of their affiliated organizations, or those of the publisher, the editors and the reviewers. Any product that may be evaluated in this article or claim that may be made by its manufacturer is not guaranteed or endorsed by the publisher.
Research integrity at Frontiers
Learn more about the work of our research integrity team to safeguard the quality of each article we publish.