- 1Department of Civil, Geo, and Environmental Engineering, Technical University of Munich, Munich, Germany
- 2Department of Rapid Road Transport, TUMCREATE Ltd., Singapore, Singapore
- 3School of Computer Science and Engineering, Nanyang Technological University, Singapore, Singapore
The three-dimensional passenger macroscopic fundamental diagram (pMFD) describes the relation of the network accumulation of public transport and private vehicles, and the passenger production. It allows for modeling the multi-modal traffic dynamics in urban networks and deriving innovative performance indicators. This paper integrates this concept into a multi-modal transport system design framework formulated as a simulation-based optimization problem. In doing so, we consider the competition for limited road space and the operational characteristics, such as congestion occurrences, at the strategic design level. We evaluate the proposed framework in a case study for the Sioux Falls network. Thereby, we deliver a proof of concept, and show that the proposed methodology indeed designs a transport system which benefits the overall system's performance. This paper further advances the integration of sequential model-based optimization techniques, macroscopic traffic flow concepts, and traffic simulation to design multi-modal transport systems. This supports transport planners and local authorities in composing efficient and robust transport networks.
1. Introduction
Growing urbanization is leading to a drastic increase in traffic volumes in megacities all over the world. The city growth results in rising traffic demand, which leads to increased air pollution, congestion, and delays which can impact urban productivity growth (Sweet, 2014). Potential solutions to these problems might arise with the increasing diversification of travel modes available to citizens. With the introduction of new mobility services, such as ride-hailing and ride-pooling, more and more alternatives to the private car become available. However, the effects of these emerging mobility services are not only positive. For example, recent studies show that congestion might increase due to ride-pooling (Tirachini, 2019). Moreover, public transport continues to serve as the backbone of urban mobility providing a capacity substantially higher than any other travel mode (e.g., Steer Davies Gleave, 2018). Focusing on capacities, both private and public transport are required to be considered for maximizing the utilization of transport infrastructure.
For this purpose, we explore the design of public transport systems considering overall bi-modal transport system dynamics including buses and private cars. The traditional framework known as the transit network planning problem includes processes related to strategical, tactical, and operational decisions. Due to its complexity, it is divided into the sub-problems of (i) transit network design on the strategic level; (ii) frequency setting and (iii) timetable development on the tactical level; as well as (iv) vehicle scheduling; and (v) driver scheduling on the operational level (Desaulniers and Hickman, 2007; Ceder, 2016). A number of detailed reviews about these sub-problems conducted by Guihaire and Hao (2008), Ibarra-Rojas et al. (2015), Kepaptsoglou and Karlaftis (2009), Schöbel (2012), and Iliopoulou et al. (2019) are available and provide a comprehensive review of the state-of-the-art regarding the corresponding methods. The authors show that a large body of literature deals with solving the transit network design with all different types of objective values. The review of Iliopoulou and Kepaptsoglou (2019) discussed the potential of ITS data and data-based optimization models for public transport planning and operations. The authors found a lack of studies regarding the role of ITS data for the public transit design problem. Additionally, they noted that such data could feed to new performance indicators that could serve as objective values for optimization methods. Furthermore, most approaches are traditionally uni-modal and only indirectly account for interactions between different modes. The existing literature on multi-modal network design is still limited (Farahani et al., 2013). Most of the occurring studies focus only on designing single-mode systems instead of the overall multi-modal system. A few studies take into account both cars and public transport with multi-modal objective values. However, they rarely consider multi-modal traffic dynamics explicitly and often assume steady-state traffic flows (Mesbah et al., 2011; Yao et al., 2012; Bingfeng et al., 2017; Li and Wang, 2018). The importance of traffic dynamics is indicated by the results of Sayyadi and Awasthi (2018). The authors presented a simulation-based optimization approach for identifying key determinants for sustainable transportation planning. They confirm that congestion is one of the key socio-economic-environmental variables for system planning. Pinto et al. (2019) proposed a modeling framework to optimize the transit network and shared-use autonomous vehicles mobility systems. By incorporating an agent-based simulation they acknowledge the role of traffic dynamics in the network design. Although they did not consider the impacts of the shared mobility vehicles on road traffic, their experiments suggest that larger fleets significantly impact the congestion on roadways. This suggests that modeling the interaction of different modes and their impacts on traffic conditions is important, and it remains an ongoing research topic. Given the interactions of all modes and the competition for limited road space, it is apparent that a uni-modal focus of transport design methods is not expedient. It is of high importance to account for multi-modal urban traffic dynamics while designing sustainable transport systems.
The concept of the three-dimensional passenger macroscopic fundamental diagram (pMFD) (Geroliminis et al., 2014; Chiabaut, 2015) is a promising framework to account for such dynamics, while exploiting existing and novel data sources. This recent branch of research regarding the MFD explores the functional relation of passenger production as person-kilometers traveled and the network accumulation of public and private transport vehicles. With its foundations in traffic flow theory, it enables to consider both transport modes including their interactions from a network-wide perspective. The pMFD depends on the network topology, control strategy, and the public transport system (Geroliminis et al., 2014). For its estimation, traffic counts from fixed sensors, mobile probes, as well as passenger counts from public transport vehicles are necessary. Modern intelligent transport system (ITS) technologies can provide such data. Examples for respective data sources are GPS devices, mobile phones, automatic vehicle location and automatic passenger count (APC) devices (Ambühl and Menendez, 2016; Loder et al., 2017; Dakic and Menendez, 2018; Huang et al., 2019). The pMFD allows deriving a multi-modal capacity in terms of passengers, as well as other indicators such as the system's optimal operational regime (Geroliminis et al., 2014). The latter indicator describes a set of bi-modal traffic states in the network for which high passenger production values can be achieved. A few studies apply the concept of the pMFD in the context of multi-modal transport system optimization (Zheng and Geroliminis, 2013; Amirgholy et al., 2017; Zheng et al., 2017; Zhang et al., 2018). The main focus lies on space allocation between buses and cars based on analytical formulations for the MFD. These studies indicate that the pMFD potentially contributes to a multi-modal transport system design framework that explicitly considers corresponding urban traffic dynamics. Thereby, operational characteristics can be considered at the strategic design level.
Following this research gap, we aim to analyze the potential of the pMFD for the comprehensive design of a bi-modal transport system including private and public transport. By considering these modes and the corresponding mutual interactions, an optimal utilization of existing infrastructure can be achieved. We propose a methodological framework which we define as bi-modal network design problem since both modes are affected. This includes the formulation of an optimization problem with an objective function related to the pMFD and decision variables referring to the public transport system, namely the bus routes and the number and position of bus stops served along these routes. Current data types for the MFD estimation rely on assumptions regarding bus passengers (e.g., Geroliminis et al., 2014) or available APC data which introduce additional inaccuracies and biases in the estimation (e.g., Loder et al., 2017). To avoid such assumptions, we extract person-specific position (PSP) data from an agent-based multi-modal microscopic traffic simulation to estimate the pMFD. This simulation environment allows us to consider vehicle interactions and mode-specific operational characteristics in detail. To our best knowledge, no studies exist which investigate the estimation of the pMFD directly from PSP data. Our proposed approach sheds light on the value of the pMFD and consequently of PSP data for the design of bi-modal transport systems.
The contributions of this paper are three-fold:
1. pMFD estimation: We conduct and discuss the pMFD estimation based on PSP data. By doing so, we explore for the first time the value of such data for the estimation of the three-dimensional pMFD. The analysis shows that the usage of PSP data allows us to avoid biases from currently used estimation techniques.
2. Bi-modal transport system design: We prove the practicability and feasibility of applying the pMFD within an optimization framework for the strategic design of bi-modal transport systems. The decision variables relate to bus lines, i.e., are the bus route and the associated served bus stops. The objective function includes both the maximum bi-modal passenger production and the transport system's optimal operational regime. These parameters are derived from the pMFD, and relate to the arrival rate of persons at their destination, as well as the system's robustness. Furthermore, our approach is able to account for operational aspects such as congestion patterns at the design level.
3. Balancing bi-modal travel production: We solve the bi-modal network design problem for the Sioux Falls network based on the proposed framework. Thereby, we provide a proof of concept, find a quasi-optimal bus system for a given demand and network topology, and show that the found solution indeed finds a balance between modes compared to existing solutions.
The results of this study support operators and planners to design balanced transport systems as well as better transport policies for multi-modal urban transport systems.
The remainder of this paper is structured as follows. The next section briefly describes the development and current state-of-the-art of the pMFD. Section 3 investigates the suitability of PSP data for the pMFD estimation. Also, it analyzes the feasibility of applying the concept of the pMFD in an optimization framework. Subsequently, section 4 presents this framework in detail. It includes the derivation of our objective function. In section 5, we apply our approach in a case study for the Sioux Falls network as a proof of concept. Moreover, we compare the results to existing multi-modal transport systems for this network. Lastly, section 6 draws a conclusion and outlines future research.
2. Background
Several studies analyzed the macroscopic relationship between the network-wide vehicle outflow and the aggregated vehicle accumulation (e.g., Godfrey, 1969; Herman and Prigogine, 1979; Mahmassani et al., 1987; Daganzo, 2007). Geroliminis and Daganzo (2008) confirmed the existence of the MFD by linking the vehicle accumulation to the average flow in a network with data from San Francisco and Yokohama. Recently, strong evidence for the unimodal MFD was reported for an extensive list of cities (Loder et al., 2019a). Moreover, first studies reported of the empirical evidence for the multi-modal MFD. Loder et al. (2017) presented a network-wide evaluation of the impacts of different traffic modes for the city of Zurich, Switzerland. Huang et al. (2019) estimated the MFD and the 3D-MFD for the city of Shenzen, China, based on GPS data for cars and buses.
Various theoretical studies have analyzed the multi-modal representation of traffic with the MFD. Gonzales and Daganzo (2012) extended the morning commute problem from a single bottleneck to multi-modal networks. This study explored the system optimum at the network level based on an MFD representation. Boyacı and Geroliminis (2011) extended the variational theory (VT) (Daganzo, 2005a,b; Daganzo and Menendez, 2005) to estimate the MFD for bi-modal arterials. The authors considered cars and buses and computed the passenger flow based on the dwell times of buses. Chiabaut (2015) introduced an analytical method to estimate the performance of bi-modal networks in terms of passenger flows while accounting for mode choice. The model was applied to analyze the effects of dynamic bus lanes. Some works targeted the stochastic nature of traffic. Castrillon and Laval (2018) extended the stochastic approximation for MFDs (Laval and Castrillón, 2015) to apply to bi-modal traffic on homogeneous urban corridors. Based on unimodal semi-analytical MFD estimation methods (Leclercq and Geroliminis, 2013; Tilg et al., 2020), Dakic et al. (2019) developed a VT-based method to estimate the passenger MFD for bi-modal corridors. Thereby, they accounted for the stochastic nature of bus operations, moving bus bottlenecks, and traffic state dependency of bus arrivals. Paipuri and Leclercq (2020) investigate the application of 3D-MFDs for modeling traffic dynamics in an urban region. They propose a segregation of vehicle type-specific MFDs for accurate prediction of traffic dynamics. While these studies estimate the MFD for the bi-modal systems, they often only apply to corridors or strongly reduced and artificial grid networks.
The application of traffic simulators can eliminate this limitation. Using a three-dimensional representation, Geroliminis et al. (2014) studied the existence of the simulation-based MFD for mixed bi-modal urban networks. They proposed an analytical and data-based model to relate the bus and car accumulation to the system-wide passenger flow. The authors showed that the passenger flow is maximized at a non-zero accumulation of buses. Moreover, they defined the optimal operational regime for buses which could be of interest to city managers and bus operators. We include this optimal operational regime next to the maximum passenger production in our optimization framework. Thereby, we not only aim for a high capacity, but also for robust operation. By doing so, we fully integrate the pMFD into our framework.
The existing literature indicates that the application of the pMFD is currently receiving increasing interest. Examples can be found for bi-modal traffic control (Ampountolas et al., 2017) and traffic systems including parking limitation and cruising-for-parking flow (Zheng and Geroliminis, 2016). An application related to public transport was shown in Zheng and Geroliminis (2013). The authors allocated road space among travel modes to minimize the total travel time of travelers based on the semi-analytical approach developed by Boyacı and Geroliminis (2011). Furthermore, Johari et al. (2020) analyzed the effects of bus stop location (i.e., far-side and near-side) and berth number at the network level based on the notion of the multi-modal MFD. It enabled them to successfully include the interactions between modes in the respective analyses. Also, Zhang et al. (2018) developed a framework to analyze multi-modal transport systems. Again, the focus lies on space allocation between cars and buses and how operators react to certain allocation strategies. In another study on space allocation, Roca-Riu et al. (2020) proposed an analytical framework to quantify mode-specific space consumption in urban areas. Thereby, the authors exploited the idea of the multi-modal MFD. Still, these studies mainly apply semi-analytical models to estimate the MFD. While Zheng et al. (2017) aimed to assign bus lanes, their study represents an example where an optimization based on microscopic simulation is conducted. Their objective was to minimize the occurrence of congestion in the network. However, the pMFD was estimated based on vehicle and not PSP data. Moreover, the authors did not consider the design of bus lines. Another example for a simulation-based optimization was reported by Dantsuji et al. (2019). The authors proposed a simulation-based joint optimization framework composed of dedicated bus lanes and vehicular congestion pricing in order to minimize the congestion according to the MFD. Focusing on the actual design of transport systems, the pMFD was applied in Amirgholy et al. (2017). Thereby, the authors proposed a continuum approximation model to optimize various public transport system parameters, such as the line spacing, stop spacing, headway, and fare. The objective included users', operators', and external costs. The analytical nature of their model limits them to these parameters and simple symmetric networks. Thus, they cannot choose any bus route or combination of served bus stops.
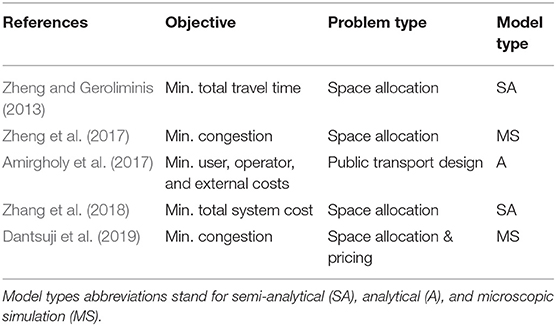
We summarize the relevant studies in Table 1. Overall, the literature confirms the increasing interest of researchers in applying the pMFD to analyze and optimize multi-modal transport systems. Naturally, the focus lies on operational aspects. While these studies confirm the importance of accounting for limited available space in urban areas, they rarely consider the strategic design level. If so, they rely on analytic approximation methods which are limited to artificial symmetric networks. To avoid such a limitation to specific network types, we propose a simulation-based framework. More specifically, we estimate the pMFD based on PSP data from a multi-modal microscopic agent-based simulation. We further derive a multi-objective function from the pMFD and thereby fully integrate it into an optimization framework. The decision variables regard to the route and bus stops served of bus lines, but can easily be extended to more parameters such as bus lanes or transit signal priority. Thus, our approach further explores the applicability of the pMFD for the bi-modal transport system design and contributes to the existing literature.
3. Simulation-Based pMFD: Estimation and Sensitivity
The goal of this paper is to develop and test a framework that allows finding an optimal bi-modal system design concerning the maximum passenger production as well as the system's optimal operational regime. For this purpose, we aim to integrate the pMFD based on simulated PSP data into an optimization framework. The estimation method of the pMFD based on PSP data is described in the following.
3.1. Estimation Method
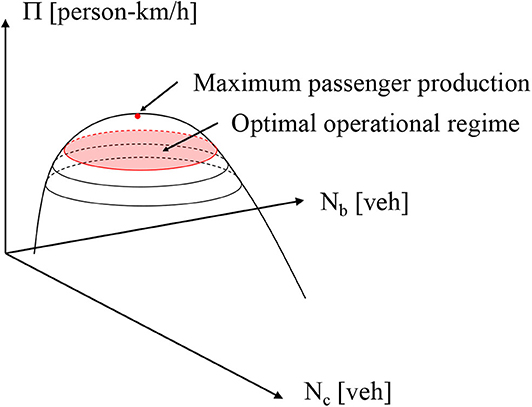
The pMFD describes the relation of the network accumulation of cars Nc in vehicles, of buses Nb in vehicles, and the passenger production Π in person-km/h. The functional relation enables us to derive our objective values, the maximum passenger production and the optimal operational regime of the bi-modal transport system. Figure 1 illustrates how these parameters relate to the pMFD in a schematic manner. More details on the objective values are provided in section 4.3.
The estimation of the bi-modal pMFD requires data from both private vehicles and public transport passengers. This could include loop detector data, floating car data and APC data (Loder et al., 2017). In reported empirical studies, no passenger-specific data were available so far. Thus, modelers estimated the passenger flow based on bus dwell times and average car occupancies. In the simulation-based studies, only vehicle data were available, too. The possession of position data from individual travelers reduces the bias and inaccuracy in the estimation of passenger production, as we show in section 3.3.2. In such a case, the position and speed for each person at each simulation time-step are known. This information can be exploited to estimate the pMFD. Contrarily to existing studies (e.g., Geroliminis et al., 2014), one does not rely on assumptions regarding vehicle occupancies by doing so.
For a given transport system, i.e., a network topology, a control setting and a time-varying origin-destination (OD) demand, the following parameters are calculated for each time interval with J time steps and a time-step length Δt. Let Pj,m describe the total number of persons p who are traveling at time-step j in the system with transportation mode m = {c, b}. Additionally, let Vj,m describe the total number of vehicles v which are traveling at time-step j in the system of transportation mode m = {c, b}. Then, the total travel time tT,m of all vehicles during T of transportation mode m is:
For each person, the average speed during Δt can be derived from the output data and is denoted as uj. Thus, one can calculate the total travel distance during T as:
Finally, this allows us to define the mode-specific vehicle accumulation Nm, T and the passenger production ΠT for each time interval T as:
Applying Equations (1)–(3) on the simulation output data for each time interval T results in the triplets (Nc, Nb, Π). This point cloud is the pMFD. Similarly to Geroliminis et al. (2014), we apply the Delaunay triangulation interpolation algorithm (de Berg et al., 2008) on the sampled data points to derive continuous production values in the accumulation plane. Hence, we can approximate the passenger production Π for unobserved (Nc, Nb) values. Naturally, the estimation is more accurate in regions close to observed data (Loder et al., 2017).
3.2. Simulation Environment
PSP data are the base for such an estimation of the pMFD. An agent-based simulation environment models the movement of single agents and thus, generates the corresponding trajectory data. Therefore, we can track all person's movements including inter-modal trips. Since we focus on multi-modal systems, we aim to include corresponding interaction between modes, for example, delays of car drivers that occur at bus stops due to temporal blockage of a road lane. Such detailed multi-modal traffic dynamics are effectively modeled in microscopic simulation environments, where the movements of single vehicles and persons are described by corresponding car-following, lane-changing, and pedestrian models. Moreover, microscopic traffic simulators are suitable for the evaluation of traffic management strategies such as dedicated bus lanes and bus prioritization at signalized intersections, which can be of interest for future work.
In this paper, we choose SUMO (Lopez et al., 2018) which is an agent-based microscopic traffic simulation. Please note that the framework presented in this paper is not limited to SUMO, and any agent-based microscopic simulator is suitable to perform the presented analysis. As the overall aim is to optimize the supply of a multi-modal transport system, we make several assumptions regarding the demand. Travel demand consists of an OD relations, departure times, and mode choice. SUMO enables us to generate and assign person-specific and time-dependent OD relations. For the sake of simplicity, departure times remain unchanged. In order to consider mode choice, we let agents choose their mode and route in an iterative manner. In each iteration, agents evaluate their choice based on travel times. We evaluate a number of three iterations. While the system might not necessarily reach equilibrium within these iterations, this approach represents a trade-off between the conceptual feasibility of the integration of mode choice and the computational burden of its implementation.
3.3. pMFD Estimation Based on PSP Data
In order to explore the suitability of PSP data for deriving the pMFD, a simple transport system including a number of bus lines is designed in the simulation. We extract person and vehicle trajectories from the output. This includes the positions, IDs, and speeds for all vehicles and persons at each simulation time-step. This data set allows estimating the pMFD as explained above, and further the discussion of the estimation procedure.
3.3.1. Simulation Setup
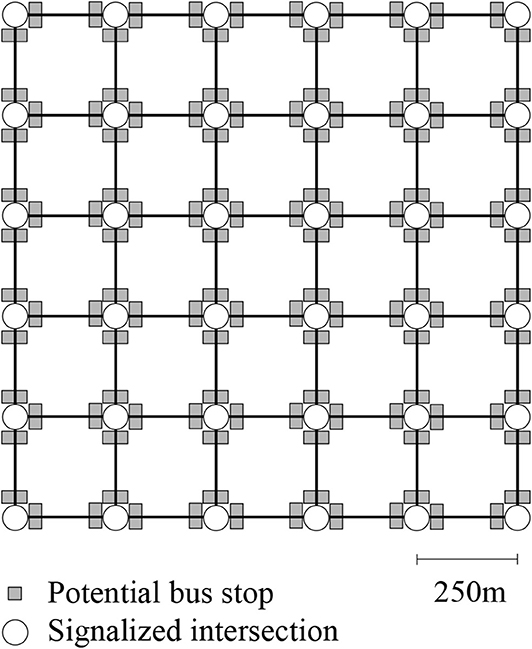
For the estimation and sensitivity analysis we choose a regular 5 × 5 grid network of square blocks as illustrated in Figure 2. This implies a total of 26 blocks, 36 nodes, and 60 links. Each link has a length of 250 m, one lane per direction and a speed limit of 50 km/h. Each intersection is controlled by a fixed-time traffic signal with cycle lengths of 90 s and green times of 45 s without any offsets.
As it can be seen in the figure, we place bus stops that could potentially be served by a bus line at the downstream and upstream end of each link. We define three bus lines by specifying routes and the corresponding bus stops which are served for each line. For this scenario, the number of served stops per bus line is set to five, while the bus stop locations are randomly chosen. Moreover, we vary the headways between 1 and 5 min. No preferential treatment of buses such as dedicated bus lanes or transit signal priority is considered.
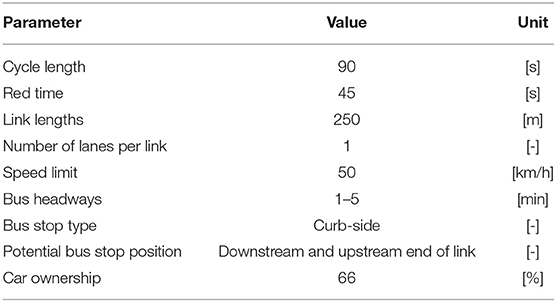
The person-specific OD pairs are generated randomly. These trips are required to have a minimum length of three blocks, i.e., 750 m, to minimize a systematic bias for choosing walking as travel mode. Furthermore, we set the car ownership to 66 %. In other words, only 66 % of all agents can choose a private vehicle as mode of travel. We do not consider mode choice for this analysis, as the estimation of the pMFD is independent of it. The simulation time is set to 2 h where the demand curve increases gradually every 30 min to reach its maximum. Table 2 summarizes the assumptions for the simulation analysis.
In order to generate a sufficient number of data points for the pMFD estimation, we sample four different scenarios by varying the random seed. The output data are aggregated in 5 min intervals and the vehicle accumulation for both modes (Nc, Nb), as well as the passenger production Π, is calculated as explained in section 3.1. Note that the production of walking persons is not included in the pMFD estimation. Only the traveled distances by car or bus are accounted for the pMFD estimation. This results in a more sensitive reaction of the average production values to a change in bus ridership.
3.3.2. Existence of a pMFD Based on PSP Data
Figure 3 shows the resulting pMFD. The y-axis depicts the network accumulation of buses Nb, and the x-axis the network accumulation of cars Nc. The color represents the passenger production Π in person-km/h. Dark blue corresponds to a low production whereas bright yellow indicates high production values.
The figure shows all ranges of passenger production and a maximum at non-zero values for Nb which assembles results from other studies. Additionally, the lowest production values can be found for high values of Nc and Nb which is physically meaningful. The overall picture resembles other pMFDs reported in the literature. Despite that, we conclude the conducted scenario study successfully shows the suitability of PSP data for the estimation of the pMFD.
In the lack of accurate PSP data, assuming bus riderships to calculate the passenger travel production has become a common practice in the state-of-the-art (e.g Geroliminis et al., 2014). Availability and low penetration rate of mobile phone data, lack of methodologies to identify travel mode, and privacy concerns of using such data have encouraged researchers to indirectly estimate the bus ridership. However, in the past years, we have seen that smartphones are becoming prevalent, travel mode identification has become more reliable (Efthymiou et al., 2019), and there a number of solutions proposed to rectify the data privacy and security concerns (Christin, 2016). Hence, it is essential to explore suitable methods to exploit the benefits of such data.
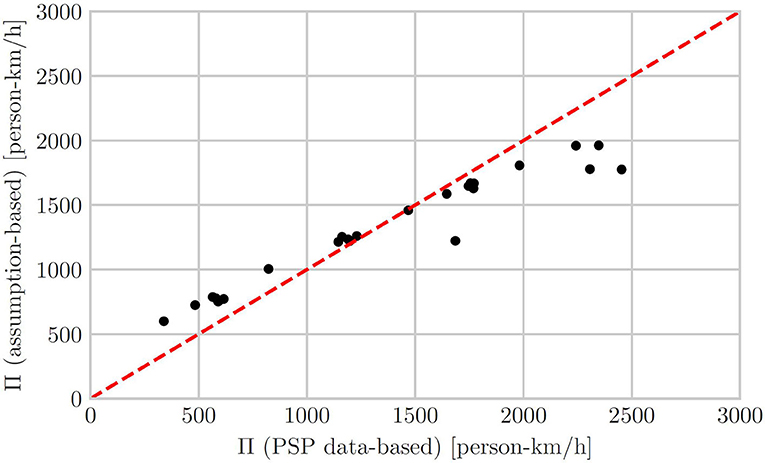
In working toward this goal, we compare the obtained passenger production Π for one of the simulation scenarios described earlier via two different methods: First, we assume that we can track individuals very accurately by knowing their travel mode, speed and position realized by GPS data from mobile phones, i.e., PSP data is available. Second, we assume a pre-defined bus and passenger car ridership for each corresponding vehicle to calculate the passenger production. Based on the simulation results we derive an average bus ridership of 20 persons for the whole simulation horizon and both bus lines, and a passenger car occupancy of 1. Figure 4 shows the comparison of passenger production computation based on the two methods at each time-step:
The y-axis shows the passenger production based on the assumption of pre-defined bus riderships and passenger car occupancies. The x-axis shows the production calculated based on PSP data. It can be seen that the passenger production is overestimated by the assumption-based approach during the beginning of the simulation, and underestimated during the later periods of the simulation horizon. These times represent the maximum demand, and thus a correct computation of the passenger production is of high importance. Overall, the figure shows that the PSP data-based computation of the passenger production is indeed more accurate and thus valuable for the optimization framework. A more intricate analysis of PSP data for the pMFD estimation could include the comparison to APC and loop detector data. However, such an analysis lies out of scope for this study, and we leave this for future work.
3.4. Sensitivity to Bus Line Parameters
The next necessary step of analyzing the feasibility of integrating the pMFD in an optimization framework is the investigation of its sensitivity to related input parameters. Thus, we study the sensitivity of the pMFD regarding bus line parameters. For this purpose, we fix the headway to h = 3 min, and vary only bus routes and served bus stops. The underlying network is again the 5 × 5 grid network as shown in Figure 2. Moreover, all parameters described in Table 2 except for the headways apply.
We consider two different scenarios. First, we calculate all possible routes for the 5 × 5 grid for 50 randomly chosen OD pairs. We exclude those routes which are a subset of others. In other words, routes which are entirely included in a different larger route are not considered. Still, two routes can be partly overlapping. Additionally, we exclude also routes which consist of less than four links. The bus stops served are fixed for this scenario. For a given demand profile, the simulation is conducted for all routes and the pMFD is estimated based on 5 min aggregation intervals. For each simulation run, the maximum passenger production Πmax = max(ΠT) is extracted from the output data. Figure 5A shows the results as a histogram using the normalized count of occurrences of binned Πmax. Secondly, we fix the bus routes and vary the served bus stop combinations using the same network topology, demand pattern and headway specification. Again, we run the simulation for 50 random scenarios, and show the resulting distribution of Πmax as a histogram in Figure 5B. We assume that Πmax indicates the overall sensitivity of the pMFD to the studied input parameters.
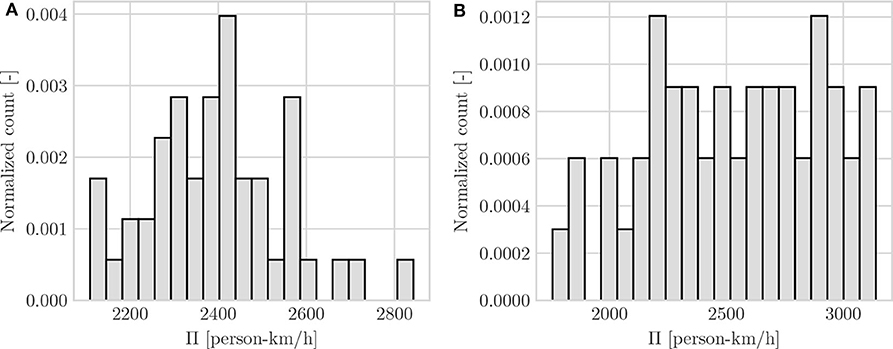
Figure 5. Sensitivity of Πmax to bus line elements: Bus route variation (A) and bus stop variation (B).
The x-axis displays the maximum passenger production Πmax in person-km/h. The y-axis shows the normalized count of occurrences in bins. One can observe a strong accumulation of observations around the mean for the bus route variation and a more uniform distribution for the bus stop variation. Nevertheless, both figures show clearly that the measured maximum passenger production is sensitive to the respective parameter. We conclude that the pMFD estimated based on the simulation output reacts sufficiently sensitive to a change of bus line elements to be the base for an optimization framework.
4. Optimization of Urban Bi-modal Transport Systems
The formulation of an optimization problem includes the specification of the evaluation function, the decision variables, corresponding constraints, and the objective function. The definition of these elements let us choose a suitable optimization algorithm. Note that for the sake of simplicity we refer to “bus system” as public transport system in this paper. However, the methodology is not limited to buses, and can be applied for all road-bound public transport systems.
The optimization of a transport system based on the pMFD requires a network topology. Next to infrastructure elements such as links, intersections, and control settings this includes potential bus stops. Among these, some may be selected by the optimization algorithm to be served by a bus line. Moreover, a time-varying OD demand is specified. Given those inputs, we define a multi-objective optimization problem in the following.
4.1. Evaluation Function
We design the optimization with respect to the pMFD. Several simulation runs with different headways are required to generate sufficient data points for an MFD estimation. These simulation runs including the MFD estimation correspond to the so-called function evaluation in the terminology applied in the fields of optimization. This function can be classified as a stochastic black-box function since the interaction of vehicles in the transport system includes stochasticity and microscopic simulations can be considered as functions of the black-box type. Moreover, as the run time is measured in terms of seconds, the function is seen as computationally expensive.
4.2. Decision Variables
The decision variables regard to a public transport system. In our paper, we specify such a system based on its bus lines β. We define a bus line β by its route rβ and the stops srβ served along the route rβ. The headways are not varied within the optimization as several ones are evaluated to estimate the pMFD. Thus, the effect of specific headways on the production can inherently be deduced from the pMFD itself which corresponds to the solution of the optimization problem. The bus route is of a categorical type and might differ in length and number of links included. The bus stops served are defined as a boolean vector which specifies which of the potential bus stops are served and which not. Next to the choice of the served bus stop positions (either far-end or near-end), both bus stops can be skipped. This decision variable is of a conditional type as it depends on the bus route since longer bus routes imply more potential bus stops.
We aim to reduce the complexity of the optimization problem as follows. First, we derive the k-shortest paths for each OD pair for a given network and define them as a set of bus routes Rβ. Note that the choice of k-shortest paths increases the number of possible routes for the optimization algorithm to choose from. Each bus route is defined as a sequence of links. Again, we exclude bus routes which are a subset of other routes. This largely reduces the size of the problem. Second, for each route rβ all possible stop combinations are calculated. This results in a set B which includes all possible route-stops combinations, i.e., all possible bus lines. By doing so, we reduce both decision variables to a single one. The only constraints are given by the fact the decision variable β needs to be a valid member of this set, i.e., β ∈ B.
4.3. Objective Function
The relevant objective value is derived based on the estimated pMFD. We define the maximum measured passenger production Πmax as well as the optimal operational regime of the transport system O as objective values. Under the realistic assumption of a constant average trip length, the production is equal to the vehicles arriving at their destination per time interval (Geroliminis and Daganzo, 2008). This relationship is assumed to be equally valid for person flows and independent of the demand. Thus, we consider the maximum passenger production and the optimal operational regime, which is related to the production as well, as appropriate objectives for this study. We aim to offer a trade-off of production maximization on the one hand, and an increased optimal operational regime, which can be regarded as the system's robustness, on the other hand. The optimization can be classified as of a multi-objective nature.
4.3.1. Objective Values
The maximum passenger production is derived as:
where ΠT(β) is the passenger production from time interval T, calculated based on Equations (1)–(3) described in section 3.1. The variable β describes the bus line specification drawn from the set B and serves as input to the simulation.
Further, we include the optimal operational regime O in the objective function which is defined as the region encapsulated by the iso-line of production values which are equal or greater than 80% of the maximum passenger flow Πmax (see Figure 1 in section 3.1). The denotation “optimal operational regime” (Geroliminis et al., 2014) shall indicate the inclusion of bi-modal traffic states where the production is reasonably high. Based on the simulation results, we measure Πt ≥ 0.8Πmax. Each point is defined in the (Nc, Nb, Π)-space. Thus, we can derive the operational regime O as the convex hull in the (Nc, Nb)-plane according to Preparata and Shamos (2012) as:
4.3.2. Normalization
We scalarize both parameters to include them in the objective function. For this purpose, we normalize each of the objective values by estimating upper bounds for them. The parameter p describes the upper bound for the production and is calculated as follows:
where lmax is the maximum trip length, Qc the maximum flow of cars according to the link fundamental diagram, Qb = 1/hmin the maximum bus flow based on the minimum evaluated headway hmin and bmax the maximum capacity of bus vehicles.
Further, the parameter o describes the upper bound for the operational regime O. Loder et al. (2019b) define planes which act as upper bounds for the pMFD in the (Nc, Nb, Π)-space. These planes include the Nc, Nb-plane. They define the upper bound depending on the total network length, the length of dedicated car and bus lanes and the jam densities related to both modes. This corresponds to the maximum area in the Nc, Nb-plane and thus can serve as an upper bound for the optimal operational regime. Note that no bus or car only roads exist in our network. Thus, we can describe o as follows:
where L is the total network length in lane-kilometers available to cars, kj,c the jam density of cars according to the link fundamental diagram, Lb the maximum length of the public transport network and kj,b the jam density of buses. By defining p and o we succeed in finding normalization factors solely based on constants which can be estimated based on the network topology and the public transport system.
4.3.3. Problem Formulation
The overall objective function includes weighting factors αΠ and αO for both terms. The weighting factors need to be set by the modeler, and can be adapted to a certain problem setting and represent the importance of each term. We linearize the multi-objective optimization problem to a single objective function. The overall problem is expressed as follows:
4.4. Sequential Model-Based Optimization
We look for a global optimization algorithm suitable to find the quasi-optimum for the case of a stochastic expensive simulation-based black-box function. The family of optimization techniques for such problems includes, for example, stochastic approximations (e.g., Simultaneous Perturbation Stochastic Approximation by Spall, 1992), evolutionary algorithms such as particle swarm optimization (Kennedy and Eberhart, 1995) or simulated annealing (Kirkpatrick et al., 1983), metaheuristics such as tabu search (Glover, 1989, 1990), and sequential model-based algorithms (SMBA) (also known as response surface methods, surrogate models or metamodels, e.g., Regis and Shoemaker, 2007).
For smooth, costly and noisy black-box function the application of SMBA is expedient. Although the simulation-based estimation of the pMFD is not necessarily smooth, there exist several strategies to apply such algorithms (Bartz-Beielstein and Zaefferer, 2017) as seen in hyperparameter optimization. These techniques usually require a low number of function evaluations compared to e.g., evolutionary algorithms (Müller and Shoemaker, 2014). Such alternative optimization algorithms involve a high number of function evaluations and are thus not feasible for the problem stated within this paper. The comparably low number of function evaluations necessary in SMBA is achieved by the methodology which main elements are briefly described in the following.
• Experimental design: SMBA build an approximate and continuous surface based on an array of initial evaluations of the expensive black-box function. The initial values are found based on an experimental design. The general purpose of such experimental design methods is to maximize the outcome of information for a limited number of initial points and a high number of possible parameter combinations. Thus, the appropriate choice of the experimental design can lead to faster convergence of the optimization.
• Surrogate model fitting: The next step is to fit a surrogate model to the results derived from the experimental design. An example for a surrogate model is Kriging (e.g., Forrester et al., 2008) for the case of continuous problems. For problems involving discrete and categorical variables, Bartz-Beielstein and Zaefferer (2017) list a number of strategies to apply in surrogate modeling. Next to the naive approach of applying models designed for continuous problems, they suggest using algorithms which are discrete in nature such as random forests, or apply distance measures other than the euclidean one.
• Candidate point selection: Based on the surrogate model, the next most promising candidate for an evaluation of the expensive original function is chosen. Examples for the selection methods of candidates are the expected improvement (Jones et al., 1998), the probability of improvement and the lower confidence bound (Forrester et al., 2008). On the one hand, the candidate point should be distant from the previous point evaluated to facilitate a global search. On the other hand, it should improve the currently found optimum. This describes the trade-off between exploration and exploitation. The evaluation of the surrogate model is substantially less computationally expensive than the original function. Thus, this approach is highly advantageous for expensive black-box functions by minimizing the computational effort.
Once the candidate point is selected, the original expensive function is evaluated. Subsequently, the surrogate model is updated and a new candidate point is searched. This process continues until the convergence criteria are met. Examples for a successful application of such models for the field of traffic simulation are shown in Tilg et al. (2018) and He (2014). We conclude that the sequential model-based optimization approach is suitable for our problem setting. The following section describes the specific setup of the proposed SMBA for the design of urban bi-modal transport systems.
4.5. Implementation of the Optimization Framework
This section describes the implementation of the SMBA-based framework in order to design bi-modal urban transport systems. This implementation involves several steps. The corresponding work flow is shown in Figure 6 and explained in detail below.
• Initialize system: The first step is the transport system initialization which consists of the definition of a road network, potential bus stops, and the number of bus lines to be designed.
• Define decision variable set: Based on this initialized system, we are able to define possible route and stop combinations, and therefore our decision variable set B. Additionally, we calculate the average Jaccard distance (Jaccard, 1901) between each bus route, calculate the average and sort the set B accordingly to further increase convergence speeds of the optimization, and the smoothness of our original function. By doing so, we follow the line of suggestions indicated in Bartz-Beielstein and Zaefferer (2017) for discrete optimization problems.
• Perform initial function evaluations: In the next step, we select a subset from B based on an experimental design of choice and perform the function evaluations, i.e., estimate the corresponding pMFDs and derive the objective values.
• Fit surrogate model: The next step involves the fitting of a surrogate model. For the stated problem, we choose a surrogate model based on extra trees regression (Geurts et al., 2006; Pedregosa et al., 2011) since we deal with categorical variables. This type of surrogate models have previously been applied in the field of algorithm tuning (e.g., Hutter et al., 2011). Within our case study, we compared this choice to alternatives based on radial basis functions (Buhmann, 2003) and random forests (Breiman, 2001). The extra trees regressor based surrogate model proved to be superior.
• Select candidate point: The next step involves the selection of the candidate point which we apply the lower confidence bound for.
• Perform function evaluation: Subsequently, the microscopic agent-based simulation is run several times to estimate the pMFD and derive the objective values.
• Stop criterion: If the stop criterion is not reached, the surrogate model is updated with the last function evaluation and another iteration is started. Possible stop criteria are a minimum change of the objective function, or a maximum number of function evaluations.
The described optimization framework enables us to systematically search for a maximal passenger production and optimal operational regime given a network and demand configuration. Note that the framework is not limited to simple networks or specific demand configurations. Depending on the computational resources, larger networks with arbitrary demand patterns, and an array of bus lines can be optimized as well.
5. Application of the Urban Bi-modal Transport System Design: Sioux Falls Case Study
This section proves the feasibility of the proposed approach of optimizing a bi-modal transport system based on the pMFD. For this purpose, we conduct a case study for the general and well-known Sioux Falls network. Moreover, we compare an existing bus network solution (Abdulaal and LeBlanc, 1979), hereafter referred to as “base network,” to an alternative proposed based on our framework. The base network was chosen as the corresponding study is highly cited, and the network used as a benchmark network in other studies as well (e.g., Miandoabchi et al., 2012; Chakirov and Fourie, 2014). Moreover, the existence of a multi-modal demand facilitates the comparison.
5.1. Network Topology and Demand Pattern
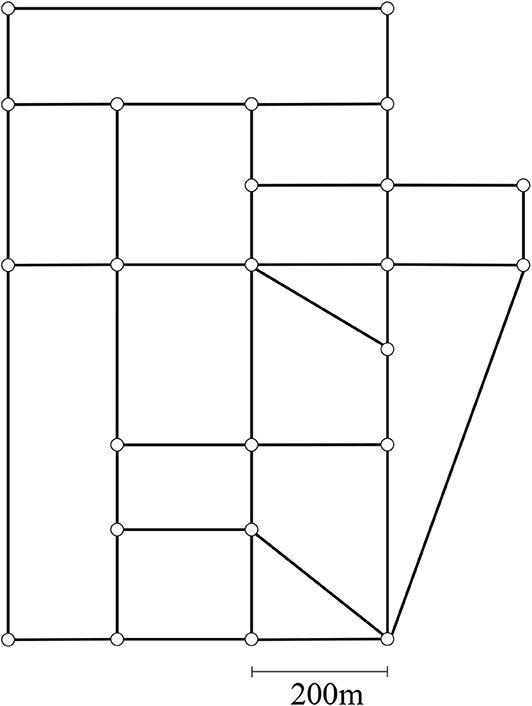
We choose the Sioux Falls network to test our proposed framework. Figure 7 shows the corresponding network topology.
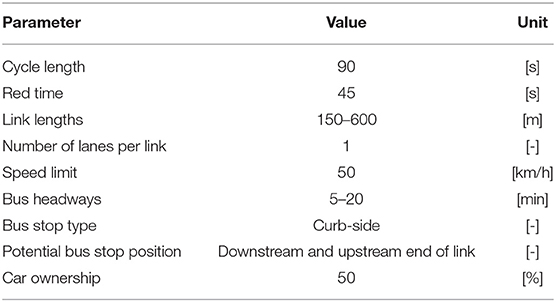
The link lengths range from 150 to 600 m. Links consist of one lane per link and direction. Again, the speed limit is set to 50 km/h, and each intersection is controlled by the same fixed-time signal program with cycle lengths of 90 s and green times of 45 s without any offsets. No prioritization of public transport in any way is applied. We set the demand similar to the one specified in Abdulaal and LeBlanc (1979). The data specifies the all-mode OD relations for a whole day within the network. We consider a fraction of this demand, which leads to congestion within the chosen simulation horizon for each run of 1 h. A graphical illustration of the demand is shown in Figure 10A in which the size of each node represents the summation of the generated and attracted demand. For the reader's convenience we show this figure next to the bus network to which we compare our solution. A more detailed discussion on this bus network is provided below. Furthermore, we assume a car ownership of 50%. However, we consider mode choice as described in section 3.2 for this scenario. Note that any demand setting including car ownership can be considered within the proposed framework. We run five simulation runs with bus headways of h = {5, 7.5, 10, 15, 20} min for each bus line to generate data points for the MFD estimation. This number represents a trade-off of computational cost and estimation accuracy. Table 3 summarizes all assumption for the considered scenario.
5.2. Specification of the Optimization Input Parameters
To increase comparability to the base network, we optimize a system with five bus lines. This demonstrates the ability of our framework to handle not only a low and unrealistic number of bus lines. Note that the dimension of the optimization increases with the number of bus lines, and thus, convergence might be affected. However, it does not increase the set of possible bus lines B. To generate the set B, we consider 3 shortest paths for each OD in the route generation. The parameters αΠ and αO are both set to 0.5. This implies an equal weight of the maximum passenger production Πmax and the optimal operational regime O in the objective function.
Numerical tests have shown that the choice of an experimental design based on Halton sequences (Halton, 1964) leads to the best convergence results. Thus, we choose this type of experimental design and sample 300 initial points. No hyperparameter tuning for the extra trees regressor model was conducted, since the default parameters led to satisfying results. We set the maximum number of function evaluations to 1500 as a stop criterion.
5.3. Convergence, Quasi-Optimal pMFD, and Implications
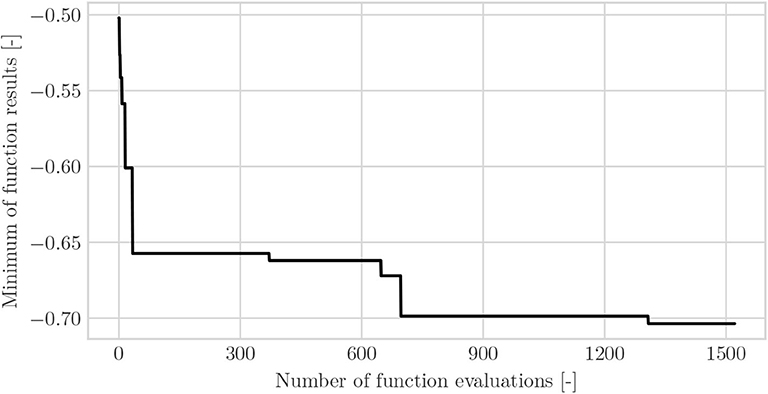
This section presents and discusses the results of applying the proposed optimization framework for the Sioux Falls case study. Figure 8 shows the convergence plot.
The y-axis shows the minimum of the objective function found for a given number of function evaluations, which are displayed on the x-axis. Please note that we multiplied the objective function with -1, as the algorithm is implemented as a minimization problem. Up to number 300, the results are derived based on the experimental design. After that, new function evaluations are performed based on the surrogate model as explained in the previous section. The figure clearly shows additional improvements after evaluation number 300 which indicates the effectiveness of the optimization algorithm. We run the optimization for 1,500 iterations and declare the found value as quasi-global optimum. The convergence plot supports this assumption, as no improved result is found for a larger number of function evaluations. One iteration lasts between 2 and 20 min on an Intel(R) Xeon(R) W-2145 CPU with 3.7 GHz and 64 GB RAM. The computation time depends on the number of iterations performed, as more iterations lead to a more complex regression.
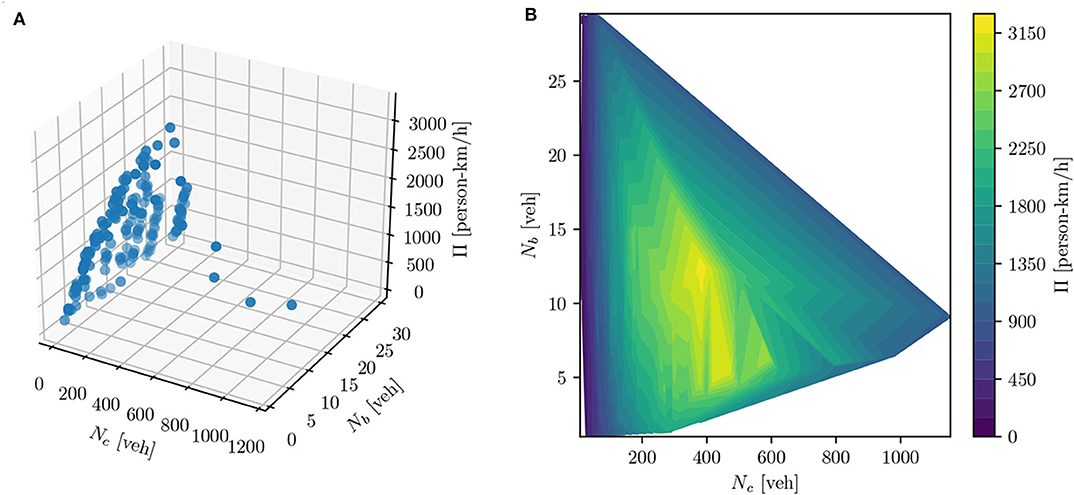
The best solution found corresponds to five bus lines, defined by their routes, bus stops and five different headways per line. The simulation results include the PSP data and allows us to estimate the pMFD. Similar to the procedure presented in section 3.3, we apply the Delaunay triangulation to the corresponding data set. Figure 9 shows the results as scatter and contour plot.
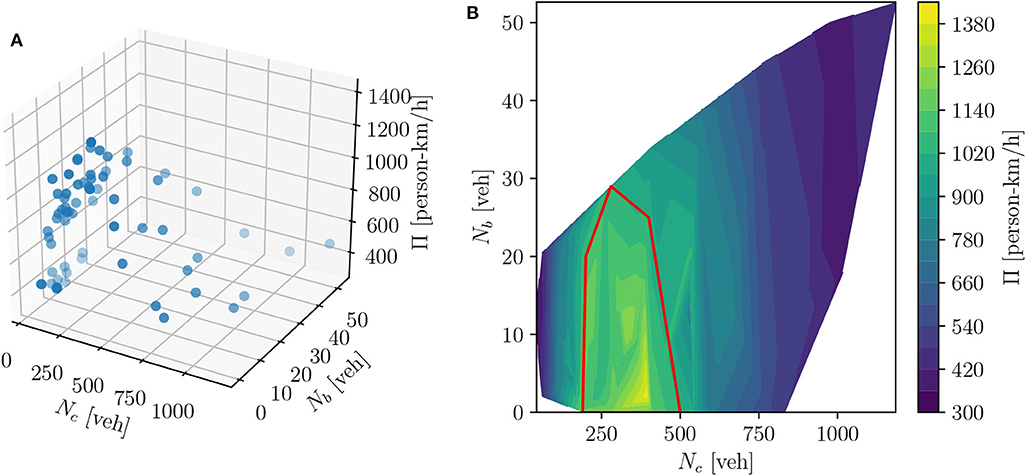
Figure 9. pMFD of the optimized transport system for the Sioux Falls network: scatter plot (A) and contour plot (B).
In both plots, the y-axis displays the network accumulation of buses Nb [veh], and the x-axis the network accumulation of cars Nc [veh]. The z-axis represents the passenger production Π [person-km/h] in the scatter plot. In the contour plot, the dark blue areas illustrate low passenger production values, whereas the bright yellow region shows high passenger production. It can be seen that the general shape of the surface corresponds to the expected shape of the pMFD. For high car and bus accumulations, the passenger production is low. Furthermore, the highest passenger production is observed at non-extreme headways. This implies that bus operation positively contributes to the bi-modal passenger production. In other words, the high capacities of bus vehicles outweigh the potential negative effects of bus vehicles on car traffic. This is in line with previously conducted research on the pMFD (Geroliminis et al., 2014; Loder et al., 2017). Moreover, we highlight the optimal operational regime by a red curve in the contour plot. The enclosed region indicates where the system reaches 80 % of the maximum passenger production. It can be seen that the corresponding range of bus and car vehicle accumulation includes bus accumulations between 0 and 30 vehicles, and car accumulations between 150 to 500 vehicles. These values correspond to 5 min averages. Per definition, the chosen bus lines aim to maximize this region to increase the range of traffic states with reasonably high production. This enables traffic managers more flexibility for operational decisions as it is robust to decent levels of congestion. Moreover, the pMFD can support bus providers in increasing the cost-efficiency of their service. It allows one to derive the optimal headways for certain traffic states, instead of headways depending on the time of day. For example, if the overall production is not significantly decreased by lowering the bus accumulation in the network, headways could be increased to reduce costs. Associated traffic dynamics are already included in the pMFD and are therefore implicitly considered.
The application of the framework results in a network which is shown in Figure 10B. Additionally, we present the bus system presented in Abdulaal and LeBlanc (1979) in Figure 10C. The routes are distinguished by color and line style.
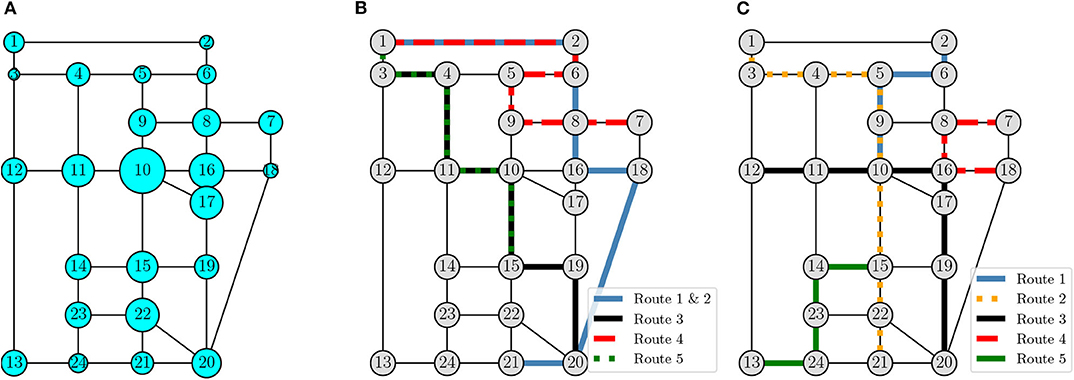
Figure 10. The Sioux Falls network: qualitative demand indication (A), proposed bus system (B), and bus system based on Abdulaal and LeBlanc (1979) (C).
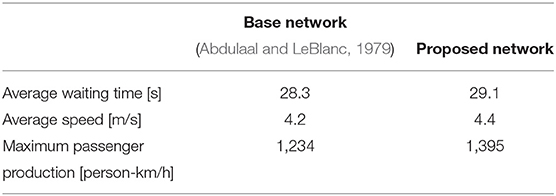
We implement the original scenario in SUMO to compare not only the network topology, but also the passenger production as well as other traditional performance indicators such as average waiting times and speeds. The corresponding results are presented in Table 4.
Comparing the two bus networks based on the network topology (see Figure 10) as well as on the performance indicators listed in Table 4 reveals several differences which are discussed below.
• Network topology: Our solution predominantly covers the upper right part of the network, while the lower left part is not served by any bus line. This leads to the fact that the bus lines corresponding to our solution appear to be highly overlapping. In fact, line 1 and 2 follow the exact same route. This demonstrates that our framework is able to merge two bus routes in order to increase the headway. Also, line 3 and 5 share many links in the respective routes. In contrast, the base network covers the whole network more uniformly. It consists only of two links which are served by two bus lines. While the solution of the proposed methodology might seem counter-intuitive at the first glimpse, it becomes more reasonable once the nature of the pMFD is taken into account. Essentially, the pMFD allows for a compromise between private vehicle and public transport users. Considering the OD relations for Sioux Falls, as qualitatively presented in Figure 10A, it becomes clear that the nodes in the lower left part of the network, e.g., no. 12, 13, 14, 23, and 24, have a below-average demand. These nodes are not directly served by our solution. Please note that persons can still walk to bus stops nearby, walk directly to their destination, or take the car as an alternative. Nodes in the central part such as no. 10, 11, 15, 16, and 17 occur to be highly frequented. All these nodes are served by bus lines in our solution. Furthermore, the top right part of the network has a very low demand in general. Bus lines operating in this area can operate faster and with less disturbances since they will be less affected by congestion. To sum up, our approach takes the street network topology as well as the spatial extend of the demand into account, considers mutual interaction between modes, and designs a system based on these aspects.
• Average speeds: An indicator of interest is the average speed of persons riding a bus or driving in a private vehicle. The analysis of this indicator for both scenarios shows that our proposed solution results in a slight increase of 0.2 m/s per person on average. While this seems to be a low value, it is a substantial increase from the system's perspective.
• Average waiting times: However, the average waiting time per person occurs to be increased in our solution, although at a marginal level. Possible reasons are that persons who walk are not explicitly considered in the passenger production. Thus, this indicator is not optimized within our framework.
• Maximum passenger production: Nevertheless, the maximum passenger production is clearly increased by our solution. While this is not surprising as it plays a major role in the objective function, it shows the benefit of our solution from the system's perspective. A high passenger production is related to a high trip ending rate, and thus to a higher number of people reaching their destination per time interval.
In summary, this section shows that the optimization framework as proposed converges successfully for the case study. Additionally, we visually inspect the resulting pMFD and confirm its meaningfulness. Lastly, we compare the bus network found with our framework to an existing solution reported in Abdulaal and LeBlanc (1979). We discuss the different network topologies, as well as other performance indicators of both systems. We find that the proposed methodology finds a reasonable balance between optimal public transport and car-oriented operation, and improves the system's performance while user related indicators i.e., average speed and average waiting time change only slightly. Thanks to the microscopic nature of the simulation, the interaction between modes can effectively be considered. Furthermore, the microscopic simulation can be run for any reasonable network and demand configuration, and the pMFD can be estimated for any size of PSP data. Thus, our framework applies conceptually to any of such network and demand configurations. The major challenge is the computational burden which becomes more prominent with large-scale networks. Such burden can be tackled by developing more efficient optimization algorithms, which is thus an interesting field of future research. Nevertheless, the results of our study confirm that the pMFD can be integrated into the optimization framework and thus operational aspects can be considered in the strategic design phase. Hence, our framework contributes to a bi-modal network design which considers the competition for limited road space.
6. Conclusion
This paper presents a methodological framework to design a bi-modal transport system. We integrate the concept of the pMFD into a simulation-based optimization. The proposed method successfully maximizes the bi-modal network-wide passenger production and the system's optimal operational regime. Thereby, we are able to consider operational characteristics at the strategic design level. The pMFD is estimated based on trajectories from agents traveling the network. These data are extracted from the multi-modal microscopic traffic simulation SUMO. This simulator allows for generating inter-modal person-specific demand while modeling vehicle interactions on links and at intersections in a detailed manner. Note that our framework is not restricted to specific agent-based multi-modal microscopic simulation software.
First, we investigate the suitability of the multi-modal agent-based simulation environment and its output data for the estimation of the pMFD. This includes the sensitivity of the pMFD to bus line attributes such as the route and the stop sequence. The results indicate that the novel PSP-data based approach (i) represents a suitable technique for estimating the pMFD and (ii) consequently allows the assessment of different bi-modal transport systems. The absence of any data-related assumptions (e.g., ridership based on dwell times) of current estimation techniques avoids corresponding biases in the pMFD estimation. Secondly, a sequential model-based optimization framework is presented. For a given number of buses, the routes and stops are found, and several headways are evaluated. This constitutes a strategic bi-modal transport system design. Thirdly, the framework is tested for the well-known Sioux Falls network for a proof of concept, and compared to an existing bus network. We analyze both bus networks from the system's and the user's perspective.
In summary, we conclude that the pMFD, well founded in traffic flow theory, can be accurately estimated based on PSP data. Moreover, it is a suitable concept for deriving an objective function for simulation-based optimization of bi-modal transport systems. It becomes clear that the consideration of bi-modal interactions is advantageous for the system's performance, while user-centric indicators are only slightly affected. Both modes essentially contribute to the overall passenger production. Therefore, we come to the conclusion that considering these bi-modal traffic dynamics and the competition for limited road space at the strategic level can be beneficial for the performance of the overall system. This line of design can increase the reliability of planned services and thus can support local authorities to manage multi-modal city-wide road-bound traffic.
Future work will relate to the implementation of larger networks, and improved optimization techniques. Generally, the pMFD can be extended to consider other modes such as demand-responsive shuttles, or ride-hailing and ride-pooling systems. Since such modes can be implemented in a microscopic simulator, they can be considered in the proposed optimization framework. Overall, the framework could serve as a helpful decision tool in the question which modes shall be offered by local transport authorities. However, this study has shown that a microscopic simulation-based approach might lead to very high computational costs, which is one of the main drawbacks of the proposed framework. These high costs might be circumnavigated by developing mesoscopic or macroscopic methods to directly map a multi-modal transport system to the pMFD. To assure convergence for larger networks, it would require improved efficiency of the optimization technique. Promising results in the fields of combinatorial optimization point out potential research directions (Lepretre et al., 2019).
Data Availability Statement
The datasets presented in this article are not readily available because the dataset is highly dependent on the problem specification and requires a large storage capacity. Requests to access the datasets should be directed to Z2FicmllbC50aWxnQHR1bS5kZQ==.
Author Contributions
GT, ZU, SA, and FB contributed to conception and design of the study. GT, ZU, and SA contributed to the literature review. GT and SA prepared the simulations. GT prepared the optimization framework. GT, ZU, and SA performed the results analyses. GT, ZU, and SA wrote sections of the manuscript. All authors contributed to manuscript revision, read, and approved the submitted version.
Funding
The author's acknowledge the funds received for open access publication by the TUM Open Access Publishing Fund.
Conflict of Interest
FB acted as a freelancing scientific advisor/program principal investigator for the company TUMCREATE Ltd. ZU-A is employed by the company TUMCREATE Ltd.
The remaining authors declare that the research was conducted in the absence of any commercial or financial relationships that could be construed as a potential conflict of interest.
Acknowledgments
We would like to thank the reviewers for their valuable comments which helped to substantially improve the paper.
References
Abdulaal, M., and LeBlanc, L. J. (1979). Methods for combining modal split and equilibrium assignment models. Transport. Sci. 13, 292–314. doi: 10.1287/trsc.13.4.292
Ambühl, L., and Menendez, M. (2016). Data fusion algorithm for macroscopic fundamental diagram estimation. Transport. Res. C Emerg. Technol. 71, 184–197. doi: 10.1016/j.trc.2016.07.013
Amirgholy, M., Shahabi, M., and Gao, H. O. (2017). Optimal design of sustainable transit systems in congested urban networks: a macroscopic approach. Transport. Res. E Logist. Transport. Rev. 103, 261–285. doi: 10.1016/j.tre.2017.03.006
Ampountolas, K., Zheng, N., and Geroliminis, N. (2017). Macroscopic modelling and robust control of bi-modal multi-region urban road networks. Transport. Res. B Methodol. 104, 616–637. doi: 10.1016/j.trb.2017.05.007
Bartz-Beielstein, T., and Zaefferer, M. (2017). Model-based methods for continuous and discrete global optimization. Appl. Soft Comput. 55, 154–167. doi: 10.1016/j.asoc.2017.01.039
Bingfeng, S., Ming, Z., Xiaobao, Y., and Ziyou, G. (2017). Bi-level programming model for exclusive bus lanes configuration in multimodal traffic network. Transport. Res. Proc. 25, 652–663. doi: 10.1016/j.trpro.2017.05.449
Boyacı, B., and Geroliminis, N. (2011). Estimation of the network capacity for multimodal urban systems. Proc. Soc. Behav. Sci. 16, 803–813. doi: 10.1016/j.sbspro.2011.04.499
Buhmann, M. D. (2003). Radial Basis Functions: Theory and Implementations, Vol. 12. Cambridge: Cambridge University Press. doi: 10.1017/CBO9780511543241
Castrillon, F., and Laval, J. (2018). Impact of buses on the macroscopic fundamental diagram of homogeneous arterial corridors. Transportmetr. B Transport Dyn. 6, 286–301. doi: 10.1080/21680566.2017.1314203
Ceder, A. (2016). Public Transit Planning and Operation: Modeling, Practice and Behavior. Boca Raton, FL: CRC Press. doi: 10.1201/b18689
Chakirov, A., and Fourie, P. J. (2014). Enriched Sioux Falls scenario with dynamic and disaggregate demand. Arbeitsberichte Verkehrs-und Raumplanung 978, 1–39. doi: 10.3929/ethz-b-000080996
Chiabaut, N. (2015). Evaluation of a multimodal urban arterial: the passenger macroscopic fundamental diagram. Transport. Res. B Methodol. 81, 410–420. doi: 10.1016/j.trb.2015.02.005
Christin, D. (2016). Privacy in mobile participatory sensing: current trends and future challenges. J. Syst. Softw. 116, 57–68. doi: 10.1016/j.jss.2015.03.067
Daganzo, C. F. (2005a). A variational formulation of kinematic waves: basic theory and complex boundary conditions. Transport. Res. B Methodol. 39, 187–196. doi: 10.1016/j.trb.2004.04.003
Daganzo, C. F. (2005b). A variational formulation of kinematic waves: solution methods. Transport. Res. B Methodol. 39, 934–950. doi: 10.1016/j.trb.2004.05.003
Daganzo, C. F. (2007). Urban gridlock: macroscopic modeling and mitigation approaches. Transport. Res. B Methodol. 41, 49–62. doi: 10.1016/j.trb.2006.03.001
Daganzo, C. F., and Menendez, M. (2005). “A variational formulation of kinematic waves: bottleneck properties and examples,” in Proceedings of the 16th International Symposium on Transportation and Traffic Theory (College Park Maryland, MD). doi: 10.1016/B978-008044680-6/50020-9
Dakic, I., Ambühl, L., Schümperlin, O., and Menendez, M. (2019). On the modeling of passenger mobility for stochastic bi-modal urban corridors. Transport. Res. C Emerg. Technol. 38, 263–283. doi: 10.1016/j.trpro.2019.05.015
Dakic, I., and Menendez, M. (2018). On the use of lagrangian observations from public transport and probe vehicles to estimate car space-mean speeds in bi-modal urban networks. Transport. Res. C Emerg. Technol. 91, 317–334. doi: 10.1016/j.trc.2018.04.004
Dantsuji, T., Fukuda, D., and Zheng, N. (2019). Simulation-based joint optimization framework for congestion mitigation in multimodal urban network: a macroscopic approach. Transportation 46, 1–25. doi: 10.1007/s11116-019-10074-y
de Berg, M., Cheong, O., van Kreveld, M., and Overmars, M. (2008). “Delaunay triangulations: height interpolation,” in Computational Geometry: Algorithms and Applications, eds M. de Berg, M. van Kreveld, M. Overmars, O. Schwarzkopf (Berlin, Heidelberg: Springer), 191–218. doi: 10.1007/978-3-540-77974-2_9
Desaulniers, G., and Hickman, M. D. (2007). Public transit. Handb. Operat. Res. Manage. Sci. 14, 69–127. doi: 10.1016/S0927-0507(06)14002-5
Efthymiou, A., Barmpounakis, E. N., Efthymiou, D., and Vlahogianni, E. I. (2019). Transportation mode detection from low-power smartphone sensors using tree-based ensembles. J. Big Data Anal. Transport. 1, 57–69. doi: 10.1007/s42421-019-00004-w
Farahani, R. Z., Miandoabchi, E., Szeto, W. Y., and Rashidi, H. (2013). A review of urban transportation network design problems. Eur. J. Oper. Res. 229, 281–302. doi: 10.1016/j.ejor.2013.01.001
Forrester, A., Sobester, A., and Keane, A. (2008). Engineering Design via Surrogate Modelling: A Practical Guide. Chichester, UK: John Wiley & Sons. doi: 10.1002/9780470770801
Geroliminis, N., and Daganzo, C. F. (2008). Existence of urban-scale macroscopic fundamental diagrams: some experimental findings. Transport. Res. B Methodol. 42, 759–770. doi: 10.1016/j.trb.2008.02.002
Geroliminis, N., Zheng, N., and Ampountolas, K. (2014). A three-dimensional macroscopic fundamental diagram for mixed bi-modal urban networks. Transport. Res. C Emerg. Technol. 42, 168–181. doi: 10.1016/j.trc.2014.03.004
Geurts, P., Ernst, D., and Wehenkel, L. (2006). Extremely randomized trees. Mach. Learn. 63, 3–42. doi: 10.1007/s10994-006-6226-1
Gonzales, E. J., and Daganzo, C. F. (2012). Morning commute with competing modes and distributed demand: User equilibrium, system optimum, and pricing. Transport. Res. B Methodol. 46, 1519–1534. doi: 10.1016/j.trb.2012.07.009
Guihaire, V., and Hao, J.-K. (2008). Transit network design and scheduling: a global review. Transport. Res. A Policy Pract. 42, 1251–1273. doi: 10.1016/j.tra.2008.03.011
Halton, J. H. (1964). Algorithm 247: radical-inverse quasi-random point sequence. Commun. ACM 7, 701–702. doi: 10.1145/355588.365104
He, X. (2014). Simulation-based optimization of transportation systems: theory, surrogate models, and applications (Ph.D. thesis). University of Maryland, College Park, MD, United States.
Herman, R., and Prigogine, I. (1979). A two-fluid approach to town traffic. Science 204, 148–151. doi: 10.1126/science.204.4389.148
Huang, C., Zheng, N., and Zhang, J. (2019). Investigation of bimodal macroscopic fundamental diagrams in large-scale urban networks: empirical study with GPS data for Shenzhen city. Transport. Res. Rec. 2673, 114–128. doi: 10.1177/0361198119843472
Hutter, F., Hoos, H. H., and Leyton-Brown, K. (2011). “Sequential model-based optimization for general algorithm configuration,” in International Conference on Learning and Intelligent Optimization (Rome: Springer), 507–523. doi: 10.1007/978-3-642-25566-3_40
Ibarra-Rojas, O. J., Delgado, F., Giesen, R., and Muñoz, J. C. (2015). Planning, operation, and control of bus transport systems: a literature review. Transport. Res. B Methodol. 77, 38–75. doi: 10.1016/j.trb.2015.03.002
Iliopoulou, C., and Kepaptsoglou, K. (2019). Combining ITS and optimization in public transportation planning: state of the art and future research paths. Eur. Transport Res. Rev. 11:27. doi: 10.1186/s12544-019-0365-5
Iliopoulou, C., Kepaptsoglou, K., and Vlahogianni, E. (2019). Metaheuristics for the transit route network design problem: a review and comparative analysis. Public Transport 11, 487–521. doi: 10.1007/s12469-019-00211-2
Jaccard, P. (1901). Distribution de la flore alpine dans le bassin des dranses et dans quelques régions voisines. Bull. Soc. Vaudoise Sci. Nat. 37, 241–272.
Johari, M., Keyvan-Ekbatani, M., and Ngoduy, D. (2020). Impacts of bus stop location and berth number on urban network traffic performance. IET Intell. Transport Syst. 14, 1546–1554. doi: 10.1049/iet-its.2019.0860
Jones, D. R., Schonlau, M., and Welch, W. J. (1998). Efficient global optimization of expensive black-box functions. J. Glob. Optimizat. 13, 455–492. doi: 10.1023/A:1008306431147
Kennedy, J., and Eberhart, R. (1995). “Particle swarm optimization,” in Proceedings of ICNN'95-International Conference on Neural Networks (Perth, WA: IEEE), 1942–1948. doi: 10.1109/ICNN.1995.488968
Kepaptsoglou, K., and Karlaftis, M. (2009). Transit route network design problem. J. Transport. Eng. 135, 491–505. doi: 10.1061/(ASCE)0733-947X(2009)135:8(491)
Kirkpatrick, S., Gelatt, C. D., and Vecchi, M. P. (1983). Optimization by simulated annealing. Science 220, 671–680. doi: 10.1126/science.220.4598.671
Laval, J. A., and Castrillón, F. (2015). Stochastic approximations for the macroscopic fundamental diagram of urban networks. Transport. Res. B Methodol. 81, 904–916. doi: 10.1016/j.trb.2015.09.002
Leclercq, L., and Geroliminis, N. (2013). Estimating MFDs in simple networks with route choice. Transport. Res. B Methodol. 57, 468–484. doi: 10.1016/j.trb.2013.05.005
Lepretre, F., Fonlupt, C., Verel, S., and Marion, V. (2019). “Combinatorial surrogate-assisted optimization for bus stops spacing problem,” in Biennial International Conference on Artificial Evolution (EA 2019) (Mulhouse). doi: 10.1007/978-3-030-45715-0_4
Li, Z.-C., and Wang, Y.-D. (2018). Analysis of multimodal two-dimensional urban system equilibrium for cordon toll pricing and bus service design. Transport. Res. B Methodol. 111, 244–265. doi: 10.1016/j.trb.2018.03.005
Loder, A., Ambühl, L., Menendez, M., and Axhausen, K. W. (2017). Empirics of multi-modal traffic networks-using the 3d macroscopic fundamental diagram. Transport. Res. C Emerg. Technol. 82, 88–101. doi: 10.1016/j.trc.2017.06.009
Loder, A., Ambühl, L., Menendez, M., and Axhausen, K. W. (2019a). Understanding traffic capacity of urban networks. Sci. Rep. 9, 1–10. doi: 10.1038/s41598-019-51539-5
Loder, A., Dakic, I., Bressan, L., Ambuhl, L., Bliemer, M. C., Menendez, M., et al. (2019b). Capturing network properties with a functional form for the multi-modal macroscopic fundamental diagram. Transport. Res. B Methodol. 129, 1–19. doi: 10.1016/j.trb.2019.09.004
Lopez, P. A., Behrisch, M., Bieker-Walz, L., Erdmann, J., Flötteröd, Y.-P., Hilbrich, R., et al. (2018). “Microscopic traffic simulation using sumo,” in The 21st IEEE International Conference on Intelligent Transportation Systems (Maui, HI: IEEE). doi: 10.1109/ITSC.2018.8569938
Mahmassani, H., Williams, J. C., and Herman, R. (1987). “Performance of urban traffic networks,” in Proceedings of the 10th International Symposium on Transportation and Traffic Theory, 1–20.
Mesbah, M., Sarvi, M., Ouveysi, I., and Currie, G. (2011). Optimization of transit priority in the transportation network using a decomposition methodology. Transport. Res. C Emerg. Technol. 19, 363–373. doi: 10.1016/j.trc.2010.05.020
Miandoabchi, E., Farahani, R. Z., Dullaert, W., and Szeto, W. Y. (2012). Hybrid evolutionary metaheuristics for concurrent multi-objective design of urban road and public transit networks. Netw. Spatial Econ. 12, 441–480. doi: 10.1007/s11067-011-9163-x
Müller, J., and Shoemaker, C. A. (2014). Influence of ensemble surrogate models and sampling strategy on the solution quality of algorithms for computationally expensive black-box global optimization problems. J. Glob. Optimizat. 60, 123–144. doi: 10.1007/s10898-014-0184-0
Paipuri, M., and Leclercq, L. (2020). Bi-modal macroscopic traffic dynamics in a single region. Transport. Res. B Methodol. 133, 257–290. doi: 10.1016/j.trb.2020.01.007
Pedregosa, F., Varoquaux, G., Gramfort, A., Michel, V., Thirion, B., Grisel, O., et al. (2011). Scikit-learn: machine learning in Python. J. Mach. Learn. Res. 12, 2825–2830.
Pinto, H. K., Hyland, M. F., Mahmassani, H. S., and Verbas, I. Ö. (2019). Joint design of multimodal transit networks and shared autonomous mobility fleets. Transport. Res. C Emerg. Technol. 113, 2–20. doi: 10.1016/j.trpro.2019.05.007
Preparata, F. P., and Shamos, M. I. (2012). Computational Geometry: An Introduction. New York, NY: Springer Science & Business Media.
Regis, R. G., and Shoemaker, C. A. (2007). A stochastic radial basis function method for the global optimization of expensive functions. Eur. J. Operat. Res. 182, 514–535. doi: 10.1016/j.ejor.2006.08.040
Roca-Riu, M., Menendez, M., Dakic, I., Buehler, S., and Ortigosa, J. (2020). Urban space consumption of cars and buses: an analytical approach. Transportmetr. B Transport Dyn. 8, 237–263. doi: 10.1080/21680566.2020.1749726
Sayyadi, R., and Awasthi, A. (2018). A simulation-based optimisation approach for identifying key determinants for sustainable transportation planning. Int. J. Syst. Sci. Operat. Logist. 5, 161–174. doi: 10.1080/23302674.2016.1244301
Schöbel, A. (2012). Line planning in public transportation: models and methods. OR Spectrum 34, 491–510. doi: 10.1007/s00291-011-0251-6
Spall, J. C. (1992). Multivariate stochastic approximation using a simultaneous perturbation gradient approximation. IEEE Trans. Automat. Control 37, 332–341. doi: 10.1109/9.119632
Sweet, M. (2014). Traffic congestion's economic impacts: evidence from us metropolitan regions. Urban Stud. 51, 2088–2110. doi: 10.1177/0042098013505883
Tilg, G., Amini, S., and Busch, F. (2020). Evaluation of analytical approximation methods for the macroscopic fundamental diagram. Transport. Res. C Emerg. Technol. 114, 1–19. doi: 10.1016/j.trc.2020.02.003
Tilg, G., Yang, K., and Menendez, M. (2018). Evaluating the effects of automated vehicle technology on the capacity of freeway weaving sections. Transport. Res. C Emerg. Technol. 96, 3–21. doi: 10.1016/j.trc.2018.09.014
Tirachini, A. (2019). Ride-hailing, travel behaviour and sustainable mobility: an international review. Transportation 47, 1–37. doi: 10.1007/s11116-019-10070-2
Yao, J., Shi, F., Zhou, Z., and Qin, J. (2012). Combinatorial optimization of exclusive bus lanes and bus frequencies in multi-modal transportation network. J. Transport. Eng. 138, 1422–1429. doi: 10.1061/(ASCE)TE.1943-5436.0000475
Zhang, F., Zheng, N., Yang, H., and Geroliminis, N. (2018). A systematic analysis of multimodal transport systems with road space distribution and responsive bus service. Transport. Res. C Emerg. Technol. 96, 208–230. doi: 10.1016/j.trc.2018.09.009
Zheng, N., Dantsuji, T., Wang, P., and Geroliminis, N. (2017). Macroscopic approach for optimizing road space allocation of bus lanes in multimodal urban networks through simulation analysis. Transport. Res. Rec. 2651, 42–51. doi: 10.3141/2651-05
Zheng, N., and Geroliminis, N. (2013). On the distribution of urban road space for multimodal congested networks. Transport. Res. B Methodol. 57, 326–341. doi: 10.1016/j.trb.2013.06.003
Keywords: macroscopic fundamental diagram, bi-modal transport system, optimization, public transport, agent-based simulation, transport system design
Citation: Tilg G, Ul Abedin Z, Amini S and Busch F (2020) Simulation-Based Design of Urban Bi-modal Transport Systems. Front. Future Transp. 1:581622. doi: 10.3389/ffutr.2020.581622
Received: 10 July 2020; Accepted: 10 November 2020;
Published: 01 December 2020.
Edited by:
Mehdi Keyvan-Ekbatani, University of Canterbury, New ZealandReviewed by:
Vikash Gayah, Pennsylvania State University (PSU), United StatesNan Zheng, Monash University, Australia
Hugo Badia, Royal Institute of Technology, Sweden
Copyright © 2020 Tilg, Ul Abedin, Amini and Busch. This is an open-access article distributed under the terms of the Creative Commons Attribution License (CC BY). The use, distribution or reproduction in other forums is permitted, provided the original author(s) and the copyright owner(s) are credited and that the original publication in this journal is cited, in accordance with accepted academic practice. No use, distribution or reproduction is permitted which does not comply with these terms.
*Correspondence: Gabriel Tilg, Z2FicmllbC50aWxnQHR1bS5kZQ==
 Gabriel Tilg
 Zain Ul Abedin2
 Sasan Amini