 William Rupp1
 Ruoyang Yuan
- 1School of Mechanical, Aerospace and Civil Engineering, University of Sheffield, Sheffield, United Kingdom
- 2Department of Mechanical Power Engineering, Tanta University, Tanta, Egypt
Integrating green hydrogen production with existing oil and gas infrastructure is seen as viable step for the reutilization of oil and gas assets. Green hydrogen production through offshore wind has the potential to extend the lives of these systems, reduce decommissioning costs and provide a source of clean energy. This paper presents an outlook on wind license areas using existing oil and gas infrastructure. Three scenarios are proposed for the conversion of offshore assets into wind turbine sites, including the conversion of a platform into a substation. A methodology is provided to assess the suitability of offshore wind using exclusion criteria and the cessation of production dates for oil and gas infrastructure. This methodology is applied to the UK Exclusive Economic Zone (EEZ), and the results show that 7.4% of the UK EEZ is within the top suitability index for wind turbine development. The cost of green hydrogen production from different offshore locations is estimated to be in the range of 9.78–11.76 £/kgH2 depending on the wind farm scale and the distance. The study highlights the potential for using existing infrastructure for wind turbine development and provides valuable insights for stakeholders in the energy industry.
1 Introduction
Ensuring secure and sustainable energy production has become a global priority, with an emphasis on meeting diverse climate targets by limiting global warming to 1.5°C and achieving global net-zero emissions by 2050 (UK-Government, 2021). The UK has set itself a legally binding target to ensure net carbon production is 100 lower than a 1990 baseline by 2050 (UK-Government, 2008). Various energy production methods exist for clean energy production including wind, solar and tidal. The integration of these technologies into existing grids will significantly reduce hydrocarbon emissions. Sources of clean energy production often present the issue of intermittent production. Wind and solar are intrinsically intermittent sources. Varying both on seasonal, daily, and more refined time scales. Energy storage solutions are required to make consistent use of these systems. This will ensure higher production capacities and the ability to meet user grid energy demand.
Power to gas (P2G), the conversion of energy into hydrogen, is seen as a fundamental system in storing renewable energy production. Co-locating wind resources with green hydrogen production can minimize grid reliance and accelerate P2G scale-up. The key technology to unlocking the potential of P2G is the development of multi megawatt hydrogen electrolysis systems. Long-term storage of hydrogen allows for seasonal fluctuations in energy production to be accounted for. The integration of offshore wind turbines with electrolysis presents an opportunity for sector coupling of renewable energy systems with oil and gas infrastructure. The UK is ideally positioned for the development of these projects due to its strong Oil and Gas (O & G) industry and high offshore wind speeds. Decarbonizing the oil and gas sector is a priority to meet future energy targets. Direct production emissions of upstream oil and gas account for 4% of all UK greenhouse gas emissions (Oil-and-Gas-Authority, 2021a). O & G pipelines and platforms could provide a key opportunity for the development of offshore electrolysis. Utilizing existing infrastructure can reduce decommission and installation costs. Hydrogen pipelines can provide a more efficient pathway for energy transmission than traditional undersea cables (Singlitico et al., 2021). Pilot projects and proposals for system integration have already been developed. Electric grid connections to the shore from wind turbine sites can be omitted which could provide large savings in the cost of offshore wind.
This study proposes a selection process to select suitable areas for offshore wind turbine development for integration with O & G platforms. Previous studies for selecting sites for offshore turbine development do not commonly consider existing O & G offshore infrastructure. Alternative areas for offshore wind development can be exploited if this utilization of O & G assets is addressed. There are a significant number of assets off the UK coastline requiring decisions on their decommissioning or end-of-life plans. Repurposing these assets provides a green pathway to exploit potentially redundant infrastructure. Due to the number of O & G assets, and different scenarios for utilizing offshore wind development in collaboration with O & G assets it is necessary to determine which areas and assets are most suitable. This paper proposes a GIS model to determine the best locations for three distinct scenarios of collaboration between offshore wind and O & G assets. These three scenarios were selected as being the most feasible, commercially viable and discussed through literature.
1.1 Offshore wind development
The UK market holds immense potential for the development of offshore wind turbines (Figure 1). In 2020, 43.1% of the total electricity generated in the country came from renewable sources, with the largest share being produced from offshore wind (Department for Business, 2021). The high average wind speeds and convenient proximity to various energy and electricity markets have encouraged investment in this sector. The use of floating turbine designs has opened up the possibility of exploiting deeper waters for energy generation. However, the placement of wind turbine farms in remote offshore locations presents challenges, such as the high voltage alternating current (HVAC) and high voltage direct current (HVDC) cables, which can result in significant cable transmission losses and the need for multiple substations to manage long distance cabling.
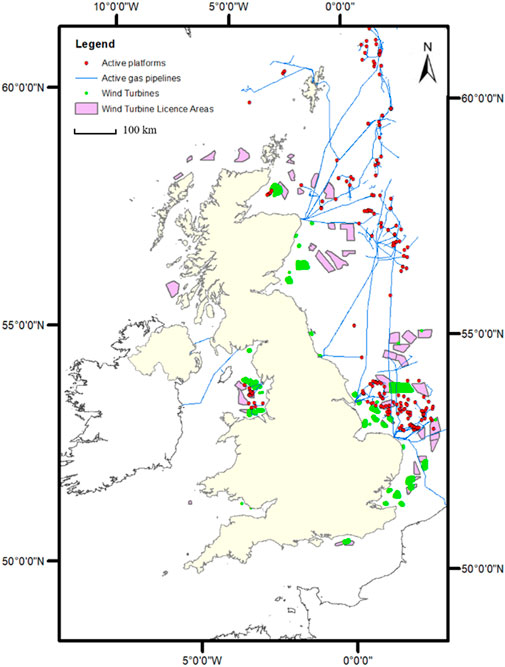
Figure 1. Oil and Gas infrastructure within the UK EEZ along with wind turbine structures and proposed licence areas.
1.2 Hydrogen
1.2.1 Hydrogen production
Currently, the majority of global hydrogen production is achieved through steam methane reforming (Kothari et al., 2008). In this process, natural gas (mainly methane) is combined with steam and subjected to high temperatures and pressures in the presence of a catalyst, usually nickel. The reaction results in the production of hydrogen gas and carbon dioxide. Steam methane reforming is a mature technology that has been in widespread use for several decades and is considered to be the most cost-effective means of producing hydrogen at scale.
Hydrogen is widely used in industrial processes, including petroleum refining and ammonia production. The market for hydrogen is expected to grow, particularly in applications such as industrial heat and power and transport. Three common electrolyzer technologies have been developed, proton exchange membrane water electrolyzers (PEMWE), alkaline water electrolysis (AWE) and solid oxide electrolysis cells (SOEC). Both AWE and PEMWE show high technological readiness for producing “green” hydrogen whilst SOEC is still under development (David et al., 2019).
A major weakness of SOECs is the current high capital expenditure required for smaller sized units when compared to PEMWE and AWE. Additionally, the high temperatures required for SOECs make it far less suitable when combined with intermittent energy production due to the variable start up profiles required. Short-term variability of power (minute time scale) is minor from renewable energy source however power variations within the hour are significant (Meier, 2014). It should be noted that SOECs may give a perfect application when paired with nuclear sources, where there is already a high-temperature source available (Department for Business. (2021)). SOECs have a higher rate of degradation than comparative technologies creating a more frequent need for replacement. PEMWEs achieve higher capacity factors by operating at a higher pressure, limiting the energy required for further hydrogen compression. AWEs currently have a lower investment cost when compared to PEMWEs, 800 to 1,500€/kW compared to 1,400 to 2100€/kW, a longer lifetime and lower maintenance cost (Singlitico et al., 2021; Brauns and Turek, 2020). A key factor that gives PEMWE systems an advantage over AWE is their short start-up time, broad load flexibility and optimal performance from dynamic input. This is vital when integrated with an intermittent and variable load on the electrolyzer. AWE systems are being developed to overcome their issues (Seibel and Kuhlmann, 2018) however these systems are yet to be realised.
PEM electrolyzers are considered the best option for integration with intermittent power sources (Kopp et al., 2017) and can operate at higher pressures, leading to higher capacity factors and lower energy requirements for hydrogen compression. The cost of PEM electrolyzers is estimated to be between £700/kW to £1,300/kW (Brauns and Turek, 2020).
The UK has set a target of producing 5 GW of hydrogen by 2030 from low-carbon sources (HM-Government, 2021). There have been various studies to assess the feasibility of different production pathways for offshore electrolysis, including the construction of dedicated pipelines, integrating electrolyzers into wind turbine structures, subsea hydrogen, and offshore hydrogen islands. Centralized offshore hydrogen production is considered to be the most cost-effective option (Singlitico et al., 2021) within energy hubs. For bulk power transmission over large distances, shipping hydrogen may also be a compelling option (Yan et al., 2021). There have been no proven technological barriers to producing hydrogen offshore (The-O&G-Technology-Centre, 2022), and direct sea water electrolysis (Gao et al., 2022) may overcome the requirements for water desalination.
1.2.2 Hydrogen modelling
Several studies have been undertaken in modelling of hydrogen systems and production pathways. Thommessen et al. used the energy concept to analyse the production, use, storage, and transport of hydrogen within an offshore energy hub (OEH). Several energy pathways for hydrogen were chosen: the production of ammonia through the Haber-Bosch process, storage and the re-electrification of hydrogen and direct transport of hydrogen onshore. Although this study considered pipelines and ship transport as means of transporting ammonia and hydrogen on shore, there was no consideration of existing infrastructure and conversion, and transportation losses were generalized (Thommessen et al., 2021). Yan et al. looked at hydrogen and power generation with respect to five scenarios. Re-electrification of hydrogen was not shown to be viable option (Yan et al., 2021). A detailed cost breakdown of the wind turbines and desalination was considered. This study considered only 100% hydrogen injection into the pipelines, which has not yet been technically proven. The placement of the electrolyzer within an offshore renewable energy hub is an important consideration. Singlitico et al. analyzed the lowest cost of hydrogen based on the location of the electrolyzer. It showed that offshore electrolysis resulted in the lowest cost of hydrogen at 2.4€/kg. This study assumed an artificial island was required for offshore electrolysis (Singlitico et al., 2021).
The Levelized cost of hydrogen (LCOH) gives a simple but effective comparison between varying hydrogen production technologies. It is the discounted lifetime cost of the construction and operating the technology required to produce the hydrogen shown as a cost per unit of energy of hydrogen (£/MWh). It does not cover storage, transport or available revenue streams (Department for Business, 2021). The cost of hydrogen is very dependent on electricity price and capacity factors. High electricity prices and lower capacity factors lead to a larger LCOH (Lucas et al., 2022). Hou et al. investigated the optimum investment opportunities for coupled-wind hydrogen systems. They showed that hydrogen was more valuable directly sold to the consumer than electricity. A variety of scenarios were compared including using power to hydrogen for electricity market arbitrage (Hou et al., 2017). Hybrid systems where low value power is converted into hydrogen and high value power is sold electricity work best in areas of high wind speed where curtailment may hinder deployment (McDonagh et al., 2020). The location is normally one of the most important parameters in many of these studies. For wind farm development the distance to shore and water depth are the primary cost drivers of development (Klinge Jacobsen et al., 2019; Dinh et al., 2023). However there have been no studies specifically on the locating of an OEH. A model including a mapping approach would allow the potential for large areas to be assessed for hydrogen production and create a framework for hydrogen infrastructure development.
The end use for hydrogen produced from renewable energy source is an important consideration. Ferrero et al. analysed this for three different pathways: injection into the natural gas grid, re-electrification, and on-site fuelling of vehicles. The hydrogen compression analysis for this study was modelled using AspenPlus (Ferrero et al., 2016). However, combining too many usages for hydrogen within a system can cumulate losses due to the differing production and distribution infrastructure required in each use (Loisel et al., 2015). Crivellari et al. applied a model to discuss the possibility of offshore power-to-gas and power-to-liquid in a variety of strategies and determined that profitable options were achieved with high electrolyzer capacity and short distances from shore. Simple hydrogen production and transportation into new or existing pipelines was seen as a more feasible option than offshore P2G and power to liquid (P2L) scenarios when applied to a remote area of the North Sea (Crivellari and Cozzani, 2020). Ayodele et al. studied the viability of green hydrogen production in 15 sites within South Africa (Ayodele and Munda, 2019). In a scenario-based analysis of exploiting wind energy within Iran for hydrogen production a 10-year payback period was shown (Rezaei et al., 2021).
There are limited studies from a carbon pricing viewpoint. Carbon pricing reduces emissions through financial incentives and is categorized as a price per ton. The UK emissions trading scheme is used within the UK, the average market price for CO2 was £53.71/ton in 2021 (Investing, 2022). A sensitivity analysis on carbon tax and budget was implemented by Zhang et al. and showed the need for a hard carbon tax for the financial incentive to develop OEHs (Zhang et al., 2022).
1.3 Motivation of the research
The global transition to clean energy is paramount to achieving net-zero emissions by 2050. Offshore oil and gas infrastructure, particularly in regions like the UK North Sea, faces decommissioning costs exceeding £46 billion (Oil-&-Gas-Authority, 2021b). Hence, repurposing the existing offshore infrastructure presents an opportunity to extend the lives of platforms and pipelines while facilitating the development of green hydrogen production. The most promising application is the PosHydon project (Table 1), integrating an electrolyzer on a platform in the North Sea. The platform is connected to the onshore power grid, the power provided to the platform is simulated on the intermittent supply as if connected to an offshore turbine. There are also applications where hydrogen solutions can be used to supply power for hydrocarbon extraction. This may be especially applicable in smaller reservoirs as an alternative to traditional methods, whereby power is supplied from an auxiliary umbilical cable from a larger installation (The-O&G-Technology-Centre, 2022).
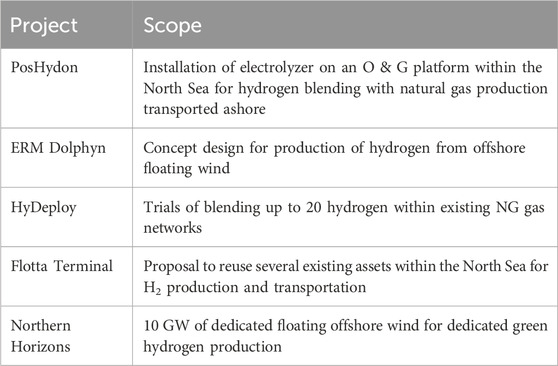
Table 1. Offshore hydrogen projects.
Conversion can either happen during life or at the end-of-life stage of the platform. O & G platform owners must set out measures to decommission their infrastructure, whether this be platforms or pipelines (UK-Government, 2023). Prior to the cessation of production, operators must evaluate all repurposing options. This incl46udes carbon capture storage and hydrogen projects. The evaluation of the infrastructure for these purposes must occur at least 6 years before the cessation of production date (North-Sea-Transition-Authority, 2023). Offshore O & G platforms are commonly clustered in a hub and spoke formation. A centralized platform is connected to various satellite platforms. The platforms have a variety of purposes including production, accommodation, and compression. In the decommissioning process of these assets, wells are often plugged and abandoned. Platform topside structures are commonly cut into smaller parts and transported to shore. Substructures are cut lifted and brought to shore. However, this decommissioning process is often expensive and complicated. The North Sea Transition Authority issues licenses through licensing rounds for O & G installations. Current NSTA regulations require operators to evaluate the re-purposing of their infrastructure for CCS or hydrogen projects through a screening matrix. The aim being to enable energy transition of O & G assets. This process is expected to be undertaken at least 6 years before production is ceased. Using platforms for hydrogen production would require the installation of electrolyzers and associated bill of plant on the platform topside. A complete refurbishment of the whole platform could present challenges.
A variety of issues arise in the transportation of hydrogen by pipelines. Material embrittlement, seal leakage and failure of auxiliary equipment all must be addressed. Two distinct scenarios can be established for the pipeline transportation of hydrogen. Reusing existing pipelines and the development and installation of dedicated hydrogen pipelines and networks. Existing Gas pipelines provide the best solution for hydrogen transport. They are already in use and socially accepted, the conversion costs are cheaper than building new hydrogen pipelines and there are conversion technologies available.
Reusing existing pipelines currently relies on the admixture of hydrogen in natural gas streams. The percentage of hydrogen mix within natural gas is currently limited to 0.1% by UK government regulations. Proposed health and safety England regulations indicate this is expected to increase to 20% (Smith et al., 2022). Transporting pure hydrogen produces various issues. The calorific (volume-based) value of natural gas is around 3 times more than that of hydrogen. Increased compression is needed to transport an equivalent energy flow of hydrogen.
Most offshore O & G pipelines within the North Sea are composed of carbon steel. Limitations on hydrogen operating pressure to 30%–50% of the minimum specified yield strength and pipeline material grade must be considered. 40% of gas pipelines in the South North Sea would be suitable for the transmission of hydrogen (The-O&G-Technology-Centre, 2022). The NSTA has already identified 100 pipelines for hydrogen or carbon capture storage (CCS) development.
1.4 Geographic information systems and multi decision criteria
Geographic Information Systems (GIS) is a technology that enables the management and analysis of spatial data. The system integrates mapping data to provide a comprehensive and interactive representation of geographical information. In the realm of offshore renewable energy, GIS has become a popular tool for the selection and assessment of potential site locations.
GIS methods are often utilized in the initial screening process to identify areas that meet the necessary criteria and eliminate areas that are unsuitable (Table 2). This can be accomplished by applying exclusion zones, weighting criteria and other decision-making parameters based on spatial data. In this way, GIS allows for an objective, data-driven approach to site selection, ensuring that the best locations are chosen for the development of offshore renewable energy projects. Additionally, GIS can also be used to analyze the impact of these projects on the surrounding environment and communities, providing important information for planning and decision-making.
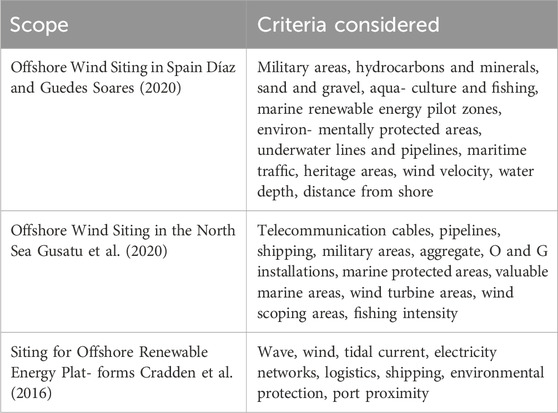
Table 2. Offshore hydrogen projects.
Gusatu et al. (2020) used a GIS method to examine offshore wind site availability within the North Sea. This included the exclusive economic zones (the areas of sea related to a country) of several nations. Four distinct scenarios were proposed based on energy targets and planning propositions. In each scenario, large scale deployment of offshore wind in the North Sea faced large constraints due to the mixed use of spatial areas and competition between other stakeholders. Cradden et al. (2016) applied a multi-criteria selection process within a GIS assessment to sites for renewable energy platform deployment. This study looked at the deployment of multiple offshore energy systems on a single platform. A 0.05° × 0.05° grid was chosen as the resolution for the raster datasets. The parameters were ranked by importance and the final rank for each site calculated as the total sum of all ranks multiplied by their importance. A bespoke model of wind, wave and oceanographic was created. The data was projected over a 10-year period.
A stepwise weight assessment ratio analysis was used by Almutairi et al. (2021) to assess suitable locations for the development of renewable hydrogen production sites. This considered annual wind power generation conversion to hydrogen. Various criteria were assessed, such as access to distribution sites and social acceptance. This study ranked the suitability of large provinces based on their weighted assessment of hydrogen production. A more refined grid study was not developed.
Bahaj et al. (2020) proposed a novel approach to indexing the importance of offshore wind energy sites. The suitability of a cell within a grided map was calculated by multiplication of the sum of the factor weights against their score and by a Boolean mask. The Boolean mask represented excluded areas. One denoting an area is suitable, and 0 denoting an excluded area. A fuzzy membership tool was applied to linearly standardize each factor in the assessment. The UK Offshore Renewable Energy Catapult ORE (2020) mapped suitability for offshore wind within the Celtic Sea. Twelve constraints such as fishing density and shipping routes were weighted against one another. The data was all scaled linearly with a value between 0 and 1. A desirable value was given a value of one and an undesirable a value of zero. Constraints on the site selection were split into two categories. Weighted constraints and hard constraints. Hard constraints equate to excluded zones as common in similar studies. Zoned areas were determined for sites most suitable for development.
Despite significant advances in offshore wind energy and hydrogen electrolysis technologies, there remains a lack of comprehensive studies that integrate GIS to identify optimal locations for such repurposing. Existing research, such as Singlitico et al. (2021), primarily focused on standalone offshore wind-to-hydrogen models without leveraging existing oil and gas infrastructure. Also, Crivellari and Cozzani (2020) discussed offshore power-to-gas strategies but omitted detailed spatial analyses that consider real-world constraints like platform clustering, and exclusion criteria. Conversely, studies such as that of Bahaj et al. (2020) and Gusatu et al. (2020) have utilized GIS for offshore wind site selection, but they rarely address the potential of integrating oil and gas infrastructure into green hydrogen production. Our research bridges this gap by developing a GIS-based suitability model that incorporates exclusion criteria, wind resource data, and oil and gas asset parameters. To our knowledge, this is the first study to apply GIS to systematically assess the feasibility of green hydrogen production within the UK EEZ by leveraging existing offshore oil and gas infrastructure. This localized analysis addresses critical regulatory and spatial challenges unique to the region. By combining these elements, our work provides a realistic framework for identifying and evaluating repurposing opportunities (technically and economically), contributing significantly to the discourse on sustainable energy transition.
2 Methodology
2.1 Multi-criteria decision method
The process of site and asset selection for offshore electrolysis is a complex decision-making process composed of many factors. A multi-criteria decision method (MCDM) allows for the comparison of many criteria to aid a decision process. MCDMs include the Analytical Hierarchy Process (AHP), Technique for Order of Preference by Similarity to Ideal Solution (TOPSIS), and the Best Worst Method (BWM).
The Analytic Hierarchy Process (AHP) (Saaty, 1987) is a structured method for making decisions based on multiple criteria. It starts by defining the decision-making problem and breaking it down into smaller, more manageable components. Next, each component is evaluated based on its relative importance compared to other components (Table 3), and the criteria for each component are also ranked in order of importance.
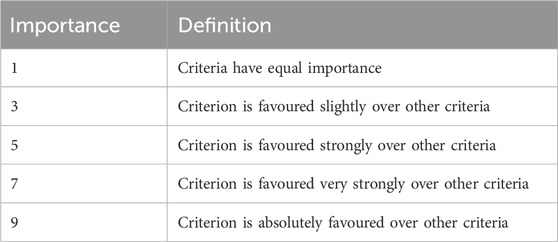
Table 3. AHP importance scale.
The AHP process then employs a mathematical model to synthesize the information and produces a final ranking of the alternatives, indicating the best option for decision-making. This process helps to ensure a systematic and consistent approach to decision-making and provides transparency in the ranking of alternatives. The AHP process is widely used in various fields, including project management, engineering, and healthcare, to make informed decisions based on multiple, conflicting criteria. Within the AHP methodology, the consistency of the comparison is measured using Equations 1, 2. The resulting consistency ratio (CR) should be less than 0.1 to demonstrate a consistent comparison between elements.
Whereby CI is the consistency index developed by T. Saaty (1977), λ defines the relative weights between criteria. n is the number of criteria and RI is the random index. The RI is dependable on the number of criteria.
Na et al. (2017) utilized the AHP method to select suitable assets in the South China Sea for decommissioning alternatives. Three solutions were proposed: Reutilization of the platform, onshore disposal and creating an artificial reef from the structure. Factors such as the integrity of the platform, reservoir potential and age were considered. The weights of each element were selected by experts. The weight of the platform was seen as the most heavily weighted factor to influence decommissioning options.
Díaz and Guedes Soares (2020) compared multiple criteria site selection methods to select development areas for offshore wind where the AHP method was compared against the PROMETHEE, ELECTRE III, TOPSIS, and WSA methods. The locations in their study were all ranked in the same order when each different MCDMs were applied.
In the current study, the AHP method was chosen for criteria ranking and decision-making due to its computational simplicity, ability to handle both quantitative and qualitative data, and high reliability in ensuring consistency in judgments. AHP has been widely applied in energy system problems and GIS-based site suitability studies, demonstrating its adaptability and effectiveness (Adedeji et al., 2020). Furthermore, AHP provides a systematic framework to decompose complex decision problems into hierarchical components, allowing for pairwise comparison and the generation of relative weights that reflect the criteria’s importance (Adedeji et al., 2020). Compared to other MCDM techniques such as TOPSIS or PROMETHEE, AHP’s intuitive and straightforward approach makes it particularly suited for GIS-based renewable energy studies, as evidenced in various studies focusing on wind and solar energy applications (Adedeji et al., 2021).
2.2 Calculation procedures
A three-stage methodology has been applied into the developed model. The first stage of the model applies to the data collection, data collation, projection, rasterization of the data and the application of initial exclusion criteria regarding the geographic and meteorological datasets.
The second stage applies an AHP method to apply a site suitability assessment for offshore wind in relation to oil and gas infrastructure. The UK exclusive economic zone (EEZ) is divided into 0.005° × 0.005° grid squares. The area of sea under UK ownership within its offshore waters.
The third part of the model selects suitable areas for specific repurposing of infrastructure. This includes three scenarios related to the conversion of oil and gas assets.
2.3 First stage
The data used in this study was sourced from various sources and standardized (Table 4). ArcMap 10.7.1 was utilized to process the mapping data, produce datasets, and present results, while MATLAB R2022a was employed for data processing and calculations. MATLAB’s mapping toolbox was extensively utilized to enhance the analysis process. The spatial data was displayed on a grid with a resolution of 0.005° × 0.005°, and in cases where the resolution was not sufficient, linear interpolation was utilized to fit the data onto the required grid depending on the data’s resolution. The study area was restricted to the latitude limits of [52.706, 54.626], longitude limits of [-0.011, 3.169], the UK coastline, and the UK EEZ boundary.
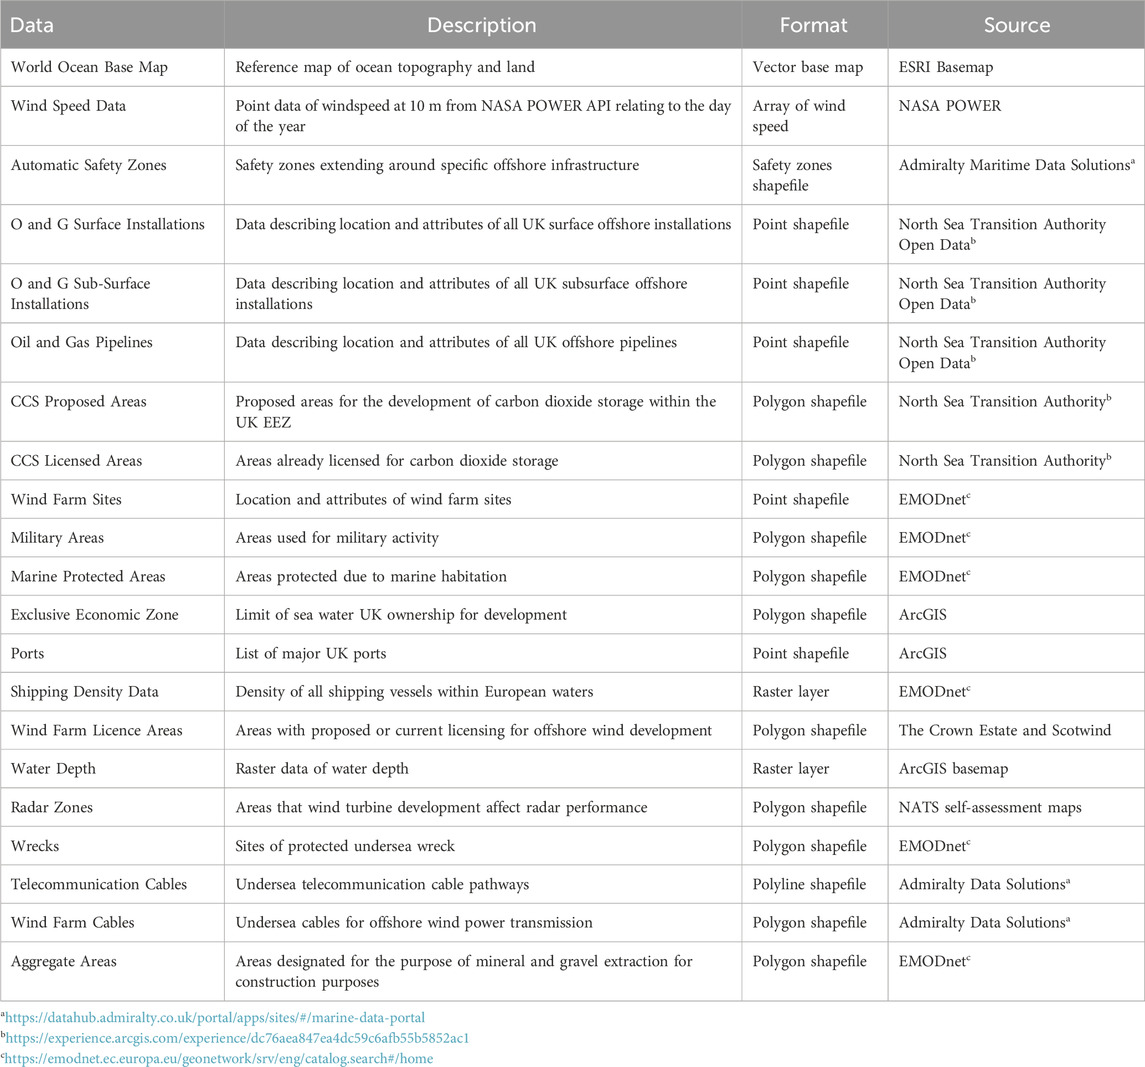
Table 4. Data sources.
A dataset was created in ArcMap, containing various polygon, polyline, point, and raster files. Each dataset was then rasterized and transformed into the WGS 1984 coordinate system. Subsequently, MATLAB was utilized to apply the AHP methodology and analyze the rasterized datasets.
The use of MATLAB over ArcMap offered greater flexibility in terms of viewing and modifying each dataset. Additionally, a custom graphical user interface was created to allow for easy user input into the selection process.
Figure 2 shows a typical wind speed map across the UK EEZ as an example. Wind speed data was obtained from the NASA POWER API at 10 m and converted to the height of wind turbine hubs using the wind profile power law (Equation 3). Daily wind speed information was collected for each point on the 0.05° grid for a reference year (2021), which is the resolution of data from the NASA POWER API. To achieve higher resolution, the data was interpolated onto a 0.005° grid using linear interpolation.
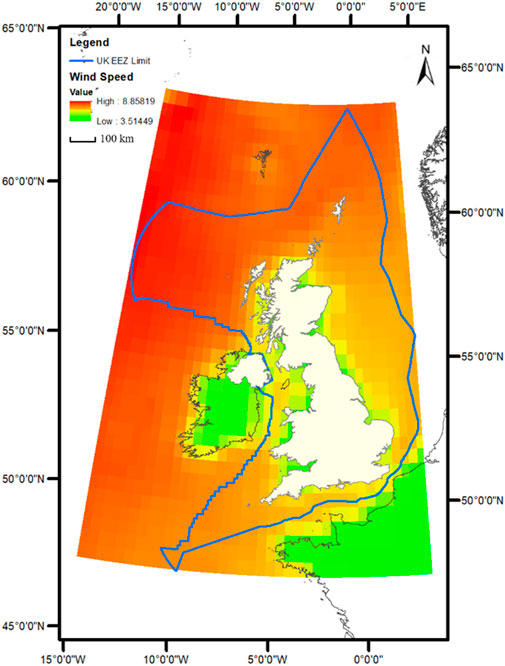
Figure 2. Wind speed across the UK EEZ.
vwt is the wind velocity at wind turbine height and v10m the velocity of wind at 10 m. a is the Hellmann exponent given as 0.10 for neutral air above open sea. The height of the wind turbine (ℎeigℎtwt) in this study is assumed as 50 m.
2.4 Second stage
Once data is collected exclusions are applied (Table 5). The exclusion criteria provide constraints for social, technical, and environmental purposes. Constraints on shipping lanes are applied by filtering the shipping density raster data. This removes areas of high shipping density. The concentration of cells in which there is major shipping density is heavily skewed towards the lower end. Essentially the majority of cells have little shipping activity.
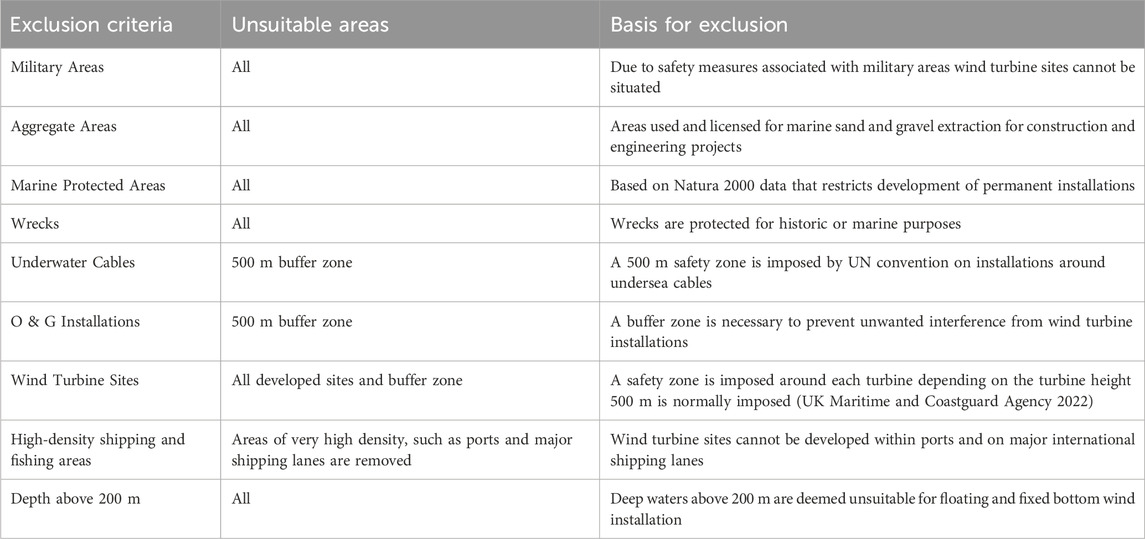
Table 5. Excluded zones.
Other constraints such as environmental impact are based on defined areas within the EEZ from various datasets. The excluded areas are combined from a multi-layer map into a single Boolean mask. The Boolean mask is a 3300 × 3660 logical matrix of which each point represents a point on the grid.
Excluded areas are applied through a Boolean mask. A value of zero is applied to cells within excluded areas.
2.5 Third stage
A decision process must be implemented to compare the various criteria of several sites within the EEZ. An analytical hierarchy process of site selection has been applied. The AHP method requires the input of expert opinion on the pairwise weightings of various criteria. These values have been provided by the Offshore Renewable Energy Catapult. The list of criteria includes wind speed, water depth, distance from shore, distance from port, fishing density, shipping density, radar, tidal current power density, wave power density, and visual impact from turbines from shore at 0–30 km and 30–45 km.
For each cell in the selected area the value of each criterion is provided. This is then scaled linearly or cubically depending on the criterion between a value of 0 and 1. By scaling each criterion between set values allows direct comparison to be made. Wind speed is a key factor in the suitability of a site for wind turbine development. Offshore areas generally have higher average wind speeds than onshore sites. The power available from the wind directly relates to the energy produced. More energy produced provides a lower levelized cost of energy for the same investment. Wind turbine power output is often generalized using power curves related to individual turbines. Wind turbine power curves vary from turbine to turbine so cannot be used when a generalized overview of an area is required. Wind speed can be related to power (P) through the wind speed in a stream of air (Equation 4).
Whereby A is the swept area of a turbine, ρ the density of air and v the wind velocity. Assuming a constant density of air across the EEZ the power can be related to wind speed cubically (Equation 5).
As such wind speed is cubically scaled within the GIS analysis. This provides a more realistic representation than simply scaling linearly. Other criterion affect the site suitability due to environmental, licencing or technical factors. Wind turbine installations can interfere with radar signal through electromagnetic and doppler effects. The generator in the nacelle and rotation of the blades must be considered with regards to interference. Radio waves used for military, metrological and shipping navigation can be adversely affected. Although all current wind turbine sites constructed within the UK EEZ lie within radar areas, additional consultation is required to ensure acceptable interference. A comparison criterion matrix is formed from pair-wise comparison of the criteria. Let A represent the n x n pair-wise matrix (Equation 6):
The matrix A is normalized, and the normalized values (W) are multiplied by the grid value of the criteria (X). The sum of these values provides the suitability of a site. The Boolean mask of excluded areas is applied, and the suitability of the cell can be provided as such (Equation 7).
The suitability of each cell is rescaled between a value of one and 9 to allow for distinct categories of suitability of areas to be determined. Whereby 9 denotes a high suitability and 1 a low suitability.
2.6 Economic analysis
The levelized cost of hydrogen production (LCOH) in £/kgH2 were calculated using Equations 8–10 following the typical discounted cash flow analysis where the break-even hydrogen price is estimated (net present value, NPV = 0).
where
where HHV is the higher heating value of H2 (141.9 MJ/kg). The scale of the plant is determined based on the pipeline capacity where a maximum of 20% mixing ratio of H2 with natural gas is proposed for each of the suggested O&G platforms. The details of the pipelines connected to the selected platforms based on the diameter in inches and the flow capacity in million standard cubic feet (MSCF) are presented in Table 6.
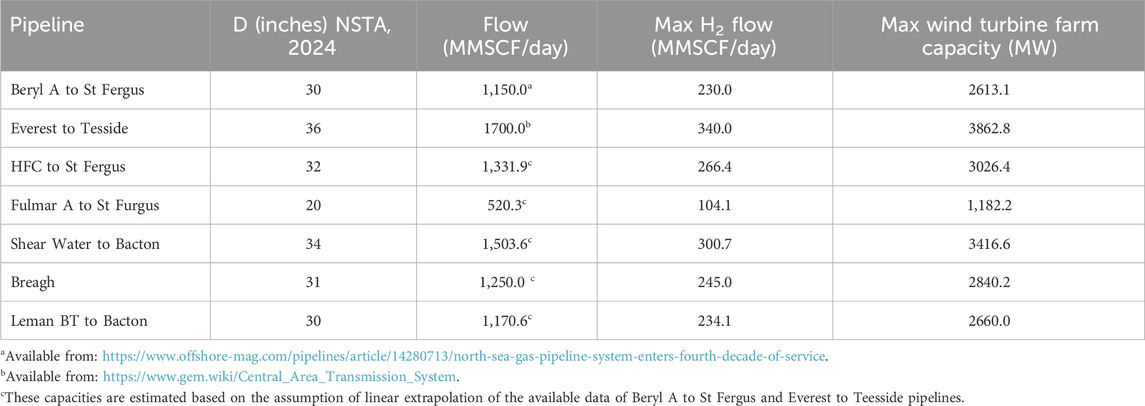
Table 6. Capacity for the selected pipelines and the maximum H2 flow to be transported.
The assumptions employed in the economic analysis are tabulated in Table 7.
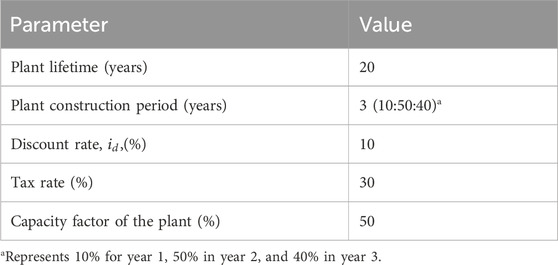
Table 7. Assumption of the techno-economic analysis assessment.
Economic data for calculating equipment cost is outlined in Table 8.
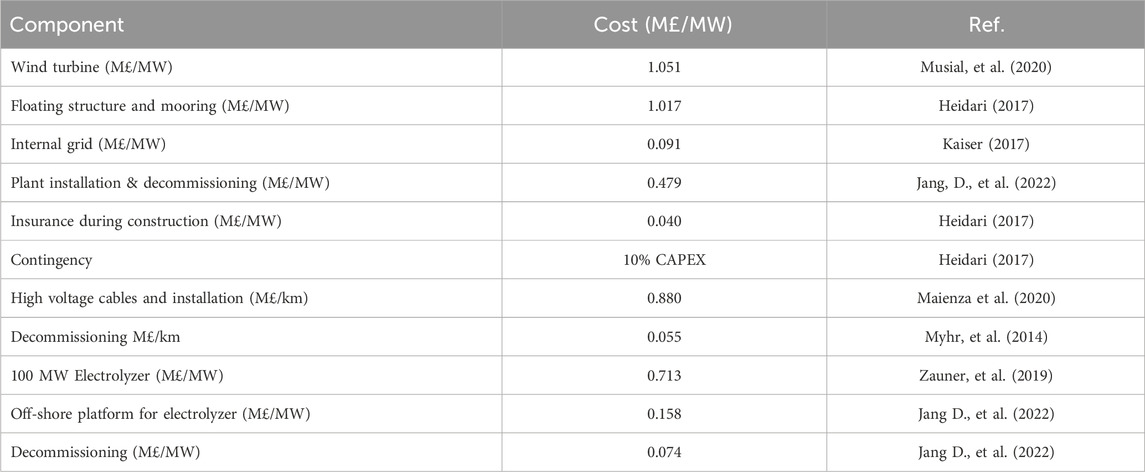
Table 8. CAPEX of the major system components.
The effect of scale and distance from shore on the cost is accounted for by utilising the adjustment factor presented by Higgins and Foley (Higgins and Foley, 2014). A typical scaling factor approach has been employed to estimate equipment and installation costs as shown in Equation 12:
where C is the actual equipment cost, C0 is the base equipment cost at the reference size and distance (160 MW and 45 km (Jang, D., et al., 2022)), S and S0 are the size adjustment factors of the current unit and the reported base unit, respectively, and L and L0 are the adjustment factors for distance from shore. The annualised CAPEX, ACAPEX, can be calculated using Equation 13 (Coppitters et al., 2021):
Regarding the operating expenditure (OPEX), the costs necessary for the are presented in Table 9. The methods for estimating the OPEX that account for the various running costs of operation and maintenance for the different equipment in the system can be found in Table 9.
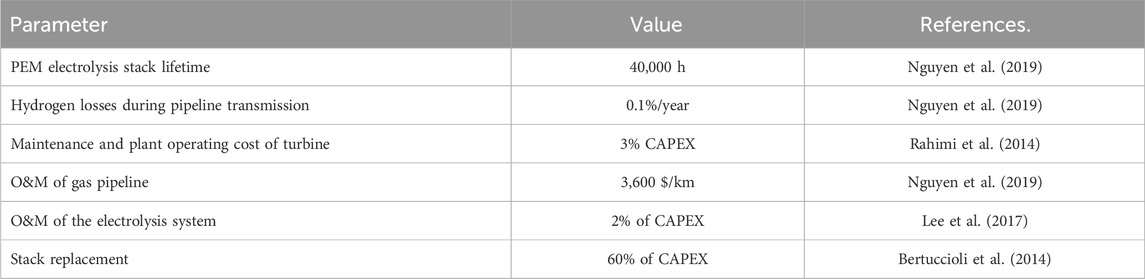
Table 9. OPEX estimation methodology for the plant and the system components.
3 Results
The potential for offshore wind development is thoroughly evaluated by applying exclusion criteria for social, technical, and environmental purposes. This process helps determine the most suitable areas for wind turbine development by taking into account shipping lanes, environmental impact, and the cessation of production dates for oil and gas infrastructure.
The UK Exclusive Economic Zone (EEZ) was analyzed (Figure 3), and 18.9% of the total area was found to be unsuitable for wind turbine development, primarily in the Northwest due to a sudden increase in depth over 200 m. On the other hand, 7.4% of the UK EEZ was identified as having the top suitability index for wind turbine development (Figure 4). Further assessments were carried out to determine proposed license areas in combination with oil and gas infrastructure.
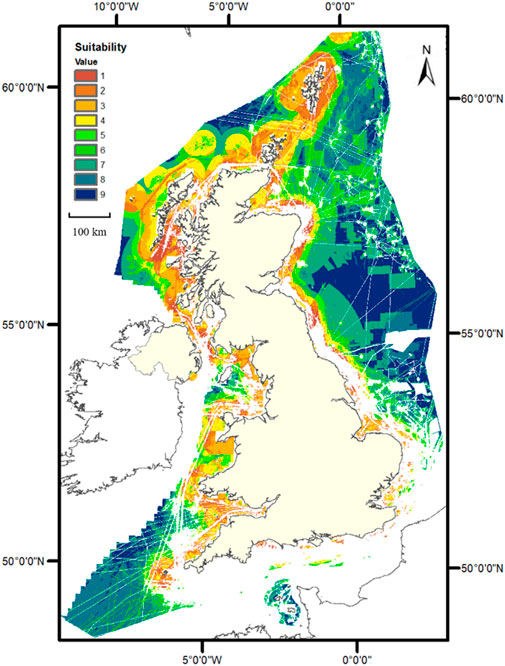
Figure 3. Suitability for offshore wind infrastructure across the UK EEZ.
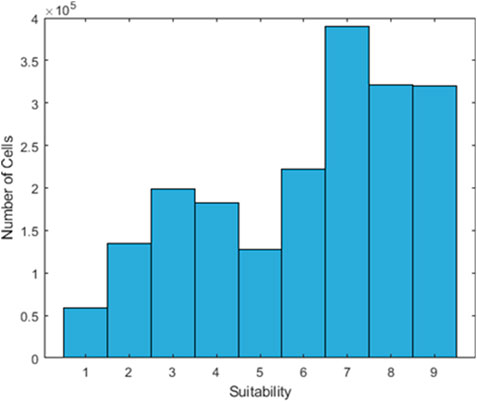
Figure 4. Suitability of cells within the UK EEZ.
Three scenarios have been proposed for the conversion of offshore assets using offshore wind (Figure 5), and key pipeline and platform infrastructure was determined using a selection criteria based on the type of fluid or liquid transferred (Table 10), the age and condition of the infrastructure, and the cessation of production date. Assets that were deemed undesirable were removed from the database. To create suitable wind turbine license areas, a buffer was placed around infrastructure deemed suitable, and areas that were too small for wind turbine farms were excluded. This is especially important for scenario 3, where the platform is converted into a substation for offshore wind, as the area must be large enough to allow for the development of a wind turbine site to make the conversion a feasible proposition. The three scenarios are as follows.
1. Conversion of platform for hydrogen production and transfer of hydrogen through existing gas pipes. For conversion of pipelines, the pipelines must be a gas pipeline in use to allow for natural gas mixing of hydrogen within the network. Platforms must not have ceased production. Pipelines must be active and used for gas purposes.
2. Powering of offshore installations through offshore wind. The platform must not have ceased production to allow for planning options to be evaluated. Platforms must not have ceased production. Pipelines are not assessed.
3. Conversion of platform to offshore wind substation for cabling. To act as a substation, wind turbine substations must be positioned with 3 km of wind turbine sites. To step up 33 kV cables to a single 132 kV cable. BERR, 2008 Platforms must not have ceased production. Pipelines are not assessed.
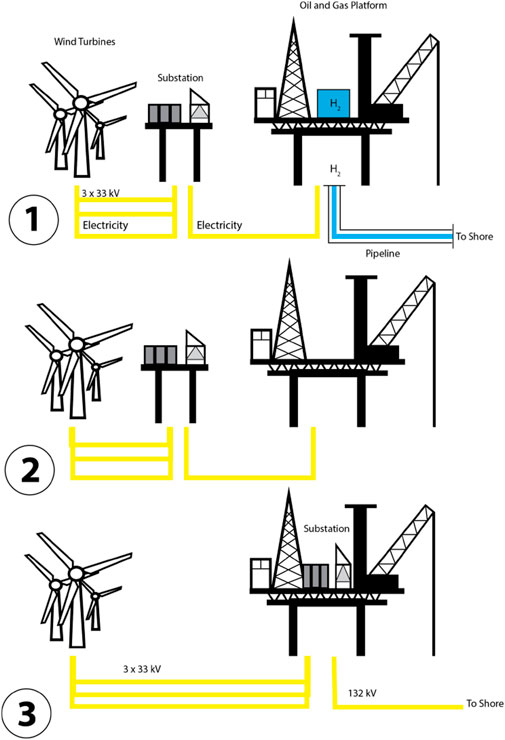
Figure 5. Pathways for oil and gas integration. Scenarios one to 3.
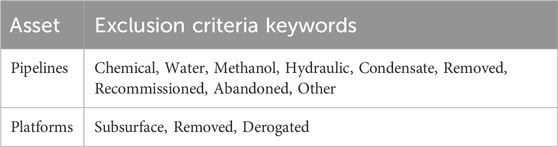
Table 10. Oil and gas infrastructure selection.
3.1 Scenario 1
The selection process for repurposing pipelines and platforms for hydrogen infrastructure has been applied, and a number of key assets have been identified as suitable for this purpose (Figure 6). The utilization of platform conversion and pipelines has resulted in the selection of eight distinct proposed license areas. These areas are located in the North-North Sea, Central North Sea, and South North Sea, and offer a significant opportunity for the development of hydrogen infrastructure. Among the proposed license areas, the Leman BT to Bacton Pipeline is considered to have the most potential for conversion, as it is connected to four suitable platforms that are all operated by Shell (Table 11). These platforms are currently active and are located in a license area of suitable size for conversion. The utilization of these assets could play a significant role in the growth and development of the hydrogen infrastructure industry, providing a sustainable and clean source of energy for the future. The proposed licence areas are distinct from current licenced areas.
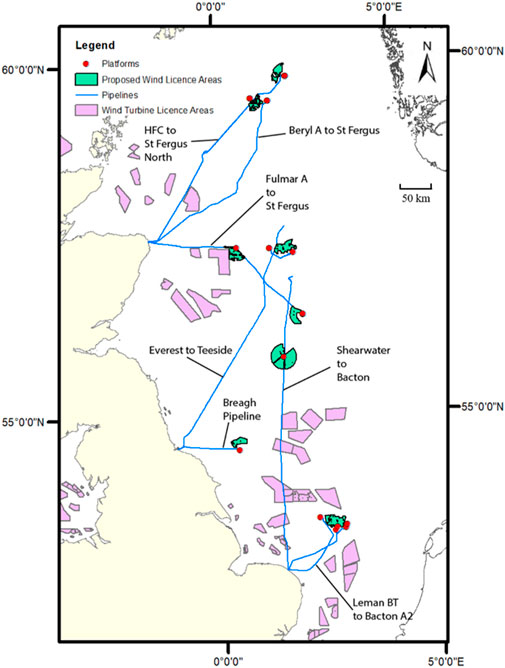
Figure 6. Scenario 1. Wind licence areas related to oil and gas platforms and pipelines.
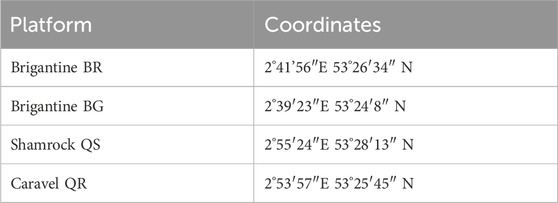
Table 11. Key platforms in the south North Sea for conversion.
This clear distinction shows how other areas that would not be previously deemed suitable may become suitable. One of the main differences is the lack of onshore grid connection and cabling pathways compared to standard wind turbine installations.
Assuming an array spacing, S of wind turbines within the proposed areas, the theoretical number of turbines can be determined. The array spacing S is the effective footprint per turbine, which can be calculated using Equation 14:
Whereby D is turbine rotor diameter, Ld the downwind spacing and Lc the crosswind spacing Sheridan, Baker, Pearre, Firestone and Kempton (2012). The proposed licence areas within scenario one account for 3,199.89 km2. Assuming a wind turbine of diameter of 126 m a crosswind spacing of 5 rotor diameters and a downwind spacing of 10 rotor diameters, S = 0.7938 km2. The number of turbines can be assumed as ≈ 4,000 turbines within these areas.
3.2 Scenario 2
The conversion of platforms for electrification allows platforms to become less reliant on the gas turbines normally used to power them. Full or part electrification reduces greenhouse gas emissions whilst in life. Electrification also can be used to power auxiliary equipment on the platform at the end of life. Normally diesel generators are used at the end of life when gas production has stalled.
Three license areas have been proposed for this purpose (Figure 7), all located in either the South North Sea or the Central North Sea. In the South North Sea, two key license areas have been identified as being suitable for conversion. Directly powering the platform is also seen as a viable option due to the flexibility offered by licensing arrangements. The conversion of platforms will be essential in helping to meet the increasing demand for clean and sustainable energy sources, providing a valuable contribution to the growth of the hydrogen infrastructure industry.
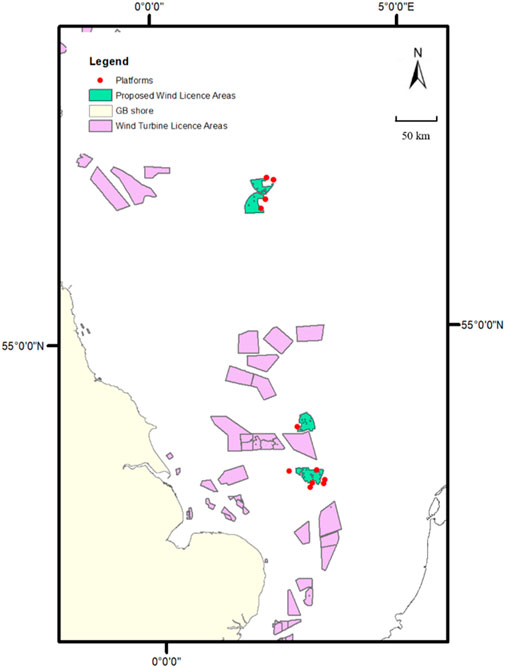
Figure 7. Scenario 2. Proposed Licence areas for platform conversion.
3.3 Scenario 3
The use of platforms as substations presents opportunities, as there are various small areas suitable for this purpose. However, the limited size of these areas makes them unsuitable for the development of large wind turbine farms. To overcome this challenge, less suitable areas may be developed for wind turbines, thereby providing the required suitability. However, these wind turbine farms are still restricted to a maximum distance of 3 km from the platforms (Figure 8). The 500 m buffer zone around all oil and gas installations and the maximum 3 km distance for array cabling limit the maximum viable area to 27.5 km2. Despite these limitations, the use of platforms as substations remains a promising solution, providing a valuable contribution to the growth of the renewable energy industry.
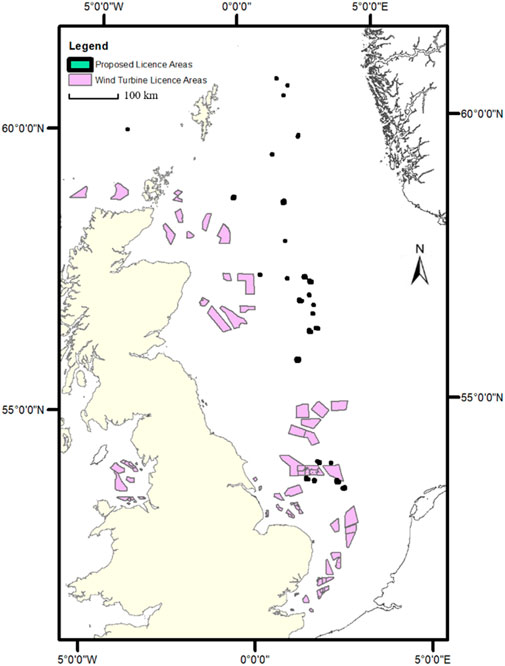
Figure 8. Scenario 3. 3 km Zones for repurposing of infrastructure.
3.4 Economic analysis
The LCOH was calculated to evaluate the feasibility of hydrogen production by repurposing the selected off-shore platforms as presented in Scenario 1. Figure 10 depicts the LCOH at different wind farm scales for the different locations. It is worth mentioning that the change in depth as a function of distance from the shore was reported to be negligible for the UK (Higgins and Foley, 2014). The range of the investigated wind farm scales varied between 500 MW and 4000 MW which covers the calculated capacities for the selected key platforms as previously shown in Table 6. Furthermore, the effect of distance from the shore to the wind farm on the LCOH was studied in the 75–350 km range. This range of distances covers the locations of selected key platforms shown in Figure 9.
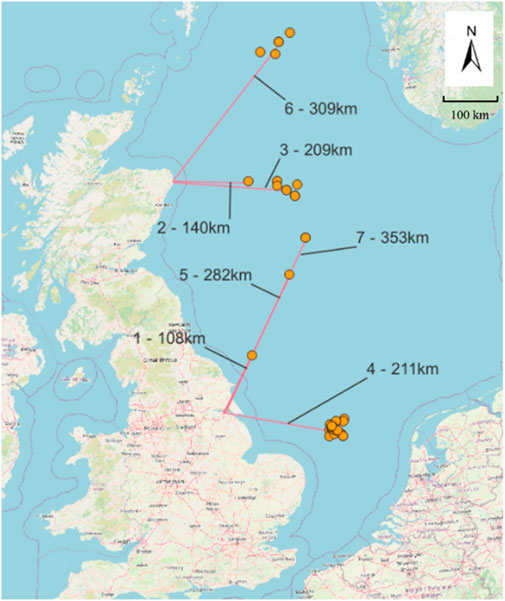
Figure 9. Distances between the key selected platforms for H2 production and the shore.
The estimated LCOH varied between 9.78 and 11.76 £/kgH2 depending on the wind farm scale and the distance as presented in Figure 10 and in the Supplementary Material. This range of the LCOH is less than the cost involving the full installation of a new pipeline between an offshore platform and the coast which was estimated at 14 $/kgH2 for a transportation distance of 45 km (Jang, D., et al., 2022). However, the LCOH of the proposed system in the current study is slightly higher than the blue hydrogen. In this context, the Department for Business, Energy, and Industrial Strategy (BEIS) (currently DESNZ) suggests that the benchmark value for the LCOH is at 7.99 £/kgH2, which goes up to 9.09 £/kgH2 when the CCS approach is employed for the BECCS approach (DESNZ and BEIS, 2021).
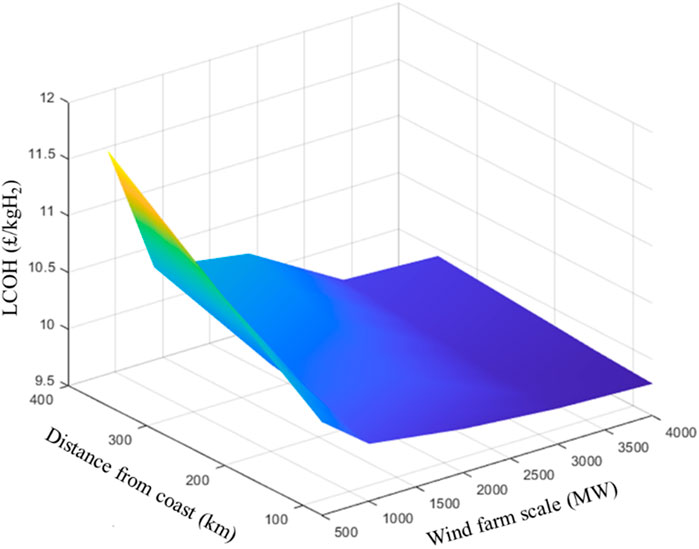
Figure 10. The effect of the wind farm scale and the distance from the coast on the LCOH.
4 Conclusion
Floating wind turbine sites have the potential to unlock the development of deeper waters, but they also bring new challenges, such as the need for longer cabling and the installation of substation platforms in deeper waters, both of which increase the cost of offshore wind. Conversion of offshore oil and gas infrastructure presents an opportunity to decrease these costs. The UK, with its abundant offshore assets, high average wind speeds, developed offshore industry, and investment in clean energy infrastructure, is well-positioned to lead the development of these projects.
This paper presents an overview of alternative licensing pathways for offshore wind development, proposing three scenarios for the conversion of offshore oil and gas infrastructure. The reusing of pipes and platforms in combination with hydrogen production is identified as providing the largest suitable areas for wind development. However, further work is necessary to fully evaluate the viability of these scenarios, as the admixture of hydrogen in the natural gas network is yet to be fully proven. Regulations and licensing related to repurposing offshore infrastructure, end-of-life, and in-life pathways are complex and need to be overcome.
Each platform must be evaluated on a case-by-case basis, taking into account its physical structure, state of derogation, and financial viability. The proposed licensing areas and scenarios may not always be the best option for the development of the area, given the complex and competing uses in the UK Exclusive Economic Zone (EEZ).
Future refinements of this assessment tool should include comparisons with standard offshore wind development using cabling and consider other spatial uses. This paper serves as an initial assessment tool to identify key areas for the three scenarios, providing a starting point for further investigation.
Data availability statement
The original contributions presented in the study are included in the article/Supplementary Material, further inquiries can be directed to the corresponding author.
Author contributions
WR: Data curation, Methodology, Writing–original draft. KR: Writing–original draft, Writing–review and editing, Methodology, Formal Analysis, Investigation. RY: Conceptualization, Funding acquisition, Resources, Supervision, Writing–review and editing.
Funding
The author(s) declare that financial support was received for the research, authorship, and/or publication of this article. The authors would like to acknowledge the funding from the EPSRC DTP (EP/T517835/1) and David Clarke Fellowship (EP/S017259/2). For the purpose of open access, the author has applied a ‘Creative Commons Attribution (CC BY) licence to any Author Accepted Manuscript version arising.
Conflict of interest
The authors declare that the research was conducted in the absence of any commercial or financial relationships that could be construed as a potential conflict of interest.
Publisher’s note
All claims expressed in this article are solely those of the authors and do not necessarily represent those of their affiliated organizations, or those of the publisher, the editors and the reviewers. Any product that may be evaluated in this article, or claim that may be made by its manufacturer, is not guaranteed or endorsed by the publisher.
Supplementary material
The Supplementary Material for this article can be found online at: https://www.frontiersin.org/articles/10.3389/ffuel.2025.1464944/full#supplementary-material
References
Adedeji, P. A., Akinlabi, S. A., Madushele, N., and Olatunji, O. O. (2020). Neuro-fuzzy resource forecast in site suitability assessment for wind and solar energy: a mini review. J. Clean. Prod. 269, 122104. doi:10.1016/j.jclepro.2020.122104
Adedeji, P. A., Akinlabi, S. A., Madushele, N., and Olatunji, O. O. (2021). Beyond site suitability: investigating temporal variability for utility-scale solar-PV using soft computing techniques. Renew. Energy Focus 39, 72–89. doi:10.1016/j.ref.2021.07.008
Almutairi, K., Hosseini Dehshiri, S. S., Hosseini Dehshiri, S. J., Mostafaeipour, A., Jahangiri, M., and Techato, K. (2021). Technical, economic, carbon footprint assessment, and prioritizing stations for hydrogen production using wind energy: a case study. Energy Strategy Rev. 36, 100684. doi:10.1016/j.esr.2021.100684Available at: https://www.sciencedirect.com/science/article/pii/S2211467X21000705.
Authority, N. S. T. (2024). Interactive energy map for the UKCS. Available at: https://experience.arcgis.com/experience/dc76aea847ea4dc59c6afb55b5852ac1.
Ayodele, T. R., and Munda, J. L. (2019). Potential and economic viability of green hydrogen production by water electrolysis using wind energy resources in South Africa. Int. J. Hydrogen Energy 44 (33), 17669–17687. doi:10.1016/j.ijhydene.2019.05.077
Bahaj, A. S., Mahdy, M., Alghamdi, A. S., and Richards, D. J. (2020). New approach to determine the Importance Index for developing offshore wind energy potential sites: supported by UK and Arabian Peninsula case studies potential sites: supported by UK and arabian peninsula case studies. Renew. Energy 152, 441–457. doi:10.1016/j.renene.2019.12.070
DESNZ and BEIS (2021). Department for Energy Security and Net Zero and Department for Business, Energy & Industrial Strategy, Advanced Gasification Technologies – Review and Benchmarking. https://www.gov.uk/government/publications/advanced-gasification-technologies-review-and-benchmarking.
Bertuccioli, L., Chan, A., Hart, D., Lehner, F., Madden, B., and Standen, E. (2014). “Study on development of water electrolysis in the EU,” in Fuel cells and hydrogen joint undertaking, 1–160.
Brauns, J., and Turek, T. (2020). Alkaline water electrolysis powered by renewable energy: a review. Processes 8, 248. Available at: https://www.mdpi.com/2227-9717/8/2/248.doi:10.3390/pr8020248
Coppitters, D., De Paepe, W., and Contino, F. (2021). Robust design optimization of a photovoltaic-battery-heat pump system with thermal storage under aleatory and epistemic uncertainty. Energy 229, 120692. doi:10.1016/j.energy.2021.120692
Cradden, L., Kalogeri, C., Barrios, I. M., Galanis, G., Ingram, D., and Kallos, G. (2016). Multi-criteria site selection for offshore renewable energy platforms. Renew. Energy 87, 791–806. doi:10.1016/j.renene.2015.10.035
Crivellari, A., and Cozzani, V. (2020). Offshore renewable energy exploitation strategies in remote areas by power-to-gas and power-to-liquid conversion. Int. J. Hydrogen Energy 45 (4), 2936–2953. doi:10.1016/j.ijhydene.2019.11.215
David, M., Ocampo-Martínez, C., and Sánchez-Peña, R. (2019). Advances in alkaline water electrolyzers: a review. J. Energy Storage 23, 392–403. doi:10.1016/j.est.2019.03.001
Department for Business (2021). UK energy in brief 2021. Report. Available at: https://www.gov.uk/government/statistics/uk-energy-in-brief-2021.
Díaz, H., and Guedes Soares, C. (2020). An integrated gis approach for site selection of floating offshore wind farms in the atlantic continental european coastline. Renew. Sustain. Energy Rev. 134, 110328. doi:10.1016/j.rser.2020.110328Available at: https://www.sciencedirect.com/science/article/pii/S136403212030616X.
Dinh, Q. V., Dinh, V. N., Mosadeghi, H., Todesco Pereira, P. H., and Leahy, P. G. (2023). A geospatial method for estimating the levelised cost of hydrogen production from offshore wind. Int. J. Hydrogen Energy 48 (40), 15000–15013. doi:10.1016/j.ijhydene.2023.01.016
Ferrero, D., Gamba, M., Lanzini, A., and Santarelli, M. (2016). Power-to-Gas hydrogen: techno-economic assessment of processes towards a multi-purpose energy carrier. Energy Procedia 101, 50–57. doi:10.1016/j.egypro.2016.11.007
Gao, F., Yu, P., and Gao, M. (2022). Seawater electrolysis technologies for green hydrogen production: challenges and opportunities. Curr. Opin. Chem. Eng. 36, 100827. doi:10.1016/j.coche.2022.100827
Gusatu, L., Yamu, C., Zuidema, C., and Faaij, A. P. C. (2020). A spatial analysis of the potentials for offshore wind farm locations in the north sea region: challenges and opportunities. ISPRS Int. J. Geo-Information 9, 96. doi:10.3390/ijgi9020096
Heidari, S. (2017). Economic modelling of floating offshore wind power: calculation of levelized cost of energy. https://www.diva-portal.org/smash/get/diva2:1128321/FULLTEXT01.pdf.
Higgins, P., and Foley, A. (2014). The evolution of offshore wind power in the United Kingdom. Renew. Sustain. energy Rev. 37, 599–612. doi:10.1016/j.rser.2014.05.058
Hou, P., Enevoldsen, P., Eichman, J., Hu, W., Jacobson, M. Z., and Chen, Z. (2017). Optimizing investments in coupled offshore wind -electrolytic hydrogen storage systems in Denmark. J. Power Sources 359, 186–197. doi:10.1016/j.jpowsour.2017.05.048
Accessed Investing, U. (2022). Carbon emissions futures. Available at: https://uk.investing.com/commodities/carbon-emissions-historical-data February 15, 2022).
Jang, D., Kim, K., Kim, K. H., and Kang, S. (2022). Techno-economic analysis and Monte Carlo simulation for green hydrogen production using offshore wind power plant. Energy Convers. Manag. 263, 115695. doi:10.1016/j.enconman.2022.115695
Kaiser, M. J. (2017). Offshore pipeline construction cost in the U.S. Gulf of Mexico. Mar. Policy 82, 147–166. doi:10.1016/j.marpol.2017.05.003
Klinge Jacobsen, H., Hevia-Koch, P., and Wolter, C. (2019). Nearshore and offshore wind development: costs and competitive advantage exemplified by nearshore wind in Denmark. Energy Sustain. Dev. 50, 91–100. doi:10.1016/j.esd.2019.03.006
Kopp, M., Coleman, D., Stiller, C., Scheffer, K., Aichinger, J., and Scheppat, B. (2017). Energiepark mainz: technical and economic analysis of the worldwide largest power-to-gas plant with pem electrolysis. Int. J. Hydrogen Energy 42, 13311–13320. doi:10.1016/j.ijhydene.2016.12.145Available at: https://www.sciencedirect.com/science/article/pii/S0360319917300083.
Kothari, R., Buddhi, D., and Sawhney, R. L. (2008). Comparison of environmental and economic aspects of various hydrogen production methods. Renew. Sustain. Energy Rev. Sustain. Energy Rev. 12, 553–563. doi:10.1016/j.rser.2006.07.012
Lee, B., Heo, J., Choi, N. H., Moon, C., Moon, S., and Lim, H. (2017). Economic evaluation with uncertainty analysis using a Monte-Carlo simulation method for hydrogen production from high pressure PEM water electrolysis in Korea. Int. J. Hydrogen Energy 42 (39), 24612–24619. doi:10.1016/j.ijhydene.2017.08.033
Loisel, R., Baranger, L., Chemouri, N., Spinu, S., and Pardo, S. (2015). Economic evaluation of hybrid off-shore wind power and hydrogen storage system. Int. J. Hydrogen Energy 40, 6727–6739. doi:10.1016/j.ijhydene.2015.03.117
Lucas, T. R., Ferreira, A. F., Santos Pereira, R., and Alves, M. (2022). Hydrogen production from the WindFloat Atlantic offshore wind farm: a techno-economic analysis. Appl. Energy 310, 118481. doi:10.1016/j.apenergy.2021.118481
Maienza, C., Avossa, A., Ricciardelli, F., Coiro, D., Troise, G., and Georgakis, C. (2020). A life cycle cost model for floating offshore wind farms. Appl. Energy 266, 114716. doi:10.1016/j.apenergy.2020.114716
McDonagh, S., Ahmed, S., Desmond, C., and Murphy, J. D. (2020). Hydrogen from offshore wind: investor perspective on the profitability of a hybrid system including for curtailment. Appl. Energy 265, 114732. doi:10.1016/j.apenergy.2020.114732
Meier, K. (2014). Hydrogen production with sea water electrolysis using Norwegian offshore wind energy potentials. Int. J. Energy Environ. Eng. 5 (2-3), 104. doi:10.1007/s40095-014-0104-6
Musial, W. D., Beiter, P. C., and Nunemaker, J. (2020). Cost of floating offshore wind energy using new england aqua ventus concrete semisubmersible technology. Golden, CO United States: National Renewable Energy Lab NREL.
Myhr, A., Bjerkseter, C., Ågotnes, A., and Nygaard, T. A. (2014). Levelised cost of energy for offshore floating wind turbines in a life cycle perspective. Renew. Energy 66, 714–728. doi:10.1016/j.renene.2014.01.017
Na, K. L., Lee, H., Liew, M. s., and Wan Abdullah Zawawi, N. A. (2017). An expert knowledge based decommissioning alternative selection system for fixed oil and gas assets in the south China sea. Ocean. Eng. 130, 645–658. doi:10.1016/j.oceaneng.2016.11.053
Nguyen, T., Abdin, Z., Holm, T., and Mérida, W. (2019). Grid-connected hydrogen production via large-scale water electrolysis. Energy Convers. Manag. 200, 112108. doi:10.1016/j.enconman.2019.112108
Nikolaidis, P., and Poullikkas, A. (2017). A comparative overview of hydrogen production processes. Renew. Sustain. Energy Rev. 67, 597–611. doi:10.1016/j.rser.2016.09.044
North-Sea-Transition-Authority (2023). Available at: https://www.nstauthority.co.uk/decommissioning/repurposing/ (Accessed March 1, 2023).
Oil-&-Gas-Authority (2021a). Emissions monitoring report. Report. Available at: https://www.nstauthority.co.uk/media/7809/emissions-report_141021.pdf (Accessed March 1, 2023).
ORE (2020). Floating offshore wind constraint mapping in the celtic sea. Report. Available at: https://ore.catapult.org.uk/.
Rahimi, S., Meratizaman, M., Monadizadeh, S., and Amidpour, M. (2014). Techno-economic analysis of wind turbine–PEM (polymer electrolyte membrane) fuel cell hybrid system in standalone area. Energy 67, 381–396. doi:10.1016/j.energy.2014.01.072
BERR (2008). Review of cabling techniques and environmental effect applicable to the offshore wind farm industry. Report.
Rezaei, M., Khalilpour, K., and Mohamed, M. (2021). Co-production of electricity and hydrogen from wind: a comprehensive scenario-based techno-economic analysis. Int. J. Hydrogen Energy 46, 18242–18256. doi:10.1016/j.ijhydene.2021.03.004
Saaty, R. W. (1987). The analytic hierarchy process—what it is and how it is used. Math. Model. 9, 161–176. Available at: https://www.sciencedirect.com/science/article/pii/0270025587904738.doi:10.1016/0270-0255(87)90473-8
Saaty, T. L. (1977). A scaling method for priorities in hierarchical structures. J. Math. Psychol. 15, 234–281. Available at: https://www.sciencedirect.com/science/article/pii/0022249677900335.doi:10.1016/0022-2496(77)90033-5
Seibel, C., and Kuhlmann, J.-W. (2018). Dynamic water electrolysis in cross-sectoral processes. Chem. Ing. Tech. 90 (10), 1430–1436. doi:10.1002/cite.201800114
Sheridan, B., Baker, S. D., Pearre, N. S., Firestone, J., and Kempton, W. (2012). Calculating the offshore wind power resource: robust assessment methods applied to the u.s. atlantic coast. Renew. Energy 43, 224–233. doi:10.1016/j.renene.2011.11.029Available at: https://www.sciencedirect.com/science/article/pii/S0960148111006318.
Singlitico, A., Østergaard, J., and Chatzivasileiadis, S. (2021). Onshore, offshore or in-turbine electrolysis? techno-economic overview of alternative integration designs for green hydrogen production into offshore wind power hubs. Renew. Sustain. Energy Transition 1. 100005. doi:10.1016/j.rset.2021.100005
Smith, C., Mouli-Castillo, J., van der Horst, D., Haszeldine, S., and Lane, M. (2022). Towards a 100% hydrogen domestic gas network: regulatory and commercial barriers to the first demonstrator project in the United Kingdom. Int. J. Hydrogen Energy 47, 23071–23083. doi:10.1016/j.ijhydene.2022.05.123
The-O&G-Technology-Centre, (2022). Delivery of an offshore hydrogen supply programme via industrial trials at the Flotta Terminal. Clim. change Act. 2008. Available at: https://www.legislation.gov.uk/ukpga/2008/27/contents (Accessed March 1, 2023).
Thommessen, C., Otto, M., Nigbur, F., Roes, J., and Heinzel, A. (2021). Techno-economic system analysis of an offshore energy hub with an outlook on electrofuel applications. Smart Energy 3, 100027. doi:10.1016/j.segy.2021.100027
UK-Government (2021). Cop26 goals. Available at: https://ukcop26.org/cop26-goals/ (Accessed March 1, 2023).
UK-Government (2022). MGN 372 amendment 1 (M+F) safety of navigation: guidance to mariners operating in the vicinity of UK offshore renewable energy installations (OREIs). Available at: https://www.gov.uk/government/publications/mgn-372-amendment-1-mf-guidance-to-mariners-operating-in-vicinity-of-uk-oreis/mgn-372-amendment-1-mf-safety-of-navigation-guidance-to-mariners-operating-in-the-vicinity-of-uk-offshore-renewable-energy-installations-oreis#more-information (Accessed March 1, 2023).
UK-Government (2023). Oil and gas: decommissioning of offshore installations and pipelines. Available at: https://www.gov.uk/guidance/oil-and-gas-decommissioning-of-offshore-installations-and-pipelines (Accessed March 1, 2023).
UK-Government (2008). Climate change act 2008. Available at: https://www.legislation.gov.uk/ukpga/2008/27/contents.
Yan, Y., Zhang, H., Liao, Q., Liang, Y., and Yan, J. (2021). Roadmap to hybrid offshore system with hydrogen and power co-generation. Energy Convers. Manag. 247, 114690. doi:10.1016/j.enconman.2021.114690
Zauner, A., Böhm, H., Rosenfeld, D. C., and Tichler, R. (2019).“Innovative large-scale energy storage technologies and Power-to-Gas concepts after optimization,” in Analysis on future technology options and on techno-economic optimization2019.
Keywords: hydrogen, offshore wind, geographic information systems, LCOH, repurposing offshore O&G
Citation: Rupp W, Rabea K and Yuan R (2025) A geographic information systems selection approach to repurposing offshore oil & gas assets for green hydrogen production. Front. Fuels. 3:1464944. doi: 10.3389/ffuel.2025.1464944
Received: 15 July 2024; Accepted: 24 January 2025;
Published: 24 February 2025.
Edited by:
Ioannis Karathanassis, City University of London, United KingdomReviewed by:
Olumide Towoju, Lead City University, NigeriaPaul Adedeji, University of Johannesburg, South Africa
Copyright © 2025 Rupp, Rabea and Yuan. This is an open-access article distributed under the terms of the Creative Commons Attribution License (CC BY). The use, distribution or reproduction in other forums is permitted, provided the original author(s) and the copyright owner(s) are credited and that the original publication in this journal is cited, in accordance with accepted academic practice. No use, distribution or reproduction is permitted which does not comply with these terms.
*Correspondence: Ruoyang Yuan, cnVveWFuZy55dWFuQHNoZWZmaWVsZC5hYy51aw==