- 1Department of Mechanical Engineering, Colorado State University, Fort Collins, CO, United States
- 2Caterpillar Inc., Peoria, IL, United States
- 3Southern California Gas Company, Monterey Park, CA, United States
Interest in hydrogen (H2) fuels is growing, with industry planning to produce it with stranded or excess energy from renewable sources in the future. Natural gas (NG) utility companies are now taking action to blend H2 into their preexisting pipelines to reduce greenhouse gas (GHG) emissions from burning NG. Stoichiometric (“rich burn”) NG engines that operate on pipeline NG and will receive blended fuel as more gas utilities expand H2 production. These engines are typically chosen for their low emissions owing to the 3-way catalyst control, so the focus of this paper is on the change in emissions like carbon monoxide (CO) and nitrogen oxides (NOx) as the fuel is blended with up to 30% H2 by volume. The Caterpillar CG137-8 natural gas engine used for testing was originally designed for industrial gas compression applications and is a good representative for most “rich burn” engines used across industry for applications such as power generation, gas compression, and water pumping. A significant greenhouse gas (GHG) emissions reduction is observed as more H2 is added to the fuel. Increasing H2 in the fuel changes combustion behavior in the cylinder, resulting in faster ignition and higher cylinder pressures, which increase engine-out NOx emissions. Post-catalyst CO and NOx both decrease slightly with increasing H2 while operating at the optimal “air-fuel” equivalence ratio (λ). A “rich burn” engine with 3-way catalyst can tolerate up to 30% H2 (by vol.) while still meeting NOx and CO emissions limits. However, at elevated levels of H2, increased engine-out NOx emissions narrow the λ range of operation. As H2 is added to NG pipelines, some “rich burn” engine systems may require larger catalysts or more precise λ control to accommodate the increased NOx production associated with a H2-NG blend. Sudden step-increases in H2 cause dramatic changes in λ, resulting in large emissions of post-catalyst NOx during the transition. Comparable changes in H2 at elevated concentrations cause larger spikes in NOx than at lower concentrations. Better tuned engine controllers respond more quickly and produce less NOx during H2 step-transitions.
1 Introduction
Spark ignited stoichiometric (“rich burn”) natural gas engines with 3-way catalysts are known for having low emissions of nitrogen oxides (NOx), carbon monoxide (CO), and unburned hydrocarbons (THCs). These engines only achieve their superior emissions performance by operating in a narrow range of “air-fuel” equivalence ratios (λ or “lambda”) for the 3-way catalyst to reduce NOx and CO emissions. The goal of this research is to observe the changes in emissions as hydrogen gas (H2) is blended into the natural gas (NG) fuel supply of a rich burn engine set.
Interest in H2 fuel blending is rising as a solution to substitute hydrocarbon fuel and thus reduce carbon emissions. The US Department of Energy is funding many initiatives working towards this goal, with $9.5 billion dollars set aside for clean H2 initiatives in a new infrastructure law released in 2022 (DOE, 2022). Hydrogen blending in natural gas pipelines is being explored as a way to transport H2 fuel on a large scale. The US department of Energy’s Hyblend initiative was created to provide up to $15 million dollars in funding toward this goal (HyBlend, 2023).
Southern California Gas, a Sempra company and the largest natural gas distribution utility in the US has stated their mission to reach net zero greenhouse gas emissions by the year 2045 (Climate Commitment to Net Zero 2045, 2021). In 2020 they set up an H2 blending demonstration program to verify the integrity of distribution systems with the goal of blending up to 20% H2 into pipeline natural gas (Petrizzo, 2020). The purpose of this research project was to assess the impact on emissions from “rich burn” engine sets with 3-way catalysts when blending H2 with natural gas.
Stoichiometric engines, also called “rich burn” engines, operate with a ratio of air to fuel that is stoichiometrically balanced to consume all reactants. These engines typically operate with 3-way catalysts in the exhaust stream to reduce emissions of nitrogen oxides (NOx), carbon monoxide (CO), and unburned hydrocarbons (HCs). Stoichiometric engines with catalysts are very common in the automotive industry, where the catalyst is typically referred to as a “catalytic converter” (Kirkpatrick, 2021); however, these systems are relatively new in the industrial natural gas sector. The designation “rich burn” is often used for stoichiometric industrial natural gas engines because the optimal λ value is slightly rich of stoichiometric compared to automotive gasoline engines with 3-way catalysts.
The 3-way catalysts used with rich burn engines are very effective at reducing emissions of NOx and CO to incredibly low levels, making rich burn engine-sets an excellent choice for minimal emissions (Einewall et al., 2005). These engine systems require precise proportions of NOx to CO in the exhaust stream for the catalyst to properly function. To maintain the correct proportion of exhaust constituents, stoichiometric engines with 3-way catalysts “operate in tight ranges of air-fuel (A/F) ratios, where small variations have large effects on the emissions” (Defoort et al., 2004). Disrupting the ratio of NOx to CO in the exhaust could cause the 3-way catalyst to malfunction, resulting in high emissions of NOx or CO.
Lean burn engines are the primary focus of most current H2-NG blending research because they are more widely used on NG interstate pipelines. However, there are some rich burn engine-sets used by pipeline companies or their customers that consume pipeline natural gas fuel, and large numbers of rich burn engines in the midstream sector, closer to the wellhead. When H2 is eventually blended into large natural gas pipeline networks, these rich burn engine sets will need to run with the new fuel blend while still meeting their emissions goals.
Blending H2 gas with natural gas has been shown to increase the reactivity of the fuel, decreasing ignition delay (Gersen et al., 2008), and increasing flame speed (Brower et al., 2013). Zhen et al. found that the increased speed of combustion allowed for more complete oxidation of the fuel, producing less unburned hydrocarbons and CO as more H2 was used (Ghotge and Olsen, 2015). Elevated NOx emissions is also a common observation with H2-NG fuel blending. Akansu et al. observed an increase of NOx with an increase of H2, attributing this to the increased flame temperature of the fuel mixture (Akansu et al., 2007). If H2 blending increases NOx and decreases CO production by the engine too much, then there is potential for poor 3-way catalyst performance as their proportions change.
The objective of this research was to blend H2 fuel into the natural gas fuel supply for a “rich burn” engine with a 3-way catalyst, and to observe the changes in exhaust chemistry for various concentrations of H2. Testing from this research validated that natural gas rich burn engine sets can operate normally with blended H2-NG fuel at least up to 30% H2 by volume while still meeting emissions goals. Increased NOx and decreased CO in the exhaust resulting from increased H2 in the fuel lead to a narrowed window of operation for air-fuel equivalence ratio. Finally, sudden increases of H2 in the fuel caused the engine to briefly run lean, leading to temporary large emissions of NOx.
2 Materials and methods
Testing for this research was conducted on a Caterpillar CG137-8 spark ignited stoichiometric natural gas engine operating with a 3-way catalyst. The CG137-8 is an industrial engine designed to be flexible in fuel constituents, making it ideal for variable fuel testing. Engine test cell specifications are shown in Table 1, and an image of the engine test cell is shown in Figure 1.
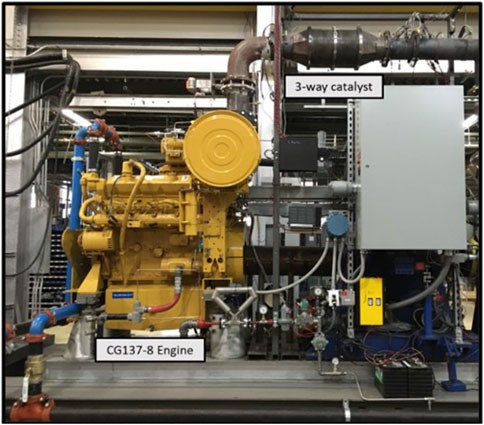
Figure 1. Image of CG137-8 engine test cell at CSU’s Powerhouse Engines and Energy Conversion Laboratory.
This engine test cell operates using a cooling water system that services the laboratory with outdoor heat exchangers for cooling. To apply a load to the engine, the driveshaft of the engine is connected to a Dyne Systems eddy current dynamometer (model 1519-3 WIG, originally made by Eaton Yale and Towns). For all testing in this project the engine was operated at local Northern Colorado air pressure (∼84 kPa). All the natural gas fuel used for this project was supplied by the city of Fort Collin’s natural gas utility system. Utility natural gas is subject to variability, so the Powerhouse laboratory uses a gas chromatograph to constantly sample the utility natural gas and identify the individual constituents of the fuel.
The CG137-8 engine used for testing was retrofitted with air-fuel ratio controls from Woodward, including a new electronic fuel regulator, throttle valve, and large engine control module (LECM). This engine came equipped from Caterpillar with compression sensors in each cylinder allowing the control module to measure combustion in each cylinder individually. The LECM was also given full control of individual spark plug ignition timing, utilizing “coil-on-plug” spark plugs.
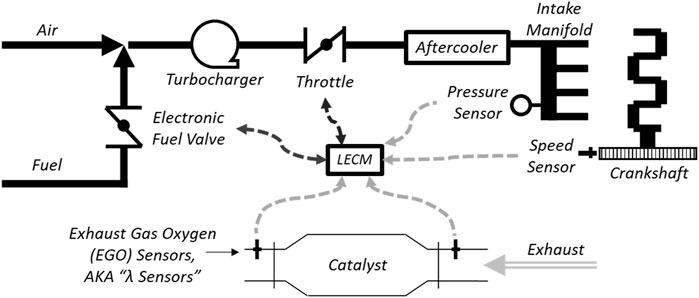
Natural gas fuel flow is controlled with a Woodward electronic fuel regulator valve prior to mixing with air. The fuel and air are mixed before entering the turbocharger. After passing through the turbocharger, the fuel-air mixture passes through an electronic throttle and an aftercooler before entering the intake manifold. Air-fuel equivalence ratio, also called λ (“lambda”), is controlled using feedback from exhaust gas oxygen (EGO) sensors in the exhaust stream. A schematic representation of the air-fuel system is shown below in Figure 2. This engine system has full fuel authority and can recognize deviations in engine operation, allowing it to adapt to changing conditions. This setup is ideal for changing fuel constituents, as the LECM can recognize a change in λ in the exhaust and adjust fuel and air flow accordingly.
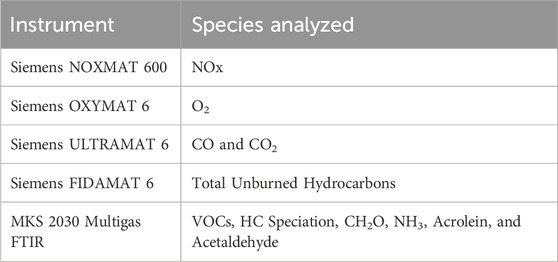
Analyzing emissions before and after the catalyst allows independent assessments of engine and catalyst performance. Exhaust emissions from the engine is sampled pre- and post-catalyst via a heated sample line with a remote emissions analyzer located elsewhere in the lab. The laboratory is equipped with Siemens emissions analyzers measuring carbon monoxide (CO), carbon dioxide (CO2), nitrogen oxides (NOx), oxygen, and unburned hydrocarbons (THCs) and a Fourier transform infrared (FTIR) spectrometers for measuring a wide range of compounds including volatile organic compounds (VOCs), hydrocarbon speciation, formaldehyde, acrolein, acetaldehyde, and ammonia. Emissions analyzer details are provided in Table 2. The natural gas fuel constituents are measured using an Inficon MicroGC. In preparation for the current project, a new 3-way catalyst was chosen and installed on the engine. The catalyst was sized to meet emissions limits of 0.15 g/bhp-hr and 0.6 g/bhp-hr for NOx and CO, respectively.
A H2 distribution system was designed to connect with a large H2 storage trailer and deliver compressed H2 gas to the engine within the lab. To make precise fuel blends, a mass-flow meter/controller using differential pressure-based laminar flow measurement was installed on the H2 fuel supply (Alicat, model:MCR-500SLPM-D-67X86). A Coriolis mass-flow meter previously installed on the natural gas fuel line was utilized to measure NG flow. A feedback control loop was written in a LabVIEW program to monitor the flow of natural gas through the Coriolis meter and adjust H2 flow to meet the required proportions. The H2 and NG are blended before the LECM controlled fuel valve (Woodward, model:8407-803), and the LECM is given no warning of fuel changes in this test setup so that this test cell is representative of engines being used in the field. A basic schematic of the air-fuel system is shown in Figure 3, and a screenshot of the H2 control system in LabVIEW is shown in Figure 4.

Figure 3. A basic schematic of the H2-NG fuel blending system. Fuel flow proportions are based on the natural gas flow, and the engine controller is unaware of fuel changes.

Figure 4. Visual of the H2 control loop in LabVIEW that controls the flow of H2 proportionally to the flow of natural gas.
When H2 is added to the natural gas fuel, the volumetric flowrate of the fuel blend must increase. H2 is less energy dense than natural gas by volume, so the engine intake and auxiliary equipment must be large enough to accommodate the increased volumetric fuel flow. The estimated volumetric fuel and air flows for the engine are shown below in Table 3, displaying increased fuel flow. At a 20% blend of H2 – the volumetric fuel flow must increase by 15% to maintain the same energy delivery rate. This is important because some engines in the field may require larger fuel-system components to accommodate the increased fuel flow with a H2 blend.
Most data collection was recorded from the engine while it was running in “steady state”. Using an eddy current dynamometer (Dyne Systems model 1519-3 WIG), a constant load of 1,580 Nm was applied to the engine while it held a constant 1,800 rpm, resulting in a constant maximum power output of 298 kW. While collecting data for different H2 fuel concentrations, the engine system was given time to settle after changing fuel blends. For each data point the engine was given time to stabilize, often for up to 30 min to be sure that valid data was collected. Careful attention was paid to make sure that the average λ for each collection point was the same. This was important to limit the influence of λ on exhaust products, as λ can have a much more profound effect on emissions than fuel blends. While processing the collected data, 3-min window averages were selected where the engine was operating with little changes and the average λ value was the same as the setpoint.
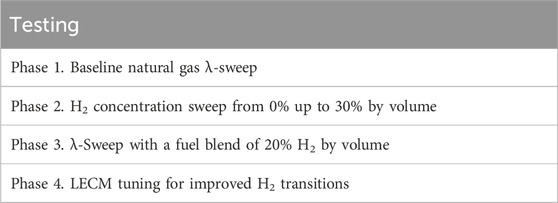
An overview of the testing carried out on the CG137-8 is shown in Table 4. For the first phase of testing, a natural gas baseline λ-sweep was conducted to outline the window of operation where the 3-way catalyst was most effective. This baseline sweep was carried out with a steady λ and a dithering λ to compare catalyst behavior with different λ controls. Using data from the λ-sweep, the window of operation was defined, and the midpoint of the window was chosen to be the constant λ value for the H2 blending sweeps. Once operating parameters for the engine were selected, the second phase of H2 blending began. While holding λ constant, H2 was introduced into the natural gas fuel in 5% increments from 0% up to 30% by volume. For each concentration of H2, all operating parameters were held constant for up to 30 min to ensure λ had returned to the setpoint, and to reduce the possibility of hysteresis in the catalyst from previous datapoints. After the H2 sweeps, the third phase of testing was to conduct a λ sweep similar to the baseline but with a 20% blend of H2 by volume. Finally, the fourth phase of testing was to tune the LECM on the engine while transitioning H2 concentrations, to improve engine controller response.
Prior to experimentation with H2, operating parameters were chosen and a baseline natural gas λ-sweep was conducted to find the optimal λ-setpoint. For all following tests, a spark timing of 27° before top dead center was used for ignition timing, and 1.5% amplitude at a frequency of 1 Hz was used for λ-dithering. Results from the baseline λ-sweep are shown below in Figure 5, displaying post catalyst emissions where they are at their lowest. The “Window of Operation” is shown as the range of λ that the engine can operate within while still meeting its emissions goals, without producing high emissions of NOx or CO. The midpoint of this window was chosen to be the λ setpoint for the following H2 concentration sweep. Note that “Rich” and “Lean” on the x-axis indicate lambda movement to the left and right, respectively, of the window of operation midpoint.
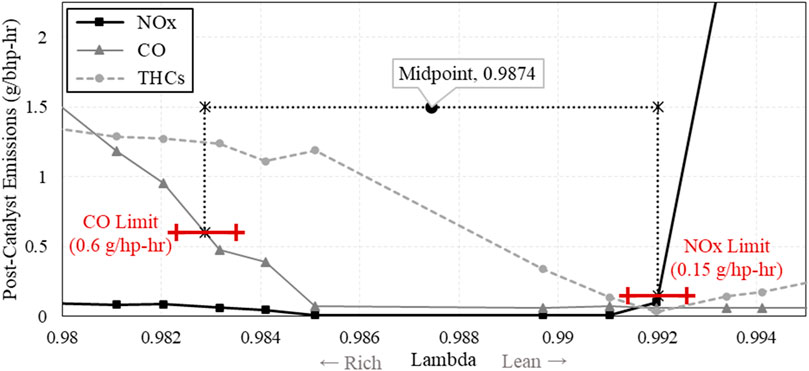
Figure 5. Post catalyst NOx, CO, and THC emissions from the natural gas baseline λ-sweep, showing the rich and lean limits used to find the Window of Operation.
3 Results
3.1 Hydrogen fuel concentration sweep
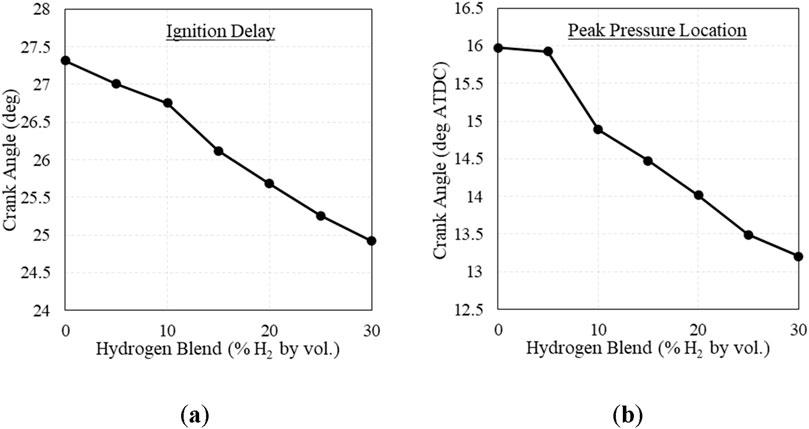
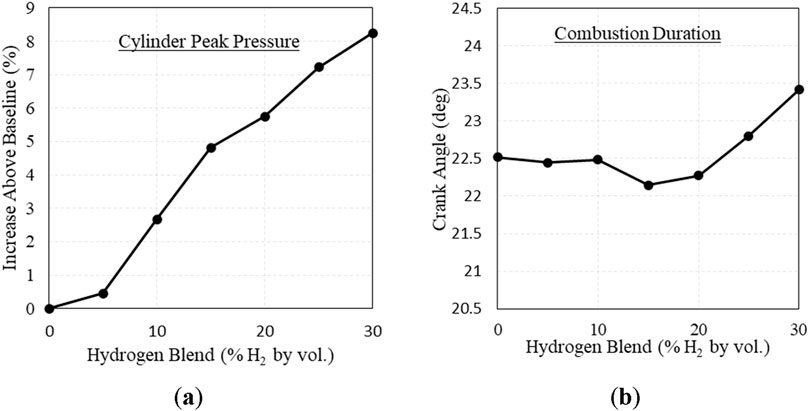
Blending hydrogen with natural gas changed the combustion behavior of the fuel, causing the fuel to ignite faster and increase peak pressure. The change in ignition delay and peak pressure location are shown in Figure 6. Estimating ignition delay as the crank angle degrees between the ignition spark and 10% heat release, ignition delay was shortened by ∼6% at 20% H2. This is in line with Gersen et al., who found that increased levels of H2 blended with methane decreased the ignition delay of the fuel, showing increased reactivity (Gersen et al., 2008). Additionally, cylinder peak pressure increased with increasing H2, shown in Figure 7A. This is also a recognized combustion behavior with H2 addition, which Karim et al. attributes to faster reaction initiation and propagation (Karim et al., 1996). However, combustion duration did not present a clear trend, shown in Figure 7B. The change in combustion duration was too small to derive conclusions, and further testing is needed to investigate the change in combustion duration with respect to H2 addition.
Pre- and post- catalyst NOx and CO emissions are shown below in Figure 8. Pre-catalyst, CO decreased and NOx increased as H2 increased. The decrease in CO is described by Xudong et al. as they attribute the reduction in CO to be caused by more complete oxidation of the hydrocarbons (Zhen et al., 2020). The increase in NOx is explained by Akansu et al. as a result of increased flame temperature caused by the increasing H2 content (Akansu et al., 2007). Post-catalyst emissions did not respond as expected though, with insignificant changes to both CO and NOx. We attribute this to the fact that the catalyst was still performing well and operating near the center of its λ-window of compliance.
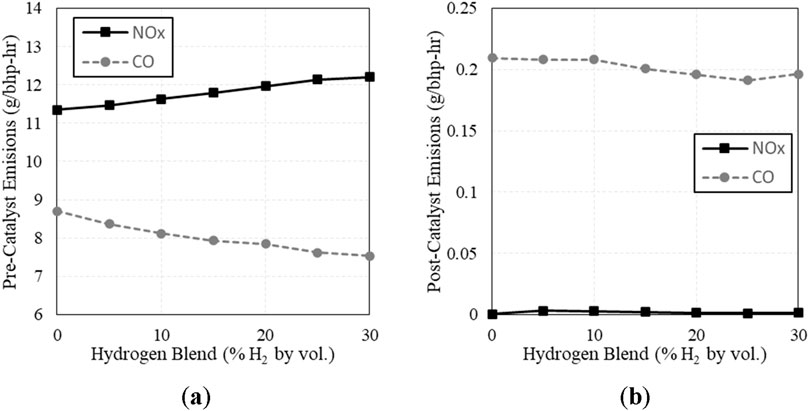
Figure 8. (A) Pre-catalyst NOx and CO emissions vs. H2 fuel concentration; (B) Post-catalyst NOx and CO emissions vs. H2 fuel concentration.
The initial H2 blending sweep indicated that the engine and catalyst can tolerate elevated levels of H2 as long as the engine is able to maintain the optimal λ setpoint. Post-catalyst emissions before blending H2 were already very low, so the effect of H2 on CO and NOx emissions was minimal. These results show that this engine system can tolerate up to at least 30% H2 without exceeding CO and NOx emissions limits. However, this assessment only considers emissions limits. Since peak cylinder pressures for 30% H2 are higher than natural gas, engine design limits would need to be evaluated prior to field operation. Alternatively, ignition timing adjustments could be made to match peak cylinder pressures for natural gas. The emissions observations are different than previous testing on this subject at CSU from 2014/2015, where they found the system could not exceed 10% H2 while operating with a narrow band EGO (Ghotge and Olsen, 2015). This discrepancy is likely because the previous project used a tighter NOx limit of 11 ppmd (appx. 0.04 g/hp-hr). Also, the current project is using advanced λ control software and equipment, maintaining λ with feedback control loops.
Brake thermal efficiency is shown below in Figure 9A, displaying slight increases in efficiency above 10% H2. Shown in Figure 9B is the change in total fuel mass flow compared to the lower heating value of the mixture. As NG is replaced with H2 in the fuel, the heating value of the fuel mixture increases, requiring less fuel to maintain speed and load.
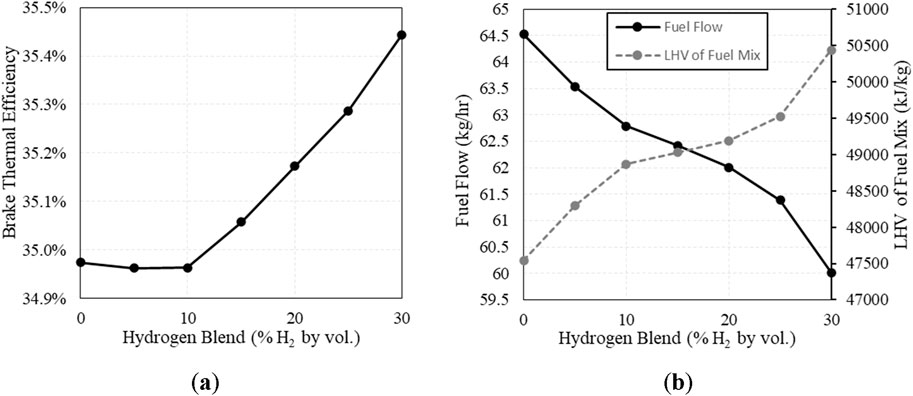
Figure 9. (A) Brake thermal efficiency vs. H2 fuel concentration; (B) Total fuel mass flow and the Lower Heating Value (LHV) of the mixture vs. H2 fuel concentration.
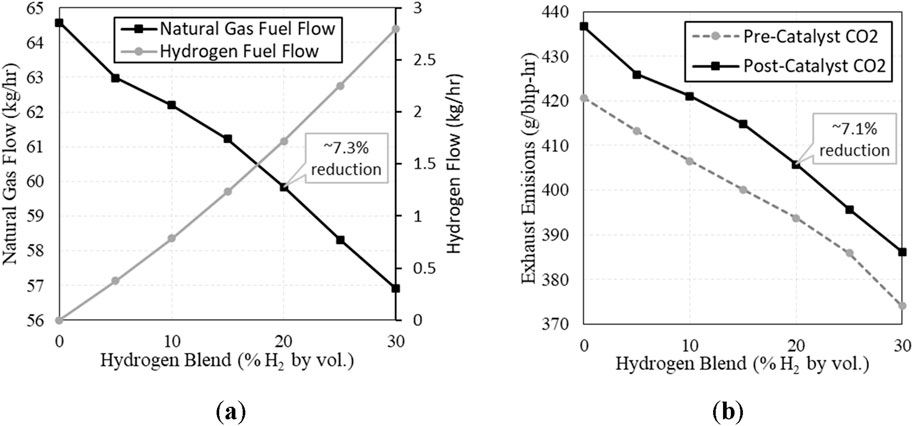
The core objective for H2 blending is to reduce greenhouse gas (GHG) emissions from combustion, and this expectation was validated by the results. At 20% H2, natural gas flow was reduced by 7.3% causing a 7.1% reduction of CO2 in the post-catalyst exhaust. The change in fuel flows and CO2 emissions are presented in Figure 10.
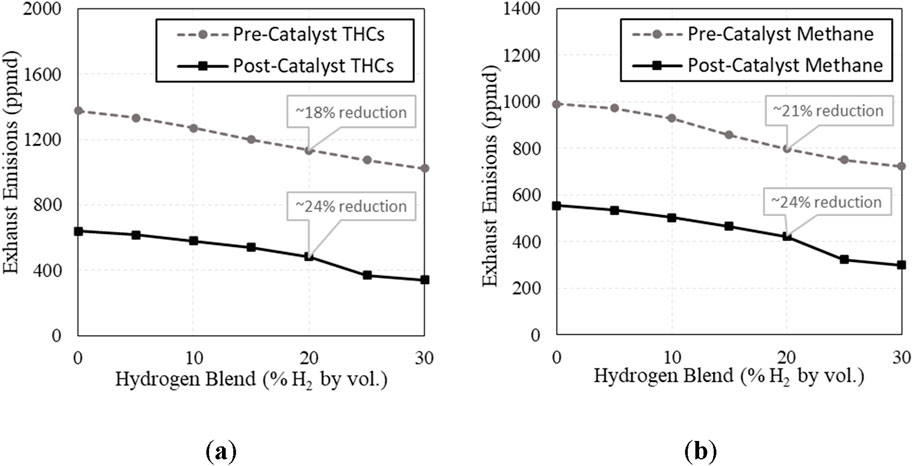
THC’s and methane (CH4) were both significantly reduced with increasing H2 in both the pre- and post-catalyst exhaust, shown in Figure 11. The reduction in pre-catalyst THCs is likely due to increased flame speed, reducing quenching and allowing the fuel to burn closer to the cylinder walls. The reduction in post-catalyst THCs is also aided by increased engine-out NOx providing more oxidants to the catalyst. Methane is a greenhouse gas (GHG) contributor, so lowering post-catalyst methane emissions is considered when evaluating the change in GHG emissions with increasing H2. Referencing the EPA’s GHG evaluation of methane, methane emissions are multiplied by a weighting factor of 25 when comparing methane and CO2 (Global Methane Initiative, 2023), and these two values are added together to determine CO2-effective (CO2-e). At a blend of 20% H2 - post-catalyst GHG emissions (CO2-e) were reduced by 8.1%.
3.2 λ-Sweep with a 20% blend of hydrogen
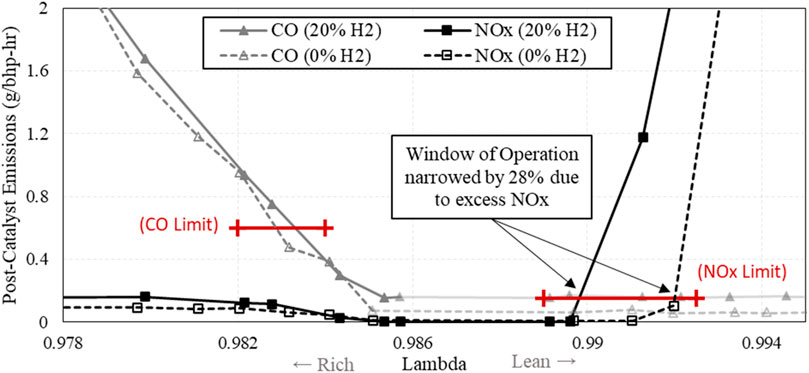
The minimal change in post-catalyst NOx and CO with added H2 indicated that the catalyst was still functioning properly at its original λ setpoint. To further explore the effect of H2 on the catalyst, a λ-sweep was conducted with a blend of 20% H2 by volume. Figure 12 shows a comparison between the baseline λ-sweep and the λ-sweep with a blend of 20% H2. This test showed that there is a significant narrowing of the window of operation by 28% due to the excess NOx produced by the engine. This is an indicator that these engine systems may need tighter control of λ in order to operate with elevated amounts of H2 in the fuel.
An added benefit from blending H2 into the natural gas fuel is a reduction in THCs throughout the operation window. Seen in Figure 13, THCs were reduced throughout the compliance window, likely due to higher flame speed which reduces quenching, and higher NOx in the exhaust which provides more oxidants to the catalyst.
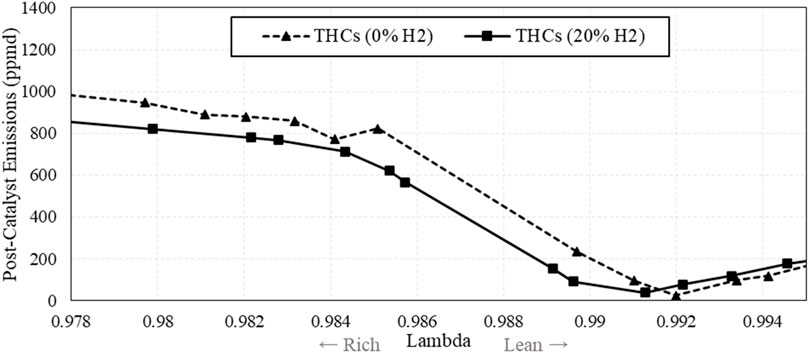
Figure 13. Post-catalyst total hydrocarbon (THC) emissions vs. λ, comparing fuel with and without H2.
3.3 H2 concentration transitions
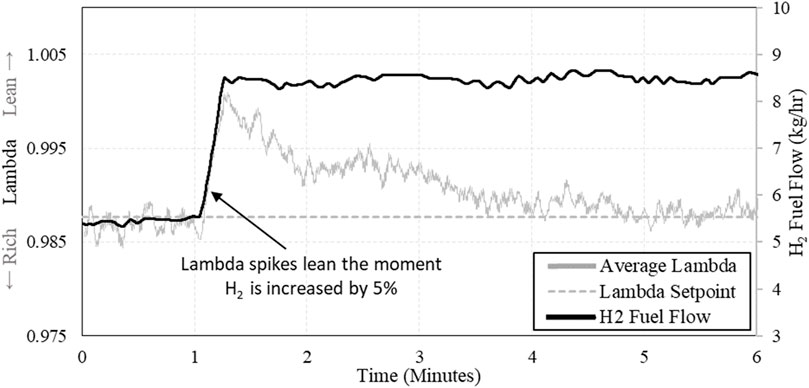
While testing different concentrations of H2 in the natural gas fuel, an observation was made during the transitions. Each time H2 was added to the fuel stream, λ would immediately become lean and would take some time (minutes) to return to normal. Upon inspection of this phenomena, λ transitions lean simultaneously as H2 is added to the fuel, shown in Figure 14. This occurs because the stoichiometric air-fuel ratio of the fuel is changing as its chemistry changes. Changing air-fuel ratios (AFRs) and expected flow rates are shown in Table 3 (presented earlier). Here, it can be counter intuitive to see that as H2 is added to the fuel - the stoichiometric AFR increases, yet air flow rate decreases. This is because of the changing energy density of the fuel, as more H2 is added – the fuel becomes more energy dense by mass – requiring less fuel mass to maintain power output. The decreased demand for fuel by mass results in decreased airflow, both by mass and volumetrically.
The expected reduction in airflow is likely causing the lean spikes when increasing H2 in the fuel. The moment H2 is added to the fuel, the previous flow rates of air and fuel become invalid for the new fuel blend, resulting in too much air being supplied to the mixture until the engine controller can adapt.
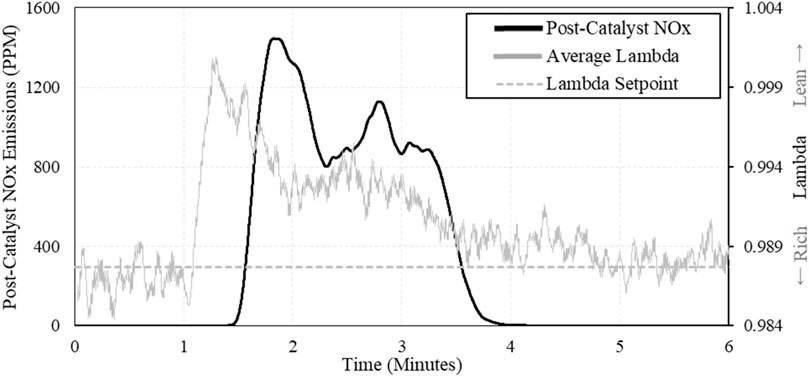
As λ would transition lean when increasing H2, there was an expected change in exhaust chemistry as well. When H2 was added to the fuel, λ transitioned lean, and a large spike in NOx could be observed in the post-catalyst exhaust. Large concentrations of NOx were observed whenever H2 was added to the fuel stream. An example of this is shown in Figure 15, comparing post-catalyst NOx emissions and λ vs. time.
When H2 was removed, λ drifted rich and excess CO was emitted post-catalyst. However, the CO increase was not as extreme as the NOx increase for H2 increasing transitions. When the catalyst receives rich exhaust, it becomes less effective at oxidation and allows a larger fraction of CO to pass through the catalyst unreacted. However, this transition is gradual, and the λ control recovery is more effective at mitigating the CO increase. The temporary rich excursions caused by removing H2 from the fuel did not produce enough post-catalyst CO to make a significant impact or to push the engine out of compliance for a 1-h average.
The more concerning events were the large spikes of post-catalyst NOx emissions when H2 was added to the fuel stream. When λ strays lean, the catalyst becomes saturated with oxygen, allowing NOx to pass through the catalyst unaffected. This transition in the catalyst occurs quickly, and results in large post-catalyst NOx emissions. These transition events become more dramatic at elevated concentrations of H2 because the expected change in airflow increases as H2 is increased.
The impact of these transition events were examined by evaluating them in 1-h averages, assuming the engine experienced an increase in H2% followed by normal operation for the remainder of the hour. These results are displayed in Figure 16, and they show the engine could exceed emissions limits for a 1-h average when it experienced an increase in H2 by 5%.
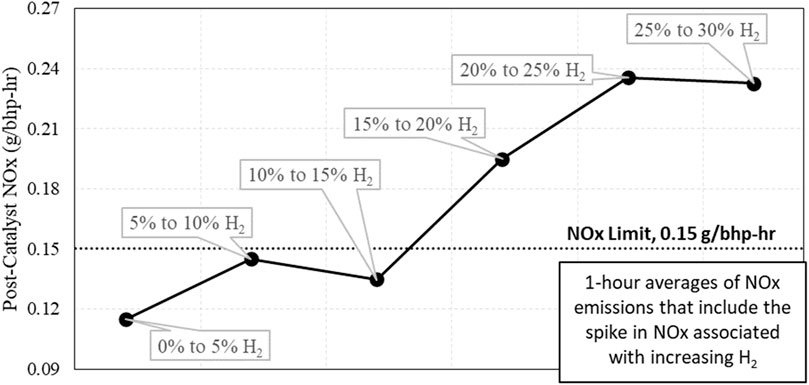
Figure 16. 1-hour NOx emission averages that include an increase of H2 by 5%. Note that the 5% transitions above 15% H2 resulted in the engine system exceeding the previously set NOx limit.
Further investigation into the engine response to transitioning H2 led to analysis of engine controls. The quantity of post-catalyst NOx produced directly correlated with how long it took for the engine to return λ to the setpoint. The more quickly the engine returned to normal, the less NOx was produced by changing the fuel constituents.
The LECM controlling the engine uses a PID feedback control loop to maintain λ, utilizing feedback from EGO sensors in the exhaust stream to measure the oxygen content of the exhaust constituents. This PID feedback loop can be “tuned” to change how quickly the engine responds to λ changing unexpectedly. “Tuning” the PID feedback loop involves adjusting the coefficients of each of the functions for Proportional-Integral- and Derivative gain. The objective of “tuning” the PID control loop is to speed up the engines response to be as fast as possible without causing oscillation and destabilizing engine operation.
Recognizing that we could improve the engine response to changing λ by “tuning” the PID for the λ-control loop, test sweeps were conducted using different PID settings. For each different PID setting, the engine was subjected to an increase in H2 in the fuel from 0% to 5%, and the performance of the engine was evaluated by looking at the average post-catalyst NOx emissions produced during each transition. An example is shown in Figure 17 where the coefficient of the Proportional term was adjusted to find the lowest NOx emissions produced by a H2 transition event. Here, we can see that the NOx emissions caused by increasing H2 was reduced by more than half after simply adjusting the PID settings.
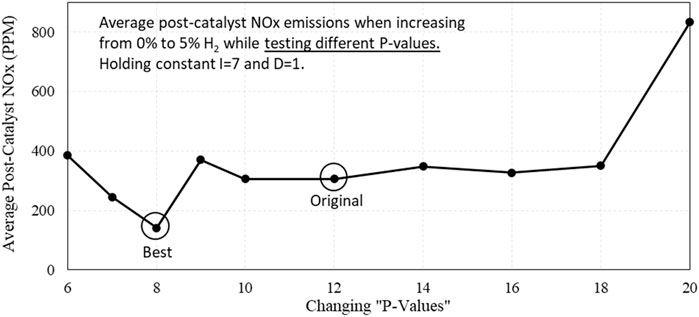
Figure 17. Averages of post-catalyst NOx emissions during 0%–5% H2 transitions while operating with different P-value settings in the λ PID control loop.
Some of the transitions from the proportional and integral sweeps were evaluated to see if these transitions were violating regulation limits for a 1-h average. Average post-catalyst NOx emissions were weighted for their collection time and added to the average NOx emissions from stable operation with 5% H2 from previous tests. Results from this evaluation are shown in Figure 18. Here, it can be seen that some engine controllers can exceed 1-h average emissions limits with as little as a 5% increase in H2 if the transition is sudden. Some engine controllers may need to be “tuned” or upgraded in order to tolerate elevated levels of H2.
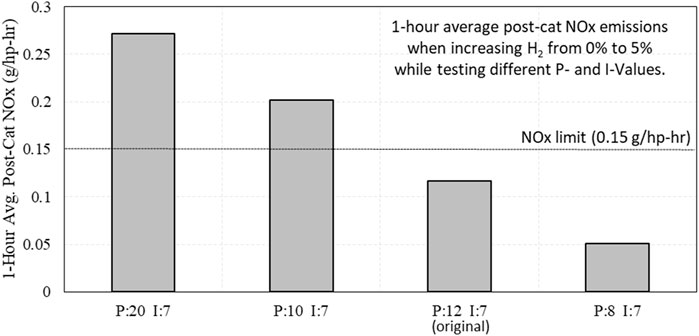
Figure 18. 1-hour average post-catalyst NOx emissions when increasing H2 from 0% to 5% while testing different PID settings for the λ-control feedback loop.
Similar testing was conducted with different PID settings while subjecting the engine to an increase in H2 from 0% to 20%. While the engine was able to maintain operation and produce full power during the transition, the larger transition always produced too much post-catalyst NOx emissions. Every test with a sudden transition from 0% to 20% H2 resulted in the engine exceeding the NOx limit, even when evaluated with a 3-h average, shown in Figure 19. This shows that private operators and natural gas utility companies may need to be conscious of H2 injection points near engines operating with pipeline fuel, as a sudden increase in H2 may cause those engines to exceed emissions goals.
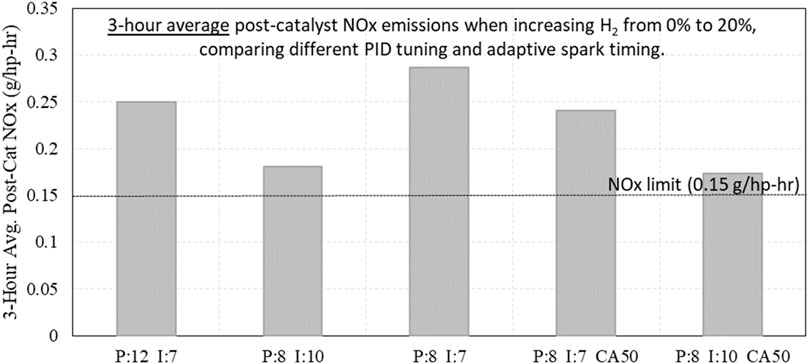
Figure 19. 3-hour average post-catalyst NOx emissions when increasing H2 from 0% to 20% while testing different PID settings.
4 Conclusion
A natural gas Caterpillar CG137-8 industrial “rich burn” engine with a 3-way catalyst was used for testing H2-NG fuel blending. While operating the engine, H2 was added to the NG fuel up to 30% by volume. Then, a λ-sweep was conducted while running with a 20% blend of H2, to define the new limits of the window of operation. Finally, LECM response was assessed while abruptly changing fuel blends, which lead to exploration into PID tuning of the engine.
Results from the H2 concentration sweep indicate that the engine setup used for testing can tolerate up to 30% H2 by volume in the NG fuel stream without exceeding emissions limits during steady operation. The impact of increased peak firing pressures on engine durability is not addressed.
• Combustion behaviour changed, with ignition delay shortening and peak pressure increasing as H2 was added.
• There was a significant reduction in GHG emissions, with NG flow reduced by 7.3% and GHG emissions reduced by 8.1% with a 20% blend of H2 by volume.
• With increasing H2, engine-out NOx increased, and engine-out CO decreased.
• With increasing H2, changes in post-catalyst NOx and CO were insignificant.
Carrying out a λ sweep while operating with a 20% blend of H2 revealed that the window of operation narrowed by ∼28% due to excess NOx production. This is an indication that similar engine systems may need to operate with tighter control of λ in order to operate with elevated amounts of H2 in the fuel.
Large emissions of NOx were observed whenever H2 was abruptly increased because the transition caused the engine to run lean for a short time. As the fuel constituents change, the rate of airflow must also change to meet the required AFR for the new fuel blend. Whenever the H2 fuel concentration changed, it took some time for the engine controller to adapt and adjust the airflow.
• Increasing H2 in the fuel stream required less airflow to the engine. Whenever H2 was abruptly increased, λ would temporarily move lean until the engine controller could adapt.
• The further λ transitioned from the setpoint and the longer it took for the engine controller to return to normal, the more post-catalyst emissions were observed.
• The temporary lean excursions due to increasing H2 in the fuel caused a corresponding increase in post-catalyst NOx. The temporary spikes in NOx could exceed 1-h average emissions limits with as little as a 5% increase in H2.
The performance of the engine controller dictated how long it took for λ to return to normal and the quantity of post-catalyst NOx produced from changing H2 blends.
• Post-catalyst NOx production associated with a 5% increase in H2 was reduced by over 50% after tuning the λ PID control loop. This shows that engine controller feedback loops may need to be improved for some engines that will operate with H2.
• Engine operators should be aware that poor PID tuning can result in post-catalyst NOx emissions that will violate limits with as little as 5% H2 added to the fuel.
Data availability statement
The original contributions presented in the study are included in the article/supplementary material, further inquiries can be directed to the corresponding author.
Author contributions
NK: Conceptualization, Data curation, Formal Analysis, Investigation, Writing–original draft. DM: Methodology, Project administration, Resources, Supervision, Writing–review and editing. GA: Conceptualization, Project administration, Resources, Writing–review and editing. DO: Conceptualization, Funding acquisition, Investigation, Methodology, Project administration, Supervision, Validation, Writing–review and editing.
Funding
The author(s) declare that financial support was received for the research, authorship, and/or publication of this article. This research was funded by the Southern California Gas Company, contract number 5660063048, and Caterpillar Inc., contract number 010389-00002.
Acknowledgments
This work was conducted at Colorado State University Powerhouse Energy Campus. Engine testing was managed by Director of Engineering Kirk Evans and technician Mark James.
Conflict of interest
Author DM was employed by Caterpillar Inc.
Author GA was employed by Southern California Gas Company.
The authors declare that this study received funding from California Gas Company and Caterpillar Inc. The funders had the following involvement in the study: Technical representatives from each company provided technical guidance and oversight during the project, and review of this journal article.
Publisher’s note
All claims expressed in this article are solely those of the authors and do not necessarily represent those of their affiliated organizations, or those of the publisher, the editors and the reviewers. Any product that may be evaluated in this article, or claim that may be made by its manufacturer, is not guaranteed or endorsed by the publisher.
References
Akansu, S. O., Kahraman, N., and Ceper, B. (2007). Experimental study on a spark ignition engine fuelled by methane-hydrogen mixtures. Int. J. Hydrogen Energy 32 (17), 4279–4284. doi:10.1016/j.ijhydene.2007.05.034
Brower, M., Petersen, E. L., Metcalfe, W., Curran, H. J., Füri, M., Bourque, G., et al. (2013). Ignition delay time and laminar flame speed calculations for natural gas/hydrogen blends at elevated pressures. J. Eng. Gas Turbines Power 135. doi:10.1115/1.4007763
Climate Commitment to Net Zero 2045 (2021). Southern California gas company, a subsidiary of Sempra. Available at: https://www.socalgas.com/sites/default/files/2021-03/SoCalGas_Climate_Commitment.pdf (Accessed January, 2023).
Defoort, M., Olsen, D., and Willson, B. (2004). The effect of air-fuel ratio control strategies on nitrogen compound formation in three-way catalysts. Int. J. Engine Res. 5 (1), 115–122. doi:10.1243/146808704772914291
DOE (2022). DOE establishes bipartisan infrastructure law's $9.5 billion clean hydrogen initiatives. United States Federal Government, Washington DC: energy.gov. Available at: https://www.energy.gov/articles/doe-establishes-bipartisan-infrastructure-laws-95-billion-clean-hydrogen-initiatives.
Einewall, P., Tunestal, P., and Johansson, B. (2005). Lean burn natural gas operation vs. Stoichiometric operation with EGR and a three way catalyst. Lund, Sweden: Lund University, published in SAE Technical Paper 2005-01-0250. doi:10.4271/2005-01-0250
Gersen, S., Anikin, N. B., Mokhov, A. V., and Levinsky, H. B. (2008). Ignition properties of methane/hydrogen mixtures in a rapid compression machine. Int. J. Hydrogen Energy 33 (7), 1957–1964. doi:10.1016/j.ijhydene.2008.01.017
Ghotge, P., and Olsen, D. B. (2015). Impact of H2-NG blending on lambda sensor NSCR control and lean burn emissions. Colorado State University. MS Thesis. Available at: http://hdl.handle.net/10217/176668.
Global Methane Initiative (2023). Importance of methane. Washington DC: Environmental Protection Agency, United States Federal Government. Available at: https://www.epa.gov/gmi/importance-methane.
HyBlend (2023). HyBlend: opportunities for hydrogen blending in natural gas pipelines. energy.gov, Office of Energy Efficiency and Renewable Energy. Available at: https://www.energy.gov/sites/default/files/2021-08/hyblend-tech-summary.pdf (Accessed January, 2023).
Karim, G. A., Wierzba, I., and Al-Alousi, Y. (1996). Methane-hydrogen mixtures as fuels. Int. J. Hydrogen Energy 21 (7), 625–631. doi:10.1016/0360-3199(95)00134-4
Kirkpatrick, A. T. (2021). Internal combustion engines – applied thermosciences. 4th Edition. Wiley. ISBN 9781119454557.
Petrizzo, H. (2020). Joint utility preliminary hydrogen injection standard application, chapter 3, hydrogen blending demonstration program. Monterey Park, CA: Southern California Gas Company, a subsidiary of Sempra, application submitted. Available at: https://www.socalgas.com/sites/default/files/2020-11/H2_Application-Chapter_3_H2_Demonstration_Program.pdf (Accessed November 20, 2020).
Keywords: hydrogen, natural gas, fuel blending, stoichiometric engine, rich burn engine, 3-way catalyst, NSCR catalyst, hydrogen transition
Citation: Katsampes N, Montgomery D, Arney G and Olsen DB (2024) Hydrogen-natural gas fuel blending in a “rich burn” engine with 3-way catalyst. Front. Fuels. 2:1416716. doi: 10.3389/ffuel.2024.1416716
Received: 12 April 2024; Accepted: 30 August 2024;
Published: 13 September 2024.
Edited by:
Abul Kalam Hossain, Aston University, United KingdomReviewed by:
Bheru Lal Salvi, Maharana Pratap University of Agriculture and Technology, IndiaGanesh Duraisamy, Anna University, India
Copyright © 2024 Katsampes, Montgomery, Arney and Olsen. This is an open-access article distributed under the terms of the Creative Commons Attribution License (CC BY). The use, distribution or reproduction in other forums is permitted, provided the original author(s) and the copyright owner(s) are credited and that the original publication in this journal is cited, in accordance with accepted academic practice. No use, distribution or reproduction is permitted which does not comply with these terms.
*Correspondence: Daniel B. Olsen, ZGFuaWVsLm9sc2VuQGNvbG9zdGF0ZS5lZHU=
 Nicholas Katsampes
 David Montgomery2
 Gregg Arney
 Daniel B. Olsen
