ORIGINAL RESEARCH article

Front. Fuels, 09 December 2024
Sec. Biofuels

Methane emission reduction through hydrogen blending in a large bore 2-stroke lean-burn natural gas compressor engine

Greg Vieira
Greg Vieira1*Rachel LorenzenRachel Lorenzen1Mark PattersonMark Patterson2Daniel OlsenDaniel Olsen1
  • 1Engines and Energy Conversion Lab, Department of Mechanical Engineering, Colorado State University, Fort Collins, CO, United States
  • 2Cooper Machinery Service, Houston, TX, United States

Impending and increasingly stringent emissions regulations regarding natural gas compressor engines drive the research behind blending hydrogen with natural gas to make these internal combustion engines and their combustion process more efficient. This investigation seeks to answer two fundamental questions: will blending hydrogen with natural gas reduce overall engine fuel consumption, and can greenhouse gas emissions be reduced by blending hydrogen with natural gas? A 4-cylinder Cooper–Bessemer GMV engine, housed at Colorado State University’s Powerhouse facility, was investigated for hydrogen–natural gas blending using multiple engine configurations. A lean-burn engine uses an active pre-combustion chamber as its ignition source, along with electronically activated high pressure fuel injection in the main combustion chamber. One configuration tested utilized high-pressure fuel injection and blending in hydrogen, up to 40% by volume, in both the main chamber and pre-combustion chamber fuel supplies. A second configuration, where the main combustion chamber fuel was solely natural gas and only the pre-combustion chamber received hydrogen-blended natural gas, was also tested. The final configuration to be tested used low pressure fuel injection with mechanically actuated valves in the main chamber with a traditional spark plug ignition source. All engine configurations saw reductions in methane emissions of up to 30% using blended natural gas and hydrogen. Carbon dioxide emissions were also shown to be reduced for the two configurations. A reduction in brake-specific fuel consumption of up to 2% was also seen for two configurations. These results support the hypothesis that blending hydrogen into natural gas can reduce engine total fuel consumption and reduce greenhouse gas emissions.

1 Introduction

More than 6000 integral natural gas (NG) compressors are located along The United States’ natural gas pipelines. These compressors are primarily powered by 2-stroke, slow speed (300 rpm) large bore (14–22”) natural gas engines. Many of these engines have been operating for over 50 years. Due to their heavy construction, slow speed, and low power density, they are very reliable and could potentially operate for another 50 years. Ensuing emissions regulations are the primary impediment to their continued use on pipelines. Low-cost retrofit technologies must be developed for these engines to reduce emissions and meet future emissions limits.

Since 1992, Colorado State University (CSU) has been actively engaged in research on large bore natural gas engines used for gas compression on interstate natural gas pipelines. Our focus has been on improving engine efficiency and reducing emissions through combustion improvements and exhaust after-treatment. CSU operates a highly instrumented Cooper–Bessemer GMV-4 large bore, 2-stroke cycle natural gas engine. This engine, in larger cylinder count configurations, is a very commonly used on natural gas pipelines.

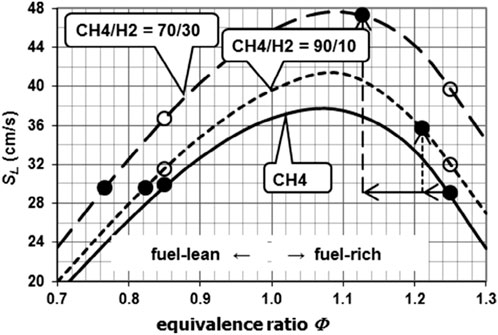
It is anticipated that stranded hydrogen (H2) from renewable sources will be injected into natural gas pipelines in the future. Natural gas compressors and generators and appliances that use fuel from the pipeline will be required to burn natural gas with some fraction of hydrogen. Hydrogen could potentially be utilized to reduce emissions from 2-stroke cycle natural gas engines (Yusuf, 1993; Wang et al., 2008). Hydrogen blended with bulk natural gas fueling the engine may result in emissions reductions. If hydrogen were available in pure form, it could be utilized more intentionally, such as for prechamber fuel. Figure 1 from de Vries et al. (2017) shows the impact of hydrogen on laminar flame speed. Flames in internal combustion engines are turbulent, but turbulent flame speed is roughly proportional to laminar flame speed. Increased flame speeds result in more complete consumption of reactants and smaller quench distances, allowing more effective consumption of fuel in crevice volumes and against cold walls.

Figure 1
www.frontiersin.org

Figure 1. Impact of H2/natural gas blending on laminar flame speed.

This project focuses on hydrogen–natural gas fuel blending for methane reduction. If successful, there would be two major benefits.

• Reduction in fuel consumption. Methane (CH4) emissions from 2-stroke LB NG engines represent approximately 2% of the fuel supplied. If methane emissions can be cut in half through in-cylinder modifications, fuel consumption would decrease approximately 1%.

• Reduction in greenhouse gas (GHG) emissions. GHG regulations are anticipated in the future, and most operating companies are taking preemptive steps to reduce GHG emissions. Methane reduction from 2-stroke lean-burn (LB) natural gas engines will substantially reduce GHG emissions. Methane constitutes a significant portion of GHG emissions (GHG = CO2 + 25 × CH4). At ultra lean conditions, methane can contribute as much as carbon dioxide to GHG emissions.

2 Materials and methods

This investigation was performed on a Cooper–Bessemer GMV-4TF natural gas engine. The engine is a slow speed (300 rpm) 2-stroke-cycle engine with a 14 in. (35.6 cm) bore and a 14.375 in. (36.5125 cm) stroke. Two engine fueling configurations were used in the testing: 1) electro-hydraulic high-pressure fuel injection (HPFI), and 2) low-pressure mechanical gas admission valves (MGAV). Each cylinder was fixed with an active pre-combustion chamber (PCC) for the HPFI configuration while the MGAV configuration used a spark plug in place of the PCC. The rated load for each configuration was 440 hp (330 bkW), with a brake mean effective pressure of 67.6 psi (466 kPa). Two H2 fuel sweeps (varying the amount of H2 blended into the natural gas) were considered for the HPFI configuration, one blending both the PCC and the main combustion chamber (MCC) fuels in approximately the same percentages (up to 45% by volume) and the second keeping the main combustion chamber fuel as pure natural gas while the pre-combustion chamber fuel was blended with H2 (up to 90% by volume). A description of the engine’s experimental setup and equipment can be seen in Vieira et al. (2024).

2.1 High-pressure fuel injection engine configuration

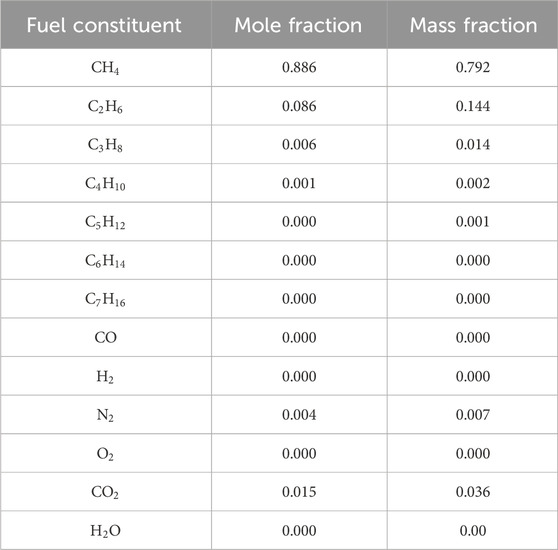
The engine was tuned so that brake-specific NOx emissions were approximately 0.5 g/bhp-hr. This was done by boosting the intake air pressure to 1.34 bar (134 kPa) and the exhaust back pressure to 1.26 bar (126 kPa) at constant load and speed, leading to a trapped equivalence ratio of 0.55 and a trapped air–fuel ratio (AFR) of 29.8 in the MCC. The inlet air temperature was 107–109 °F (41.6–42.7 °C). The MCC fuel injection pressure was set to 35.3 bar (3.53 MPa). The mass flow rate of the PCC was adjusted at each data point so that the coefficients of variance (COVs) for the overall engine were minimized. The fuel constituent’s mole and mass fractions can be seen in Table 1.

Table 1
www.frontiersin.org

Table 1. Natural gas fuel constituents.

2.2 Low-pressure mechanical gas admission valve engine configuration

The MGAV engine configuration utilized simulated piston-scavenged air flow into the MCC. Because engine testing was done in Fort Collins, CO at an elevation of 5,000 ft (1,525 m), both the intake and exhaust pressures were boosted to 1.1 bar (110 kPa) and 1.01 bar (101 kPa), respectively, to create sea-level atmospheric pressure conditions. The inlet air temperature was 107–109°F (41.6–42.7°C). The engine’s fuel injection pressure was set to 2.32 bar (232 kPa). These conditions led to brake-specific NOx emission levels of 7.7 g/bhp-hr, an equivalence ratio of 0.64 and an AFR of 25.5.

3 HPFI results

3.1 MCC/PCC H2 fuel blending

A H2 sweep was completed at intervals of 8.4%, 12.9%, 29.0%, 31.6%, 38.5%, and 41.3%. Each percentage corresponds to the amount of H2 in the fuel by volume. A data point for the 15%–18% range was also taken, but due to a “dead spot” in the Coriolis flow controller’s accuracy, precise measurements of the H2 percentage were not attainable. Both the MCC and PCC fuels had approximately the same proportions of H2 and natural gas blended together.

For this round of testing, the boost pressure was left constant at the nominal value of 1.34 bar (134 kPa). Spark timing was held constant, leaving the location of peak pressure (LoPP) uncontrolled. The power and torque outputs were held constant at 440 bhp and 7,700 lb-ft, respectively. Because the boost pressure and power and torque outputs were left constant, NOx emissions varied as well.

3.1.1 Pressure traces, LoPP, and COVs of peak pressure

For each blend (data point) tested, 1000 individual combustion/scavenging cycles were recorded, and the average of those cycles were compared to a nominal point (solely natural gas) labeled “baseline #.” The results of the sweep can be seen in Figure 2A. Two baseline points were taken during testing: baseline 1 was taken before the H2 sweep and baseline 2 was taken after. Both baselines show an average MCC peak pressure near 550 psi (37.9 bar, 3.79 MPa) with the LoPP at 18.2° aTDC. As the percentage of hydrogen blended into the natural gas increases, the average peak pressure also increases. The LoPP also moves earlier in the cycle. A table of values for peak pressure, LoPP, and the COV of peak pressure can be seen in Table 2.
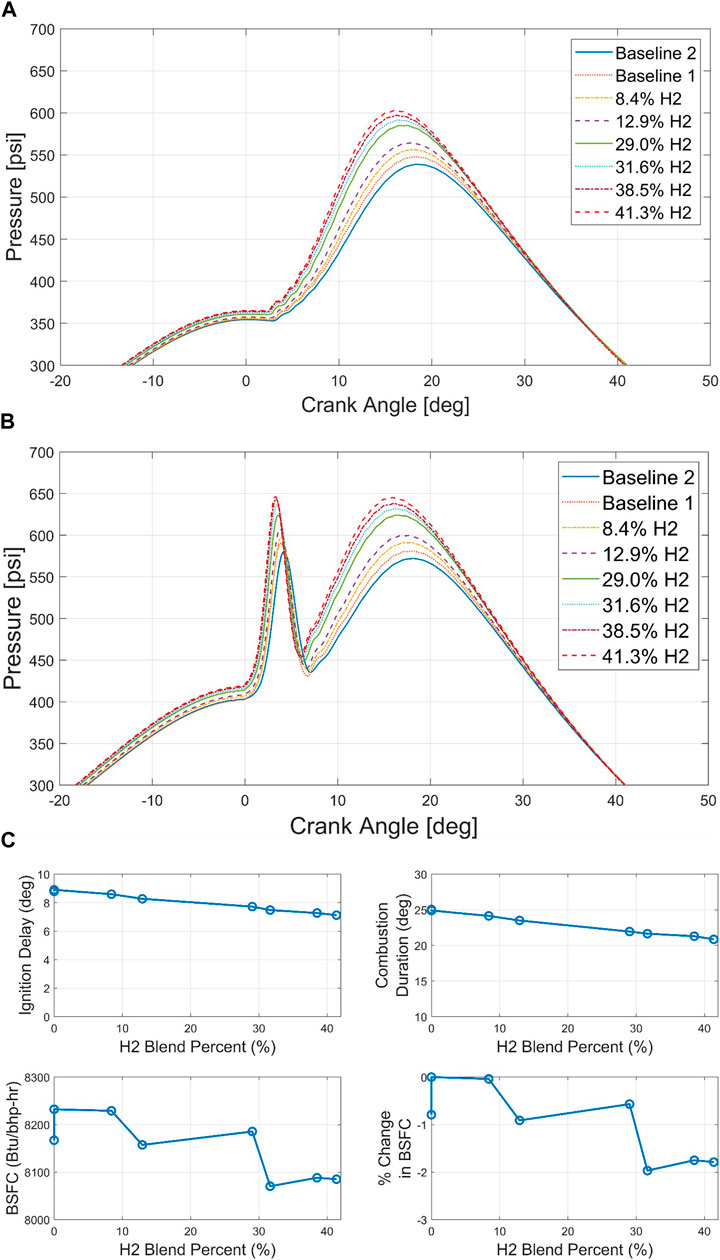
Figure 2
www.frontiersin.org

Figure 2. (A) MCC/PCC H2 sweep: MCC pressure traces. (B) MCC/PCC H2 sweep: PCC pressure traces. (C) MCC/PCC H2 sweep: ignition delay, combustion duration, brake-specific fuel consumption, and change in brake-specific fuel consumption from baseline 2.

Table 2
www.frontiersin.org

Table 2. MCC/PCC H2 sweep: comparison of average peak pressure, location of peak pressure, and COV of peak pressure for each datapoint.

The same peak pressure and LoPP trends can be seen for the PCC pressure traces in Figure 2B. As the percentage of H2 blended into the natural gas increases, the peak pressure rises and the LoPP moves forward in time. Similar results were seen in Pan et al. (2019) and Wang et al. (2008). These trends can be explained as being due to the high diffusivity of the H2 creating a more homogeneous mixture and promoting faster flame growth. This is advantageous to flame propagation and the combustion process as a whole. This more homogeneous mixture ignites faster and thence creates greater pressure inside the pre-combustion chamber, which results in a stronger and more turbulent flame jet. The lower COVs of peak pressure can be explained as misfires and/or partial combustion cycles reducing in frequency as the hydrogen content increases due to the ease of ignition of the hydrogen mixed natural gas compared to just natural gas.

3.1.2 Ignition delay, combustion duration, and BSEC

Ignition delay, defined as the time in crank-angle degrees for 0%–10% of the mass of fuel to burn (also known as mass fraction burned—MFB), was 8.79° and 8.90° for baselines 1 and 2, respectively. Table 3 presents values for each H2 blend percentage pertaining to ignition delay, combustion duration, brake-specific energy consumption (BSEC), and the percentage change in BSEC from baseline 2. A graphical representation can be seen in Figure 2C. The data points show a decrease in ignition delay as the percentage of hydrogen increases with the shortest ignition delay, 7.12°, coming from the fuel blend with the highest H2 percentage. Similar trends were seen in the testing completed by Yusuf (1993).

Table 3
www.frontiersin.org

Table 3. MCC/PCC H2 sweep: ignition delay, combustion duration, brake-specific fuel consumption, and change in brake-specific fuel consumption from baseline 2 values.

For combustion duration, defined as the time for 10%–90% fuel MFB, baselines 1 and 2 were at 25.0° and 24.9°, respectively. Again, the shortest duration, 20.8°, came from the highest H2 percentage fuel blend. Both the ignition delay and combustion duration times followed very linear patterns over the tested blending percentages. Du et al. (2016) and Mariani et al. (2013) saw similar trends using natural gas–hydrogen and methane–hydrogen fuel blends, respectively. The engine’s BSEC saw decreases as the percentage of hydrogen in the fuel increased. The baseline 1 data point showed a lower BSEC value of 8,167 Btu/bhp-hr than baseline 2, which had a value of 8,232 Btu/bhp-hr. Even though there was a clear but small decline in BSEC as the percentage of hydrogen in the fuel increased (using baseline 2 as a reference), the 8.4% and 29.0% blends had a higher value than baseline 1. The 12.9% blend was only slightly under the baseline 1 value. Comparing the BSEC of each blend to the baseline 2 BSEC, the engine saw a 1.79% decrease at the 41.3% blend, but the maximum decrease of 1.97% was seen at the 31.6% blend.

3.1.3 Emissions

3.1.3.1 Total hydrocarbons and CH4

Brake-specific total hydrocarbon (THC) emissions for baselines 1 and 2 were 7.26 and 7.52 g/bhp-hr, respectively. Although a decrease in THC emissions was seen for all fuel blends (Figure 3A), a maximum reduction of 28.7% (5.17 g/bhp-hr) in emissions came from the 31.6% fuel blend (Figure 3B). The decrease in emissions was still present but less pronounced at higher hydrogen percent blends. This maximum in percentage reduction (minimum in g/bhp-hr output) indicates that there is an ideal percentage of H2 of around 30% to blend into natural gas if minimizing emissions output is key.
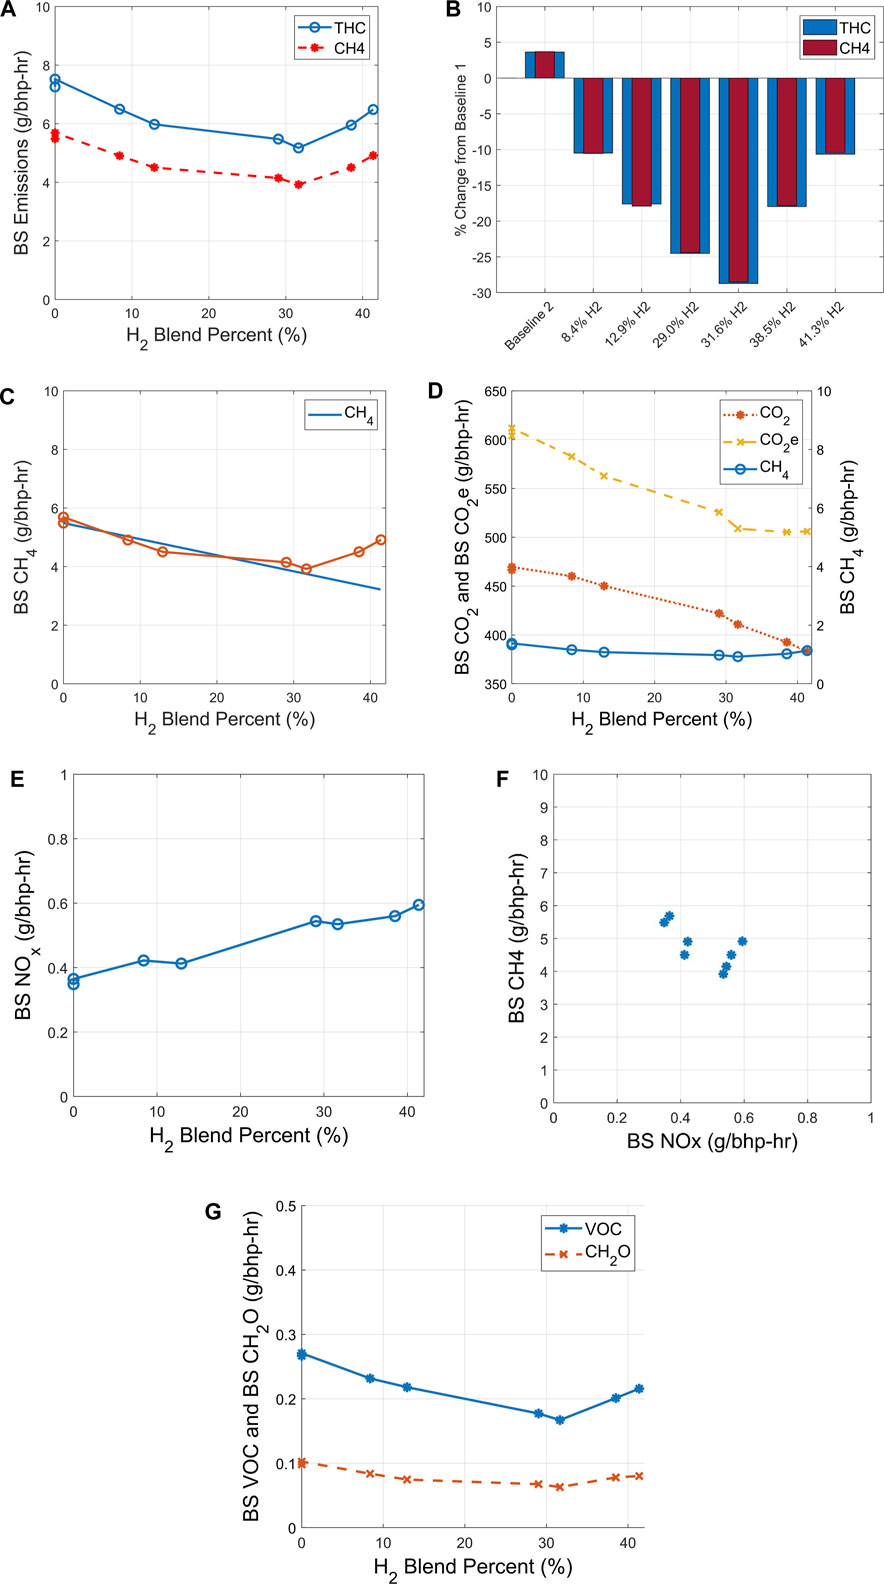
Figure 3
www.frontiersin.org

Figure 3. (A) MCC/PCC H2 sweep: brake-specific total hydrocarbons and brake-specific methane emissions at each fuel blending percentage. (B) MCC/PCC H2 sweep: percentage change of brake-specific THC and CH4 emissions from baseline 1. (C) MCC/PCC H2 sweep: brake-specific methane emissions versus H2 blend percentage. The solid line projects where the methane emissions should be based solely on carbon in the natural gas being replaced with H2. (D) MCC/PCC H2 sweep: brake-specific CO, CO2, and CO2e emissions versus H2 blend percentage. (E) MCC/PCC H2 sweep: brake-specific NOx emissions versus H2 blend percentage. (F) MCC/PCC H2 sweep: brake-specific NOx emissions trade-off with brake-specific CH4. (G) MCC/PCC H2 sweep: brake-specific VOC and formaldehyde emissions versus H2 blend percentage.

Brake-specific methane emissions for each fuel blend, along with the percent change for the brake-specific methane emissions, can also be seen in Figure 3A and Table 3. As CH4 emissions are a component of THC emissions, the expectation is that CH4 emissions follow the same trends and in roughly the same magnitudes. This is exactly what the emissions showed—same trend, similar magnitudes—with only small variations in the percentage change of CH4. The lower hydrogen percent fuel blends (8.4% and 12.9%) had slightly larger CH4 reductions compared to the THC reductions than the higher hydrogen percentage fuel blends.

While there was a decrease in methane emissions as the percentage of hydrogen increased, when accounting for the carbon in the natural gas being replaced by hydrogen, the combustion process is less impressive for methane reduction. Figure 3C depicts where the brake-specific methane emissions should be based solely on carbon in the natural gas being re-placed by hydrogen. The reduction seen in the testing follows the reduction based on carbon content very closely, up to and including the 31.6% 2 blend. From this percentage blend onward, the experimental reduction, while less than baselines 1 and 2, is higher than the emissions based on carbon content. This illustrates that while the addition of hydrogen increases flame growth and propagation rates (decreased ignition delay and combustion duration times), it does not improve the combustion efficiency of carbon-based molecules.

3.1.3.2 CO, CO2, and CO2e

Carbon monoxide (CO), carbon dioxide (CO2), and CO2 equivalent (CO2e = CO2 + 25xCH4) all behaved as expected. As the percentage of hydrogen increased in the blended fuel, CO, CO2, and CO2e all decreased, apart from CO2e emissions beyond the 31.9% hydrogen blend. At the higher hydrogen percentages, CO2e increased compared to lower hydrogen percentages but was still less than the baseline levels. This is expected because of how the methane emissions behaved. Figure 3D illustrates emission behavior as function of hydrogen blend percentage.

3.1.3.3 NOx

Baselines 1 and 2 produced 0.35 and 0.36 g/bhp-hr of NOx, respectively. As anticipated by Yusuf (1993), Ma et al. (2008), and Park et al. (2007), NOx output levels increased as hydrogen percent rose. The 41.3%H2 blend produced the greatest NOx values at 0.59 g/bhp-hr. Although the magnitude of the increase is relatively small (0.35–0.59 g/bhp-hr), the percentage by which the value increased is quite large at 71% over baseline 1. These higher NOx values can be attributed to the hydrogen-induced increased flame temperature. Figure 3E compares the brake-specific NOx values for each fuel blend. A relatively linear trend can be seen from the dataset, showing that as H2 percentage increases, the corresponding NOx value also increases.

Figure 3F is a brake-specific NOx/CH4 trade-off plot. These results show that as CH4 emissions decrease, a consequential increase in NOx emissions takes place.

3.1.3.4 VOC’s and CH2O

Figure 3G depicts brake-specific VOC emissions as a function of H2 blend percentage. Baselines 1 and 2 produced 0.266 and 0.270 g/bhp-hr, respectively. With the introduction of H2, a drop in VOCs was seen across all tested blends. A minimum value of 0.167 g/bhp-hr was produced using the 31.6% blend—a 37% reduction. Blends higher than 31.6% H2 produced higher VOCs than the 29.0% and 31.6% blend but less than the baselines.

The brake-specific formaldehyde (CH2O) emissions versus H2 blend percentage can be seen in Figure 3G. A trend similar to the VOC emissions can be seen in the CH2O emissions. As the percentage of H2 increases, a reduction in CH2O emissions is seen up to and including the 31.6% H2 blend. Beyond this blend percentage, a decrease compared to baselines is still present, but compared to the 31.6% blend, a small increase is seen.

3.2 PCC H2 fuel blending

For this portion of the testing, the MCC fuel was set to solely natural gas, while the PCC fuel was blended with H2. A sweep of natural gas–hydrogen blends was completed again over a range of 0%–90% hydrogen at 10% increments. The same nominal engine configuration and conditions as the MCC/PCC testing was adopted.

PCC fuel-blending test combustion statistics (pressure traces, LoPPs, COVs of peak pressure, ignition delay, combustion duration, BSEC) and emission results for each H2 percentage blend were largely unchanged from the baselines. Consequently, the following will only include the emission outputs and will be brief.

3.2.1 Emissions

3.2.1.1 Total hydrocarbons/CH4

Figure 4A shows the brake-specific THC and CH4 emissions as a function of H2 blend percentage. A slight reduction in both emissions can be seen as H2 percentage increases. Baselines 1 and 2 produced 7.21 and 7.33 g/bhp-hr of THC, respectively, and 5.48 and 5.62 g/bhp-hr of CH4, respectively, while the 90% H2 blend produced the lowest output of 6.64 g/bhp-hr of THC and 5.04 g/bhp-hr of CH4—a 9% reduction of both values over baseline 1. Figure 4B shows the percentage reduction of both THC and CH4 emissions for each fuel blend. An increase in percentage reduction as H2 content increases can be noticed, with the 30% blend being an outlier.
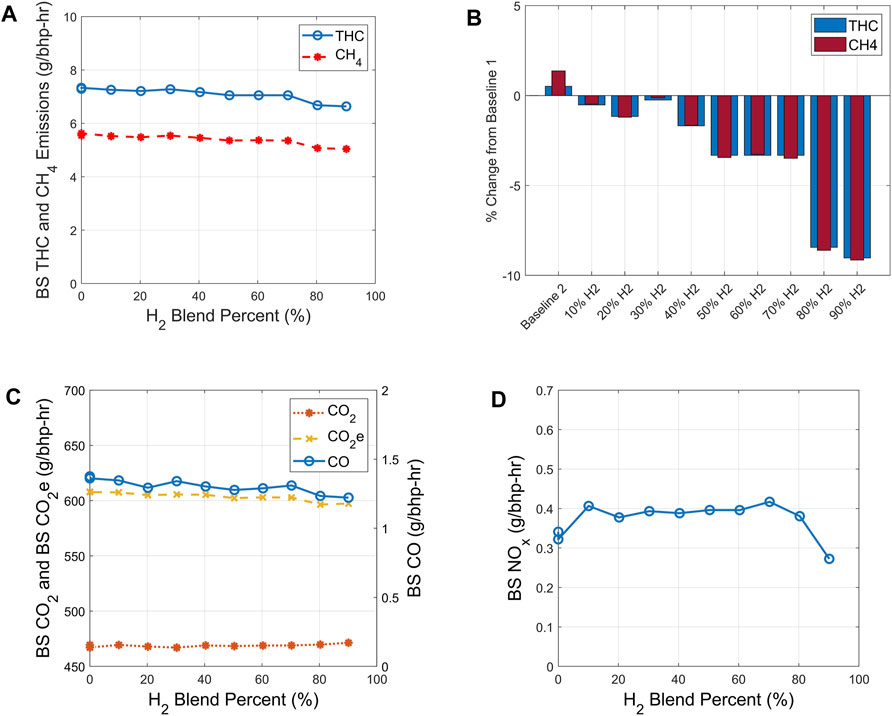
Figure 4
www.frontiersin.org

Figure 4. (A) PCC H2 sweep: brake-specific THC and CH4 emissions as a function of H2 blend percentage. (B) PCC H2 sweep: percentage change of brake-specific THC and CH4 emissions versus H2 blend percentage. (C) PCC H2 sweep: brake-specific CO, CO2, and CO2e emissions versus H2 blend percentage. (D) PCC H2 sweep: brake-specific NOx emissions versus H2 blend percentage.

3.2.1.2 CO, CO2, and CO2e

As expected, due to the slight increased in combustion efficiency, CO and CO2e values saw reductions compared to baselines, with increasing amounts of H2 in the PCC fuel (Figure 4C). The CO2 outputs saw an insignificant increase as H2 percentage increased. Both baseline data points produced 467 g/bhp-hr of CO2 at operating conditions. The 90% H2 blend produced the highest output at 471 g/bhp-hr. The opposite trend is seen with CO2e—another insignificant reduction dropping from 605 g/bhp-hr (baseline 1) to 597 g/bhp-hr with the 90% blend.

3.2.1.3 NOx

Figure 4D shows brake-specific NOx emissions as a function of H2 percentage. Baselines 1 and 2 emit 0.38 and 0.32 g/bhp-hr, respectively, running at nominal conditions. Once H2 was introduced into the PCC fuel, there was an increase in NOx emissions. This increase was present until the 90% blend, where a reduction down to 0.27 g/bhp-hr was produced.

3.2.1.4 VOC’s and CH2O

Both VOC and CH2O emissions remained relatively constant for all tested fuel blends.

4 MGAV results

4.1 Test plan

The test plan for the MGAV engine arrangement included a natural gas–hydrogen fuel blend sweep for fixed-spark (uncontrolled LoPP) configuration and a load sweep configuration for 0% H2 and 20% H2. Only the fixed-spark arrangement results will be presented in this report for brevity.

4.1.1 Pressure traces, LoPP, and COVs of peak pressure

Figure 5A shows the pressure trace for each H2 fuel blend tested, and Table 4 displays values for the peak pressure, LoPP, and COVs of peak pressures. The baseline data point had an average peak pressure of 533 psi (36.7 bar, 3.67 MPa). There is a general trend of increase in peak pressure as the percentage of H2 in the fuel increases, leading to a maximum peak pressure of 560 psi (39.0 bar, 3.90 MPa) at the 24.0% H2 blend. Along with the increased cylinder pressure is an advance in LoPP. The trend for LoPP is the same as the peak pressure, a gradual increase as the H2 percentage increases, leading to a LoPP of nearly 2° before the baseline case.
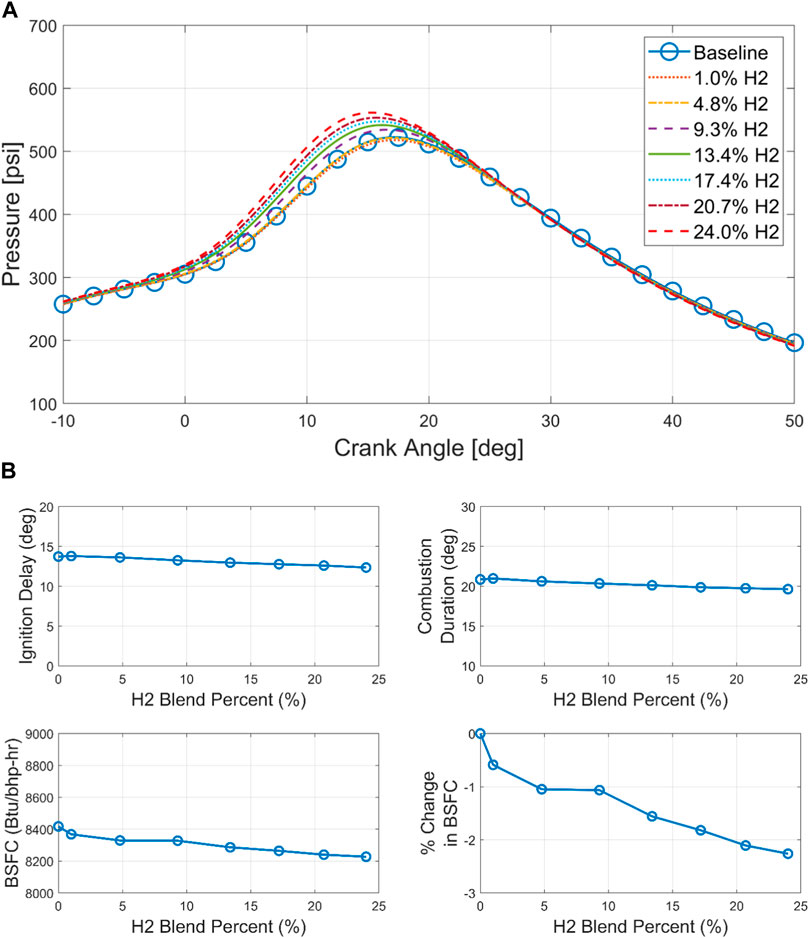
Figure 5
www.frontiersin.org

Figure 5. (A) MGAV H2 sweep: pressure traces for H2 sweep. (B) MGAV H2 sweep: ignition delay, combustion duration, brake-specific fuel consumption, and the change in brake-specific fuel consumption from baseline.

Table 4
www.frontiersin.org

Table 4. MGAV H2 sweep: comparison of average peak pressure, location of peak pressure, and COV of peak pressure for each datapoint.

4.1.2 Ignition delay, combustion duration, and BSEC

As expected, ignition delay and combustion duration both decreased as H2 percentage increased. The ignition delay of the baseline case was 13.7°, and the combustion duration was 20.8°. At a 24% mixture of H2, the ignition delay decreased to 12.3° and the combustion duration decreased to 19.6°, a change of 1.4° and 1.2°. Keeping the engine running at the same load and power output level permitted a decrease in BSF. The nominal BSEC value was 8,417 Btu/bhp-hr, and at the highest H2 blend percentage tested, a BSEC of 8,227 Btu/bhp-hr was calculated—a 2.26% reduction from the baseline. Table 5 and Figure 5B show tabulated values and graphical representations of ignition delay, combustion duration, BSEC, and BSEC percent change from baseline.

Table 5
www.frontiersin.org

Table 5. MGAV H2 sweep: ignition delay, combustion duration, brake-specific fuel consumption, and change in brake-specific fuel consumption from baseline values.

4.1.3 Emissions

4.1.3.1 Total hydrocarbons/CH4

Figure 6A shows the brake-specific THC and CH4 emissions as a function of H2 percentage. Both parameters show a slight decrease in emissions at lower levels of H2 blending. At around 12%, the emissions seem to slightly increase or hold steady. Overall, however, a decrease is seen compared to the baseline. Figure 6B shows the brake-specific THC and CH4 changes compared to baseline. Similarly to Figure 6A, a maximum reduction is seen at the 13.4% H2 blend. A rapid increase in percentage reduction is shown for the blends before the 13.4% blend, at which point the reduction gradually starts to decrease until the final percentage tested is reached.
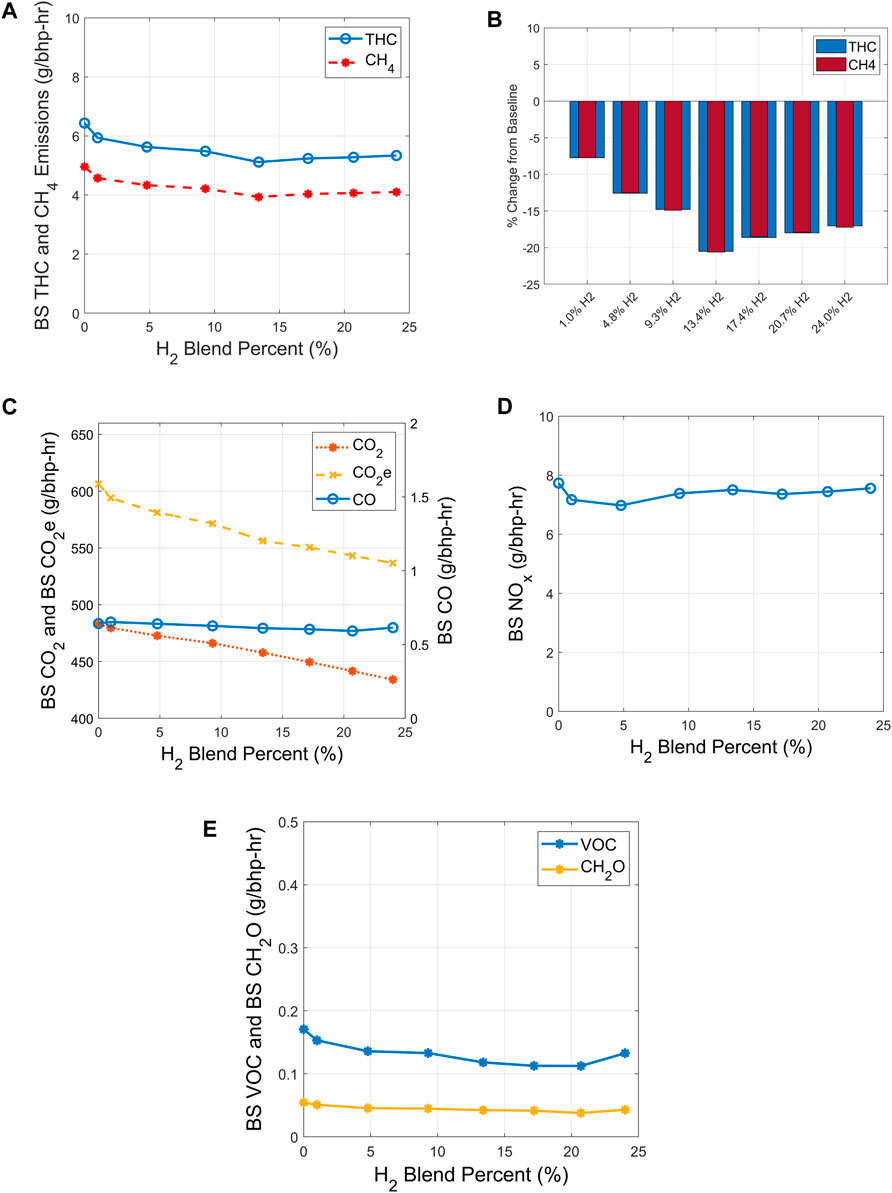
Figure 6
www.frontiersin.org

Figure 6. (A) MGAV H2 sweep: brake-specific THC and CH4 emissions as a function of H2 blend percentage. (B) MGAV H2 sweep: percentage change of brake-specific THC and CH4 emissions versus H2 blend percentage. (C) MGAV H2 sweep: brake-specific CO, CO2, and CO2e emissions versus H2 blend percentage. (D) MGAV H2 sweep: brake-specific NOx emissions versus H2 blend percentage. (E) MGAV H2 sweep: brake-specific VOC and formaldehyde emissions versus H2 blend percentage.

4.1.3.2 CO, CO2, and CO2e

Because of the reduction in brake-specific CH4 emissions, brake-specific CO2 and CO2e values were also expected to fall. Figure 6C shows the emissions for CO, CO2, and CO2e. CO2 and CO2e do decrease in value compared to the baseline case. The baseline case produced 482 and 606 g/bhp-hr of CO2 and CO2e, respectively. A solid decline in emissions was seen as the percentage of H2 increased, leading to the minimum values of 434 g/bhp-hr for CO2 and 536 g/bhp-hr for CO2e with the 24% H2 blend. This is a reduction of 10% for CO2 and 11.5% for CO2e. CO emissions essentially remained constant for all fuel blends.

4.1.3.3 NOx

NOx emissions were relatively unchanged for each fuel blend. Individual emissions for each blend percentage can be seen in Figure 6D. The baseline data point produced 7.73 g/bhp-hr whereas the blended fuels produced between 7.0 g/bhp-hr (1% H2) and 7.55 g/bhp-hr (24% H2).

4.1.3.4 VOC’s and CH2O

Figure 6E shows the brake-specific VOC emissions versus H2 blend percentage. The baseline datapoint produced 0.171 g/bhp-hr. As the percentage of H2 increased, VOC emissions showed a general decrease, leading to the 20.7% H2 blend which produced 0.112 g/bhp-hr. The 24.0% blend showed a slight increase from the 20.7% blend’s output (0.133 g/bhp-hr), but still less than baseline.

Figure 6E shows the brake-specific CH2O emissions versus hydrogen blend percentage. Similarly, a decrease in emissions is seen as the percentage of H2 increases. The greatest reduction in emissions took place using the 20.7% H2 blend, resulting in a drop from 0.054 g/bhp-hr (baseline) to 0.038 g/bhp-hr—a nearly 30% reduction.

5 Conclusion

When natural gas–hydrogen blended fuels were used with HPFI in both the MCC and PCC, coupled with load/power output kept constant, there was an increase in cylinder pressure—the higher the percentage of H2 used, the higher the peak pressure. The 41.3% H2 blend produced a 15% increase in the MCC peak pressure over the baseline. The location of peak pressure was shown to move forward in cycle time as the H2 content increased as well. The 41.3% blend had a LoPP nearly 3° before the baseline. Peak pressure COVs also showed improvement. The largest fuel consumption improvement, a nearly 1.8% decrease, came from the 41.3% H2 blend. Similar results were shown by Yusuf (1993), Karim et al. (1996), Pan et al. (2019), and Ma et al. (2008).

Ignition-delay duration times, combustion duration times, and BSEC all saw decreases as the percentage of H2 increased. Using the 41.3% blend, ignition delay decreased by approximately 1.6°, combustion duration by approximately 4.2°, and the BSEC decreased by nearly 1.8%. It should be noted that the best combustion performance took place using the 43% H2 blend, but the best BSEC was shown to take place using the 31.6% blend—likely due to experimental uncertainty.

THC and CH4 emissions showed decreases as H2 was added to the natural gas (similar to Akansu et al. (2007)) with a maximum reduction of 28% coming from the 31.6% blend. CO and CO2 saw decreases as well due to the carbon in the fuel being replaced with hydrogen. NOx values increased (Yusuf, 1993; Ma and Wang, 2008), relatively linearly, as the H2 content increased, with the 41.3% blend producing the highest output with a 70% increase over the baseline due to the higher flame temperature (Park et al., 2007).

Due to these experimental results, coupled with the previously cited research, it is expected that the addition of hydrogen to a natural gas fuel in large total volume percentages will result in a stronger, faster, and hotter combustion event producing a higher peak cylinder pressure, advanced LoPP, higher NOx emissions, and lower CH4/THC emissions. The magnitude of each parameter’s change would be dependent on the amount of H2 blended into the fuel.

When natural gas–hydrogen blends were used as the PCC fuel and the MCC used just natural gas, there was little change seen in the combustion statistics, even at the higher H2 percentage blends. The addition of hydrogen also made little impact on the emissions until the 80% H2 blend was reached. At this point a reduction in THC and CH4 of around 8% was shown. CO2 remained constant across all fuel blends. NOx emissions increased from the onset of H2 addition to about 80% H2. At the 90% blend, NOx fell slightly below the baseline values.

The results of this experiment showed that the addition of H2 to the PCC’s natural gas supply did have a positive effect on the engine CH4 emissions. However, because the PCC’s fuel mass per cycle is 1%–3% that of the MCC’s fuel mass, the effects of H2 are much less pronounced, and the same results may be seen through alternative adjustments (e.g., PCC nozzle size, PCC nozzle orientation, PCC volume, etc.).

When using the blended fuels with the MGAV fueling configuration, the same trends were observed as the HPFI fueling configuration with both MCC and PCC fuels being blended. At 24.0% H2 blend, the peak pressure increased by 5%, the LoPP moved forward in time by nearly 2°, the peak pressure COV decreased by 2.3°, the ignition delay decreased by −1.4°, the combustion duration decreased by just over 1°, and the BSEC was reduced by over 2%.

The emissions exhibited similar behavior. THC and CH4 emissions saw a maximum decrease in output at the 13.4% H2 blend of just over 20% compared to the baseline. CO2 output dropped by 10% when using the 24.0% H2 blend. CO values remained constant for all blends. NOx emissions also stayed relatively constant across all tested blends.

The resulting engine emissions from the addition of H2 to the fuel supply seem to be independent of engine configuration. Although the magnitudes of the baseline-to-point changes may differ, the general trends hold true. As the percentage of H2 goes up, carbon based emissions go down with an optimal value at some percentage of H2 (which does change with engine configuration).

These testing results not only show that using H2 as a blended fuel can help existing large-bore natural gas engines meet the stringent emissions standards in effect (and going into effect) but also that improving an engine’s performance to meet these standards can be done with relative ease. Both the HPFI (MCC/PCC blend) and the MGAV configurations saw a reduction in BSFC of approximately 2% at the highest H2 percentage blend tested (41% and 24%, respectively). This reduction in fuel cost, when extended to a dollar per year basis, makes this performance-improving approach rather attractive, especially considering the ease at which the H2 blending infrastructure can be scaled. Additionally, the natural gas pipeline industry is making great steps in implementing the transportation of blended hydrogen and natural gas, driven by government regulations, so it is only a matter of time before engines of this nature will be faced with a blended fuel.

Although, in general, the trends in engine performance and emissions output as a function of H2 blend percentage are similar in many engines, for a truly optimized system, a study of the specific engine and it is tolerance and sensitivity to H2 addition should be performed.

Data availability statement

The datasets presented in this article are not readily available because they are proprietary. Requests to access the datasets should be directed to aW5mb0BwcmNpLm9yZw==.

Author contributions

GV: conceptualization, data curation, formal analysis, investigation, methodology, visualization, writing–original draft, and writing–review and editing. RL: visualization and writing–original draft. MP: writing–review and editing. DO: writing–review and editing and writing–original draft.

Funding

The authors declare that financial support was received for the research, authorship, and/or publication of this article. This research was made possible through funding from the Pipeline Research Council International (PRCI).

Conflict of interest

Author MP was employed by the company Cooper Machinery Service.

The remaining authors declare that the research was conducted in the absence of any commercial or financial relationships that could be construed as a potential conflict of interest.

Publisher’s note

All claims expressed in this article are solely those of the authors and do not necessarily represent those of their affiliated organizations, or those of the publisher, the editors, and the reviewers. Any product that may be evaluated in this article, or claim that may be made by its manufacturer, is not guaranteed or endorsed by the publisher.

Supplementary material

The Supplementary Material for this article can be found online at: https://www.frontiersin.org/articles/10.3389/ffuel.2024.1404367/full#supplementary-material

References

Akansu, S., Kahraman, N., and Ceper, B. (2007). Experimental study on a spark ignition engine fuelled by methane–hydrogen mixtures. Int. J. Hydrogen Energy 32, 4279–4284. doi:10.1016/j.ijhydene.2007.05.034

CrossRef Full Text | Google Scholar

de Vries, H., Mokhov, A. V., and Levinsky, H. B. (2017). The impact of natural gas/hydrogen mixtures on the performance of end-use equipment: interchangeability analysis for domestic appliances. Appl. Energy 208, 1007–1019. doi:10.1016/j.apenergy.2017.09.049

CrossRef Full Text | Google Scholar

Du, Y., Yu, X., Wang, J., Wu, H., Dong, W., and Gu, J. (2016). Research on combustion and emission characteristics of a lean burn gasoline engine with hydrogen direct-injection. Int. J. Hydrogen Energy 41, 3240–3248. doi:10.1016/j.ijhydene.2015.12.025

CrossRef Full Text | Google Scholar

Karim, G., Wierzba, I., and Al-Alousi, Y. (1996). enMethane-hydrogen mixtures as fuels. Int. J. Hydrogen Energy 21, 625–631. doi:10.1016/0360-3199(95)00134-4

CrossRef Full Text | Google Scholar

Ma, F., and Wang, Y. (2008). Study on the extension of lean operation limit through hydrogen enrichment in a natural gas spark-ignition engine. Int. J. Hydrogen Energy 33, 1416–1424. doi:10.1016/j.ijhydene.2007.12.040

CrossRef Full Text | Google Scholar

Ma, F., Wang, Y., Haiquan, L., Yong, L., Junjun, W., and Shangfen, D. (2008). enEffects of hydrogen addition on cycle-by-cycle variations in a lean burn natural gas spark-ignition engine. Int. J. Hydrogen Energy 33, 823–831. doi:10.1016/j.ijhydene.2007.10.043

CrossRef Full Text | Google Scholar

Mariani, A., Prati, M. V., Unich, A., and Morrone, B. (2013). Combustion analysis of a spark ignition i. c. engine fuelled alternatively with natural gas and hydrogen-natural gas blends. Int. J. Hydrogen Energy 38, 1616–1623. doi:10.1016/j.ijhydene.2012.11.051

CrossRef Full Text | Google Scholar

Pan, J., Lu, Y., Huang, M., Otchere, P., Chen, W., and Fan, B. (2019). Effect of different hydrogen blending ratios on combustion process of gasoline-fueled rotary engine. Environ. Prog. and Sustain. Energy 38, 13200. doi:10.1002/ep.13200

CrossRef Full Text | Google Scholar

Park, J., Hwang, D. J., Park, J. S., Kim, J. S., Keel, S. I., Cho, H. C., et al. (2007). Hydrogen utilization as a fuel: hydrogen-blending effects in flame structure and NO emission behaviour of CH4–air flame. Int. J. Energy Res. 31, 472–485. doi:10.1002/er.1259

CrossRef Full Text | Google Scholar

Vieira, G. D., Banji, T., Lorenzen, R., and Olsen, D. B. (2024). Methane abatement from LB NG 2-stroke cycle engines through in-cylinder modifications. Tech. Rep. PR179-21205-R01.

Google Scholar

Wang, J., Chen, H., Liu, B., and Huang, Z. (2008). Study of cycle-by-cycle variations of a spark ignition engine fueled with natural gas–hydrogen blends. Int. J. Hydrogen Energy 33, 4876–4883. doi:10.1016/j.ijhydene.2008.06.062

CrossRef Full Text | Google Scholar

Yusuf, M. J. (1993). Lean burn natural gas engines engine: modification versus hydrogen blending.

Google Scholar

Keywords: hydrogen, natural gas, methane reduction, internal combustion engines, fuel blending, large bore, two-stroke

Citation: Vieira G, Lorenzen R, Patterson M and Olsen D (2024) Methane emission reduction through hydrogen blending in a large bore 2-stroke lean-burn natural gas compressor engine. Front. Fuels. 2:1404367. doi: 10.3389/ffuel.2024.1404367

Received: 20 March 2024; Accepted: 11 November 2024;
Published: 09 December 2024.

Edited by:

Rakesh Kumar Maurya, Indian Institute of Technology Ropar, India

Reviewed by:

Carlo Beatrice, Institute of Sciences and Technologies for Sustainable Energy and Mobility (CNR-STEMS), Italy
Angelo Onorati, Polytechnic University of Milan, Italy

Copyright © 2024 Vieira, Lorenzen, Patterson and Olsen. This is an open-access article distributed under the terms of the Creative Commons Attribution License (CC BY). The use, distribution or reproduction in other forums is permitted, provided the original author(s) and the copyright owner(s) are credited and that the original publication in this journal is cited, in accordance with accepted academic practice. No use, distribution or reproduction is permitted which does not comply with these terms.

*Correspondence: Greg Vieira, Z3JlZy52aWVpcmFAY29sb3N0YXRlLmVkdQ==

Disclaimer: All claims expressed in this article are solely those of the authors and do not necessarily represent those of their affiliated organizations, or those of the publisher, the editors and the reviewers. Any product that may be evaluated in this article or claim that may be made by its manufacturer is not guaranteed or endorsed by the publisher.