 Cynthia Kusin Okoro-Shekwaga1*
 Mark Wilmshurst2
- 1BioResource Systems Research Group, School of Civil Engineering, University of Leeds, Leeds, United Kingdom
- 2Olleco, Merseyside, Liverpool, United Kingdom
Dark fermentation of food waste for biohydrogen production is a progressive technology that can contribute to low-cost solutions to the global clean energy need. As dark fermentation research progresses, it is important to evaluate opportunities for real-life application such as integration into existing anaerobic digestion systems. The present study proposes a novel approach of combined inoculum and food waste heat shock pretreatment for biohydrogen production through dark fermentation. It evaluates the effect of the heating duration (at 115°C) and starting pH on the biohydrogen yield and system profiles in two stages, namely, Exp1 and Exp2. Exp1 investigated the optimal heating duration and starting pH for a combined inoculum/food waste heat shock pretreatment. A 24-h biohydrogen production test at four heating durations (15, 30, 45 and 60 min) was assayed at acidic and alkaline pH ranges (4, 5, 6 and 8, 9, 10). The optimal starting pH from these experiments across all four heating durations was pH 5. Biohydrogen yield increased linearly from 37.4 to 63.8 mL/gVS, with an increase in heating duration from 15 to 60 min at pH 5. However, an optimal heating duration was not reached, therefore, additional tests were conducted at pH 5 for extended heating durations of 75–120 min. Biohydrogen yield was similar at 75, 90 and 105-min heating durations in a range of 69.7–73.5 mL/gVS. Above 105 min of heating duration, the overall gas production starts to decline, making it the maximum allowable heating duration. In Exp2, a comparative analysis of the system profiles between the combined inoculum/food waste pretreatment (Test) and inoculum-only pretreatment (Control) was investigated using the optimal heating duration range (75 and 105 min) and starting pH of 5. The peak biohydrogen yield from the Control was achieved following a 75-min heating duration (84.5 mL/gVS, 58.6%), while this was achieved following a 90-min heating duration for the Test (81.3 mL/gVS, 53.3%). Higher volatile fatty acids fermentation and pH recovery were achieved in the Test in addition to potential economic savings compared to the Control. Therefore, the innovative approach of combined food waste/inoculum heat shock pretreatment (Test) presents opportunities to integrate dark fermentation into existing anaerobic digestion systems as a step to scale up the dark fermentation technology from lab to real-life application.
1 Introduction
An estimated 931 million tonnes of food is wasted each year (UNEP, 2021), equivalent to about 40% of the food produced globally (WRAP, 2021). Food waste (FW) is generated at different levels around the world, which is influenced by many factors including, increasing global population, changing socio-economic dynamics, regionally peculiar infrastructural and other attitudinal responses at different levels of the food production, supply and consumption chain (Okoro-Shekwaga et al., 2021). Despite the complexities associated with FW generation, collection and management across different systems around the world, what is not complex to appreciate is the negative impact of FW on global environmental sustainability. FW contributes about 37% of the global greenhouse gas (GHG) emissions and FW management competes for important resources such as water, land and energy (WRAP, 2021). The 2021 UNEP FW Index Report states that “If food loss and waste were a country, it would be the third biggest source of greenhouse gas emissions” (UNEP, 2021). However, like a two-faced coin, FW can either be viewed as a problem with its many environmental, socio-economic and health hazards, or we could flip the coin and view it as a sustainable resource that could contribute to the global climate change solution, by its conversion to affordable low-carbon fuel like hydrogen (H2).
Currently, H2 produced at a commercial scale is primarily through steam reforming of heavy oils (30%) and natural gas (48%) gasification of coal (18%) and the recent renewable alternative by water electrolysis (4%) (International Energy Agency, 2006). These technologies require high energy input and are largely unsustainable, but biological H2 (bioH2) production offers a low-cost, low-energy alternative (Guo et al., 2010; Ghimire et al., 2015). Moreover, producing bioH2 from FW would enable FW recycling, resulting in multi-level impacts like a reduction in GHG emissions, decline in the associated health and environmental hazards, increase in job opportunities, and decrease in waste disposal costs; ultimately enabling a circular bioeconomy (Parthiba Karthikeyan et al., 2018).
BioH2 production involves the natural process of H2 release when some microorganisms feed. The process of bioH2 production can be grouped into two (2); light-dependent and light-independent. Light-dependent bioH2 processes include direct water biophotolysis by green algae, indirect water biophotolysis by cyanobacteria and photo-fermentation of organic materials by photosynthetic bacteria. Light-independent processes include dark fermentation (DF) of organic materials by anaerobic bacteria and microbial electrolysis cells (Ghimire, 2015). FW has quite a complex composition, therefore, DF which provides a complex microbial ecosystem, becomes the most suitable biological process for bioH2 production from FW (Guo et al., 2010).
DF occurs by the activities of anaerobic fermentative bacteria characterised by the same biochemical reactions of the fermentation stages (acidogenesis and acetogenesis) of the well-established anaerobic digestion (AD) technology–sometimes DF is referred to as a “stressed AD” (Al-Haddad et al., 2023). This presents a unique opportunity to integrate DF into AD systems, given the widespread technical know-how of AD technology globally. Moreover, AD systems offer a good source of H2-producing bacteria (HPB), like Clostridium, and so, the liquid effluent from AD (digestate) is often used as inoculum (seed) for DF processes. However, digestate also contains communities of other H2-consuming bacteria (HCB) that could inhibit the DF process, therefore, it must be pretreated to inactivate the HCB, thus, enabling an enrichment of the HPB (Wong et al., 2014).
Because of the spore-forming characteristic of most HPB, they can survive harsh pretreatment conditions better than the non-spore-forming HCB. Therefore, inoculum pretreatment for DF can be achieved by subjecting it to extreme processes such as heating, ultraviolet irradiation, freezing and thawing, ultrasonication and aeration, or chemical processes like pH (acid or base) shocks, and chemical activation and inhibition (Wong et al., 2014). Heat shock is the most widely adopted inoculum pretreatment method; because it is cheap, simple and effective in enriching HPB (Ghimire et al., 2015). Heat shock pretreatment of digested sludge was confirmed to have high Clostridia populations (Lay et al., 2005). The effectiveness of the heat shock, however, would depend on various factors including inoculum source and the population of HCB and HPB originally present, the magnitude of the heat applied, the heating duration and the pH (Wong et al., 2014; Kumar et al., 2016). This is important because, if the inoculum has a sizeable population of non-spore-forming HPB like Bacillus sp. present, exposure to extreme pretreatment processes could also inhibit this group of HPB, leading to reduced bioH2 yield (Pu et al., 2019). Moreover, the enzymatic metabolisms of the consortia of anaerobic microorganisms are governed by pH, whereby, primary fermenters (acidogens) often require a pH of around 5, while the secondary fermenters (acetogens) do well in a pH range of 6.8–7.6 (Okoro-Shekwaga et al., 2019). Like the heat-shock treatment, the optimal starting pH level for effective bioH2 production is also closely linked to the inoculum source and microbial composition. Consequently, due to the large disparities in the inoculum type, substrate as well as pretreatment characteristics, the reported optimal starting pH for FW is inconsistent, ranging from 4.0 (Fang et al., 2006) to 7.0 (Lee et al., 2008).
Sewage sludge digestate is commonly used as the ideal inoculum to seed DF experiments (including FW DF) because it contains a wide range of active microorganisms to support an increased bioH2 production potential (Wong et al., 2014; Pu et al., 2019). However, the use of sewage sludge digestate to seed continuous FW DF systems presents a limitation around waste licensing and the applicability of the final digestate as a fertilizer under the PAS110 scheme in the UK, for example,. It is, therefore, important to explore ways to use food-based digestate as inoculum (which is currently underexplored in literature), as well as suitable inoculum/FW pretreatment designs that allow seamless integration with existing AD processes.
In the present study, the authors propose a novel approach of subjecting the inoculum (obtained from a food-based AD) with FW to a combined heat-shock pretreatment and identifying the optimal starting pH for the same. The anaerobic microbial is reported to be able to autocatalyse to the input feedstock and the microbial population would dominate in proportion to the original nutrients present at the start (Chen et al., 2008). The authors, therefore, hypothesise that subjecting the inoculum and the feedstock (FW) to a combined heat shock pretreatment would provide multiple advantages (i) Inactivation of the HCB in the inoculum; (ii) Increased substrate solubilisation leading to improved digestibility and bioH2 production; (iii) An autocatalysis of the HPB to the solubilised FW, which is particularly of advantage where separate FW pretreatment is carried out and (iv) The potential for a reduced operational costs and energy demand for independent inoculum and FW pretreatment for real-life application. Statistical approaches were adopted to test this hypothesis through a series of connecting experiments, including (i) Design of experiments (DoE) to identify optimal combinations of heating durations and starting pH and (ii) DoE to assay the system dynamics as impacted by the pretreatment design; profiling key process indicators like volatile fatty acids (VFA). To the authors’ knowledge, no study has considered the potential of combining the inoculum and FW in a single heat shock pretreatment step. The present study, therefore, provides this novelty as a strategy to ramp up R & D on bioH2 from FW from lab to real-life application.
2 Materials and methods
This study combines experimental and statistical approaches to investigate the production of bioH2 from FW by DF. Batch experiments were set up to test the effect of subjecting the inoculum and FW to a combined heat-shock pretreatment at different heating durations. In the first step (Exp1), a General Factorial DoE was used to assess the effects of heating duration and starting pH on bioH2 yield. In the second step (Exp2), a comparative study was set up to assess the system responses at optimal heating durations and starting pH.
2.1 Inoculum and food waste processing
2.1.1 Inoculum source
The inoculum used in this study was digestate obtained from a mesophilic anaerobic digester treating FW at Olleco, Liverpool, UK (industrial collaborator). The inoculum was characterised by total solids (TS), volatile solids (VS), total chemical oxygen demand (TCOD), soluble chemical oxygen demand (sCOD), alkalinity, pH, and ammonium-nitrogen (NH4+ -N) – details presented in Table 1. The inoculum was stored at 4°C and analysed for TS and VS 2 days before each assay.
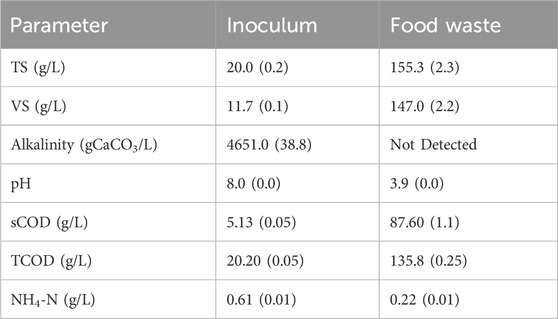
Table 1. Characteristics of inoculum and food waste used in the present study (standard deviation in brackets, n=3).
2.1.2 Food waste source
FW was obtained from the University of Leeds’ Refectory as leftovers from plates and kitchen wastes from food processing, according to previously published sampling and processing methods (Okoro-Shekwaga et al., 2020). The processed FW was sieved through a 1 mm sieve and the undersize was collected for the batch bioH2 potential (BHP) experiments. The processed FW was characterised by the same parameters listed in Section 2.1.1 and stored at −20 C. Before each assay, the FW sample was transferred to a 4°C fridge 7-days prior to the experimental setup to allow for gradual defrosting without the application of heat and analysed for TS and VS 2 days before each assay.
2.2 Exp1: design of experiment to test the impact of starting pH and heating duration on biohydrogen
BHP experiments were designed to test the potential for bioH2 production by a combined heat-shock pretreatment of the inoculum and FW, at different heating durations and starting pH values. The samples were prepared using an inoculum-to-substrate ratio (ISR) of 2:1 on a VS basis (10gVS inoculum: 5gVS of FW). The calculated amount of inoculum and FW at the respective VS contents were combined into a bulk sample and heated in an oven at 115°C. This heat-shock temperature follows a previous study using glucose as feedstock and sewage sludge digestate as inoculum, whereby inoculum heat-shock treatment at 115°C demonstrated a high bioH2 yield (Al-Haddad et al., 2023). To optimise the heating duration for FW as feedstock in the present study, four heating durations were initially tested; 15, 30, 45 and 60 min (Figure 1).
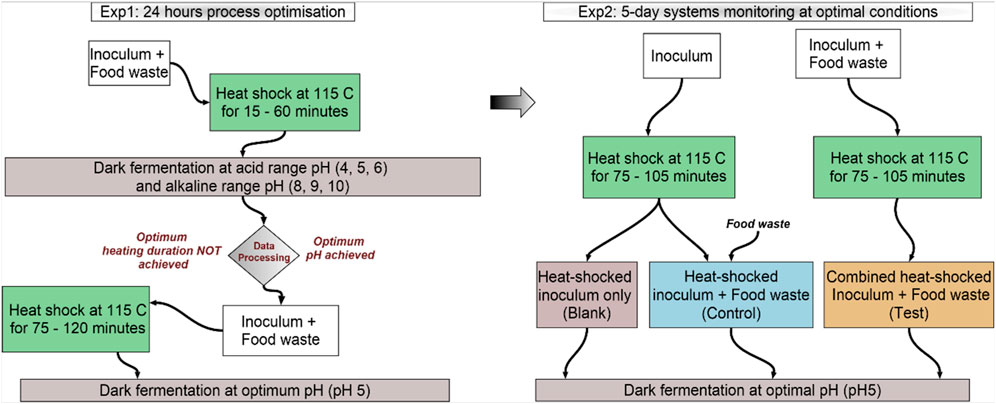
Figure 1. Schematic representation of the experimental set-up.
The bulk heat-shocked sample from each heating duration was allowed to cool down at room temperature and then used to set up batch BHP tests at six starting pH; acidic pH (4, 5 and 6) and alkaline pH (8, 9 and 10). The pH of the heat-shocked samples was adjusted to achieve the desired pH with an allowable error margin of pH±0.2, using hydrochloric acid (HCl) for the acidic pH values and sodium hydroxide (NaOH) for the alkaline pH values. The samples were then split into 160 mL Wheaton bottles as bioreactors at 70 mL working volume in triplicates. Each reactor was purged with nitrogen gas (N2) for 1 min to achieve anaerobic conditions and sealed with rubber seals and aluminium crimps to keep it airtight. The reactors were incubated at 37°C for 24 h.
After 24 h, the gas volume was analysed by water displacement following previously developed methods (Okoro-Shekwaga, 2019). The composition of the gas was analysed by gas chromatography (GC) using Agilent 990 Micro GC (MGC990, see Section 2.4.1 for description). Analysis of the data from this step revealed the potential for increased bioH2 production at longer heating duration. Therefore, the experiments were further assayed at extended heating durations of 75, 90, 105 and 120 min, at the observed optimal pH of 5 (Figure 1).
2.3 Exp2: assessment of system dynamics from 5-day batch experiments
The optimal conditions of pH and heating duration from Exp1 (described in Section 2.2) were used to set up a 5-day batch BHP assay. For these experiments, three samples were prepared as shown in Figure 1; (i) Blank, whereby the inoculum was heat-shocked alone and assayed without the addition of FW; (ii) Control, being the conventional approach, whereby the inoculum was heat-shocked alone followed by the addition of FW at an ISR of 2:1; and (iii) Test, being the primary novelty of the present research, whereby, the inoculum and FW were mixed at an ISR of 2:1, followed by the heat-shock of the combined sample. These assays were set up to test whether a combined pretreatment of the inoculum and FW (Test) presented any advantage to the overall BHP process over the conventional approach of pre-treating only the inoculum (i.e., Control). The assays were prepared as sacrificial samples in triplicates for each analytical point (Day 0, Day 1, Day 2, Day 3 and Day 4). The same operating conditions adopted in Exp1 (described in Section 2.2) were used to set up Exp2, including a 70 mL working volume in 160 mL Wheaton reactors fermented at 37°C. The gas produced was analysed for yield (volume) by water displacement and composition using the MGC990 and the slurry was analysed for the pH and VFA contents daily.
2.4 Analytical procedures for process monitoring
2.4.1 Gas sampling and analysis
The MGC990 uses a thermal conductivity detector (TCD) with helium as carrier gas and is equipped with a CP-PORA BOND column for methane (CH4), N2, Oxygen (O2) and H2 gases analyses and a PORA PLOT column for carbon dioxide (CO2) gas analysis. The injector temperature for both columns was 110 C. The column temperature and pressure for the CPPORA BOND column were 80 C and 200 kPa respectively and 70 C and 175 kPa for the PORA PLOT column respectively. The MGC990 was calibrated with three standard gas mixtures; 50%CH4:3%H2:47%N2; 20%O2:80%N2; and 10%CO2:90%N2 before each set of assay. Using a glass syringe, 10 mL of the headspace gas was collected from each reactor and fed manually into the MGC990 to analyse the gas composition. The MGC990 analysis time per sample was 3 minutes. The remainder volume of the gas generated was measured by water displacement according to previously developed methods by Okoro-Shekwaga et al. (2019). The total volume of the gas produced was then calculated as the sum of volume measured by water displacement and the 10 mL sample collected for the MGC990.
2.4.2 Liquid samples analysis
Standard analytical methods used for the examination of wastewater and sludge were adopted for the liquid sample analysis. TS and VS were measured by the gravimetric method (2540B and 2540E of standard methods, respectively) and VFA composition was analysed by GC according to 5660 B of standard methods (APHA, 2005), using Agilent Technologies, 7890A. The GC was calibrated with a SUPELCO Volatile Acid Standard Mix, which includes acetic-, propionic-, iso-butyric-, butyric-, iso-valeric-, valeric-, iso-caproic-, caproic- and heptanoic-acids. The VFA samples were prepared by first adjusting the pH to pH 2.0 (+0.15 error margin) using phosphoric acid and allowed to rest for 30 min. The samples were then centrifuged at 14,000 RPM (16,000 g-force) for 5 min, using a HERAEUS Pico 21 centrifuge. The supernatant of the centrifuged sample was filtered through a 0.2 µm filter and the recovered liquid was analysed for VFA.
COD was analysed with the HACH Robot, using the HACH LCK514 COD cuvette, which measures COD in the range of 100–2,000 mg/L-O₂. Total COD was measured as the COD in the whole slurry (including solids), while soluble COD (sCOD) is the COD in the filtrate (without the solids). For sCOD, samples were centrifuged at 4,000 RPM (1,550 g-force) for 5 min using an Eppendorf Centrifuge and the supernatant was collected and analysed for COD. The pH of the liquid samples was measured using a pH meter (HACH, 40d). NH4+-N was analysed using a HACH Robot following the HACH LCK cuvette protocol.
2.5 Statistical analysis
The experiments were set up in triplicate for each sampling point and each analysis conducted on the liquid reactor content was done in triplicates to give a total of 9 readings from each sampling point (except CODs that were measured as single analytes, because of the high precision of the HACH Cuvette testing system, n = 3). All experimental data was subjected to descriptive statistical analysis including mean and standard deviation and presented as such (graphs/table values presented as mean and using standard deviation as error bars or shaded areas on graphs). All results from each group of assays (Blank, Control and Test) were first analysed individually for statistical significance, by a one-sample t-test using Minitab software. Where the results showed significant differences, further outlier test was conducted to remove outliers, before final analysis and graphical representations. The General Factorial DoE in Exp1 was analysed with Minitab software. Analysis of Variance (ANOVA) on bioH2 yields from Exp2 (See Section 2.3) was also conducted with Minitab software (α=0.05; n=12). All graphs (except the Minitab outputs) were plotted using Origin Pro software.
3 Results and discussion
3.1 Exp1: impact of heating duration and starting pH
The duration of inoculum exposure to extreme heat is key to the effectiveness of heat-shock inoculum pretreatment (Wainaina et al., 2019), of even more importance is the assayed pH, as observed in the present study (Figure 2). As shown in Figure 2, the optimal pH was pH 5, for which bioH2 production was observed at all four heating durations, while bioH2 from assays with pH below and above 5 was close to zero regardless of the heating duration (Figure 2). At pH 5, a linear increase (R2 = 0.92) in bioH2 yield was observed when the heating duration was increased from 15 to 60 min (Figure 2A).
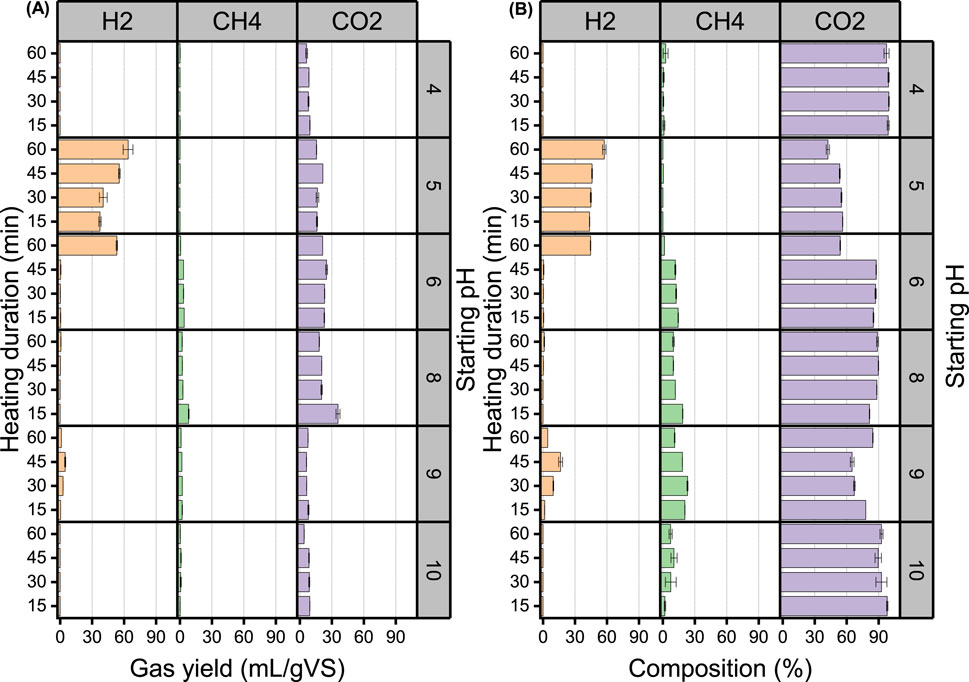
Figure 2. Gas yield (A) and percentage composition (B) of H2, CH4 and CO2 following a combined heat-shock pretreatment of inoculum and FW.
BioH2 yield was 34.7, 40.5, 55.6 and 63.8 mL-H2/gVS at heating durations of 15, 30, 45 and 60 min respectively (Figure 2A). Similarly, the quality of bioH2 improved with the increase in heating duration; 37.4, 40.5, 55.6, and 63.8% at heating durations of 15, 30, 45 and 60 min respectively (Figure 2B). Below pH 5, the gas produced was primarily CO2 (97%–100%) with trace amounts of CH4 and above pH 5 CH4 production picks up with trace bioH2 production. Delayed bioH2 production has also been reported in previous studies for starting pH levels lower than 5.0. Fang et al. (2006) tested a pH range of 4.0–7.0 for bioH2 production from rice slurry and reported a significant increase in the lag phase from 12 h at pH 5 and 5.5–36 h at pH 4.5 and 40 h at pH 4. Similarly, Khanal et al. (2004) tested a pH range of 4.5–7.0 for bioH2 production from sucrose and starch and reported a longer lag phase of over 18 h for a starting pH of 4.5, while the rest of the starting pH had around 14 ± 1 and 18 ± 1 h for sucrose and starch, respectively.
In the present study, gas production was observed to be restrained at the upper and lower pH limits tested, i.e.,–pH 4, pH 9 and pH 10, which means the entire fermentation process was inhibited when the reactors were set up at those pH levels. This might be because these pH values were further from a neutral of pH 7, considering that at strongly acidic or basic pH levels, energy is directed more towards ensuring cell neutrality rather than the activities of the HPB (Mohd Yasin et al., 2011). However, the principle of proximity to a neutral pH means that assays at pH 6 and pH 8 would be expected to perform best, being the closest to neutral pH (i.e., PH 7) in the study, which was not the case. Interestingly, significant bioH2 production was observed at pH 6 following a heating duration of 60 min. This implies that bioH2 production could be achieved at this pH level with longer exposure to heat. Therefore, it might be useful to explore FW DF assays at pH 6 further in future works, as this would allow a reduction in the amount of acid needed to achieve the starting pH.
Generally, the reported optimal pH for bioH2 production from FW is highly inconsistent. This is often impacted by the wide variability in the process operations, including inoculum type/source, microbial composition, pretreatment methods and FW characteristics (Cappai et al., 2014). Moreover, this is the first study to investigate a combined pretreatment of inoculum and substrate for DF, which presents some limitations in data comparison with previous studies. Nonetheless, the present study agrees with the ideal pH range of 5.0–6.5, which is said to support the vigorous hydrogenic activity of the primary HPB, Clostridium sp. (Kim et al., 2011).
DF studies in which independent pretreatments of inoculum and FW were conducted, confirm the heating duration is the most impacting factor on the process. For example, Bhurat et al. (2023) evaluated the effect of FW pretreatment by; autoclaving, acid pretreatment, alkali pretreatment, aeration, and fungal pretreatment and reported that the results were more significantly impacted by the pretreatment reaction time than the pretreatment technique in question. What is clear is that optimizing the pretreatment duration is key for both inoculum and FW processing for bioH2 recovery and this study combines these two steps into one. This presents a key economic advantage of reducing the capital and operating costs required to run independent reactors to pretreat the inoculum and FW (see Section 3.3). An energy balance and cost-benefit analysis of the combined approach herein proposed will be investigated in future works.
3.1.1 Statistical analysis of bioH2 yields at pH 5
The analysis of the factors of the DoE in Exp1 (heating duration and starting pH) by a “Main Effects Plot” shows a peak pH point at pH 5, confirming the optimal pH of 5 (Figure 3). However, a continuous increase is seen, with the increase in the heating duration. This means that bioH2 yield could continue to increase at extended heating durations beyond 60 min. This was further tested by a one-way ANOVA of the bioH2 yields from 15–60 min heating durations assayed at pH 5, which produced a p-value of 0.0095 (R2 = 0.928, α = 0.05). This indicates a significant difference in the bioH2 yields from the tested heating durations; using a null hypothesis that the bioH2 yields were not significantly different.
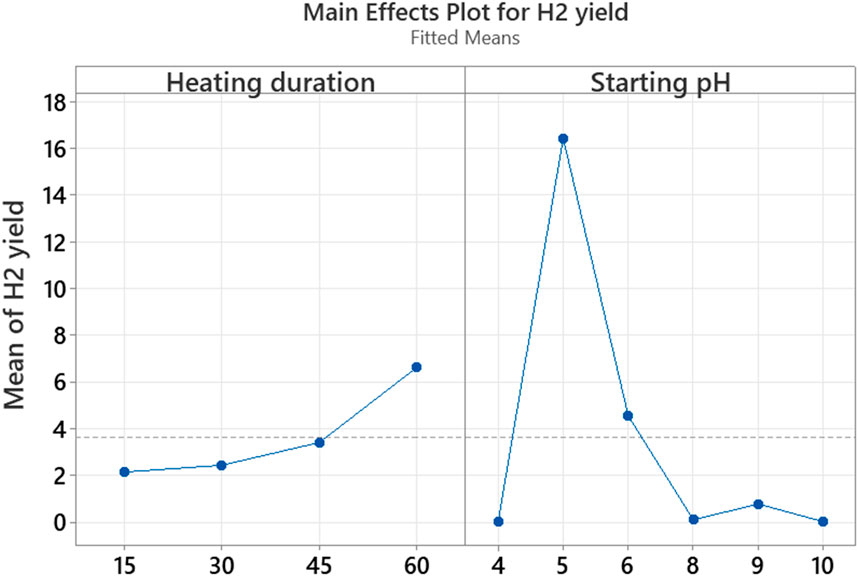
Figure 3. Factorial plot to evaluate the effects of heating duration and starting pH on the bioH2 yield.
Therefore, the heating duration was extended to 120 min (75, 90, 105 and 120 min) and assayed at the optimal starting pH of 5 to determine the heating duration at which the bioH2 yield starts to plateau or decline within the first 24 h. The data for hydrogen composition and yield at extended heating duration is presented in Figure 4.
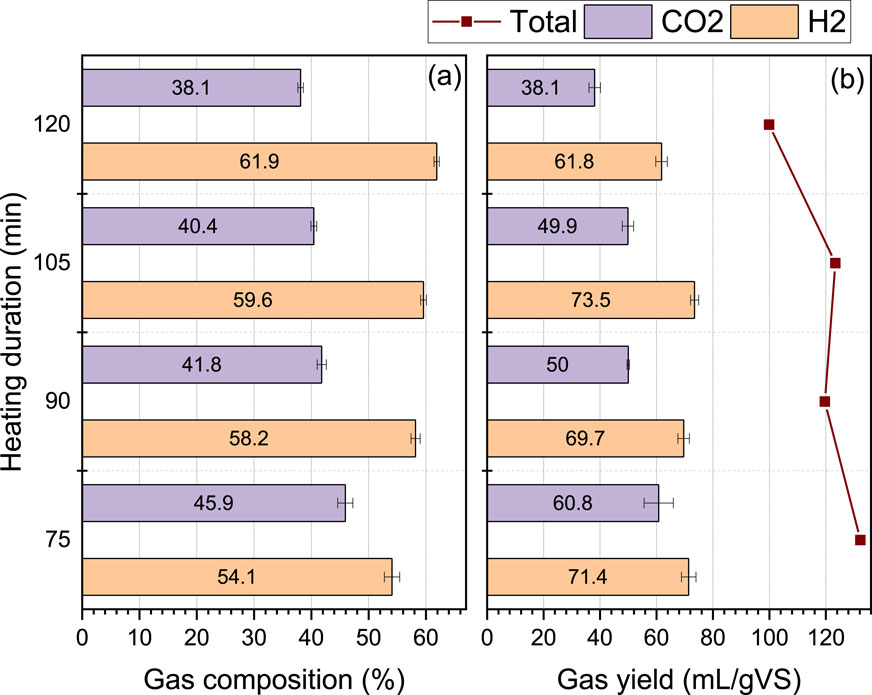
Figure 4. Gas composition (A) and yield (B) of H2, CH4 and CO2 from the combined heat-shock pretreatment of inoculum and FW at an extended heating duration of 75–120 min and starting pH of 5.
As expected, within 24 h, the composition of bioH2 improved from 54% H2 at 75 min of heating duration, to reach 62% at 120 min of heating duration (Figure 4A). Notwithstanding, a decline in the effective yield was observed when the heating duration exceeded 105 min (Figure 4B). This reduction in the volume of gas produced implies potential microbial inhibition and the tendency for an increased hydraulic retention time (HRT) under longer heating durations. Therefore, the heating duration of 75–105 min was selected as the optimal range for heat-shock pretreatment at 115°C in the present study. These conditions were then applied for further investigation in Exp2.
3.2 Exp2: systems comparison of inoculum-only versus combined inoculum/food waste pretreatment
In Exp2 a comparison between the Control (inoculum-only pretreatment + FW) and the Test (combined inoculum + FW pretreatment) setup on the fermentation rates was assessed in relation to the bioH2 production. The fermentation rates were assessed by the VFA, and pH levels were used to evaluate the process stability.
3.2.1 Fermentation profiles
In both the Control and Test assays, the acetate/butyrate pathway for bioH2 production was predominant, accounting for 85%–96% of the total VFA, which is the typical fermentation route at pH levels between 5 and 6.5 (Sekoai et al., 2018). During hydrolysis, CO2 is the principal inorganic H2 acceptor for either the production of CH4 via hydrogenotrophic methanogenesis or the production of acetate via homoacetogenesis (Okoro-Shekwaga et al., 2021). Therefore, the higher acetate levels in the Test assay than the Control within each heating duration (Figure 5) could be due to homoacetogenesis–i.e., acetate production from H2 and CO2 (Equation 1);
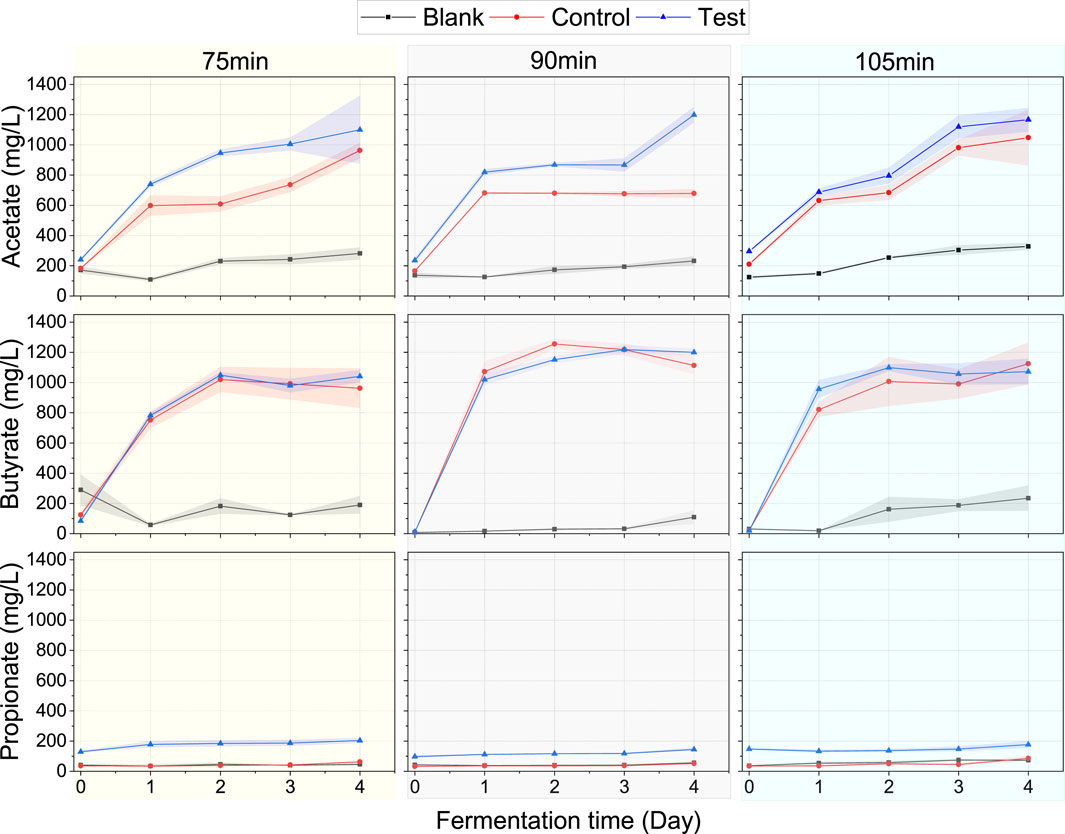
Figure 5. VFA profiles for the Blank (inoculum treated independently and assayed without FW), Control (inoculum treated independently + FW), and Test (inoculum + FW treated together). The shaded area around the lines represents the error margin represented as standard deviation (n=3).
As we would later observe in Section 3.2.2, bioH2 and CO2 yields were significantly lower in the Test assay following a 75-min heating duration, which implies higher acetate levels in the Test observed at this heating duration in Figure 5 were a result of increased homoacetogenesis. However, at 90 and 105-min heating durations, the bioH2 yields between the Test and Control were not significantly different. So, at 90 and 105-min heating durations, the high acetate levels in the Test could be attributed to the extended exposure of FW to high heat during the combined inoculum/FW pretreatment enabling improved hydrolysis of FW. Acetate is an important substrate that is converted directly to CH4 during the acetoclastic methanogenesis step of AD (Srisowmeya et al., 2020), therefore, higher production of acetate with the combined pretreatment could enhance bioCH4 production rate.
Butyrate profiles remained relatively identical in the Control and Test at the three heating durations, implying that this route of bioH2 production was not inhibited by the combined pretreatment herein adopted. Notwithstanding, when taking account of the total time-series acetate and butyrate produced, the Test yields were higher than the Control, in the following ranges: 5.5%–26.2% at 75 min, 4.4%–41.2% at 90 min and 3.0%–36% at 105 min heating duration respectively.
Furthermore, it was interesting to observe the relatively higher levels of propionate in the Test compared to the Control assays. Although, propionate was produced at significantly lower rates than acetate and butyrate across all assays; it was relatively higher in the Test (150–200 mg/L) compared to the control assays which had less than 70 mg/L across all heating durations. This presents some relevance. Like the acetate levels in the Test, the higher propionate levels could be associated with the consumption of H2 for propionate production as shown in Equation 2 (especially at a 75-min heating duration) and/or the improved hydrolysis of FW due to the exposure to high heat during the pretreatment.
Above the 75-min heating duration, the bioH2 yields and production rates between the Test and Control assays were quite similar (more details in Section 3.2.2 below). This means higher propionate production in the Test assay did not impact negatively on bioH2 production. Propionate-induced inhibition is one of the primary VFA of concern in AD processes–particularly with FW (Okoro-Shekwaga et al., 2019). As such, the higher production of propionate in the Test assays could cause VFA problems and inhibition with downstream AD. However, in a previous study, Okoro-Shekwaga et al. (2019), reported that increased removal of head space H2 improved propionate degradation. By implication, the continuous collection of the bioH2 produced during the DF process could influence a faster degradation of propionate for downstream AD. This means the combined pretreatment of inoculum and FW could improve the stability of downstream FW AD through improved propionate decomposition, thus, avoiding the build-up of same during the AD process. Therefore, the higher release of propionate and acetate by combined pretreatment of inoculum and substrate becomes of advantage for downstream bioCH4 production.
Overall, the VFA results confirm higher fermentation rates in the Test assay than in the Control. In essence, the combined pretreatment of the inoculum and FW would improve acid fermentation, which is particularly useful for downstream processing of the DF effluent for bioCH4 production.
3.2.2 Biohydrogen and pH profiles
The bioH2 yield and pattern following a 75-min heating duration were dissimilar between the Control and the Test. However, at higher heating durations of 90 and 105 min, bioH2 production followed similar yields and patterns respectively in the Control and Test (Figure 6).
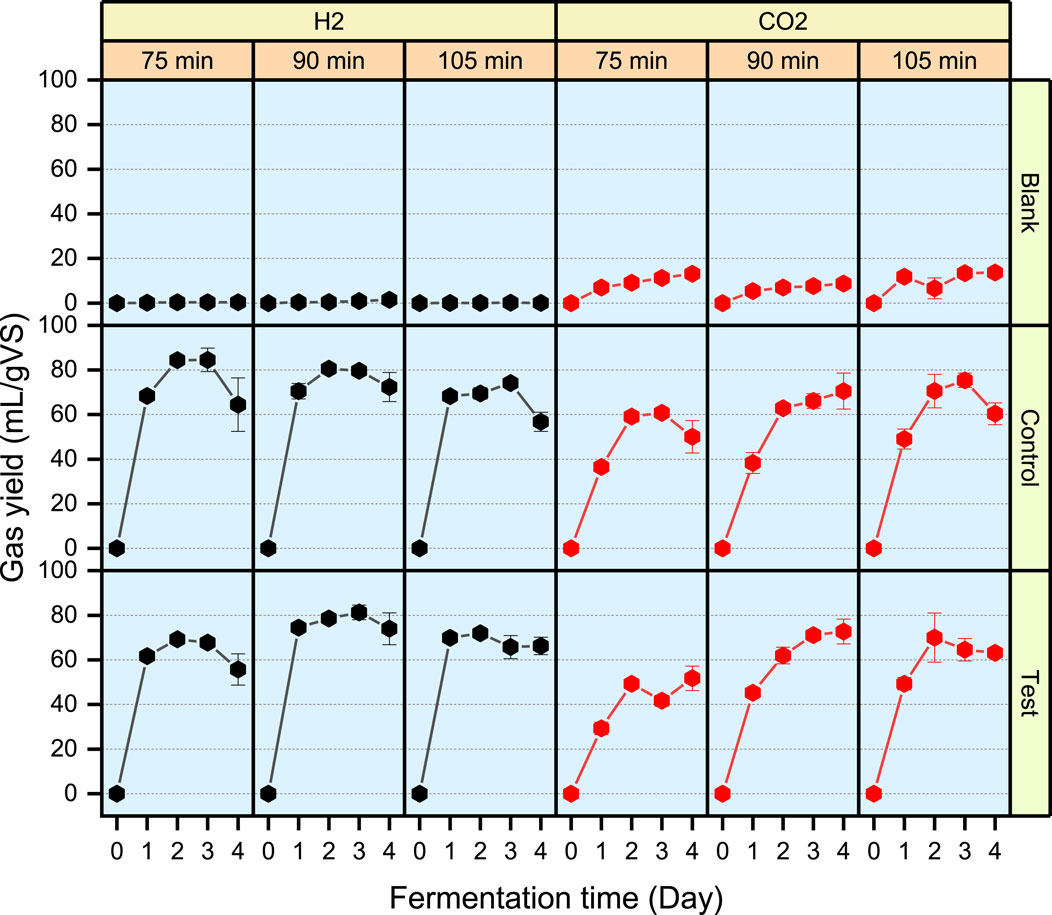
Figure 6. Biogas yields showing profiles of H2 and CO2 from a 4-day batch BHP assay for samples heated at 115°C at three treatment durations of 75, 90 and 105 min. Blank (pretreated inoculum only), Control (pretreated inoculum only + FW) and Test (combined pretreatment of inoculum and FW). The black lines represent H2 yields and the red lines represent CO2 yields from each assay.
In all assays, the bioH2 yield peaked between Day 2 and 3 (Table 2) after which a decline in bioH2 yield was observed as shown in Figure 6. At the peak levels, the highest bioH2 yield was 84.5 mL/gVS from the Control assay at a 75-min heating duration. However, at a 90-min heating duration, bioH2 yield in the Control (80.6 mL/gVS) was identical to the Test (81.3 mL/gVS). BioH2 yields from the present study agree with bioH2 yields from FW reported in a range of 57–283 mL/gVS in a review by Uçkun Kiran et al. (2014).
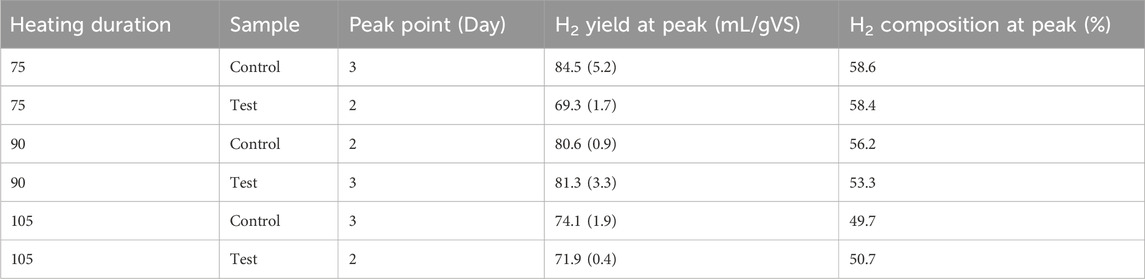
Table 2. BioH2 profiles of Control and Test assays at 75, 90 and 105 heating durations (standard deviation in brackets, n=3).
In both the Control and Test assays, longer exposure to the heat treatment (at 90 and 105 min) resulted in increased CO2 production (Figure 6), thereby, reducing the respective bioH2 purity (Table 2). Although the optimal bioH2 yields were achieved at different heating durations in the Control and Test assays, the results show that the combined pretreatment method can replace the conventional approach of the inoculum-only pretreatment, which can be specifically optimised for different AD systems.
The pH profiles from the Blank, Control and Test assays are presented in Figure 7. It is typical to observe a decline in the pH within the first 24 h due to the acidification induced by the production of VFA as seen in the Control and Test assays (Okoro-Shekwaga et al., 2021). With the VFA-induced decline, the pH recovery becomes of high importance for anaerobic fermentation/digestion because it demonstrates good system alkalinity to buffer against acid shock and potential system breakdown.
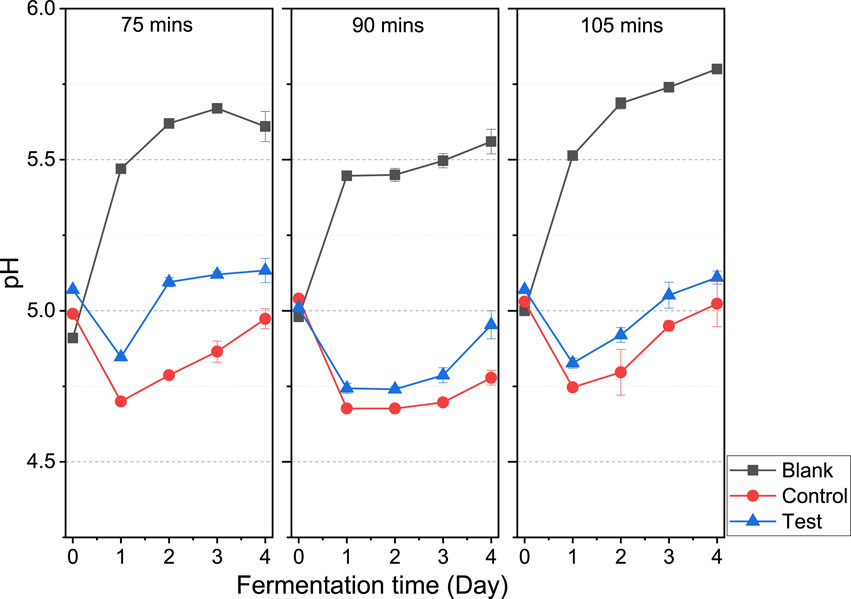
Figure 7. A comparison of pH profile as a key process stability indicator at 75, 90 and 105-min heating durations.
Although the VFA levels were higher in the Test than in the Control (as described in Section 3.2.1), the Test assay showed better pH recovery potential towards the optimal pH of 5 than in the Control. This is particularly important for a continuous bioH2 production process, whereby, the continuous operation at optimal pH would be key to maintaining process stability and avoiding system breakdown.
3.3 Research implications: Integrating dark fermentation into existing systems (insights from Olleco UK)
Although heterogeneous and variable from one location and season to another, FW is intrinsically high in moisture content (68.1%–81.5%), protein (14.3%–24.3% of TS), carbohydrates (24.0%–64.9% of TS) and lipids (14.0%–24.6% of TS) (Okoro-Shekwaga et al., 2020). These characteristics among other factors have influenced the use of AD as the best management and resource recovery (bioCH4) method. The AD process involves four biochemical reactions occurring in a syntrophic relationship in the absence of oxygen; hydrolysis, acidogenesis, acetogenesis, and methanogenesis. Hydrolysis and acidogenesis are often referred to as primary fermentation and acetogenesis as secondary fermentation. ost of the H2 contained in the molecular bonds is released during the primary fermentation, while the combined activity of H2 production and consumption could occur during the secondary fermentation (Okoro-Shekwaga et al., 2020). With an understanding of the microbial community responsible for mediating each biochemical reaction and the conditions that either promote or inhibit their optimal activities, it becomes possible to optimise the primary and secondary fermentation stages towards the production of H2 by enabling conditions that inhibit the further conversion of the solubilised substances to CH4.
The inhibition of CH4 production during DF does not necessarily mean the methanogens are dead, they are only inactive until the conditions become favourable for them to metabolise again and then CH4 production ensues as per the standard AD. In addition to H2 recovery, the liquid effluent after DF contains hydrolysed organic materials, which will help speed up the downstream AD process to reduce its overall HRT, material through-put and digestion performance and system stability. This means that bioH2 production through DF can more readily be incorporated into existing AD systems, and hence, has the potential for short-term commercial-scale exploitation in support of the global drive to build a sustainable green-hydrogen economy, due to the advanced nature of the AD technology globally.
Figure 8 presents a simplistic demonstration of the economic potential of incorporating DF into existing AD systems based on the proposed combined inoculum/FW heat-shock pretreatment. The red units are new (non-existing) units and so, require new energy input, space allocation and capital and operating costs (CAPEX and OPEX) to run The green units are already existing processes in place, which can be taken advantage of to reduce/eliminate new energy input, space allocation and CAPEX/OPEX to run.
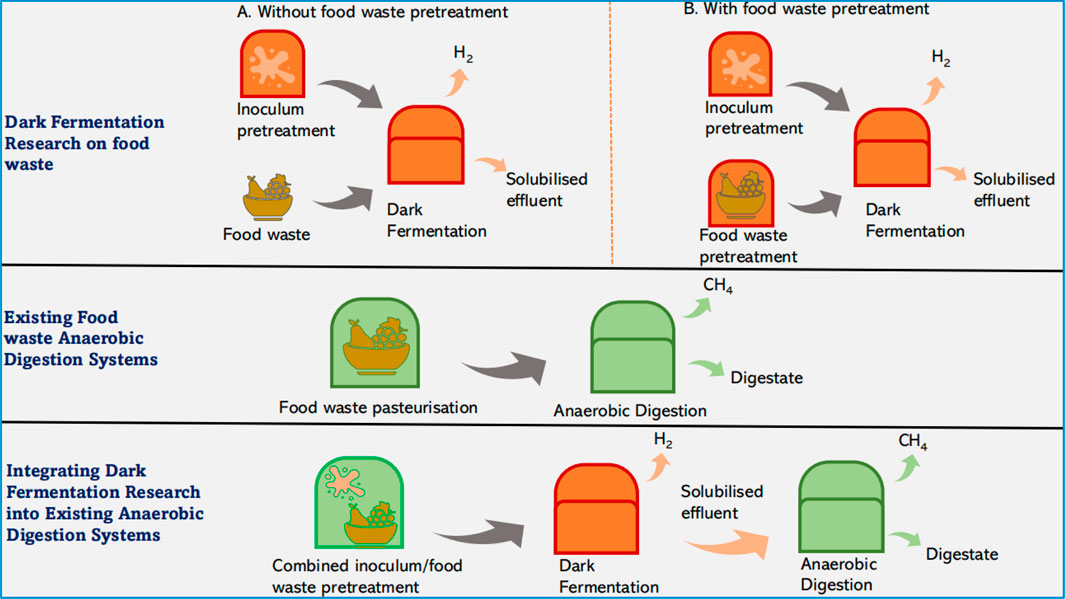
Figure 8. A simplistic representation of the opportunities to integrate the combined inoculum/food waste pretreatment into existing anaerobic digestion systems.
The conventional DF approach of pretreating the inoculum independently from the substrates would create multiple levels of operation along with associated energy and cost implications as shown in Figure 8. Some AD systems, like Olleco UK, operate a pasteurisation unit at 70°C–80°C temperature for the substrate before feeding into the AD. The pasteurisation unit in existing systems can be optimised for inoculum/FW pretreatment at onsite operating temperature, which could help reduce the potential energy and operating cost associated with DF (this will be explored in the advanced study). Hence, the innovation proposed in the present study could provide the opportunity for easy retrofitting of DF into existing AD systems.
4 Conclusion
This study describes a novel approach of combined inoculum/FW heat-shock pretreatment for DF that can allow easy integration of DF into existing AD systems. At 115°C heat pretreatment, optimal bioH2 yields were achieved between 75 and 105 min of heating durations and a starting pH of 5. At the optimal heating duration and starting pH, bioH2 yield from the combined inoculum/FW pretreatment system ranged between 69.3–81.3 mL/gVS at peak production, while peak production from separate inoculum pretreatment ranged between 74.1–84.5 mL/gVS. More importantly, the combined pretreatment approach enabled higher VFA fermentation and pH recovery potentials than the inoculum-only pretreatment, which presents a greater opportunity for integrating DF into existing AD systems. Consequently, the combined pretreatment approach described in the present study could enable a reduction in energy input, space requirement and CAPEX/OPEX required to deliver sustainable bioH2 production from FW.
Data availability statement
The raw data supporting the conclusions of this article can be made available by the authors upon request.
Author contributions
CO-S: Conceptualization, Data curation, Formal Analysis, Funding acquisition, Investigation, Methodology, Project administration, Resources, Software, Validation, Visualization, Writing–original draft, Writing–review and editing. MW: Resources, Writing–review and editing.
Funding
The author(s) declare that financial support was received for the research, authorship, and/or publication of this article. This work was funded by the UKRI’s Biotechnology and Biological Sciences Research Council (BBSRC) Discovery Fellowship [Grant Ref: BB/W010712/1, 2022] awarded to the corresponding author, CO-S.
Conflict of interest
Author MK was employed by Olleco.
The remaining authors declare that the research was conducted in the absence of any commercial or financial relationships that could be construed as a potential conflict of interest.
Publisher’s note
All claims expressed in this article are solely those of the authors and do not necessarily represent those of their affiliated organizations, or those of the publisher, the editors and the reviewers. Any product that may be evaluated in this article, or claim that may be made by its manufacturer, is not guaranteed or endorsed by the publisher.
References
Al-Haddad, S., Okoro-Shekwaga, C. K., Fletcher, L., Ross, A., and Camargo-Valero, M. A. (2023). Assessing different inoculum treatments for improved production of hydrogen through dark fermentation. Energies 16, 1233. doi:10.3390/en16031233
APHA (2005). Standard methods for the examination of water and wastewater. 21st ed. Washington, DC: American Public Health Association, American Water Works Association, Water Environment Federation.
Bhurat, K. S., Banerjee, T., Bobde, P. V., and Sureshchandra Bhurat, S. (2023). Effect of chemical, physical, and biological pre-treatment of food wastes on bio-hydrogen production by dark anaerobic fermentation under mesophilic conditions. Energy Sources, Part A Recovery, Util. Environ. Eff. 45, 1017–1029. doi:10.1080/15567036.2023.2174615
Cappai, G., De Gioannis, G., Friargiu, M., Massi, E., Muntoni, A., Polettini, A., et al. (2014). An experimental study on fermentative H2 production from food waste as affected by pH. Waste Manag. 34, 1510–1519. doi:10.1016/j.wasman.2014.04.014
Chen, Y., Cheng, J. J., and Creamer, K. S. (2008). Inhibition of anaerobic digestion process: a review. Bioresour. Technol. 99, 4044–4064. doi:10.1016/j.biortech.2007.01.057
Fang, H. H. P., Li, C., and Zhang, T. (2006). Acidophilic biohydrogen production from rice slurry. Int. J. Hydrogen Energy 31, 683–692. doi:10.1016/j.ijhydene.2005.07.005
Ghimire, A. (2015). Dark fermentative biohydrogen production from organic waste and application of by-products in a biorefinery concept 257.
Ghimire, A., Frunzo, L., Pirozzi, F., Trably, E., Escudie, R., Lens, P. N. L., et al. (2015). A review on dark fermentative biohydrogen production from organic biomass: process parameters and use of by-products. Appl. Energy 144, 73–95. doi:10.1016/j.apenergy.2015.01.045
Guo, X. M., Trably, E., Latrille, E., Carrère, H., and Steyer, J. P. (2010). Hydrogen production from agricultural waste by dark fermentation: a review. Int. J. Hydrogen Energy 35, 10660–10673. doi:10.1016/j.ijhydene.2010.03.008
International Energy Agency (2006). “Technology roadmap: hydrogen and fuel cells,” in Encyclopedia of production and manufacturing management, 781–782. doi:10.1007/1-4020-0612-8_961
Khanal, S. K., Chen, W. H., Li, L., and Sung, S. (2004). Biological hydrogen production: effects of pH and intermediate products. Int. J. Hydrogen Energy 29, 1123–1131. doi:10.1016/j.ijhydene.2003.11.002
Kim, D. H., Kim, S. H., Jung, K. W., Kim, M. S., and Shin, H. S. (2011). Effect of initial pH independent of operational pH on hydrogen fermentation of food waste. Bioresour. Technol. 102, 8646–8652. doi:10.1016/j.biortech.2011.03.030
Kumar, G., Zhen, G., Kobayashi, T., Sivagurunathan, P., Kim, S. H., and Xu, K. Q. (2016). Impact of pH control and heat pre-treatment of seed inoculum in dark H2 fermentation: a feasibility report using mixed microalgae biomass as feedstock. Int. J. Hydrogen Energy 41, 4382–4392. doi:10.1016/j.ijhydene.2015.08.069
Lay, J.-J., Fan, K.-S., Hwang, J.-I., Chang, J.-I., and Hsu, P.-C. (2005). Factors affecting hydrogen production from food wastes by Clostridium -rich composts. J. Environ. Eng. 131, 595–602. doi:10.1061/(asce)0733-9372(2005)131:4(595)
Lee, Z. K., Li, S. L., Lin, J. S., Wang, Y. H., Kuo, P. C., and Cheng, S. S. (2008). Effect of pH in fermentation of vegetable kitchen wastes on hydrogen production under a thermophilic condition. Int. J. Hydrogen Energy 33, 5234–5241. doi:10.1016/j.ijhydene.2008.05.006
Mohd Yasin, N. H., Rahman, N. A., Man, H. C., Mohd Yusoff, M. Z., and Hassan, M. A. (2011). Microbial characterization of hydrogen-producing bacteria in fermented food waste at different pH values. Int. J. Hydrogen Energy 36, 9571–9580. doi:10.1016/j.ijhydene.2011.05.048
Okoro-Shekwaga, C. K., Ross, A. B., and Camargo-Valero, M. A. (2019). Improving the biomethane yield from food waste by boosting hydrogenotrophic methanogenesis. Appl. Energy 254, 113629. doi:10.1016/j.apenergy.2019.113629
Okoro-Shekwaga, C. K., Ross, A., and Camargo-Valero, M. A. (2021). Enhancing bioenergy production from food waste by in situ biomethanation: effect of the hydrogen injection point. Food Energy Secur. 10. doi:10.1002/fes3.288
Okoro-Shekwaga, C. K., Ross, A. B., and Camargo-Valero, M. A. (2019). Improving the biomethane yield from food waste by boosting hydrogenotrophic methanogenesis. Appl. Energy 254, 113629. doi:10.1016/j.apenergy.2019.113629
Okoro-Shekwaga, C. K., Turnell Suruagy, M. V., Ross, A., and Camargo-Valero, M. A. (2020). Particle size, inoculum-to-substrate ratio and nutrient media effects on biomethane yield from food waste. Renew. Energy 151, 311–321. doi:10.1016/j.renene.2019.11.028
Parthiba Karthikeyan, O., Trably, E., Mehariya, S., Bernet, N., Wong, J. W. C., and Carrere, H. (2018). Pretreatment of food waste for methane and hydrogen recovery: a review. Bioresour. Technol. 249, 1025–1039. doi:10.1016/j.biortech.2017.09.105
Pu, Y., Tang, J., Wang, X. C., Hu, Y., Huang, J., Zeng, Y., et al. (2019). Hydrogen production from acidogenic food waste fermentation using untreated inoculum: effect of substrate concentrations. Int. J. Hydrogen Energy 44, 27272–27284. doi:10.1016/j.ijhydene.2019.08.230
Sekoai, P. T., Yoro, K. O., and Daramola, M. O. (2018). Effect of nitrogen gas sparging on dark fermentative biohydrogen production using suspended and immobilized cells of anaerobic mixed bacteria from potato waste. Biofuels 9, 595–604. doi:10.1080/17597269.2018.1432275
Srisowmeya, G., Chakravarthy, M., and Nandhini Devi, G. (2020). Critical considerations in two-stage anaerobic digestion of food waste – a review. Renew. Sustain. Energy Rev. 119, 109587. doi:10.1016/j.rser.2019.109587
Uçkun Kiran, E., Trzcinski, A. P., Ng, W. J., and Liu, Y. (2014). Bioconversion of food waste to energy: a review. Fuel 134, 389–399. doi:10.1016/j.fuel.2014.05.074
Wainaina, S., Lukitawesa, , Kumar Awasthi, M., and Taherzadeh, M. J. (2019). Bioengineering of anaerobic digestion for volatile fatty acids, hydrogen or methane production: a critical review. Bioengineered 10, 437–458. doi:10.1080/21655979.2019.1673937
Wong, Y. M., Wu, T. Y., and Juan, J. C. (2014). A review of sustainable hydrogen production using seed sludge via dark fermentation. Renew. Sustain. Energy Rev. 34, 471–482. doi:10.1016/j.rser.2014.03.008
Keywords: dark fermentation, biohydrogen, food waste, inoculum pretreatment, pH, anaerobic digestion
Citation: Okoro-Shekwaga CK and Wilmshurst M (2024) A technology integration approach for optimising biohydrogen production from food waste. Front. Fuels. 2:1404052. doi: 10.3389/ffuel.2024.1404052
Received: 20 March 2024; Accepted: 07 August 2024;
Published: 21 August 2024.
Edited by:
CHUNLI LIU, Hankuk University of Foreign Studies, Republic of KoreaReviewed by:
Apip Amrullah, Hiroshima University, JapanRazieh Rafieenia, Imperial College London, United Kingdom
Copyright © 2024 Okoro-Shekwaga and Wilmshurst. This is an open-access article distributed under the terms of the Creative Commons Attribution License (CC BY). The use, distribution or reproduction in other forums is permitted, provided the original author(s) and the copyright owner(s) are credited and that the original publication in this journal is cited, in accordance with accepted academic practice. No use, distribution or reproduction is permitted which does not comply with these terms.
*Correspondence: Cynthia Kusin Okoro-Shekwaga, Yy5rLm9rb3Jvc2hla3dhZ2FAbGVlZHMuYWMudWs=