- Department of Mechanical Engineering, University of Sheffield, Sheffield, United Kingdom
In the context of global warming and the increasing demands for the application of sustainable fuels, measurements of a variety of experimental targets under a wide range of conditions are crucial to improving the fundamental understanding of real jet fuels and developing quality kinetic mechanisms for large hydrocarbons. Planar laser-induced fluorescence (PLIF) is an effective approach to investigate concentrations of important species of a given flame while quantifying the fluorescence image remains a great challenge with significant uncertainties. This investigation aims to improve the fundamental understanding of the oxidation of kerosene-based mixtures at two equivalence ratio conditions. Two gas fuels are utilized as the reference for the quantitative studies. For each flame condition, relative OH and NO quantities and temperature profiles were measured by applying the PLIF and coated fine wire type R Pt/Pt-Rh thermocouples, respectively. The converted OH and NO results were subsequently compared with the simulation by using ANSYS Chemkin Pro, and the results indicate that reliable temperature profiles are the key to accurately quantify the species concentration of a given flame.
1 Introduction
Aviation contributes greatly to climate change due to the current fuels used in aviation are predominantly based on fossil fuels that are heavily responsible for the emission of CO2. No feasible short-term alternative to kerosene other than a sustainable aviation fuel is available, therefore a detailed understanding of the combustion behavior of both kerosene and any alternative as a point of comparison is important.
Dagaut and Cathonnet (2006) compiled a detailed review of experimental investigation for kerosene combustion. From their report and other more recent experimental studies, compared to the records of employing rigs such as shock tubes or JSR, direct measurements of the oxidation characteristics of real jet fuels or their proposed surrogates using a flat-flame burner are relatively limited, particularly under atmospheric conditions. Regarding temperature and species profile measurements of premixed kerosene flames, Doute et al. (1995) utilized thermocouples and gas chromatography to study the structure of n-decane and kerosene flames at 1 atm and the equivalence ratio of 1.7, which has been used extensively for model validation in the combustion community. More recently, von Langenthal et al. (2021) utilized the technique of tunable diode laser absorption spectroscopy and gas chromatography to investigate the characteristics of kerosene and a jet fuel surrogate at the equivalence ratio of 2.1–2.3.
Over the years, considerable work in developing detailed reaction mechanisms for kerosene combustion has been made. Despite the efforts, experimental validation over a wide range of conditions has been increasingly in demand to further enhance the quality of the model. Kinetic mechanisms of hydrocarbon fuels are commonly built based on the selected surrogate components of the targeted fuels. Over a decade ago, Honnet et al. (2009) proposed a kerosene surrogate consisting of 80% n-decane and 20% 1,2,4-trimethylbenzene and built a detailed kinetic mechanism. Dooley et al. (2010) outlined a detailed mechanism for Jet A by incorporating three individual kinetic mechanisms. In more recent years, more reference species have been selected to characterize more molecular classes in the fuels. Kathrotia et al. (2021) provided a semi-detailed mechanism to represent a variety of fuels, and their suggested components for Jet A-1 are composed of 41.1 mol% n-decane, 24.1 mol% 2-methyldecane, 13.6 mol% n-propylcyclohexane, 18.4 mol% n-propylbenzene, and 2.7 mol% decalin. In addition, research groups such as CRECK Modelling and AramcoMech have been developed and provided their respective packages concerning different species.
Ammonia (NH3) is a key species in volatile fuel and nitrogen combustion, and in recent years it has been increasingly attracting attention as a potential carbon-neutral fuel, either directly or as a hydrogen carrier. The main challenges of pure ammonia for the application of internal combustion engines are its low flammability and high ignition temperature (Erdemir and Dincer, 2021), and the common solution is to blend ammonia with other fuels such as hydrogen, methane, gasoline, etc. In this study, the mixture of methane blended with ammonia is investigated experimentally. New reaction pathways will be created by adding another hydrocarbon, and the mole ratio of ammonia/methane can also influence the concentration of the intermediate and major species. A considerable number of records of both experimental and modelling regarding NH3/CH4 can be found in the literature, particularly in recent years. Direct measurements of combustion characteristics include ignition delay time (Mathieu and Petersen, 2015; Shu et al., 2021), laminar flame speed (Konnov et al., 2006; Hayakawa et al., 2015), and temperatures and major species profiles (Tian et al., 2009; Lamoureux et al., 2017).
This investigation aims to contribute to the available data on the combustion chemistry of kerosene flames under expanded conditions. Temperature profiles and relative OH and NO concentrations concerning the height above a flat-flame burner surface were measured. By employing a quantitative method, the converted experimental data are subsequently validated against a published kinetic model. Direct temperature measurements are crucial to understand the fundamental combustion characteristics, and it has not been studied extensively for kerosene flames under atmospheric conditions. Furthermore, conventional tools such as gas analyzers are commonly utilized to measure the mole fraction of key species (e.g., O2, CO2, NO) in the targeted flames, while the effects of direct probing into the flames are difficult to correct. Hence, the non-intrusive method of PLIF tends to provide an alternative perspective to the measurement of species concentration.
2 Experimental setup
2.1 Flat-flame burner
A flat-flame burner designed by Patterson et al. (2001) was utilized to study one-dimensional premixed laminar flame structures, and an illustration of the rig is shown in Figure 1 (Catalanotti, 2011). The kerosene is provided by Shell and the detailed composition is not specified as it is commercially sensitive.
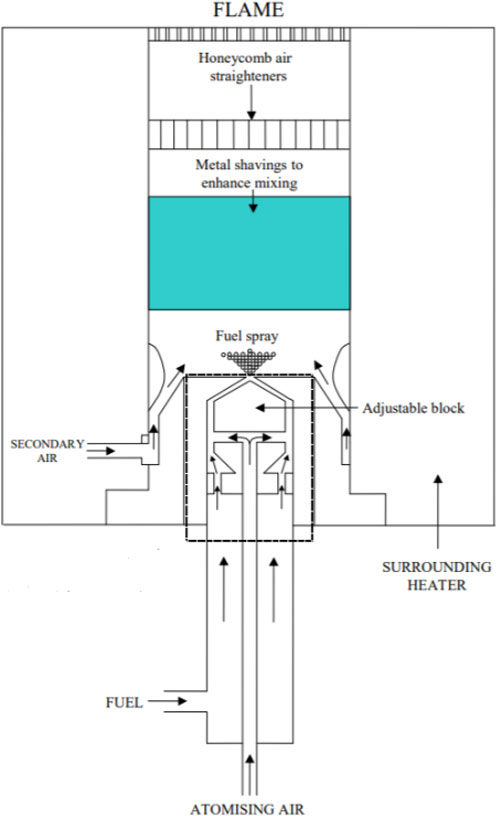
Figure 1. The detailed illustration of the customized flat-flame burner (Catalanotti, 2011).
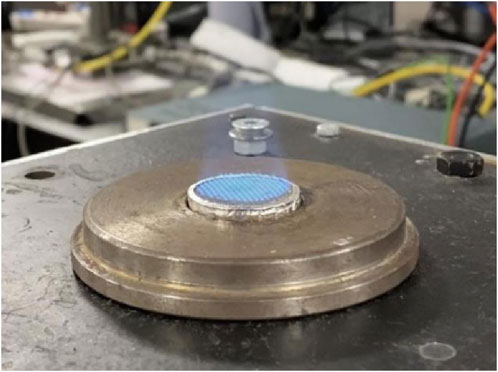
Initially, kerosene was filled in a sample cylinder and then transported by nitrogen (7 bar) and mixed with the primary pressured air (2 bar) inside the atomizer. The precise flow rates are controlled by two mass flow controllers (MFC), which are a Brooks Flomega model 5882 for liquid and a Brooks Instrument 4800 series for air. The liquid was then broken into droplets and formed a consistent spray, which was further converged with a secondary line of pressured air (2 bar). The mixture was subsequently passed through a metal shaving and a honeycomb straightener to enhance the mixing and help to produce a more uniform flow. Finally, the blend of fuel and air was left through a diffuser, where a stabilized and uniform flame was obtained slightly above its surface. An example of the flame is demonstrated in Figure 2. The diffuser plate was made of stainless steel with a diameter of 25.2 mm, adopting the mesh design of 1 mm diameter drilled holes (total number of 217) spread in a swirl pattern. In addition, an electric heater was employed to heat the burner by 180
Importantly, for the quantitative investigation, two reference fuels are also studied. For the OH study, pure methane is selected due to the availability of the verified GRI-Mech 3.0 mechanism (Smith et al., 2008) against a large range of experimental targets. For the NO study, the methane/ammonia blend is selected because the flame can produce significant amounts of NO even with little presence of ammonia, making the NO fluorescence signals easier to capture. In the current case, the mole ratio of the employed NH3/CH4 flame is 0.184. The process is simplified as no burner pre-heating and pre-atomization are required, and the gases (2 bar) directly passed through the atomizer and mixed with the secondary channel of pressured air. The MFCs utilized to monitor the flows of methane and ammonia are Brooks Instrument 4800 series and Chell CCD100, respectively. Both kerosene and the reference flames are measured at the equivalence ratio condition of 1.3 and 1.0, and the detailed flow rates are compiled in Table 1.
2.2 Thermocouple measurements
Temperature profiles were measured by the type R Pt/Pt-13%Rh thermocouple. Two types of wires are utilized, which are P13R-005 (kerosene and methane flames) and P13R-002 (methane/ammonia blends) with an initial diameter of 125
The raw temperature readings require additional corrections due to the radiation and conduction losses from the bead. For the radiation losses, Kaskan (1957) provided a method of correction:
where
The main uncertainties in this traditional method of radiation correction are the values of the coated wire emissivity and the bead diameter after coating. In the original work, Kaskan (1957) assumed a constant value of 0.22 ± 0.02 for
Importantly, the bead diameter will be further increased after the coating process. From previous investigations (Gerasimov et al., 2012; Auzani, 2020), the diameter of the coated bead is regarded to be 2.5 times greater than the bare wire and this rule is applied in this study (d005 = 313
2.3 Planar laser-induced fluorescence (PLIF)
Transitions start from the ground state to the first excited state, which are
Before the commencement of the measurements, the camera placement is carefully examined so that the lens center faces the surface of the burner horizontally at an angle of approximately 90°. The software DaVis was utilized to acquire and process the images, and three recordings were required for each flame condition: the selected signal, off-resonance signal to minimize the effects of the scattered laser emission or chemiluminescence, and laser sheet correction to nullify the intensity variation of the beam. For the correction method, a quartz cuvette filled with deionized water was hit by the beam to manifest the variation in the illumination. For each image, 200 frames in 20 s were repetitively recorded.
3 Methodology
3.1 Quantitative LIF images
The concept of OH measurements from (Hughes et al., 2007) is utilized to convert both the OH PLIF and NO PLIF intensity to the actual mole fraction of the species.
It is both extremely difficult and error-prone to calibrate the image of PLIF directly, as the fluorescence of the signal is dependent on several parameters, for instance, laser intensity, laser sheet volume in the observation region, quantum efficiency of the camera and intensifier system, etc. The problem can be relatively simplified when two LIF signals are captured with the use of the same detection equipment and the relationship can be described as:
where N represents the population of the probed energy level and Q represents the total quenching rate. The population can be calculated by the multiplication of the total OH mole fraction and the Boltzmann distribution (bf) of the targeted levels in the rotational state, which is rotational level 6 in the current case. The software (LIFBASE, 2021) was utilized to simulate the population distribution at the desired level. The total quenching rate can be calculated as:
where
where m represents the molecular weight, T is the temperature, and P is the pressure of the experimental environment. Regarding the quenching effects, Tamura et al. (1998) measured the quenching rates of three species at the A-states in the laminar methane flames, and the data was subsequently compared with the models of quenching coefficient and the compositions of the flame. The expression of the cross section is dependent on the types of the collider and for practical reasons, only the major species (N2, O2, CO2, CO, and H2O) are considered. The concentration of each species was firstly obtained from the Chemkin model. Based on the percentage of composition, the total quenching cross section were subsequently added up by the result of each collider.
Thus, by using Equation 4, the concentration of the liquid fuel can be described as:
Instead of correcting the whole PLIF graphs, a reference point is required for each parameter of all three flames, and the maximum point was chosen. At this position, the temperatures of both mixtures, the simulated mole fraction of the reference fuel, and the values of original PLIF signals are consequently assigned. Both the Boltzmann fraction and the quenching cross section can be obtained by their respective equations concerning the temperature and the molecular weight can be predicted from the simulations. In addition, the experiments of liquid and gas fuels are conducted in the same environment, therefore the pressure conditions are both 1 atm.
3.2 Model validation
The converted OH PLIF and NO PLIF results are validated against the simulation of the burner-stabilized flame model from ANSYS Chemkin Pro (2022). The detailed mechanism containing 537 species and 18,250 reactions from CRECK Modeling Group (2020a) was employed to simulate the kerosene/air flame. The proposed surrogate (42.67 mol% n-decane, 33.02 mol% iso-octane, and 24.31 mol% toluene) from Dooley et al. (2010) was utilized to represent the properties of real kerosene. For the reference fuels, GRI-Mech 3.0 (Smith et al., 2008) was utilized to simulate the pure methane flames, While for the selection of the kinetic mechanism of the methane/ammonia blend, discussions are provided in Section 4.2. In addition, the temperature input is the measured results from the thermocouples.
4 Result analysis
4.1 Temperature data
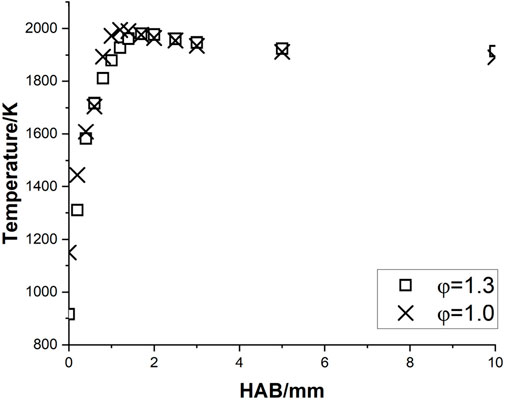
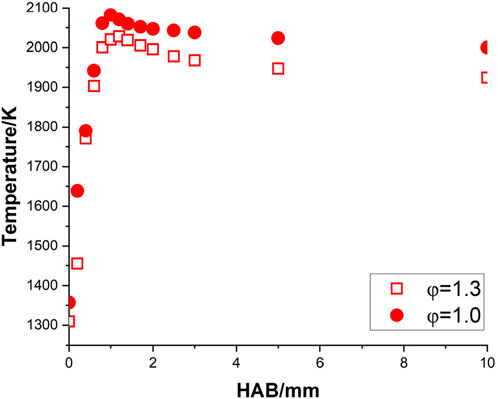
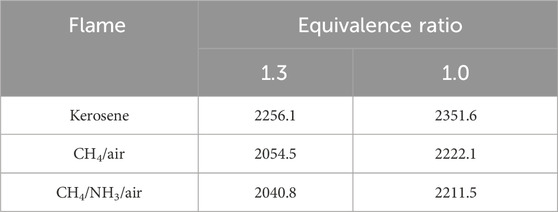
The corrected temperature profiles of pure methane, methane/ammonia blend, and kerosene flame were calculated based on Equation 1 and shown in Figures 3–5, respectively. The adiabatic temperature of each flame condition was initially estimated, to provide a general indication of the maximum temperature that can be achieved. The simulations were calculated by using the Chemkin model of the chemical and phase equilibrium calculations and the results are compiled in Table 2.
All six profiles show a similar trend, as the temperature keeps increasing until it reaches the maximum level around 1.0–1.7 mm above the burner surface, and then it decreases and stabilizes at a consistent level. This observation is in reasonable agreement with the temperature results of a flat-flame burner from (Doute et al., 1995). For each fuel, the maximum temperature achieved at the stoichiometric condition is higher than the value at the rich case, which is consistent with the observations of the equilibrium temperatures. Although all corrected peak temperatures appear to be at a relatively high level (
One concern is that the initial temperatures of all three mixtures at the stoichiometric condition, particularly for kerosene/air seem to be at a high level. Take the results of Doute et al. (1995) for instance, their corrected inlet temperature of kerosene/O2/N2 flame at
Further increasing the flow rate to completely push the flame out of the diffuser can be a solution, but it will also largely increase the risks of breaking the thermocouple straight away with the stronger flow, as the trial tests showed. Importantly, the shape of the OH and NO models discussed in the subsequent sections will be largely dependent on the qualities of these temperature inputs.
4.2 Reference flames
The PLIF results were calculated based on the description in Section 2.3 and discussions of the pure methane flames and methane/ammonia blend are provided separately. Two criteria are addressed to determine the quality of the PLIF results, that are the position where the peak is reached and the general profile shape. The percentage of the remaining product is an indication of the graph shape, calculated by the OH/NO level at the end (HAB = 10 mm) divided by the maximum OH/NO level.
For the methane flames, the comparison of OH profiles between the model and measurement is demonstrated in Figure 6. For both equivalence ratio conditions, excellent agreement has been achieved in the peak position, and the shape difference between the two approaches is about 2%–4%.
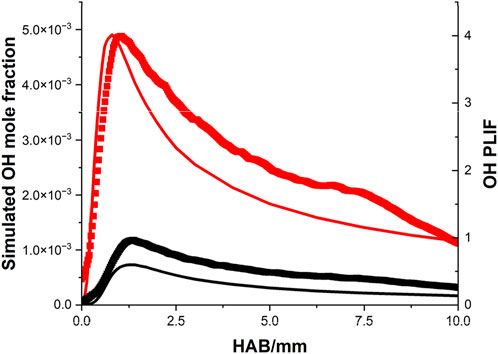
Figure 6. Comparison of the OH profiles between the simulation (line) and the OH PLIF signal (scatter) of the CH4/air flame, note: black indicates rich condition, red indicates stoichiometric condition.
Initially, several comprehensive mechanisms of small hydrocarbons and ammonia chemistry were employed to simulate the NO profiles (Konnov, 2009; Tian et al., 2009; Lamoureux et al., 2016; San Diego Mechanism, 2018; Okafor et al., 2018). For the San Diego mechanism, the complete kinetic model (version 2014–10–04) was combined with their nitrogen model (version 2018–07–23) to predict the CH4/NH3 blends. The comparisons between the simulations and NO PLIF signals are displayed in Figure 7 and the details are compiled in Table 3. Given the fluctuations displayed in the measurements, an average value of signals from 8 mm to 10 mm was calculated (red blocks in Figure 7) to represent the NO level at the distance of 10 mm.

Figure 7. Comparison of the NO profile between various simulations (line) and the PLIF signal (scatter) of the CH4/NH3/air flame: (A)
In general, the NO PLIF measurements at both equivalence ratio conditions demonstrate a similar trend as the amount of NO keeps increasing until it reaches the maximum, and then decreasing to a lower level. In practice, it is likely additional amounts of NOx were produced due to the open-air environment, therefore an uncertainty range of 3%–5% is estimated in the lower limit of the remaining product percentages in both NO PLIF results. For the rich condition, the detailed aspects of each kinetic model are quite different. Regarding the profile shapes, models from Konnov (2009), Okafor et al. (2018), and the San Diego mechanism all estimate an amount of 20% decrease from the maximum value, which is in decent agreement with the PLIF measurement. The results from Tian et al. (2009), Lamoureux et al. (2016) indicate the most and the least consumption of NO, respectively. Regarding the level of maximum NO produced, the peak NO value simulated by Konnov (2009) is greater than three of the sources Tian et al. (2009), San Diego Mechanism (2018), Okafor et al. (2018) by approximately a factor of 1.5–2. Furthermore, the simulated peak positions from Konnov (2009), Lamoureux et al. (2016) correspond well with the NO PLIF data, while the other three kinetic models quickly reach the maximum point at around 0.7–0.9 mm. For the stoichiometric condition, however, the shapes of the model have considerable discrepancies compared to the experimental result. All simulations show that after reaching the peak, the amount of NO stays constant instead of gradually decreasing to a lower level.
The selection of the ammonia mechanism is hence based on the rich condition. Both Konnov (2009) and the San Diego mechanism can simulate a reasonable NO profile. However, there is a significant difference in the general level of NO between Konnov (2009) and other sources, while the San Diego mechanism noticeably underpredicts the amounts of NO compared to other simulations (e.g., smaller than the data of Tian et al. (2009) by 40%). The rest of the three kinetic mechanisms are all based on the direct study of CH4/NH3 blends, and Tian et al. (2009), Okafor et al. (2018) are considered to provide a relatively decent representation of the methane/ammonia flames investigated in this study. The NO rate of production (ROP) of both mechanisms is subsequently examined as illustrated in Figures 8, 9.
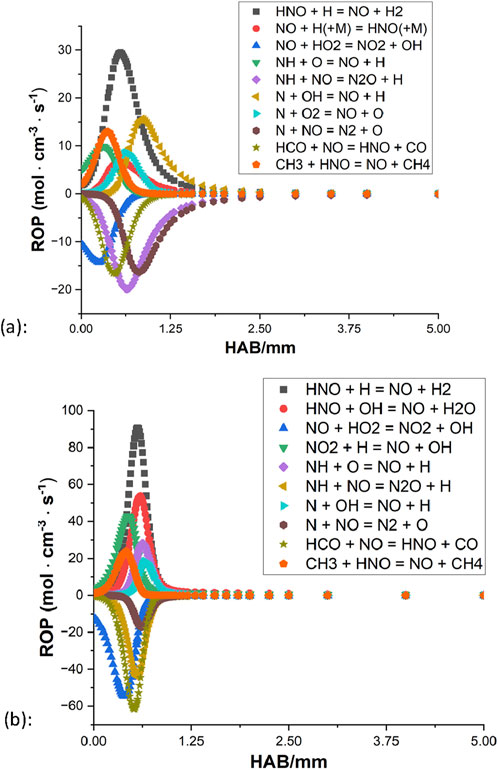
Figure 8. Rate of production of the NO from (Tian et al., 2009): (A) φ = 1.3; (B) φ = 1.0.
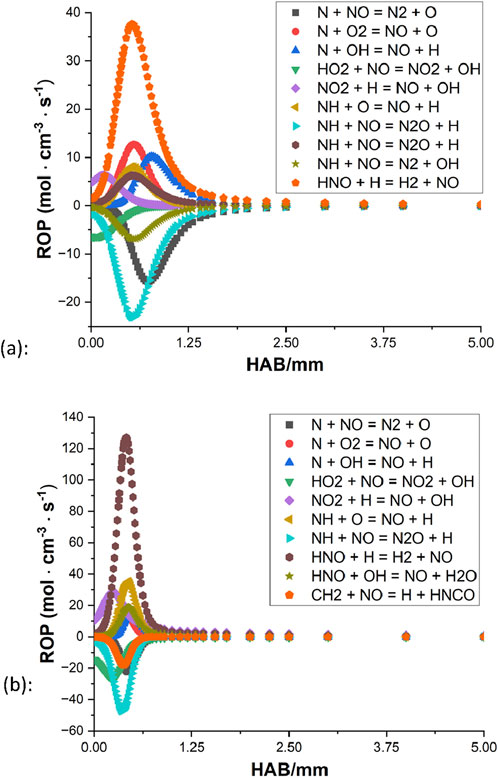
Figure 9. Rate of production of the NO from (Okafor et al., 2018): (A) φ = 1.3 (B) φ = 1.0.
For both mechanisms, the oxidation appears to be coming to an end around 2 mm above the burner surface for the rich condition, and for the stoichiometric case, the processes terminate even faster as little activity can be observed beyond the distance of 1 mm. In all four ROPs, HNO + H
Based on these highlighted reactions, efforts of mechanism modifications are attempted to reduce the production rate of NO and increase the NO consumption rate. Kovács et al. (2020) provided discussions of the rate constant of nine important N/H/O reactions based on experiments in the literature. At 800–1800 K, their optimized rate constant of reaction 1 is smaller than the values of Tian et al. (2009), Okafor et al. (2018) by approximately a factor of 4.7 and 9.5, respectively. From the mechanism of CRECK Modeling Group (2020b), their rate constant of reaction 2 is greater than the values of Tian et al. (2009), Okafor et al. (2018) by about a factor of 2, at the temperature range of 800 K–1800 K. By applying these updated rate parameters, results of both mechanisms show that the level of NO decreases to some extent while the general shape remains unchanged.
Several literature may share some insights into this phenomenon. In the numerical study of (Xiao et al., 2017), the free propagating model in Cantera (Cantera, 2016) was utilized to simulate the flame structures of four types of CH4/NH3 mixture, varying from 20% NH3 to 80% NH3 at 0.1 MPa and
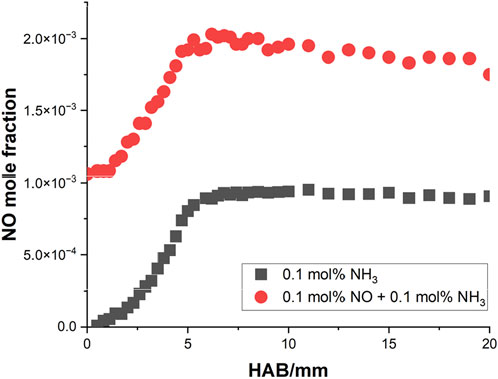
Figure 10. The measured NO profiles of two types of methane flame doped with NH3 and NO-NH3 by (Lamoureux et al., 2016).
4.3 Quantitative study of OH
The key parameters from Equation 5 are summarized in Table 4. The converted PLIF results were subsequently calculated and compared with the simulations, as displayed in Figure 11.

Figure 11. Comparison of the OH profile between the simulation (line) and the converted PLIF signal (scatter) of the kerosene/air flame: (A)
For both equivalence ratio conditions, the measured peak position corresponds excellently with the modelling. Regarding the general shape of the OH profiles, the PLIF measurement at the stoichiometric condition is in good agreement with the model while at the rich condition, the experimental result is about 11% greater than the simulation, which is not considerably large but also exceeds the error limitation. Several factors can contribute to this discrepancy. Firstly, the stability of the flame is crucial to the quality of the measurements, and the kerosene flame at the stoichiometric condition is observed to be more stable compared to the rich case. Secondly, this phenomenon may be due to the nature of the current flat-flame burner setting. In practice, the flame is exposed to the open air and the further away from the burner surface, the more air will enter the flame, which subsequently causes the mixture to be inclined to the fuel lean side and less OH is consumed than in the ideal situation. Accordingly, the effect of the extra air introduction is more severe to a less stable flame.
Concerning the absolute OH value at the maximum, the converted PLIF result at the rich and stoichiometric case is smaller than the simulation at the peak by about 21% and 10%, respectively. Furthermore, there is a noticeable quantity of OH already formed around the burner surface in the PLIF graph of the kerosene flame. This observation is consistent with the high inlet temperature discussed in Section 4.1 regarding the formed flame position.
Considerable uncertainties remain despite the correction method, as few quantitative PLIF studies of the kerosene flame under similar experimental conditions are available. The main concern of error is the accuracy of the temperature results on which the converted PLIF result is heavily dependent, and an arbitrary error of
4.4 Quantitative study of NO
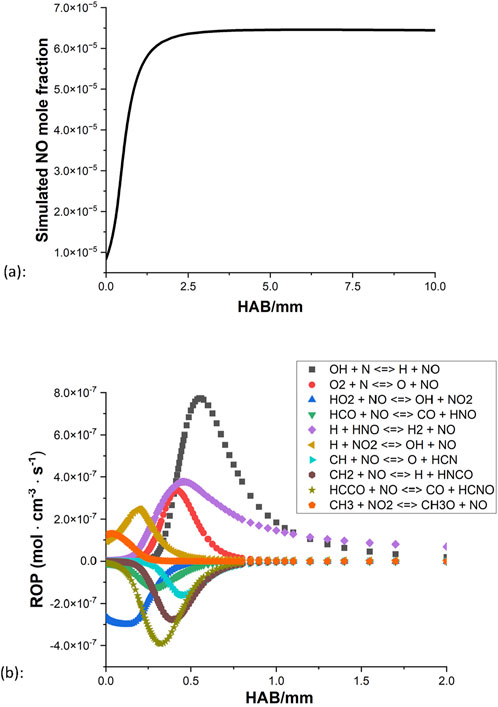
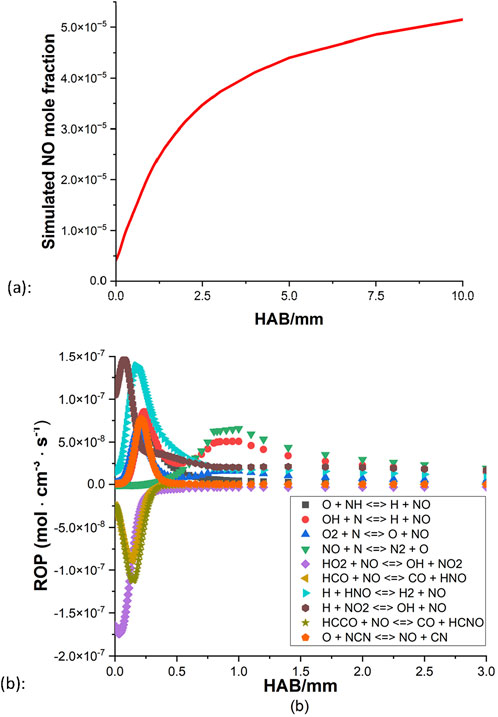
Apart from the uncertainty of the profile shape of the CH4/NH3 blend at the stoichiometric condition as discussed in Section 4.2, another innate problem of the NO quantification is that the amount of NO in the kerosene flame is considerably small compared to the OH. In the raw image of NO PLIF, the resolution value can barely pass 100 (limit = 4,096). This is consequently shown in the PLIF results, the collected NO signals have much more noise and are consequently difficult to determine the general shape. Thus firstly, the NO model of the kerosene flame is examined. Figures 12, 13 demonstrate the simulated NO mole fraction and NO ROP of the kerosene flames at rich and stoichiometric conditions, respectively.
For the rich condition, the amount of NO increases quickly and reaches a higher level at the region of 0–2 mm, then slowly increases further and eventually comes to a stable state around 3 mm above the burner surface. From the result of NO ROP (Figure 12B), little activity is observed beyond the distance of 2 mm as the NO approaches equilibrium, and it appears that the thermal NOx mechanism has a heavy influence on the general production of the NO, as OH + N
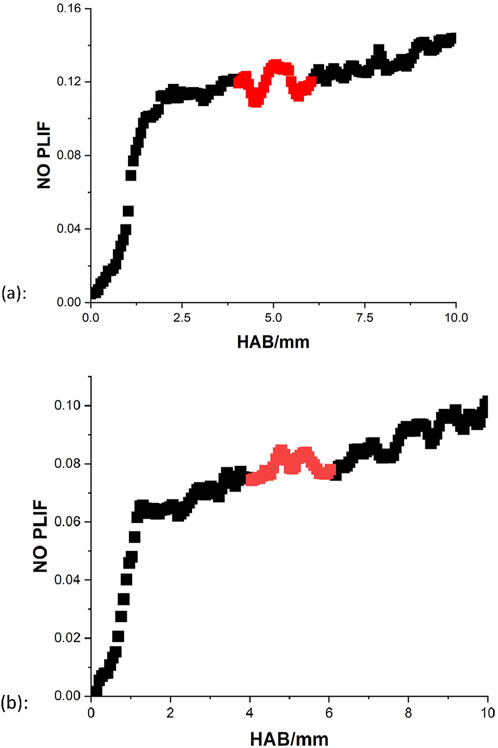
The results of NO PLIF at rich and stoichiometric conditions are displayed in Figure 14. Noticeably, an increase of NO in the region of 7–10 mm can be observed in the rich case, and this may be due to the extra involvement of thermal NOx. Unlike the model which assumes the perfect environment, additional air is likely to enter the flame during the measurements, and the further away from the burner surface, the influence of the open air is more significant. Since the flame temperature is sustained at a high enough level, more thermal NOx may be produced at the end of the combustion region. This effect appears to be more obvious for the stoichiometric condition, as the trend of NO growth continues till the end of the oxidation. In short, the collected NO PLIF can be regarded as a decent representative of the NO profiles for the kerosene flames.
Due to the incomplete combustion, theoretically for a certain hydrocarbon fuel, the fuel-rich condition tends to generate more emission of the NOx than the stoichiometric condition. However, in the current scale of knowledge, to what extent is the produced NO at the equivalence ratio of 1.3 higher than at the equivalence ratio of 1 is unknown. Thus, the level of NO at the rich and stoichiometric conditions are further compared. Given the effects of the additional thermal NOx in the measurements, the position of 5 mm is utilized as a reference point to calculate the magnitude difference of the NO between the rich and the stoichiometric condition. Due to the fluctuation in the measurements, the signal values between 4–6 mm are averaged to represent the relative NO at the reference distance of 5 mm, as the highlighted parts demonstrated in Figure 14. Results show that for the experimental data, the NO intensity at the rich condition is greater than the NO intensity at the stoichiometric conditions by a factor of 1.47, corresponding well with the suggested magnitude difference of 1.52 from the model.
For the quantification, key parameters from Equation 6 are summarized in Table 5. The converted PLIF result was subsequently calculated and compared with the simulation, as displayed in Figure 15. By using the reference position of 5 mm, the converted measurements are about 16.6% and 32.3% greater than the simulations at the rich and stoichiometric conditions, respectively. Despite the decent agreements between the two methods, as discussed in Section 4.2, a larger scale of errors regarding the value of LIFref is expected because of the disagreement between the model and the NO PLIF for the CH4/NH3 blend at the stoichiometric condition.

Figure 15. Comparison of the NO profile between the simulation (line) and the converted PLIF signal (scatter) of the kerosene/air flame: (A)
5 Conclusion
In this study, the combustion characteristics of several premixed laminar flames at atmospheric conditions were investigated with use of a flat-flame burner. The temperature and relative OH and NO concentration were measured for three types of flames, that are kerosene, pure methane, and methane/ammonia blends, at
In general, the temperature results of the targeted flames indicate reasonable profile shapes and maximum temperature values, although the initial temperatures of all three mixtures at the stoichiometric condition appear to be quite high, which may be due to the flames being formed a little beneath the diffuser. Additionally, due to the uncertainty of coated bead emissivity and coated wire diameter, a certain degree of errors is expected from the radiation correction.
Regarding the OH PLIF results, for the methane flame, the PLIF profile corresponds well to the model. For the kerosene flame, the experimental result is in good agreement with the simulation at the stoichiometric condition. However, the measured profile demonstrates a discrepancy of about 11% to the simulated shape in the rich case. It can be partly explained that the flame at the stoichiometric condition is more stable compared to the rich case, which directly affects the quality of measurements. Also, this is partially due to the general experimental setting as additional air is introduced into the original flame at the far end, making the mixture inclined on the fuel-lean side. Furthermore, the maximum corrected OH value is approximately 21% and 10% smaller than the peak predicted OH at the rich and stoichiometric conditions, separately.
Regarding the NO PLIF study, for the CH4/NH3 blends, decent agreement between the model and the experiment can be observed in the rich case while considerable uncertainty remains at the stoichiometric condition. Despite the efforts of mechanism modification based on the key reactions of the original ROPs, the profile shapes between the two methods possess a difference of around 20%. Systematic error in the current measurement setting may partly account for this discrepancy, and this subsequently leads to the concerns of error for the NO quantification at
In general, this investigation provides new insights into the database of temperature and OH and NO concentrations of a kerosene flame at atmospheric and two equivalence ratio conditions. From the quantitative efforts, it can be concluded that the accurate temperature representation of a given flame is crucial to the PLIF signal conversion and the understanding of the combustion process.
Data availability statement
The datasets presented in this study can be found in online repositories. The names of the repository/repositories and accession number(s) can be found in the article/supplementary material.
Author contributions
SS: Writing–original draft, Writing–review and editing. KH: Writing–review and editing. MP: Writing–review and editing.
Funding
The author(s) declare that no financial support was received for the research, authorship, and/or publication of this article.
Acknowledgments
The authors would like to express their gratitude to all the members of the Energy 2050 group at the University of Sheffield for their continuous support.
Conflict of interest
The authors declare that the research was conducted in the absence of any commercial or financial relationships that could be construed as a potential conflict of interest.
Publisher’s note
All claims expressed in this article are solely those of the authors and do not necessarily represent those of their affiliated organizations, or those of the publisher, the editors and the reviewers. Any product that may be evaluated in this article, or claim that may be made by its manufacturer, is not guaranteed or endorsed by the publisher.
References
ANSYS Chemkin Pro (2022). ANSYS Chemkin Pro. Available at: https://www.ansys.com/products/fluids/ansys-chemkin-pro (Accessed March 8, 2023).
Auzani, A. S. (2020). Experimental and kinetic modelling study of jet A-1/ethanol blend combustion and oxidation stability. University of Sheffield. Doctoral dissertation.
Bradley, D., and Entwistle, A. G. (1966). The total hemispherical emittance of coated wires. Br. J. Appl. Phys. 17 (9), 1155–1164. doi:10.1088/0508-3443/17/9/307
Bradley, D., and Matthews, K. J. (1968). Measurement of high gas temperatures with fine wire thermocouples. J. Mech. Eng. Sci. 10 (4), 299–305. doi:10.1243/jmes_jour_1968_010_048_02
Cantera (2016). Chemical kinetics software. Available at: https://cantera.org/(Accessed March 10, 2023).
Catalanotti, E. (2011). Theoretical and experimental investigation of alternative aviation fuels. University of Leeds. Doctoral dissertation.
CRECK Modeling Group (2020a). C1-C16 HT+LT+NOx mechanism (version 2003, march 2020). Available at: https://creckmodeling.chem.polimi.it/menu-kinetics/menu-kinetics-detailed-mechanisms/107-category-kinetic-mechanisms/406-mechanisms-1911-tot-ht-lt-nox/(Accessed March, 2020).
CRECK Modeling Group (2020b). C1-C3 NOx mechanism (version 2003, march 2020). Available at: https://creckmodeling.chem.polimi.it/menu-kinetics/menu-kinetics-detailed-mechanisms/107-category-kinetic-mechanisms/400-mechanisms-1911-c1-c3-ht-nox/(Accessed March, 2020).
Dagaut, P., and Cathonnet, M. (2006). The ignition, oxidation, and combustion of kerosene: a review of experimental and kinetic modeling. Prog. Energy Combust. Sci. 32 (1), 48–92. doi:10.1016/j.pecs.2005.10.003
Dooley, S., Won, S. H., Chaos, M., Heyne, J., Ju, Y., Dryer, F. L., et al. (2010). A jet fuel surrogate formulated by real fuel properties. Combust. Flame 157 (12), 2333–2339. doi:10.1016/j.combustflame.2010.07.001
Doute, C., Delfau, J.-L., Akrich, R., and Vovelle, C. (1995). Chemical structure of atmospheric pressure premixed n-decane and kerosene flames. Combust. Sci. Technol. 106 (4–6), 327–344. doi:10.1080/00102209508907785
Erdemir, D., and Dincer, I. (2021). A perspective on the use of ammonia as a clean fuel: challenges and solutions. Int. J. Energy Res. 45 (4), 4827–4834. doi:10.1002/er.6232
Gerasimov, I. E., Knyazkov, D. A., Yakimov, S. A., Bolshova, T. A., Shmakov, A. G., and Korobeinichev, O. P. (2012). Structure of atmospheric-pressure fuel-rich premixed ethylene flame with and without ethanol. Combust. Flame 159 (5), 1840–1850. doi:10.1016/j.combustflame.2011.12.022
Hayakawa, A., Goto, T., Mimoto, R., Arakawa, Y., Kudo, T., and Kobayashi, H. (2015). Laminar burning velocity and Markstein length of ammonia/air premixed flames at various pressures. Fuel 159, 98–106. doi:10.1016/j.fuel.2015.06.070
Honnet, S., Seshadri, K., Niemann, U., and Peters, N. (2009). A surrogate fuel for kerosene. Proc. Combust. Inst. 32 (1), 485–492. doi:10.1016/j.proci.2008.06.218
Hughes, K. J., Pourkashanian, M., and Wilson, C. W. (2007). OH concentration measurements in a jet engine exhaust. Inter. J. Ener. Clean. Env. 8 (4), 305–320. doi:10.1615/InterJEnerCleanEnv.v8.i4.20
Kaskan, W. E. (1957). The dependence of flame temperature on mass burning velocity. Symposium Int. Combust. 6 (1), 134–143. doi:10.1016/s0082-0784(57)80021-6
Kathrotia, T., Oßwald, P., Naumann, C., Richter, S., and Köhler, M. (2021). Combustion kinetics of alternative jet fuels, Part-II: reaction model for fuel surrogate. Fuel 302, 120736. doi:10.1016/j.fuel.2021.120736
Konnov, A. A. (2009). Implementation of the NCN pathway of prompt-NO formation in the detailed reaction mechanism. Combust. Flame 156 (11), 2093–2105. doi:10.1016/j.combustflame.2009.03.016
Konnov, A. A., Dyakov, I. V., and De Ruyck, J. (2006). Probe sampling measurements of NO in CH4+ O2+ N2 flames doped with NH3. Combust. Sci. Technol. 178 (6), 1143–1164. doi:10.1080/00102200500296788
Kovács, M., Papp, M., Zsély, I. G., and Turányi, T. (2020). Determination of rate parameters of key N/H/O elementary reactions based on H2/O2/NOx combustion experiments. Fuel 264, 116720. doi:10.1016/j.fuel.2019.116720
Lamoureux, N., Marschallek-Watroba, K., Desgroux, P., Pauwels, J.-F., Sylla, M. D., and Gasnot, L. (2017). Measurements and modelling of nitrogen species in CH4/O2/N2 flames doped with NO, NH3, or NH3+ NO. Combust. Flame 176, 48–59. doi:10.1016/j.combustflame.2016.10.019
Lamoureux, N., Merhubi, H. E., Pillier, L., De Persis, S., and Desgroux, P. (2016). Modeling of NO formation in low pressure premixed flames. Combust. Flame 163, 557–575. doi:10.1016/j.combustflame.2015.11.007
LIFBASE (2021). LIFBASE version 2.1.1. Available at: https://www.sri.com/platform/lifbase-spectroscopy-tool/(Accessed March 17, 2023).
Mathieu, O., and Petersen, E. L. (2015). Experimental and modeling study on the high-temperature oxidation of Ammonia and related NOx chemistry. Combust. flame 162 (3), 554–570. doi:10.1016/j.combustflame.2014.08.022
Okafor, E. C., Naito, Y., Colson, S., Ichikawa, A., Kudo, T., Hayakawa, A., et al. (2018). Experimental and numerical study of the laminar burning velocity of CH4–NH3–air premixed flames. Combust. Flame 187, 185–198. doi:10.1016/j.combustflame.2017.09.002
Patterson, P. M., Kyne, A. G., Pourkashanian, M., Williams, A., and Wilson, C. W. (2001). Combustion of kerosene in counterflow diffusion flames. J. Propuls. Power 17 (2), 453–460. doi:10.2514/2.5764
Pourkashanian, M., Wilson, C. W., and Hughes, K. J. (2007). OH concentration measurements in a jet engine exhaust. Clean Air Int. J. Energy a Clean Environ. 8 (4), 305–320. doi:10.1615/InterJEnerCleanEnv.v8.i4.20
San Diego Mechanism (2018). San Diego mechanism. Available at: https://web.eng.ucsd.edu/mae/groups/combustion/mechanism.html.
Shu, B., He, X., Ramos, C. F., Fernandes, R. X., and Costa, M. (2021). Experimental and modeling study on the auto-ignition properties of ammonia/methane mixtures at elevated pressures. Proc. Combust. Inst. 38 (1), 261–268. doi:10.1016/j.proci.2020.06.291
Smith, G. P., and Crosley, D. R. (1986). Quenching of OH (A 2Σ+, v’= 0) by H2, N2O, and hydrocarbons at elevated temperatures. J. Chem. Phys. 85 (7), 3896–3901. doi:10.1063/1.450910
Smith, G. P., Golden, D. M., Frenklach, M., Moriarty, N. W., Eiteneer, B., Goldenberg, M., et al. (2008). GRI-Mech 3.0. Available at: http://combustion.berkeley.edu/gri-mech/(Accessed March 8, 2023).
Tamura, M., Berg, P. A., Harrington, J. E., Luque, J., Jeffries, J. B., Smith, G. P., et al. (1998). Collisional quenching of CH(A), OH(A), and NO(A) in low pressure hydrocarbon flames. Combust. Flame 114 (3–4), 502–514. doi:10.1016/S0010-2180(97)00324-6
Tian, Z., Li, Y., Zhang, L., Glarborg, P., and Qi, F. (2009). An experimental and kinetic modeling study of premixed NH3/CH4/O2/Ar flames at low pressure. Combust. Flame 156 (7), 1413–1426. doi:10.1016/j.combustflame.2009.03.005
von Langenthal, T., Sentko, M. M., Schulz, S., Stelzner, B., Trimis, D., and Zarzalis, N. (2021). Experimental characterization of flame structure and soot volume fraction of premixed kerosene jet a-1 and surrogate flames. Appl. Sci. 11 (11), 4796. doi:10.3390/app11114796
Xiao, H., Valera-Medina, A., and Bowen, P. J. (2017). Study on premixed combustion characteristics of co-firing ammonia/methane fuels. Energy 140, 125–135. doi:10.1016/j.energy.2017.08.077
Nomenclature
Bf Boltzmann distribution
HAB Height above burner
ICCD Intensified charged couple device
JSR Jet-stirred reactor
PLIF Planar laser-induced fluorescence
ROP Rate of production.
Keywords: combustion, premixed flames, kerosene, ammonia/methane/air, nitric oxide, PLIF
Citation: Shi S, Hughes KJ and Pourkashanian M (2024) A quantitative study of OH and NO concentration of a premixed laminar kerosene flame using a flat-flame burner at atmospheric pressure. Front. Fuels. 2:1401691. doi: 10.3389/ffuel.2024.1401691
Received: 15 March 2024; Accepted: 06 November 2024;
Published: 18 November 2024.
Edited by:
Oliver Kröcher, Paul Scherrer Institut (PSI), SwitzerlandReviewed by:
Kumaran Kannaiyan, Guangdong Technion-Israel Institute of Technology (GTIIT), ChinaAleksandar Ašonja, Business Academy University (Novi Sad), Serbia
Saravanan Balusamy, Indian Institute of Technology Hyderabad, India
Copyright © 2024 Shi, Hughes and Pourkashanian. This is an open-access article distributed under the terms of the Creative Commons Attribution License (CC BY). The use, distribution or reproduction in other forums is permitted, provided the original author(s) and the copyright owner(s) are credited and that the original publication in this journal is cited, in accordance with accepted academic practice. No use, distribution or reproduction is permitted which does not comply with these terms.
*Correspondence: Kevin J. Hughes, ay5qLmh1Z2hlc0BzaGVmZmllbGQuYWMudWs=
 Si Shi
 Kevin J. Hughes
 Mohamed Pourkashanian