 Abdallah Abu Saleh
 Kevin J. Hughes1
 Ruoyang Yuan
- 1Department of Mechanical Engineering, University of Sheffield, Sheffield, United Kingdom
- 2Wolfson School, Loughborough University, Loughborough, United Kingdom
The effects of dimethyl ether (DME) addition to methane and ethylene fuels on the combustion characteristics of heat release, soot emissions, and flame temperature were investigated experimentally and numerically in a non-premixed laminar flame configuration. The flame-heat release soot-volume fraction was measured experimentally using CH*, OH*, and C2* chemiluminescence and planar two-color soot pyrometry, respectively. The CH*, OH*, and C2* were used to locate flame-heat release regions as well as to investigate the soot signal’s effect on their measurements. The ratios of the chemiluminescence pairs (OH*/CH* and OH*/C2*) were studied for the feasibility of map local equivalence ratios. Numerical calculations across a full range of DME mixing ratios were performed through 1D laminar flame simulations implemented with a detailed mechanism to provide an indication of the flame structures and profiles of key species including OH*, OH, CH*, CH, CH3, C3H3, C2H2, heat release rate (HRR), and flame temperature. An existing developed soot model was used in a 2D computational study to investigate its validity for modeling soot for DME (oxygenated fuel)/C2H4/N2 flames. Parametric studies have been carried out on some key parameters in the soot model to find optimum values that can be used in future studies. Although soot radiation intensities increased at a small amount (25%vol) of DME addition in the DME/methane flames, the soot pyrometry results showed a reduced soot volume fraction with an increased DME mixture ratio in both DME/methane and DME/ethylene flames studied, agreeing with the key conclusion of 1D numerical results. The flame HRR decreases with the increasing addition of DME to methane and ethylene flames and correlates with the trend of OH* and CH* profiles. The 1D simulation showed a non-monotonic correlation between OH*/CH* ratios and equivalence ratios, implying a limited use of OH*/CH* for the equivalence ratio measurement in non-premixed flames with DME additions.
1 Introduction
The burning of fossil fuels dominates various domains of the energy sector, including transport and power generation, which is causing an increase in the release of harmful emissions such as carbon monoxide (CO), unburned hydrocarbon (HC), nitrogen oxides (NOx), carbon dioxide (CO2), and particulate matter (PM) (Liaquat et al., 2010). In 2016, the World Health Organization revealed that approximately 4.2 million deaths around the world are attributed to air pollution due to such emissions (World Health Organization, 2022). Soot released from the transportation and electricity generation sectors has been found to significantly affect public health, including lung cancer and asthma (Pope and Dockery, 2006). The utilization of cleaner fuels such as biofuels or low carbon fuels as alternatives to fossil fuels is one solution which offers similar energy content with fewer soot emissions. It has been suggested that mixing dimethyl ether (DME) or inert gas with hydrocarbon biofuel will reduce such emissions—particularly soot (Yoon et al., 2008; Liu et al., 2011; Sirignano et al., 2014).
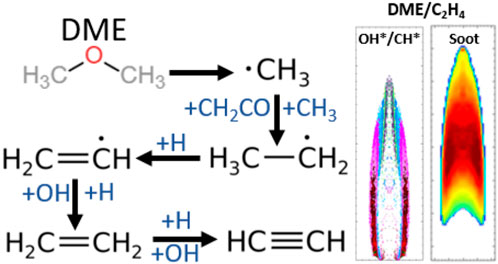
DME is considered a promising alternative clean fuel; it can be obtained from a range of sources including biomass (Sikarwar et al., 2017) and natural gas, and it can be used in multiple applications, such as compression ignition engines and gas turbines. Unlike other biofuels, DME possesses no carbon–carbon bond and has a very low boiling point and a high cetane number. DME’s energy density is approximately 45% lower than diesel fuel. It is also an oxygenated compound with a short ignition delay feature and can thus be used as an ignition enhancer. Nevertheless, a significant quantity of methyl groups (CH3) can be generated from DME decomposition (e.g., CH3OCH3→CH3+CH3O (Fischer et al., 2000; Liu et al., 2011)); this has been linked to increased formation of soot due to the suggested reaction pathway of DME → CH3 (H) → C2H2 (C3H3) → C6H6 → soot (Li et al., 2018).
Chemiluminescence imaging as a combustion diagnostic has been widely used in premixed flames as a marker for the flame heat release rate (HRR) and equivalence ratio (Lee and Santavicca, 2003; Hardalupas and Orain, 2004; Panoutsos et al., 2009; Sardeshmukh et al., 2017; Baumgardner and Harvey, 2020) and as an identification of the reaction zone (Panoutsos et al., 2009). HRR is an important aspect of hydrocarbon fuel combustion and is a factor that should be considered in the practical application of alternative fuels. The natural existence of chemiluminescence in flames can be attributed to excited radicals such as OH*, CH*, and C2* formed through different chemical reactions during combustion. Hardalupas and Orain (2004) demonstrated that OH* and CH* chemiluminescence emission intensities are good markers for HRR in premixed counterflow flames, and that the intensity ratio of OH*/CH* with 5% uncertainty can be used to measure the equivalence ratio at lean and stoichiometric conditions. Baumgardner and Harvey (2020) also observed that the ratio of OH*/CH* is well correlated with the equivalence ratio for lean conditions, whereas the ratio of C2*/CH* correlates better with rich conditions. Furthermore, Panoutsos et al. (2009) showed that OH* and CH* can be utilized as HRR indicators in both premixed and non-premixed counterflow methane flames. The validity of using CH* or C2* chemiluminescence in non-premixed flames as an indicator of HRR and the equivalence ratio remains questionable due to likely interference from soot emissions. This paper will investigate the feasibility of using OH*, CH*, or C2* chemiluminescence as a HRR and equivalence ratio marker in non-premixed flames, focusing on adding DME and using both experimental and numerical approaches.
Several investigations have utilized laminar diffusion flames to study the characteristics of soot formation (Hwang et al., 1998; McEnally and Pfefferle, 2007; Yoon et al., 2008; Bennett et al., 2009; Choi et al., 2011; Liu et al., 2011; Charest et al., 2014; Sirignano et al., 2014; Choi et al., 2015; Li et al., 2018). Most of these studies found a considerable impact of fuel structure on PAH and soot formation. Although several researchers have added DME to the combustion of different hydrocarbon biofuels in non-premixed flames and studied the impact on soot and PAH (McEnally and Pfefferle, 2007; Yoon et al., 2008; Bennett et al., 2009; Choi et al., 2011; Liu et al., 2011; Sirignano et al., 2014; Choi et al., 2015; Li et al., 2018; Ahmed et al., 2021; Serwin and Karataş, 2021; Abu Saleh et al., 2022), different conclusions were reached about the relationship between DME addition and soot emissions. Details of these previous studies are presented in Table 1. The majority (McEnally and Pfefferle, 2007; Yoon et al., 2008; Bennett et al., 2009; Liu et al., 2011; Ahmed et al., 2021) studied DME/ethylene mixtures and found that a small (5–40%vol) addition of DME to ethylene fuel resulted in increased soot formation. This contradicts the finding of reduced soot emission benefits from DME/diesel blend conducted in a direct injection engine (Ying et al., 2006) and the finding in DME/alkane blends, where DME blending with methane, ethane, and propane showed decreased soot and PAH formation across all DME mixture ratios (Yoon et al., 2008). Hence, further study is required to clarify the soot emission benefits from DME addition to hydrocarbon fuels with an extended range of fuel compositions and burner configurations. Most previous studies have focused on the DME/ethylene flames and the effect on soot formation. However, there is still a paucity of knowledge regarding flame structure and flame heat release quantification for non-premixed DME/hydrocarbon blend flames.
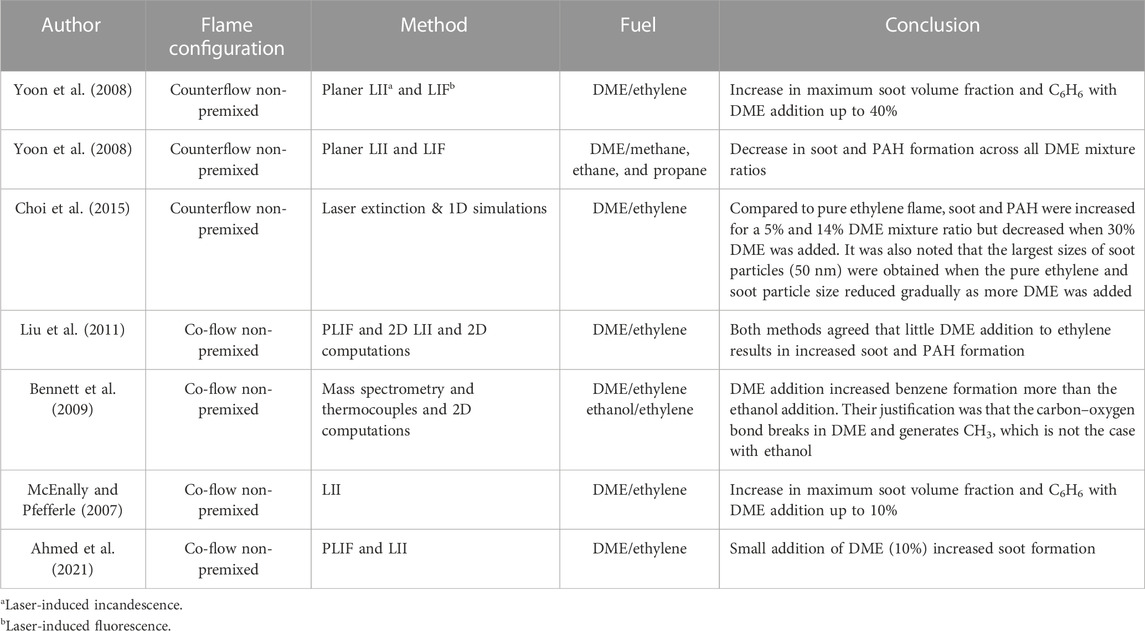
TABLE 1. Previous studies on non-premixed flames.
Detailed DME chemical kinetic mechanisms have been developed and validated by several researchers. Burke et al. (2015) developed and validated a detailed DME chemical kinetic mechanism (Mech_56.54) using their data for ignition delay time and from previous literature, including flow reactor, shock tube, flame speed, and flame speciation. The Mech_56.54 model utilizes the C1–C2 hydrocarbon and oxygenated fuels sub-mechanism of Metcalfe et al. (2013) and the H2/CO sub-mechanism of Kéromnès et al. (2013). In this study, 1D simulation will be implemented with the Mech_56.54 model to study and evaluate soot precursor formation, CH*, OH*, and HRR performances as an indication of flame soot precursors and chemiluminescence behaviors.
The combination of experimental and simulation studies plays an important role in reducing the time and cost of fuel development processes by categorizing those aspects that require additional comprehensive investigation (Hasse, 2016). In last few years, multiple studies have used 2D computational fluid dynamics (CFD) modeling to reveal the essential mechanisms of different alternative fuels in laminar diffusion flames. DME fuel mixtures have been studied computationally by Bennett et al. (2009) and Liu et al. (2011). Ongoing work has been done on creating soot models that can be used for various flame types, along with multiple fuels including hydrocarbons and oxygenated fuels. However, soot modeling of DME/hydrocarbon fuel mixtures through CFD has not been sufficiently investigated. The current study used the Brookes and Moss CFD soot model.
The novelty of this work is its investigation of the validity of using chemiluminescence and their pairs as markers for flame heat release zone and equivalence ratio measurements in DME diffusion flames. This offers a new understanding of the correlation between the chemiluminescence and equivalence ratios in the non-premixed DME/CH4 and DME/C2H4 flames. In addition, this study offers a new understanding of the characteristics of soot emission through its precursors—flame chemiluminescence and HRR of non-premixed DME/C1–C2 hydrocarbon flames. Moreover, it investigates the impact and typical values of key parameters in the Brookes and Moss model on soot emission outcomes, which can then be used with the inclusion of complete soot precursor to accurately model the soot in DME flames.
A co-flow configuration was used for this experimental study for easy comparison with the existing literature on ethylene flames and due to its wide practical applications and potential extension from laminar to turbulent reacting flow. Measurements of CH*, OH*, and C2* chemiluminescence and soot emissions were experimentally obtained with various DME mixing ratios. The flame structures and species profiles including OH*, OH, CH*, CH, HRR, CH3, C3H3, C2H2, and flame temperature were calculated numerically through 1D simulations implemented with a detailed chemical kinetic mechanism (Mech_56.54). The key characteristics of OH* and CH* from the simulation were referenced to experimental observations, and soot precursor predictions were obtained and discussed along with the soot concentration results obtained from two-color pyrometry. Additionally, the impact of adding N2 as a diluent into DME mixtures with hydrocarbon biofuels was studied experimentally and numerically. This work is important because it provides a dataset for numerical validations and a foundation for the further application of DME in heptane and in turbulent flames.
2 Experimental configuration and computational specifications
2.1 1D counterflow simulation in the mixture fraction zone
In this study, 1D simulations implemented with the Mech_56.54 mechanism (Burke et al., 2015) were conducted using the counterflow Cosilab package (Cosilab, 2010). The mechanism comprises 113 species and 710 reactions. Since it does not include reactions for benzene and higher PAH species, the profiles of C2H2 and C3H3 were chosen to indicate the characteristics of soot formation. The output profiles of C2H2 and C3H3 for C2H4 fuel were compared against the results of Yoon et al. (2008) for validation.
Most researchers agree that soot particles are formed through polycyclic aromatic hydrocarbons (PAH). Frenklach (2002) suggested that the main soot formation pathway is the combination of the surface reaction of particles (formation, growth, and oxidation) and PAH. The formation of the initial aromatic ring—in other words, benzene (C6H6)—is the primary stage in this process. Multiple researchers (Wu and Kern, 1987; Miller and Melius, 1992; Bennett et al., 2009) have proposed that C2H2 and C3H3 are the main species leading to the formation of benzene. Therefore, it is important to study the behavior of CH3, C2H2, and C3H3 produced from DME combustion in order to predict C6H6 and soot formation.
The non-premixed flames were modeled in a counterflow configuration. The species mole fraction profile results are expressed in terms of mixture fraction (ξ) space, where ξ represents the fuel stream mass fraction of the mixture, which is defined by Bilger (2011) as
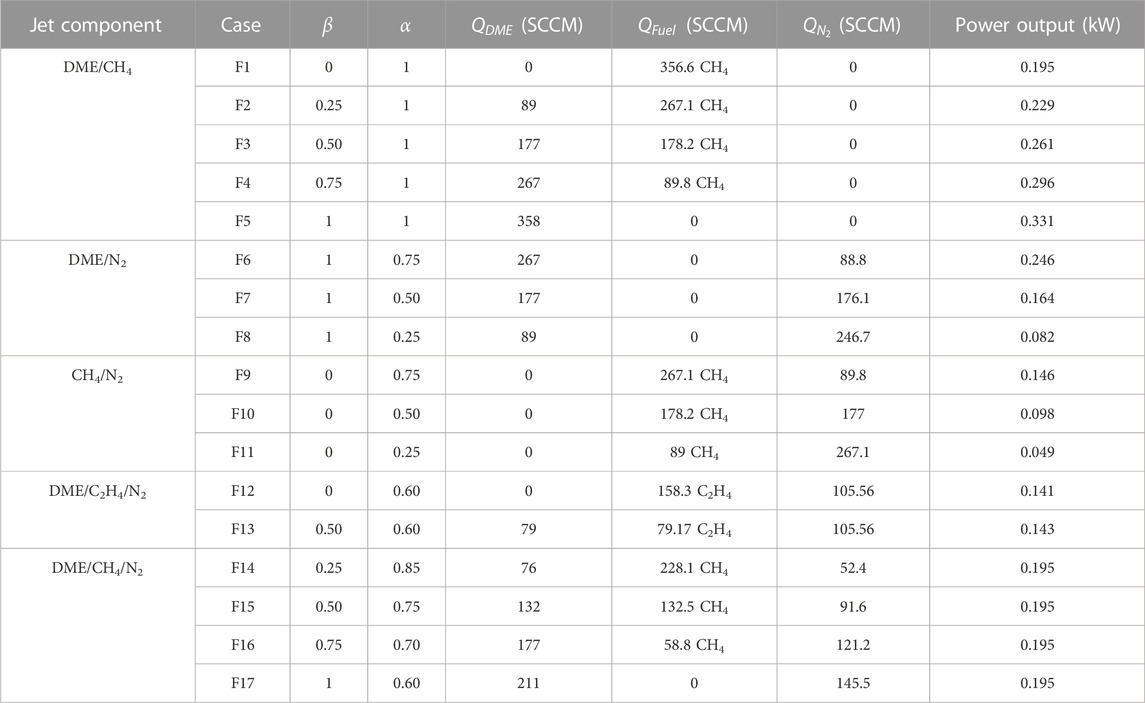
TABLE 2. Experimental conditions of flames investigated.
2.2 Burner configuration and flow conditions
The experimental apparatus in this work comprised a co-flow burner with a fuel blending and flow control system housed in an enclosed, interlocked work bench to allow the application of optical diagnostics. The co-flow burner used in this work had a similar structure to the Yale co-flow burner (Gau et al., 2017), with a 4 mm inner diameter (ID) fuel tube centered within a 74 mm ID honeycomb-filled air tube generating an axisymmetric laminar diffusion flame. The flow rates of air and fuels were controlled through separate calibrated mass flow controllers (Alicat MFCs). The air was supplied to the burner from an air compressor and inline air filter. The air flow rate was kept constant at 72 ± 0.2 SLPM (corresponding to an annular air exit velocity of 0.35 m/s) for all tests. The fuels used in this experiment were supplied from individual, single-fuel cylinders and blended within the flow control system. The DME was in a liquid state inside its cylinder, so a Neslab RTE-110 circulator was used to heat the DME to 25
2.3 Experimental setup and data processing
Experimentally, the HRR and soot volume fraction were measured and approximated using CH*, OH*, and C2* chemiluminescence imaging and planar two-color soot pyrometry, respectively. The schema of the optics setup is shown in Figure 1. The central wavelength of the narrow bandpass filters used for OH*, CH*, and C2* chemiluminescence measurements are 310 nm, 431.5 nm, and 516.5 nm, respectively, with a full width-half maximum (FWHM) of 10 nm. An intensified CCD camera (Andor iStar CCD 334) coupled with a UV lens was used as the detector. The resolution of the chemiluminescence measurements was 11.7 pixel/mm, and between 100 and 200 images were taken to obtain an ensemble mean image. The inverse Abel transform (IAT) was applied on the mean chemiluminescence images to obtain 2D chemiluminescence results. The same intensifier gain setting was applied for all cases; however, different exposure durations (10–200 ms) were used due to the signal strength.
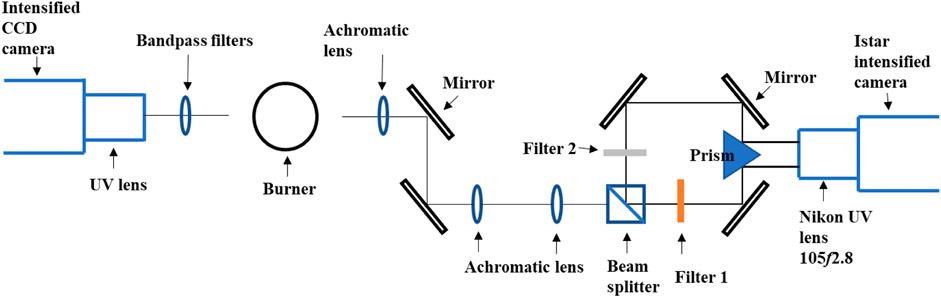
FIGURE 1. Measurement schematic of the two-color pyrometry (Abu Saleh et al., 2022) (right side of burner) and chemiluminescence (left side of burner) techniques. Filter 1: 550 nm; Filter 2: 650 nm.
Two-color soot pyrometry was implemented to measure the soot concentration and temperature (assuming thermal equilibrium where soot temperature approximates the temperature of surrounding combustion gases). Soot emissions were filtered through two narrow bandpass filters centered at 550 nm and 650 nm with a FWHM of 10 nm before being projected onto the ICCD camera (Figure 1). The optical layout allows simultaneous acquisition of the two images, thus reducing measurement uncertainties. The transmission coefficients of the detection system at the two wavelengths were measured via a series of calibration measurements with a standard spectral irradiance lamp (Newport QTH light source and constant power supply unit). The resolution of the two-color measurements was 9.0 pixel/mm. Soot volume fractions and soot temperatures were quantified from the ratio and transmission coefficients of the two filtered radiation images after processing with the IAT. The current image processing aimed to correct the line-of-sight nature of the two-color pyrometry measurements but suffered the drawback of an artifact in the centerline due to the IAT algorithm. Nevertheless, the measurements could provide an indication of the soot occurrence and provide relative information on the soot concentration and temperatures among the cases of interest.
2.4 Computational fluid dynamics methodology
The computational fluid dynamics (CFD) soot modeling investigation was conducted on DME/C2H4/N2 laminar co-flow flame mixtures. Boundary conditions similar to those used in the experimental study were applied in this computational study. A steady-state assumption can be implemented in this problem because no time dependency is involved. This laminar co-flow diffusion flame numerical problem can be solved using the governing equations in 2D cylindrical axisymmetric (
Axial momentum conservation:
Radial momentum conservation:
where
where
where
The geometry of the system used here had a similar concept to the Yale co-flow burner (Gau et al., 2017). The simulation was implemented in a 2D axisymmetric space; a schematic of the co-flow diffusion flame geometry along with the setup of the walls is shown in Figure 2. The centerline of the geometry is a symmetry axis, and hence only half of the geometry was built. The port where fuel was inserted (next to the axes of symmetry) was set as a fuel inlet with a velocity of 0.35 m/s (normal to the boundary) and at ambient temperature. The remaining space next to the fuel inlet was set as an air co-flow inlet with a velocity and temperature similar to the fuel inlet. The wall was set to be stationary, with no slip shear condition and flux. The exit of the geometry was set as a pressure outlet condition.
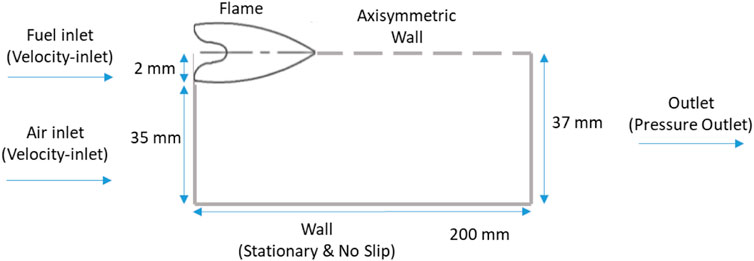
FIGURE 2. Schematic of co-flow diffusion flame geometry along with boundary conditions setup of walls.
The Moss–Brookes model created and validated for CH4 flames was used for soot modeling in this study. This model solves transport equations, including the soot mass fraction
where
where
where
In this study, the formation of soot was solved and described through the two transport equations shown above. C2H2 and C2H4 were only considered as the soot precursors for investigating soot formation. As the default parameters of the Moss–Brookes soot model were originally identified to predict soot production in CH4 combustion (Brookes and Moss, 1999; Wen et al., 2003), they required adjustment to enhance the soot predictions of current fuels and to replicate the current experimental findings (Pang et al., 2012; Jia Chiet Choo et al., 2022). The activation energy (
where
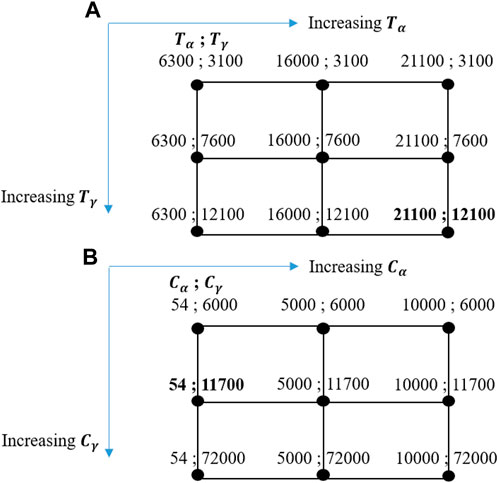
FIGURE 3. Test matrix for (A) calibrating the activation temperatures (Pang et al., 2012); (B) calibrating the rates of soot inception and surface growth (Jia Chiet Choo et al., 2022).
Another two important default parameters in the Moss–Brookes soot model that need calibration because of their crucial roles in soot generation are the rates of soot inception (
A high-quality structured mesh was constructed for the domain to calculate solutions of SVF, temperature, and OH*. A quadrilateral (four-sided cell) 2D cell shape was used due its suitability for the current computation domain (structured grid). A total number of 36,000 quadrilateral cells were generated to provide high quality results. A fine mesh was generated near the fuel inlet and the axisymmetric wall which gets coarser moving toward the wall and outlet due to the small gradients in the laminar diffusion flame in these areas. A mesh independence study was performed that compared the temperature profile along the centerline between the chosen mesh (36,000 cells) and four different meshes containing 9,000, 81,000, 110,250, and 144,000 cells. The temperature profiles of 32% C2H4 and 68% N2 flame mixture were compared with the experimental and computational outputs of McEnally et al. McEnally et al. (1998) at different heights above the burner base to evaluate the precision of the present new computational laminar diffusion flame model. A qualitative comparison between the OH* signal obtained from the experimental work and the OH* from the model for F13 case was also performed.
3 Results and discussion
The main species profiles and peak values obtained from the numerical simulations are presented first and then discussed in each subsection. The pathway analysis was used to identify the main pathways that contribute to the formation of the study’s soot precursors, C2H2 and C3H3. The direct and IAT images of OH*, CH*, and C2* chemiluminescence results of all mixtures are then presented and discussed in each subsection. Direct images were used to discuss the appearance of flames in terms of shape and color as an indication of soot formation, whereas HRR and soot concentrations were approximated through IAT chemiluminescence images.
The following subsections start by discussing the impact of DME addition to the methane (Section 3.2), followed by a comparison with results of N2 addition to methane or DME (Section 3.3), with equal power output conditions (Section 3.4), and of the DME addition to ethylene cases (Section 3.5) on HRR and soot emissions. Section 3.5 further evaluates the correlations between OH*/CH* ratios and equivalence ratios from the numerical results of DME added to CH4 and C2H4 flames in the non-premixed configuration. The feasibility of partially applying the correlation to the experimental results of DME/C2H4 flames to obtain local equivalence ratio information is discussed. Section 3.7 presents the soot volume fraction results of two DME/C2H4 flames from the two-color measurements. The last subsection (3.8) discusses the outcomes of the CFD study.
3.1 C2H4 modeling validation
The Mech_56.54 mechanism had already been validated for DME, CH4, and their mixtures by Burke et al. (2015) using their data and previous literature data. In this section, the Mech_56.54 mechanism was more validated in a 1D counterflow diffusion C2H4 flames with the available results of C2H4 in Yoon et al. (2008). Figure 4 shows the comparison of the current simulation with Yoon et al. (2008) results for C2H2 and C3H3 mole fractions of pure C2H4 fuel. As seen in Figure 4, the C3H3 mole fraction of both results increased monotonically with temperature increase, whereas the comparison of the C2H2 mole fraction shows both profiles peaking at approximately 1500 K. Overall, the current simulation results agreed well with the outputs of Yoon et al. (2008).
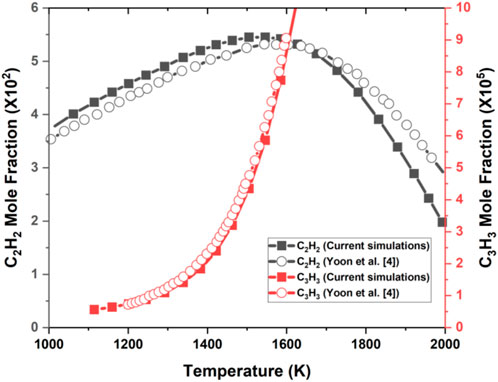
FIGURE 4. 1D counterflow flame Cosilab current simulation and results of Yoon et al. (2008) for C2H2 and C3H3 mole fractions against temperature of pure C2H4 fuel.
3.2 DME/methane mixtures
3.2.1 DME/CH4 mixture species profiles
The results for DME/CH4 flames (F1–F5) are plotted against the mixture fractions in Figures 5A–C. The stoichiometric mixture fraction (ξ_stoic) values are 0.054, 0.069, 0.081, 0.090, and 0.098 for F1 (pure methane), F2, F3, F4, and F5 (pure DME), respectively. Figure 5A compares the normalized peak values of flame temperature, HRR, CH3, C3H3, CH*, OH*, OH, CH, and C2H2 mole fractions produced from the different conditions of DME/CH4 mixtures. The normalizations were achieved by referencing the peak values of the baseline case (which is pure methane—F1 for the cases with methane, pure DME—F5 for the DME/N2 cases, and F12 for the DME/C2H4 cases). The species mole fraction peak values for the baseline cases are summarized in Table 3. It is apparent that, with increasing DME mixture ratio, β, the peak values of flame temperature (T), and OH increase gradually, whereas HRR, CH*, OH*, and CH mole fractions decrease. The peak temperature of DME is higher than methane’s by approximately 47 K. It also shows that DME addition to methane reduces CH3 and soot precursors in the mixture, as indicated by the drop of C3H3 and C2H2 mole fractions (Figure 5A).
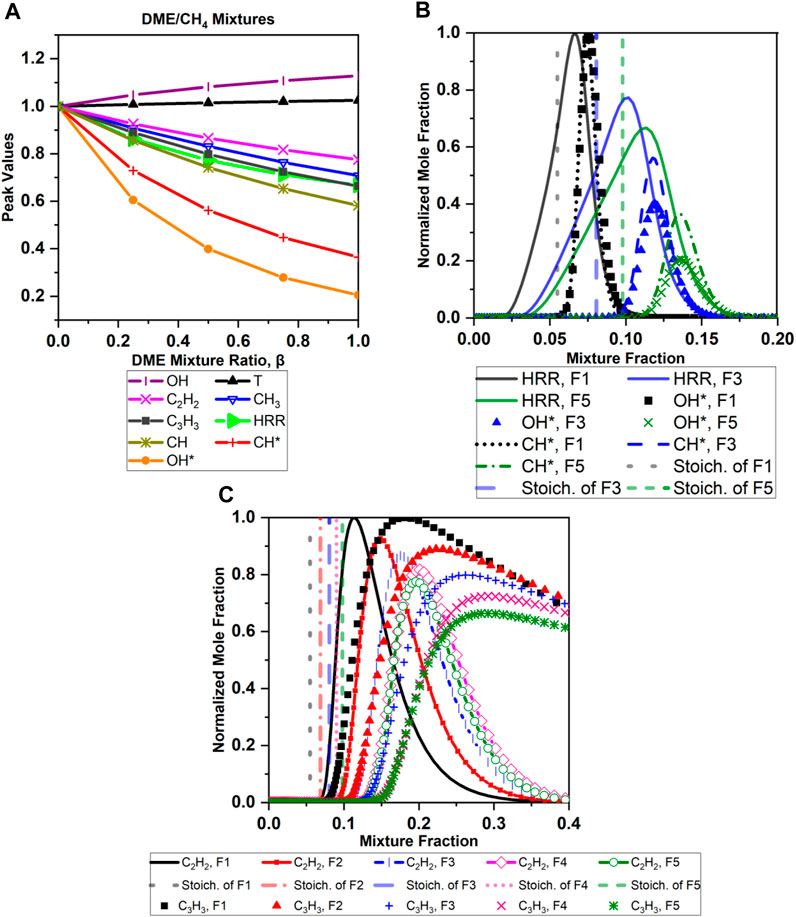
FIGURE 5. 1D counterflow flame Cosilab simulation results from various DME/CH4 mixtures (F1–F5): (A) normalized peak values of key species, T, and HRR; (B) profiles of HRR, CH*, and OH* in the mixture fraction zone, referenced with stoichiometric values; (C) comparison of C2H2, C3H3, and CH3 profiles for the five cases.
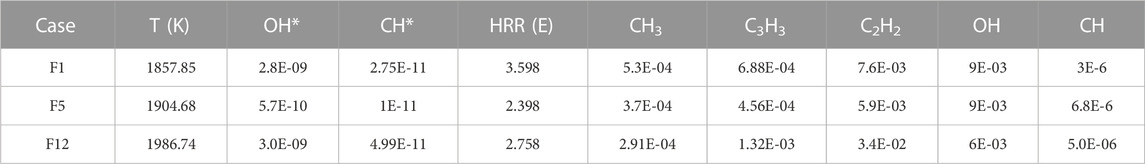
TABLE 3. Species mole fraction peak values for baseline F1, F5, and F12 cases
CH*, OH*, and HRR peak values are lowest in pure DME (Figures 5A, B). Both OH* and CH* mole fraction profiles start increasing in the rich side of the stoichiometric line in all cases shown in Figure 5B, and, as DME mixing ratio increases, both mole fraction profiles start increasing further from the stoichiometric line. A very clear overlap of CH* and OH* profiles with the rich side of the HRR profile is apparent, confirming the validity of using OH* and CH* chemiluminescence as markers for HRR regions in the rich side.
The results of soot precursor behavior are shown in Figures 5A and C. Contrary to the findings for the DME addition to ethylene in Yoon et al. (2008), no increase in the peak values with little addition of DME (25%) to methane is observed in the numerical results (Figure 5A) for C3H3 and C2H2. Nevertheless, the integrated C2H2 profile (Figure 5C) increase could indicate higher soot concentration. C2H2 is shown to be present only in the fuel-rich side for all cases shown in Figure 5C, in which it starts increasing at approximately ξ=0.1 and is highest at ξ=0.11 for the pure methane case and at ξ=0.19 for the pure DME case; thereafter, it starts decreasing again to zero. In Figure 5C, C2H2 and C3H3 mole fraction profiles start increasing further from the stoichiometric line (at a larger mixture fraction value) as the DME mixing ratio increases, which likely indicates less soot precursors reaching the flame sheet.
From the pathway analysis shown in Figure 6, the soot reduction when adding DME to the methane flame is related to the decrease of the net concentration of CH3, which further leads to the decrease in the net production of C2H2 and C3H3. In the case of pure methane (Figure 6, F1), formation pathways show that C2H2 is mostly formed from C2H4, and C3H3 is formed mainly from C2H5. Multiple species, including CH3, C2H6, C3H8, and IC3H7, contribute to forming C2H5 in the case of pure methane, whereas, in the mixed case (Figure 6, F2), although the species contributing to forming C2H5 are similar to the pure methane case, the percentages of their contributions to C2H5 are reduced, causing a decrease in C2H2 and C3H3 mole fractions.
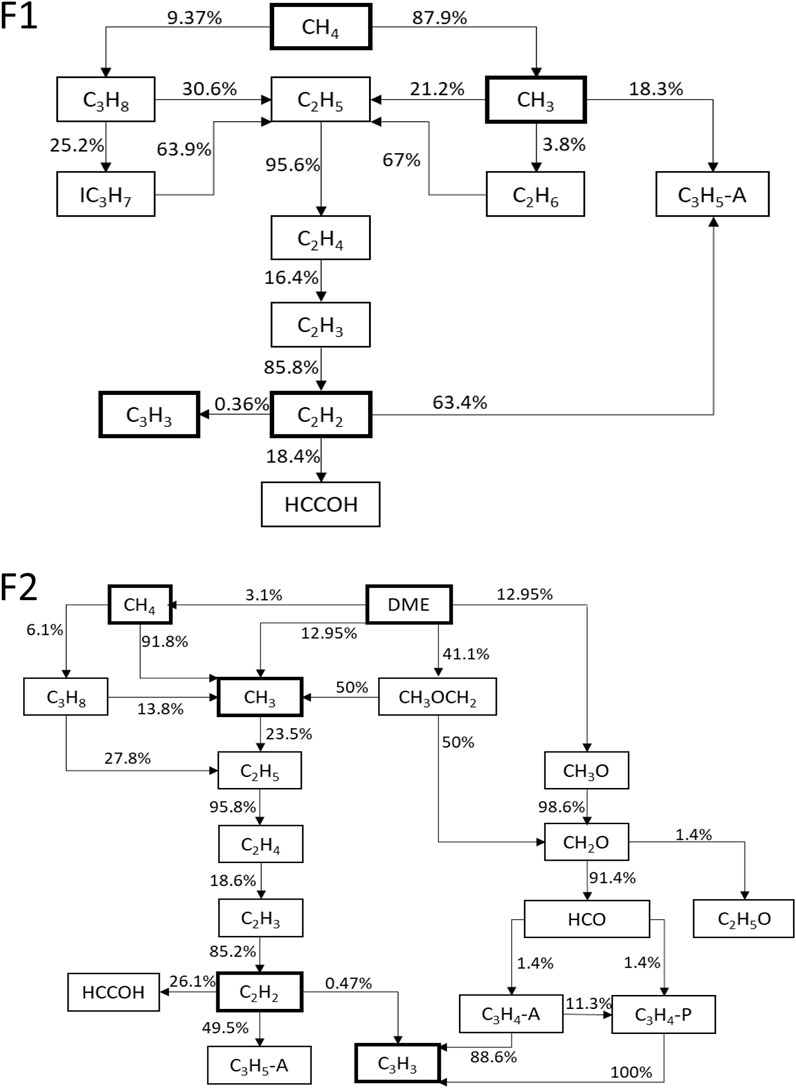
FIGURE 6. Dominant decomposition pathways of F1 (top) and F2 (bottom) cases. Values alongside arrows specify percentage of contribution.
3.2.2 Chemiluminescence and direct images
The results for DME/CH4–air flames (F1–F5) are shown in Figure 8. The direct images clearly demonstrate an axisymmetric and stable flame for all conditions. The soot radiation intensity in the direct images signifies the relative soot concentration in the flames. It is clearly visible from the direct images in Figure 7 that, as the amount of DME increases in the mixture (F5 is purely DME), the intensity of soot radiation apparent in the flame becomes weaker, indicating reduced soot concentration—assuming the changes in flame temperatures are small. Nevertheless, the soot radiation appearance in F2 (
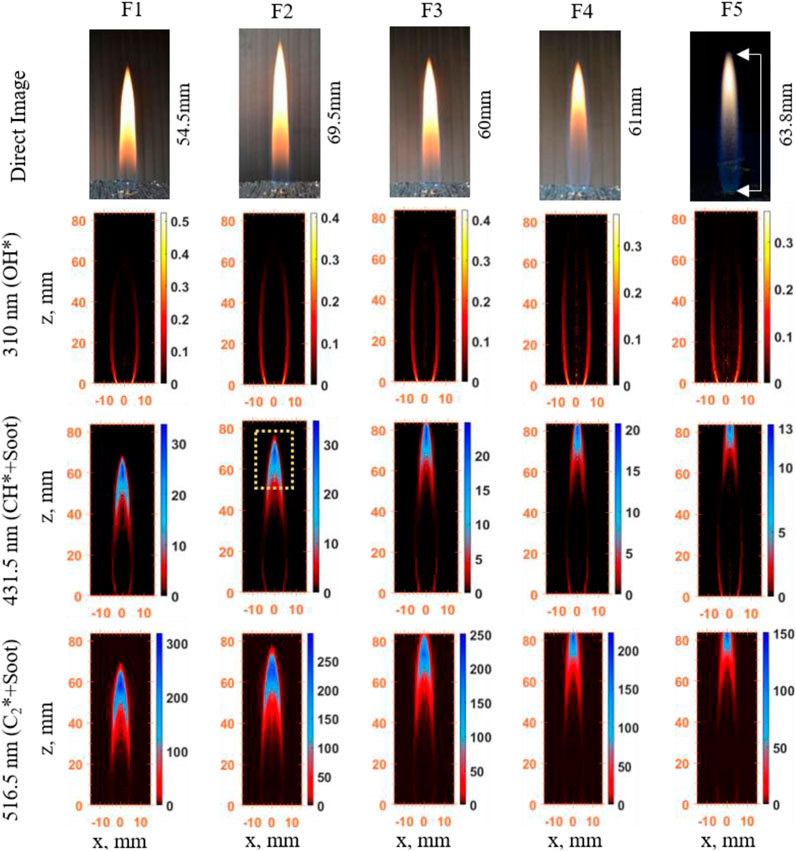
FIGURE 7. CH*, OH*, and C2* chemiluminescence, and direct image results of DME/CH4 mixtures: flame structure and prediction of soot and HRR. (F1) β = 0, (F2) β = 0.25, (F3) β = 0.50, (F4) β = 0.75, and (F5) β = 1.
In Figure 7, it is apparent that the flame height (measured in this study as the axial distance from the fuel exit to the visible tip of the soot emissions from the direct image) increases when DME is introduced into the fuel stream. The flame becomes longer so that enough oxygen can reach the center axis of the flame and burn all of the fuel, since DME takes more oxygen to burn stoichiometrically than methane (Roper, 1977). OH* and CH* IAT images mostly show intensities at a thin layer located between the central jet and the co-flow air stream (reaction zone), confirming the validity of using OH* and CH* chemiluminescence as a HRR marker in non-premixed flames. The OH* emission intensity (Figure 7) shows a gradual decrease in intensity—a decrease in HRR for β < 0.50 and a rapid decrease for β > 0.50. CH* chemiluminescence images representing HRR are, however, prone to contamination by soot radiation in the laminar diffusion DME/CH4–air flames investigated. Since HRR can be represented by both CH* and OH* chemiluminescence images, the blue-colored signal shown at the flame tips in CH* images (marked by the yellow square in Figure 7) mostly indicates soot. This can be verified by comparing CH* and C2* images, since C2* is mostly a result of soot radiative emission and does not represent the heat release rate for the DME/CH4–air flames under study. C2* chemiluminescence images show an increased soot signal when a small amount of DME of 25% (F2) is added to pure methane; subsequently, the soot decreased as more DME was added. Note that the soot signal is a combined effect of soot concentration and soot temperature, according to Planck’s law. The increased soot signal observed at 25% DME addition indicated by C2* does not conflict with Yoon et al. (2008), where reduced soot concentration was found with DME addition compared to pure methane flame. The measurement of soot concentrations by two-color pyrometry of the Fl–F4 flame is discussed further in Section 3.7.
The soot signal in some of the CH* chemiluminescence images potentially still exists with DME added flames. However, it is still important to study the characteristics of CH* as it potentially provides an alternative endoscopic in-cylinder measurement for HRR and soot when UV-based OH* measurements are not feasible due to optical transmission limitation. In addition, both OH* and CH* measurements could provide equivalence ratio information (to be discussed in Section 3.6); thus, the CH* measurement is useful for interpreting flame structures and for CFD comparisons.
3.3 DME/N2 mixture and CH4/N2 mixture
N2 was introduced to the fuel mixture to maintain the power output at various DME mixing ratios, the results of which will be shown in Section 3.4. In this section, the effects of adding only N2 to the methane or DME flames are investigated and the results shown below. This will help clarify the soot emission behavior in the constant power output section discussed later in the paper.
3.3.1 DME/N2 and CH4/N2 mixtures species profiles
Flame temperature, OH, CH, OH*, CH*, HRR, CH3, C3H3 , and C2H2 peak value profiles for CH4/N2 mixtures normalized by the peak values of the F1 case (Table 3) are displayed in Figure 8A. Figure 8A shows that the addition of N2 to CH4 flames resulted in reducing the HRR, T, OH, CH, OH*, and CH* peak values. OH* intensity was also investigated experimentally in counterflow (CF) CH4/N2 flames to validate our 1D numerical results. The results of CF flames confirm that the addition of N2 to CH4 reduced the OH* values (Figure 8A). Furthermore, CH3, C3H3, and C2H2 mole fractions are shown to decrease with the increase in the N2 mixture ratio, indicating less formation of PAH and, hence, soot.
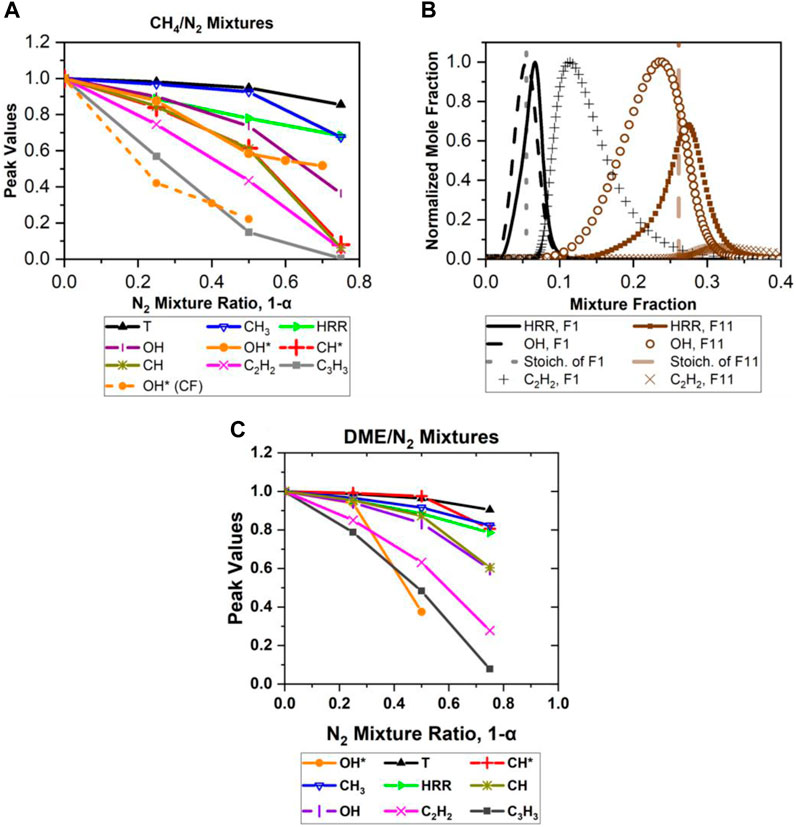
FIGURE 8. 1D counterflow flame Cosilab simulation results from (A) CH4/N2 mixture peak values, (B) F1 and F9–F11 HRR, OH, and C2H2 profiles: profiles of main species, and (C) DME/N2 mixtures peak values. α indicates percentage of fuel (DME) in the fuel stream (DME, N2 mixture).
Adding N2 (75% of fuel stream) resulted in shifting the OH and HRR profiles more into the lean region and causing C2H2 to start forming on the lean side (
The behavior of species profiles in DME/N2 mixtures are quite similar to those in CH4/N2 mixtures, as shown in Figure 8C, which shows that the addition of N2 into DME flame resulted in a significant decrease in the peak value for most species (i.e., C2H2, C3H3, OH, CH, and OH*) and a gradual decrease in CH3, HRR, CH*, and T. The result of OH* for the 0.75 N2 mixture ratio is not shown in Figure 8C because the simulation model did not predict the OH* well. The counterflow diffusion flames of DME/N2–air were not available in the current work for comparison with the simulated results. The unexpected OH* behavior for the 0.75 N2 mixture ratio case suggests more investigation into the mechanism is needed. Figure 8C shows that C2H2 decreases in the mixture as the mixture ratio of N2 increases, agreeing with the soot appearance in the experimental C2* and CH* chemiluminescence results (Figure 9). Furthermore, N2 addition also shifts species profiles and the ξ_stoic lines toward a higher mixture faction value, with the ξ_stoic values at 0.098, 0.115, 0.149, and 0.235 for F5, F6, F7, and F8 respectively.
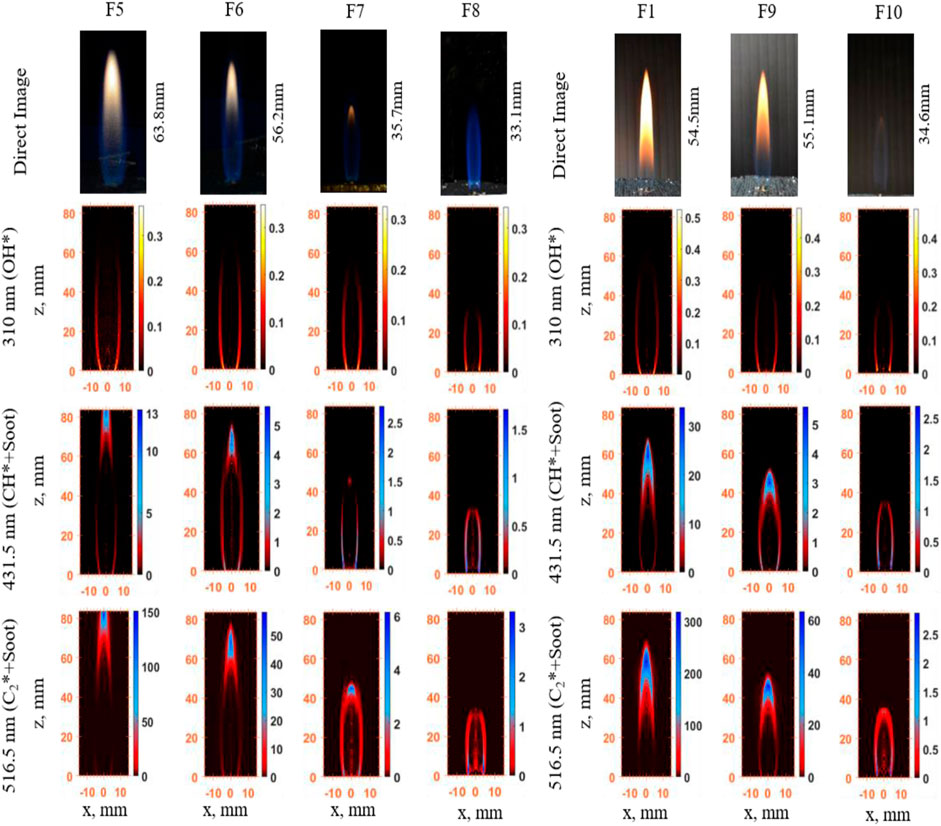
FIGURE 9. CH*, OH*, and C2* chemiluminescence, and direct image results of DME/N2 mixtures (F5–F8) and CH4/N2 mixture (F1 and F9–F10): flame structure and observation of soot and HRR. From left: (F5) α=1, (F6) α=0.75, (F7) α=0.50, (F8) α=0.25, (F1) α=1, (F9) α=0.75, and (F10) α=0.50.
3.3.2 Chemiluminescence and direct images
Direct and IAT images of OH*, CH*, and C2* chemiluminescence for DME/N2 mixtures (F5 to F8) are shown in Figure 9. The direct images, as well as in C2* and CH*, indicate a clear drop in the intensity of soot radiation as the percentage of the dilution (N2) increases in the fuel stream. With 75% N2 addition (F8), there is no soot visible in the direct image, and the OH*, CH*, and C2* images overlap well with each other at this condition. The total intensities of OH* chemiluminescence images are shown to have decreased as more N2 is added to the mixture (F6, F7, and F8). This agrees with the power outputs indicated in Table 2.
Like the DME/N2 mixtures, flame height is found to reduce as more N2 is added to CH4, as shown in the direct images in Figure 11 (F1, F9, and F10). The addition of N2 as a diluent significantly decreases the power output of the mixture (Table 2). In CH4/N2 mixtures (F9 and F10), the OH* chemiluminescence indicates that HRR is not substantially affected by adding N2, whereas soot emission drastically decreased when adding N2 to 50%, as shown in the C2* chemiluminescence images (F10) in Figure 9.
3.4 Constant power output
DME/methane mixture tests were repeated with a constant power output of 0.195 kW (identical with the pure methane case in F1) and a fixed volumetric flow rate of 356.6 SCCM for flames F14 to F17 (Table 2) by adding nitrogen N2 as a diluent. Figure 10A shows the direct and IAT images of OH*, CH*, and C2* chemiluminescence results. As with the previous cases above, OH* chemiluminescence was mostly located at the edges of the flame potential core region (near the nozzle exit), and then gradually started stretching toward edge of the flame center region as DME and N2 mixture ratios increased. CH* and C2* chemiluminescence images clearly show reduced soot signal as DME and N2 mixture ratios increase.
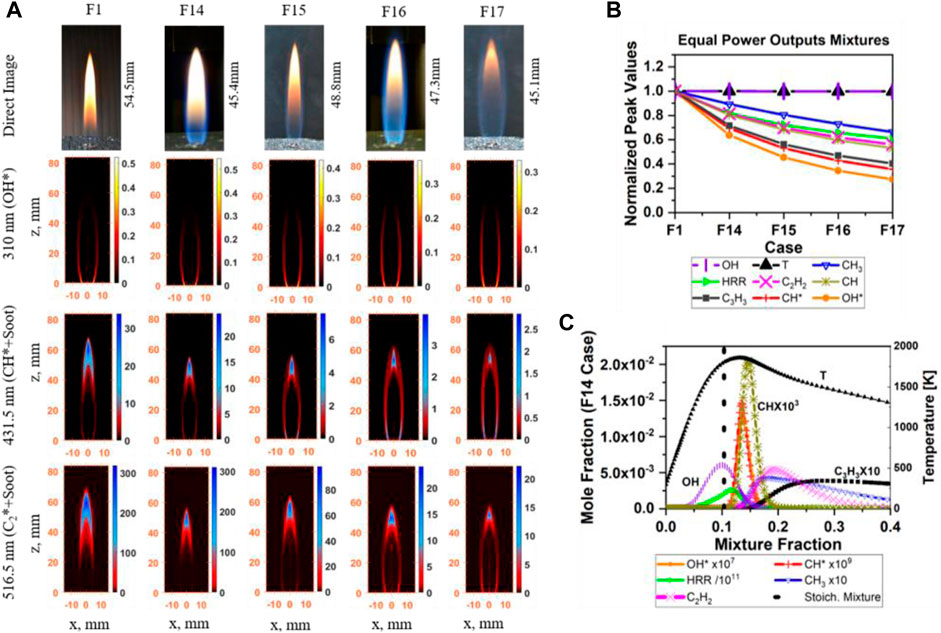
FIGURE 10. Flame structure, and prediction of soot and HRR of the equal power output of DME/CH4/N2 mixture. (A) Direct image, CH*, OH*, and C2* chemiluminescence, (F1) α=1, (F14) α=0.85, (F15) α=0.75, (F16) α=0.70, and (F17) α=0.60. (B) Simulation results–normalized peak values; (C) profiles of main species, case F14.
Numerically, the trend of the normalized peak values (by F1, Table 3) for the equal power output cases (Figure 10B) are similar to the DME/CH4 flames (F1–F5, Figure 5A). A reduction is seen in the species’ peak concentrations, apart from OH and temperature, which remain unchanged. The OH* and CH* are positively correlated with the HRR. Apart from the peak values, species profiles and the integral areas are similar. Figure 10C shows an example for the relative position of the investigated species (F14). As more DME and N2 are introduced, more species profiles are shifted toward the lean side of the stoichiometric line (ξ_stoic is 0.054, 0.082, 0.103, 0.120, and 0.133 for F1, F14–F17, respectively). The individual profiles and simulation dataset are available in the Supplementary Material.
3.5 DME/C2H4/N2 mixtures
This subsection discusses the results for the two equal power cases (F12 and F13; for flow conditions, refer to Table 2) of DME/C2H4/N2. The direct images show a slight increase in flame height when DME is added to the C2H4/N2 mixture (F12) due to an increase in the mixture’s molar mass (Figure 11A). Like the DME/CH4 mixtures, the OH* chemiluminescence indicated a decrease in HRR when DME is added (F13) to the C2H4/N2 mixture. Furthermore, CH* and C2* chemiluminescence images show a soot signal lower in F13 than in F12, indicating that DME addition (at 50%) to ethylene reduces the soot concentration, in agreement with Yoon et al. (2008), Liu et al. (2011), Sirignano et al. (2014), and Choi et al. (2015).
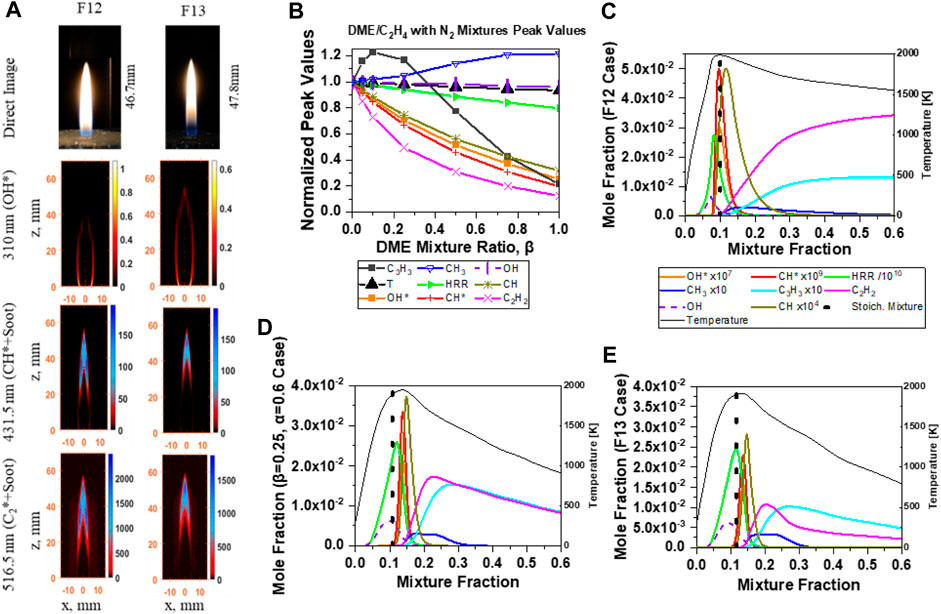
FIGURE 11. DME/C2H4/N2 mixture (A) direct image and chemiluminescence images, and 1D counterflow simulation results: (B) normalized peak values of major species, T and HRR, species profiles from (C) β = 0 (F12), (D) β = 0.25, and (E) β = 0.50 (F13).
Numerical results of the DME/C2H4/N2 mixtures are shown in Figures 13B–E at various DME mixture ratios (β=0, 0.25, 0.5, 0.75, and 1) with constant fuel mixture ratio (α = 0.6). It is clearly noticed in Figure 11B that most of the species peak values decrease as more DME is introduced, except for C3H3, which increased with 25% DME addition and then decreased as β increased. The peak mole fractions of OH* in Figure 11A are positively correlated with the flame HRR similar to the equal power output results shown in Figure 10B. Figures 11C–E illustrate the flame temperature, OH, CH, OH*, CH*, HRR, CH3, C3H3, and C2H2 mole fraction profiles of DME/C2H4 with N2 mixtures. As increased percentage of DME is introduced into the ethylene fuel stream, the areas under the C2H2 and C3H3 profiles decrease. Additionally, the CH3 peak mole fraction increases as the DME mixture ratio increases. The role of CH3 in the formation of C2H2 and C3H3 is discussed in the pathway analysis (Figure 12).
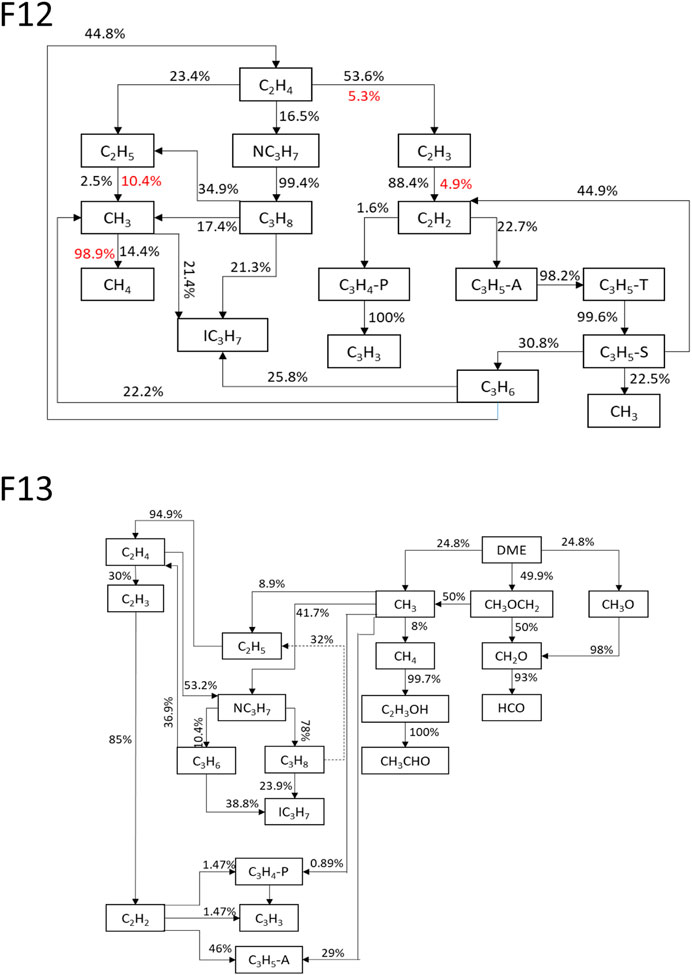
FIGURE 12. Dominant decomposition pathways of F12 and F13 cases. Values alongside arrows specify percentage of contribution. Red value colored and dashed arrow indicate reverse contribution.
The pathway analysis shown in Figure 12 illustrates that the combustion of C2H4 initially generates mostly C2 species, such as C2H3, C2H5, and C2H2. Therefore, it is likely that the CH3 intensity is low in a pure C2H4 flame, whereas the dissociation of DME produces CH3 in the Mech_56.54 mechanism via the CH3OCH2 = CH3 + CH2O reaction (R805). Consequently, the concentration of CH3 increases with the addition of DME (Figures 13, 14), and hence the net formation of C3H3 initially increases through reactions C2H2 + CH3 = C3H4-P + H and C3H4-P = C3H3 + H, and reduces at high DME mixture ratios due to limited C2H2. A reduced C2H2 net concentration is obtained due to the reduced amount of C2H4 and the additional reaction with CH3 to form C3H3.
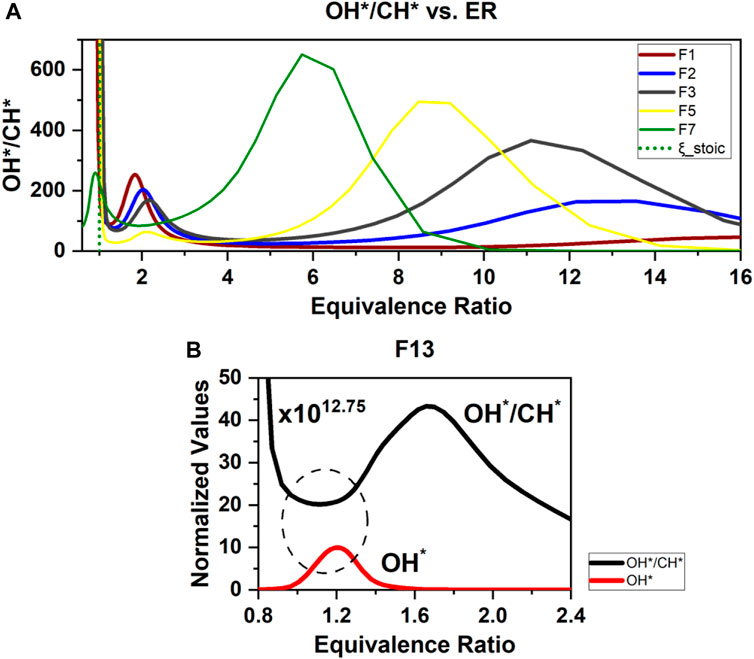
FIGURE 13. 1D simulations of (A) OH*/CH* chemiluminescence ratios vs. equivalence ratio and (B) normalized values of OH* and OH*/CH* for F13 case.
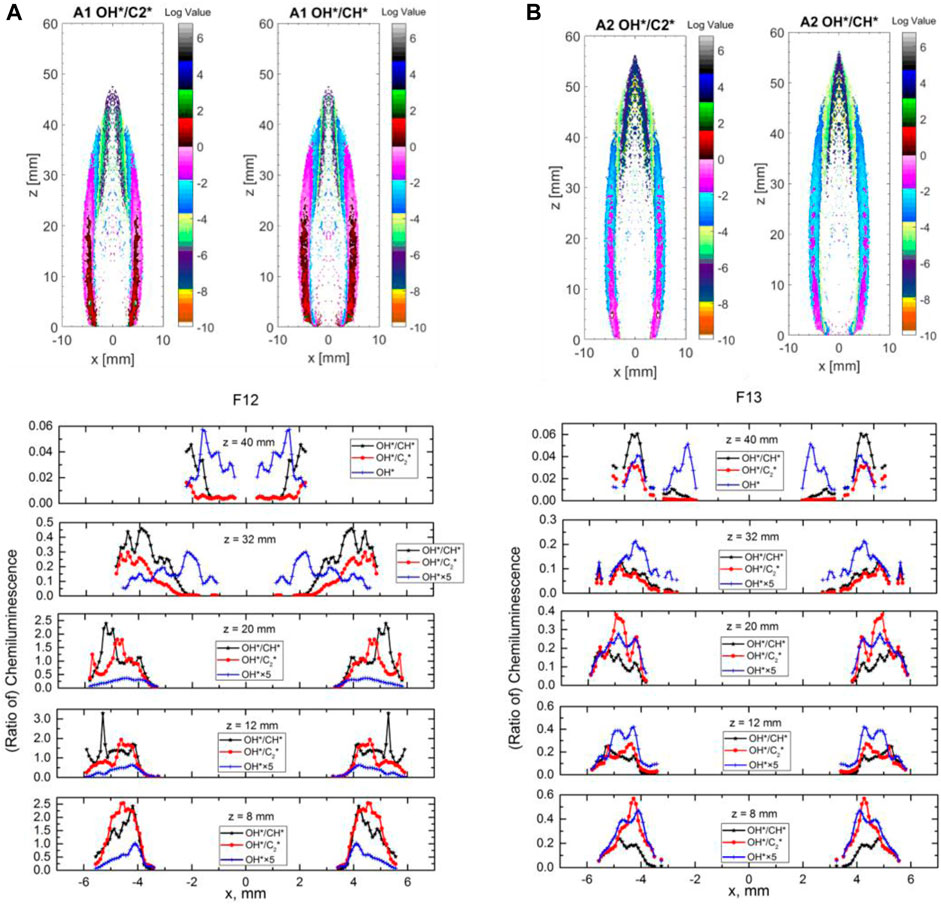
FIGURE 14. (A) OH*, OH*/CH*, and OH*/C2* ratios of experimental results in F12 at axial locations of 8, 12, 20, 32, and 40 mm above burner. (B) OH*, OH*/CH*, and OH*/C2* ratios of experimental results in F13 at axial locations of 8, 12, 20, 32, and 40 mm above burner.
3.6 Chemiluminescence ratios and equivalence ratios
This section discusses the correlation between the OH* and CH* chemiluminescence ratios and the equivalence ratio (ϕ) which was investigated in the non-premixed flames of methane and ethylene with DME addition. The results were compared with the chemiluminescence measurement to investigate their suitability as equivalence ratios marker via the OH* and CH* chemiluminescence ratio measurements in non-premixed flames. It was found from simulations that the OH*/CH* ratios only peak once against ϕ in the cases with DME absent in the mixture. However, in most cases in this work with DME present, a second peak forms at an equivalence ratio of approximately 6–12 (Figure 13A). This makes it difficult to use the OH*/CH* ratio to correlate ϕ for the DME cases because it does not perform an ideal monotonic function of ϕ. The addition of DME may result in the extra involvement of oxygen atoms in the h + o + m = m + oh* reaction. The contribution of an O atom to OH* in this reaction is 16.4%, 22.1%, 27.1%, and 35.2% for F1, F2, F3, and F5, respectively. It is still unknown whether strain rates affect the OH*/CH* ratios in non-premixed flames. It would be interesting to numerically investigate other chemiluminescence spectral band ratios such as CH*/C2* to correlate ϕ. However, this will be difficult to conduct experimentally due to the high soot radiation in non-premixed flames which could affect the measurement of CH*/C2* ratios.
Although OH*/CH* alone is not feasible for correlating ϕ in non-premixed flames with DME, a combined approach utilizing OH* behaviors together with the ratios could be useful. In all simulation results, only a single peak in the OH* profile has been shown for each case that aligns closely to the stoichiometric line, suggesting that mapping numerical to experimental results for OH*/CH* ratios conditional to the OH* profiles could provide useful information on ϕ values. To take the DME/C2H4/N2 case F13 as an example, Figure 13B shows that OH* and OH*/CH* ratio profiles have an opposite trend (circled) at near ϕ =1.2 where the OH* single peak is located (F13). If the chemiluminescence experimental results for OH* and OH*/CH* follow a trend similar to the simulation results, then a limited range of ϕ can be mapped from the numerical results.
Figures 14A, B show the experimentally obtained OH*/CH* and OH*/C2* ratios images (in log values) of F12 (Figure 14A) and F13 (Figure 14B) and the line profiles of the ratios and the OH* (a.u.) at several locations above the burner exit. A single peak for OH* at low height (8 mm) is obtained overall in both cases, agreeing with the numerical results; however, at greater heights (i.e. 40 mm for F13), an additional second peak for OH* is observed. The formation of a second peak could be attributed to the existence of a second reaction zone at greater heights in the flame. At a low height (8 mm in F13), OH* and OH*/CH* ratio profiles show an opposite trend (i.e., at a radius of approximately 4–5 mm, where it shows an increase in OH*, and a decrease in OH*/CH* ratio as approaching the centerline), in agreement with numerical results. This suggests that, at a radial position of approximately 4 mm in F13, ϕ is equal to 1.2, in accordance with Figure 14B. In Figure 11C (F12 case), the peak of OH* is aligned with the stoichiometric line, and, when DME is added to the mixture in Figure 11E (F13 case), the position of OH* shifted toward the rich side of the stoichiometric line and the OH* signal almost cut off at the stoichiometric line (corresponding to a radial position of 5 mm in F13—Figure 14B). This provides limited mapping for the ϕ measurements in the lower heights of the non-premixed DME flames from the combined OH* and OH*/CH* ratio images.
3.7 The planar two-color soot pyrometry measurement
The planar two-color soot pyrometry technique was used to study and validate the prediction of soot. Figure 15 clearly shows that the intensity of soot is lower in F13 (β=0.5) than in F12 (β=0), indicating that the addition of DME to an ethylene flame reduces net soot formation. The mean soot volume fraction in F12 and F13 are 0.22 ppm and 0.09 ppm, respectively.
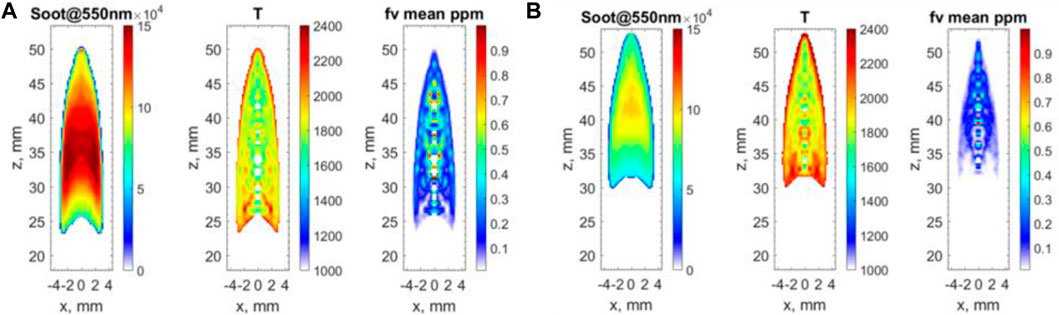
FIGURE 15. Planar two-color soot pyrometry results of (A) F12 and (B) F13.
Figure 15 illustrates that the mean soot temperature is slightly increased for F13, where the temperatures in F12 and F13 are 1867 K and 1969 K, respectively. At the flame front, where the temperature peak roughly is located, there should not be much soot, and it should be oxidized when passing the flame front. There is no signal displayed outside the flame front in both cases in Figure 15; thus, the flame temperatures in these regions were not investigated. The values of peak temperature obtained by two-color soot pyrometry are lower than the peak of the temperature profiles obtained by 1D simulations. This is as expected, due to the locations of soot formation and the radiation heat loss in the experiments.
The drawback of the two-color soot pyrometry measurement is from the line-of-the-sight nature of the technique, which creates artificial errors using the inverse Abel transform to obtain the 2D information. However, this technique provides a low-cost measurement of soot temperature and concentration, which allows an integrated approach for studying the flame structure along with the chemiluminescence measurements of OH*, CH*, and C2*.
Table 4 displays the planar two-color results of relative spatial soot volume fraction against DME volume fraction for the F1 to F4 cases. The planar two-color results of DME/CH4 mixtures (F1–F4) indicate a decrease in soot volume fraction when the DME in fuel mixture volume increases, agreeing with both chemiluminescence and 1D simulation results shown in Section 3.2.
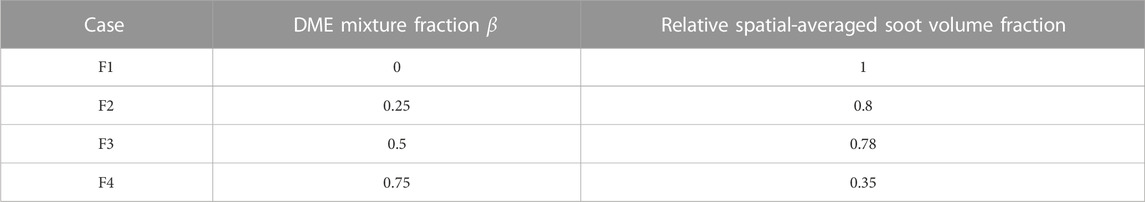
TABLE 4. Results obtained by the two-color technique for F1–F4 cases showing the relative spatial-averaged soot volume fraction vs. DME volume fraction.
The agreement found between the soot concentration measurements by two-color pyrometry and the mole fraction trends of the soot precursors predicted by the numerical simulation confirms the validity of the Mech_56.54 mechanism in the C2H2 and C3H3 as markers and precursors for soot models.
3.8 Computational fluid dynamics
A sensitivity analysis was performed on a case with similar boundary conditions as the other cases (F12 and F13) shown in Table 2 but with a fuel mixture inlet of 32% C2H4 and 68% N2 to confirm the grid’s independence. This flame mixture was computed for validation purposes. In the beginning, the model contained 9,000 elements. This number was increased by increasing the number of divisions at each surface (including inlet, outlet, axes, and wall surfaces) and then re-meshing the body surface. Five different meshes containing 9,000, 36,000, 81,000, 110,250, and 144,000 elements were created for the sensitivity test, as described in Section 2.4. The temperature profiles along the axis (centerline) of the flame for all the meshes are shown in Figure 16A. All the temperature profiles were found to follow the same trend and peak location but with very small variations. The differences between the temperature profiles are very small, making it hard to assess the convergence. Therefore, the maximum temperatures of all profiles shown in Figure 16A are plotted against the element size (Figure 16B) to assess the convergence criteria. In addition, the percentage difference in the centerline peak temperatures was calculated for each mesh to find when the grid independence was accomplished (Table 5).
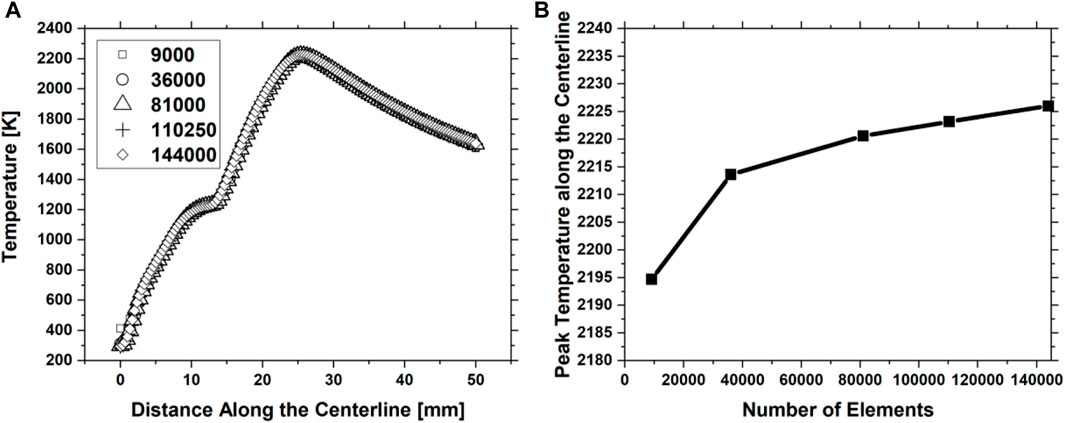
FIGURE 16. (A) Temperature profiles along centerline for five different meshes containing 9,000, 36,000, 81,000, 110,250, and 144,000 number of elements. (B) Peak temperatures along the centerline against the element size.
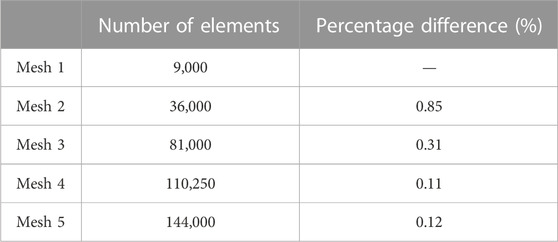
TABLE 5. Percentage difference in centerline peak temperatures between the five different meshes.
Each percentage in Table 5 represents the difference between two meshes. For example, the percentage difference between the peak temperature values along the centerline computed from mesh 1 and mesh 2 is 0.85% and between mesh 2 and mesh 3 is 0.31%. The results in Table 5 reveal that the percentage difference decreases as the number of elements increases. This is also reflected in Figure 16B, where the convergence between the peak temperature values becomes very clear after 36,000 (mesh 2) elements. The percentage difference between meshes 2 and 5 (finest among the five meshes) in peak temperature value is approximately 0.5%. Due to the slight percentage difference between the use of these meshes, the convergence criteria are considered to have been met using 36,000 elements. In addition, using mesh 2 (36,000 elements) costs less computational expense than using mesh 5. Hence, mesh 2 was used for all simulations in this study to obtain high-accuracy results with less expensive computational time.
To assess the accuracy of the current computational laminar diffusion flame model, the temperature profiles produced from this study and the experimental and computational results of McEnally et al. McEnally et al. (1998) were compared out at different heights above the nozzle (axial height) (Figure 17). The comparison presented in Figure 17 is on the flame mixture of 32% C2H4 and 68% N2. The experimental and model configuration of McEnally et al. McEnally et al. (1998) is similar to that used in this study (Yale co-flow burner (Gau et al., 2017)). The comparison was carried out at axial heights of 5 mm and 25 mm. The temperature computations of the current model and thermocouple measurements (McEnally et al., 1998) agree very well at both flame heights. At 5 mm axial height, the peak temperature of the current model is higher by approximately 2.7% than the thermocouple peak temperature of McEnally et al. McEnally et al. (1998). This is lower than the percentage difference between the thermocouple and computational peak temperatures of McEnally et al. McEnally et al. (1998), in which their computed peak temperature is higher by approximately 3.3% than their thermocouple peak temperature. At 25 mm axial height, the temperature profile of the current model is a little higher than that obtained by the thermocouple (McEnally et al., 1998), where the percentage difference between peak temperatures is approximately 5%. However, the current model temperature profile follows a similar trend to the thermocouple at 25 mm axial height.
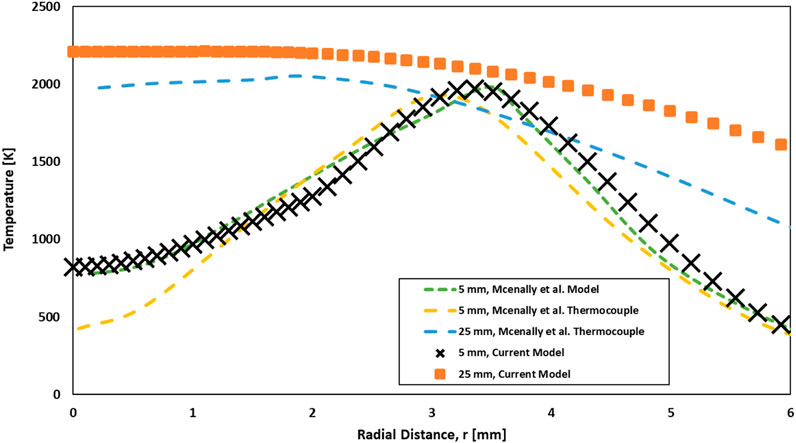
FIGURE 17. Comparison between current model results and results of McEnally et al. McEnally et al. (1998) temperature for profiles at various axial heights.
A qualitative comparison of the OH* signal obtained from the experimental work and the OH* from the model for the F13 case is shown in Figure 18. The OH* model results agree well with the experimental results. Both offer similar signal distribution at the reaction zone. The signal shown along the centerline of the flame in the experimental image is a noise resulting from the IAT processing. The computational result also agrees with the experimental result regarding height, where both images showed a height of approximately 50 mm for the OH* signal. However, the intensities of the computed OH* do not closely match the experimental results near the burner because this case contains soot (Figure 11). It is thus highly likely that the distribution of OH* intensity observed experimentally was affected by the presence of soot and PAH.
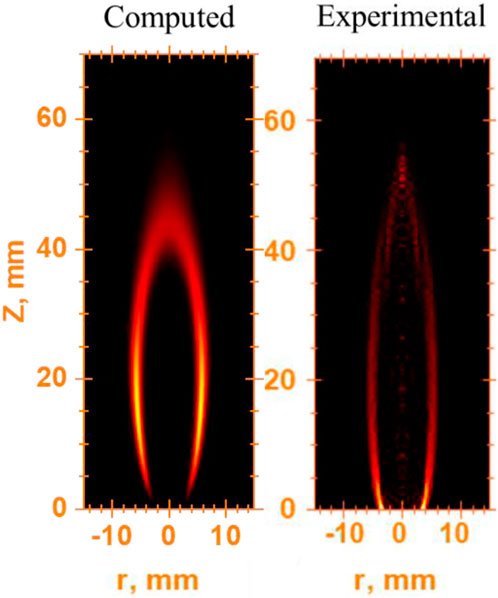
FIGURE 18. Qualitative comparison between experimental and computational results on the OH* signal.
A parametric study was conducted to determine the typical values of
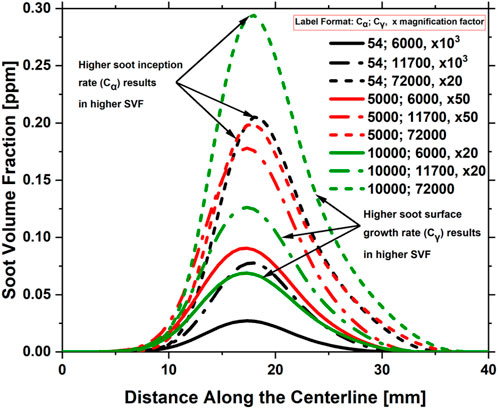
FIGURE 19. Impact of
The impact of the
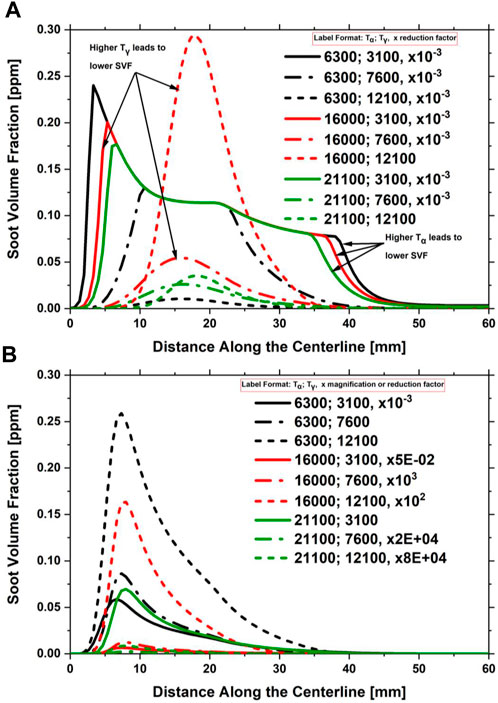
FIGURE 20. Impact of
The two parametric studies were repeated for the F13 flame condition (30% DME, 30% C2H4, and 40% N2). For
4 Conclusion
This study investigated the validity of using chemiluminescence and their pairs as markers for flame heat release zone and equivalence ratio measurements in DME diffusion flames. In addition, it sought to understand the characteristics of soot emissions and flame HRR on DME mixtures with methane and ethylene fuels in a co-flow non-premixed flame configuration. CH*, OH*, and C2* chemiluminescence measurements were obtained experimentally for various DME mixing ratios, and their correlations to the HRR and soot emissions studied. Investigations were further implemented on 1D simulations with the Mech_56.54 mechanism in which the formation of soot emissions was described in relation to CH3 and soot precursors of C2H2 and C3H3 species profiles. Two-color pyrometry measurements were also conducted to numerically validate the prediction of soot found. The relationship between DME mixture ratios and the formation of soot precursors was examined. OH* chemiluminescence was measured as a marker of HRR, where overlap with soot radiation was negligible. In most cases, IAT images of OH* and CH* displayed similar intensity distribution, while C2* IAT images showed more signal for the top section of the flame where soot appears. The key conclusions from this study are as follows:
1. Experimentally, the appearance of soot radiation in C2* chemiluminescence for methane flames became initially stronger with little addition of DME (25%). However, when the DME mixture ratio was increased by more than 25%, the soot radiation appearance became weaker, indicating either less soot concentration or reduced soot temperature. Numerically, the results showed a decrease in soot precursor (C2H2 and C3H3) concentration as the DME mixture ratio increased in methane flame. This agreed with the soot volume fraction measurement by the two-color soot pyrometry method.
2. Because a small addition of DME (25%) into an ethylene flame contributed to an increase in the concentration of C3H3, it is considered to be a vital species with C2H2 in forming C6H6 and soot. However, as the DME mixture ratio increased further into the ethylene flame, the C3H3 species concentration decreased.
3. Pathway analysis showed that, in DME/CH4 flame mixtures, CH3 significantly affected the formation of soot precursors such as C2H2, C3H3, from which potentially further forms C6H6. While it was in the DME/C2H4 flame mixture, CH3 had a positive influence on C3H3 net production under small DME mixing ratios (25%). C3H3 and C2H2 soot precursors were found to decrease as the DME mixture ratio increased in the CH4 flame; nevertheless, the integrated C3H3 and C2H2 profiles increased with 25% DME mixture ratio.
4. Both experimentally and numerically, equal power output cases displayed a reduction in HRR and soot concentration peak values as more DME and N2 were simultaneously added to methane and ethylene flames. However, the integrated area of investigated species profiles remained unaffected.
5. In the DME cases, the OH*/CH* ratio does not perform an ideal monotonic function of equivalence ratio.
6. Mapping numerical to experimental results for OH*/CH* ratios conditional to the OH* profiles could provide useful information on equivalence ratio values.
The results of flames with DME addition suggests that soot oxidization is critical to soot emissions in the practical application of DME-hydrocarbon combustion. This also agrees with the finding in the IC engine application where, although the addition of toluene increases PAH formation, the improved mixing effect results in overall soot reduction (Brookes and Moss, 1999). The current work discussed the performance of the detailed mechanism (Mech_56.54) on the predictions of flame chemiluminescence, heat release rate, major species distribution, and soot formations. Future work to embed the detailed mechanism to the CFD and engine simulations would be beneficial and will provide additional analysis on soot oxidization, particle growth, and, eventually, net soot emissions.
Data availability statement
The original contributions presented in the study are included in the article/Supplementary Material; further inquiries can be directed to the corresponding author.
Author contributions
AA: conceptualization, formal analysis, investigation, methodology, resources, validation, visualization, writing–original draft, and writing–review and editing. KH: writing–review and editing. GH: writing–review and editing. RY: conceptualization, formal analysis, investigation, methodology, resources, validation, visualization, writing–original draft, and writing–review and editing.
Funding
The author(s) declare that financial support was received for the research, authorship, and/or publication of this article. The authors would like to acknowledge EPSRC David Clarke Fellowship for the funding support of the research project (Grant Ref: EP/S017259/2).
Acknowledgments
The authors would also like to acknowledge the advisory support of CMCL Innovations and Prof. R. Cracknell from Shell Global Solutions (United Kingdom) for this project. The authors sincerely appreciate the technique support from M. Capper and D. Britton at Loughborough University for this project. For the purpose of open access, the author has applied a Creative Commons Attribution (CC BY) license to any Author-Accepted Manuscript version arising.
Conflict of interest
The authors declare that the research was conducted in the absence of any commercial or financial relationships that could be construed as a potential conflict of interest.
Publisher’s note
All claims expressed in this article are solely those of the authors and do not necessarily represent those of their affiliated organizations, or those of the publisher, the editors, and the reviewers. Any product that may be evaluated in this article, or claim that may be made by its manufacturer, is not guaranteed or endorsed by the publisher.
Supplementary material
The Supplementary Material for this article can be found online at: https://www.frontiersin.org/articles/10.3389/ffuel.2023.1296502/full#supplementary-material
References
Abu Saleh, A., Knight, T., and Yuan, R. (2022). Application of planar time-resolved 2C-LII for soot emission measurements in diffusion flames of DME blends and in swirl spray flames. AIAA SCITECH 2022 Forum. doi:10.2514/6.2022-1942
Ahmed, H., Ashraf, M., Steinmetz, S., Dunn, M., and Masri, A. (2021). The role of DME addition on the evolution of soot and soot precursors in laminar ethylene jet flames. Proc. Combust. Inst. 38 (4), 5319–5329. doi:10.1016/j.proci.2020.06.055
Baumgardner, M. E., and Harvey, J. (2020). Analyzing OH*, CH*, and C2* chemiluminescence of bifurcating FREI propane-air flames in a micro flow reactor. Combust. Flame 221, 349–351. doi:10.1016/j.combustflame.2020.08.009
Bennett, B. A. V., McEnally, C. S., Pfefferle, L. D., Smooke, M. D., and Colket, M. B. (2009). Computational and experimental study of the effects of adding dimethyl ether and ethanol to nonpremixed ethylene/air flames. Combust. Flame 156, 1289–1302. doi:10.1016/j.combustflame.2009.01.020
Bilger, R. W. (2011). A mixture fraction framework for the theory and modeling of droplets and sprays. Combust. Flame 158, 191–202. doi:10.1016/j.combustflame.2010.08.008
Bolla, M., Wright, Y. M., Boulouchos, K., Borghesi, G., and Mastorakos, E. (2013). Soot Formation modeling of n-heptane sprays under diesel engine conditions using the conditional moment closure approach. Combust. Sci. Technol. 185, 766–793. doi:10.1080/00102202.2012.752362
Brookes, S. J., and Moss, J. B. (1999). Predictions of soot and thermal radiation properties in confined turbulent jet diffusion flames. Combust. Flame 116 (4), 486–503. doi:10.1016/S0010-2180(98)00056-X
Burke, U., Somers, K. P., O’Toole, P., Zinner, C. M., Marquet, N., Bourque, G., et al. (2015). An ignition delay and kinetic modeling study of methane, dimethyl ether, and their mixtures at high pressures. Combust. Flame 162, 315–330. doi:10.1016/j.combustflame.2014.08.014
Charest, M. R. J., Gülder, Ö. L., and Groth, C. P. T. (2014). Numerical and experimental study of soot formation in laminar diffusion flames burning simulated biogas fuels at elevated pressures. Combust. Flame 161, 2678–2691. doi:10.1016/j.combustflame.2014.04.012
Chishty, M. A., Bolla, M., Hawkes, E. R., Pei, Y., and Kook, S. (2018). Soot formation modelling for n-dodecane sprays using the transported PDF model. Combust. Flame 192, 101–119. doi:10.1016/J.COMBUSTFLAME.2018.01.028
Choi, B. C., Choi, S. K., Chung, S. H., Kim, J. S., and Choi, J. H. (2011). Experimental and numerical investigation of fuel mixing effects on soot structures in counterflow diffusion flames. Int. J. Automot. Technol. 12, 183–191. doi:10.1007/s12239-011-0022-z
Choi, J. H., Choi, B. C., Lee, S. M., Chung, S. H., Jung, K. S., Jeong, W. L., et al. (2015). Effects of DME mixing on number density and size properties of soot particles in counterflow non-premixed ethylene flames. J. Mech. Sci. Technol. 29, 2259–2267. doi:10.1007/s12206-015-0447-9
Cosilab (2010). Cosilab, version: 3. Available at: https://www.rotexo.com/index.php/en/.
Fenimore, C. P., and Jones, G. W. (1967). Oxidation of soot by hydroxyl radicals. J. Phys. Chem. 71 (3), 593–597. doi:10.1021/j100862a021
Fischer, S. L., Dryer, F. L., and Curran, H. J. (2000). The reaction kinetics of dimethyl ether. I: high-temperature pyrolysis and oxidation in flow reactors. New Jersey, United States: John Wiley & Sons, Inc.
Frenklach, M. (2002). Reaction mechanism of soot formation in flames. Phys. Chem. Chem. Phys. 4, 2028–2037. doi:10.1039/b110045a
Gau, J., Das, D., McEnally, C., Giassi, D., Kempema, N., and Long, M. (2017). Yale coflow diffusion flames. 1–8. Available at: http://guilford.eng.yale.edu/yalecoflowflames/steady_burner.html (Accessed March 21, 2020).
Hardalupas, Y., and Orain, M. (2004). Local measurements of the time-dependent heat release rate and equivalence ratio using chemiluminescent emission from a flame. Combust. Flame 139, 188–207. doi:10.1016/j.combustflame.2004.08.003
Hasse, C. (2016). Scale-resolving simulations in engine combustion process design based on a systematic approach for model development. Int. J. Engine Res. 17 (1), 44–62. doi:10.1177/1468087415597842
Hwang, J. Y., Lee, W., Kang, H. G., and Chung, S. H. (1998). Synergistic effect of ethylene-propane mixture on soot formation in laminar diffusion flames. Combust. Flame 114, 370–380. doi:10.1016/S0010-2180(97)00295-2
Jia Chiet Choo, E., Cheng, X., Kiat Ng, H., Gan, S., and Scribano, G. (2022). Development and validation of a new n-dodecane-n-butanol-PAH reduced mechanism under diesel engine-relevant conditions. Fuel 319, 123829. doi:10.1016/J.FUEL.2022.123829
Kéromnès, A., Metcalfe, W. K., Heufer, K. A., Donohoe, N., Das, A. K., Sung, C. J., et al. (2013). An experimental and detailed chemical kinetic modeling study of hydrogen and syngas mixture oxidation at elevated pressures. Combust. Flame 160, 995–1011. doi:10.1016/j.combustflame.2013.01.001
Kong, S. C., Sun, Y., and Rietz, R. D. (2007). Modeling diesel spray flame liftoff, sooting tendency, and NOx emissions using detailed chemistry with phenomenological soot model. J. Eng. Gas Turbines Power 129 (1), 245–251. doi:10.1115/1.2181596
Kozubková, M., Kozubek, E., Nevrlý, V., Bitala, P., Štěpánek, O., Dlabka, J., et al. (2012). “The effect of nitrogen and argon dilution on methane oxidation in laminar flames,” in Procedia eng. (Amsterdam, Netherlands: Elsevier Ltd), 1826–1839. doi:10.1016/j.proeng.2012.07.578
Lee, J. G., and Santavicca, D. A. (2003). Experimental diagnostics for the study of combustion instabilities in lean premixed combustors. J. Propuls. Power 19, 735–750. doi:10.2514/2.6191
Leung, K. M., Lindstedt, R. P., and Jones, W. P. (1991). A simplified reaction mechanism for soot formation in nonpremixed flames. Combust. Flame 87 (3–4), 289–305. doi:10.1016/0010-2180(91)90114-Q
Li, Z., Amin, H. M. F., Liu, P., Wang, Y., Chung, S. H., and Roberts, W. L. (2018). Effect of dimethyl ether (DME) addition on sooting limits in counterflow diffusion flames of ethylene at elevated pressures. Combust. Flame 197, 463–470. doi:10.1016/j.combustflame.2018.09.003
Liaquat, A. M., Kalam, M. A., Masjuki, H. H., and Jayed, M. H. (2010). Potential emissions reduction in road transport sector using biofuel in developing countries. Atmos. Environ. 44, 3869–3877. doi:10.1016/j.atmosenv.2010.07.003
Liu, F., He, X., Ma, X., Zhang, Q., Thomson, M. J., Guo, H., et al. (2011). An experimental and numerical study of the effects of dimethyl ether addition to fuel on polycyclic aromatic hydrocarbon and soot formation in laminar coflow ethylene/air diffusion flames. Combust. Flame 158, 547–563. doi:10.1016/j.combustflame.2010.10.005
McEnally, C. S., and Pfefferle, L. D. (2007). The effects of dimethyl ether and ethanol on benzene and soot formation in ethylene nonpremixed flames. Proc. Combust. Inst. 31, 603–610. doi:10.1016/j.proci.2006.07.005
McEnally, C. S., Schaffer, A. M., Long, M. B., Pfefferle, L. D., Smooke, M. D., Colket, M. B., et al. (1998). Computational and experimental study of soot formation in a coflow, laminar ethylene diffusion flame. Symp. (Int.) Combust. 26.
Metcalfe, W. K., Burke, S. M., Ahmed, S. S., and Curran, H. J. (2013). A hierarchical and comparative kinetic modeling study of C 1 − C 2 hydrocarbon and oxygenated fuels. Int. J. Chem. Kinet. 45, 638–675. doi:10.1002/kin.20802
Miller, J. A., and Melius, C. F. (1992). Kinetic and thermodynamic issues in the formation of aromatic compounds in flames of aliphatic fuels. Combust. Flame 91, 21–39. doi:10.1016/0010-2180(92)90124-8
Pang, K. M., Jangi, M., Bai, X.-S., and Schramm, J. (2014). Investigation of chemical kinetics on soot formation event of n-heptane spray combustion. SAE Tech. Pap. doi:10.4271/2014-01-1254
Pang, K. M., Jangi, M., Bai, X.-S., and Schramm, J. (2015). Evaluation and optimisation of phenomenological multi-step soot model for spray combustion under diesel engine-like operating conditions. Combust. Theory Model. 19 (3), 279–308. doi:10.1080/13647830.2015.1019929
Pang, K. M., Ng, H. K., and Gan, S. (2012). Simulation of temporal and spatial soot evolution in an automotive diesel engine using the Moss-Brookes soot model. Energy Convers. Manag. 58, 171–184. doi:10.1016/J.ENCONMAN.2012.01.015
Panoutsos, C. S., Hardalupas, Y., and Taylor, A. M. K. P. (2009). Numerical evaluation of equivalence ratio measurement using OH* and CH* chemiluminescence in premixed and non-premixed methane-air flames.
Pope, C. A., and Dockery, D. W. (2006). Health effects of fine particulate air pollution: lines that connect. J. Air & Waste Manag. Assoc. 56, 709–742. doi:10.1080/10473289.2006.10464485
Roper, F. G. (1977). The prediction of laminar jet diffusion flame sizes: Part I. Theoretical model. Combust. Flame 29 (C), 219–226. doi:10.1016/0010-2180(77)90112-2
Sardeshmukh, S., Bedard, M., and Anderson, W. (2017). The use of OH* and CH* as heat release markers in combustion dynamics. doi:10.1177/1756827717718483
Serwin, M., and Karataş, A. E. (2021). Effects of oxygen on soot formation in laminar co-flow flames of binary mixtures of ethane, DME, and oxygen. Combust. Flame 229, 111413. doi:10.1016/j.combustflame.2021.111413
Sikarwar, V. S., Zhao, M., Fennell, P. S., Shah, N., and Anthony, E. J. (2017). Progress in biofuel production from gasification. Prog. Energy Combust. Sci. 61, 189–248. doi:10.1016/j.pecs.2017.04.001
Sirignano, M., Salamanca, M., and D’Anna, A. (2014). The role of dimethyl ether as substituent to ethylene on particulate formation in premixed and counter-flow diffusion flames. Fuel 126, 256–262. doi:10.1016/j.fuel.2014.02.039
Vandsburger, U., Kennedy, I., and Glassman, I. (1984). Sooting counterflow diffusion flames with varying oxygen index. Combust. Sci. Technol. 39 (1–6), 263–285. doi:10.1080/00102208408923792
Vishwanathan, G., and Reitz, R. D. (2010). Development of a practical soot modeling approach and its application to low-temperature diesel combustion. Combust. Sci. Technol. 182 (8), 1050–1082. doi:10.1080/00102200903548124
Wen, Z., Yun, S., Thomson, M. J., and Lightstone, M. F. (2003). Modeling soot formation in turbulent kerosene/air jet diffusion flames. Combust. Flame 135 (3), 323–340. doi:10.1016/S0010-2180(03)00179-2
World Health Organization (2022). World health statistics 2022: monitoring health for the SDGs, sustainable development goals. Geneva: World Health Organization. Licence: CC BY-NC-SA 3.0 IGO.
Wu, C. H., and Kern, R. D. (1987). Shock-tube study of allene pyrolysis. J. Phys. Chem. 91, 6291–6296. doi:10.1021/j100308a042
Ying, W., Longbao, Z., and Hewu, W. (2006). Diesel emission improvements by the use of oxygenated DME/diesel blend fuels. Atmos. Environ. 40, 2313–2320. doi:10.1016/j.atmosenv.2005.12.016
Yoon, S. S., Anh, D. H., and Chung, S. H. (2008). Synergistic effect of mixing dimethyl ether with methane, ethane, propane, and ethylene fuels on polycyclic aromatic hydrocarbon and soot formation. Combust. Flame 154, 368–377. doi:10.1016/j.combustflame.2008.04.019
Appendix
Chemical mechanisms for flame heat release (OH* and CH*).
Chemical reactions and their rate parameters used for producing OH* and CH* in the Mech_56.54 model shown in Table A1.

TABLE A1. Chemical mechanisms used for OH* and CH* in Mech_56.54.
Nomenclature
Keywords: biofuel, co-flow diffusion flame, dimethyl ether, heat release rate, soot emissions
Citation: Abu Saleh A, Hughes KJ, Hargrave G and Yuan R (2024) Feasibility on equivalence ratio measurement via OH*, CH*, and C2* chemiluminescence and study of soot emissions in co-flow non-premixed DME/C1–C2 hydrocarbon flames. Front. Fuels. 1:1296502. doi: 10.3389/ffuel.2023.1296502
Received: 18 September 2023; Accepted: 27 November 2023;
Published: 08 January 2024.
Edited by:
Leszek M. Chybowski, Maritime University of Szczecin, PolandReviewed by:
Saravanan Balusamy, Indian Institute of Technology Hyderabad, IndiaKumaran Kannaiyan, Guangdong Technion-Israel Institute of Technology (GTIIT), China
Copyright © 2024 Abu Saleh, Hughes, Hargrave and Yuan. This is an open-access article distributed under the terms of the Creative Commons Attribution License (CC BY). The use, distribution or reproduction in other forums is permitted, provided the original author(s) and the copyright owner(s) are credited and that the original publication in this journal is cited, in accordance with accepted academic practice. No use, distribution or reproduction is permitted which does not comply with these terms.
*Correspondence: Ruoyang Yuan, cnVveWFuZy55dWFuQHNoZWZmaWVsZC5hYy51aw==