 Shane Kosir
 John Feldhausen1
 David Bell
 Randall Boehm
 Joshua Heyne
- 1Bioproducts, Sciences, and Engineering Laboratory, School of Engineering and Applied Science, Washington State University, Richland, WA, United States
- 2Pacific Northwest National Laboratory, Richland, WA, United States
Olefins, a common intermediate from biomass conversion processes, are undesirable in jet fuel because of their poor thermal stability. This paper presents an approach for olefin quantitation using 2D gas chromatography coupled with vacuum ultraviolet spectroscopy. Principal component analysis was used to reduce the dimensionality of the spectroscopic data from a highly olefinic fuel intermediate. A principal component template was created that enabled olefin quantitation, which was compared to the existing GCxGC-VUV approach from the literature. The principal component method was able to identify and quantify trace amounts of cyclodienes, which were present at only 0.01 wt% in the fuel sample. The principal component approach also identifies species that fall outside of the GCxGC template. For instance, quantitation with the literature method resulted in an olefin concentration of 0.95 times that of the principal component method due to olefins falling outside of the expected GCxGC regions. The principal component results were compared with 13C and 1H NMR data, which confirmed that the fuel had a high concentration of olefins and alkanes with little aromatic content.
1 Introduction
Sustainable aviation fuel (SAF) represents the only near-term solution to reducing emissions associated with commercial air travel (Staples et al., 2018). SAF represents a subset of alternative jet fuel that, in addition to being from a non-petroleum source, produces fewer CO2 and particulate matter (PM) emissions compared to conventional jet fuel (Kosir et al., 2019). Olefins are a common product of processes relevant to SAF, including gasification, deoxygenation, and fermentation (Zacharopoulou and Lemonidou, 2018). Olefins are generally limited to less than 1% in jet fuel (ASTM D7566, 2022) because of their poor thermal stability, which can result in the formation of coke and gum. Methylindene blended at 3% in synthetic paraffinic kerosene (SPK) exhibited nitrile rubber O-ring swelling less than conventional jet fuel, which raises O-ring swell concerns (Graham et al., 2011). Additional internal O-ring testing indicates that olefins have low O-ring swell, similar to their saturated counterparts. It follows that the accurate detection of olefins in SAF is necessary for safe aircraft operation.
The olefin detection method specified in ASTM D7566 is the bromine index (ASTM D2710, 2020), which requires up to ∼12 mL of fuel and provides no information about the nature of the olefins. Vacuum ultraviolet spectroscopy (VUV) can potentially provide more information about the olefins by providing unique spectra for hydrocarbon classes (Schug et al., 2014) while using as low as ∼1 mL of fuel when coupled with gas chromatography (GC). Such low-volume olefin quantitation constitutes Tier α prescreening, which can save fuel producers significant production costs by detecting promising SAF candidates at early stages and helping to make process refinements (Yang et al., 2021). For reference, Tier 1 and 2 testing following ASTM D4054 requires approximately 20–100 gal of fuel. Currently, ASTM D8071 is the only approved method for olefin quantitation using vacuum ultraviolet spectroscopy (ASTM D8071, 2021). It uses a 1D GC-VUV configuration and is geared toward gasoline samples. The identity of the measured VUV spectra is compared against a reference VUV library, with up to three coeluting species considered simultaneously. Extension to 2D GCxGC-VUV offers the advantage of improved separation resolution. The literature for GCxGC-VUV olefin quantitation, hereafter referred to as the deconvolution method, uses a single reference spectrum to represent each hydrocarbon class (Lelevic et al., 2021). Deconvolution is then carried out by assuming that the resulting spectrum is a linear combination of two reference spectra. Olefin quantitation is performed by taking the olefin/non-olefin proportion in each template region and multiplying it by the VUV relative response factors.
Principal component analysis (PCA), a technique for reducing the dimensionality of data, is applied to VUV spectra in this paper. PCA produces vectors that result in maximum variance in an N-dimensional feature space. These vectors are called principal components (PCs), which can be constructed to align with important features and neglect unimportant features. The original data can then be transformed and manipulated in the PC space. In the case of VUV spectra, the features being reduced are the number of wavelengths required to describe spectral features. As shown in the Results section, two PCs can describe 82% of the variance for absorbances across 3240 wavelengths spanning from 125 nm to 240 nm. A PC template, which can be used in place of a GCxGC template, was created using PCs. Several recent papers have applied PCA to VUV spectra (Santos et al., 2018; Roberson and Goodpaster, 2019; Roberson et al., 2020; Tanen et al., 2020; Cruse and Goodpaster, 2021); however, this paper represents the first application of PCA to fuel templating to the best of the authors’ knowledge.
The method developed in this paper uses PCA to identify and quantify olefins and other hydrocarbons without the use of a GCxGC template. The objective of this work is to apply PC quantitation to a highly olefinic fuel intermediate. Deciphering olefins from cyclic molecules is a challenge for mass spectrometry, which is a common detector for GC systems. The PC results will be compared to the deconvolution method (Lelevic et al., 2021) which relies on a GCxGC template and spectral deconvolution as described above. The PC results generated will also be validated against 13C and 1H NMR, which is a common method for hydrocarbon quantitation.
2 Materials and methods
2.1 Principal component quantitation
FID and VUV data were collected using previously published methods (Feldhausen et al., 2022; Heyne et al., 2022). A highly olefinic fuel intermediate from an anonymous source was screened in this paper. The PCA model was generated using 298 VUV spectra from 12 different hydrocarbon groups that did not contain heteroatoms. The spectra were first interpolated so that the absorbances were all at the same wavelengths. The spectra were smoothed using the SciPy Savitzky-Golay filter with a polynomial order of three and a window length of 324. Each spectrum was then normalized by the sum of its absorbances. The PCA model was trained using the Scikit-learn PCA package with four PCs in total.
The screening VUV spectra had to be aligned with the FID peaks, which tend to drift behind their respective VUV spectra, as depicted in Supplementary Figure S1. Alignment was accomplished by finding the local maxima of VUV absorbance, and then aligning them with their respective FID peaks as identified by the FID software. The VUV data, which has retention times associated with two columns, RT1 and RT2, was converted into a 2D matrix using the NumPy histogram2d package. VUV maxima were then detected using the SciPy maximum filter package with a footprint of 100. VUV spectra were integrated from 130 to 135 nm to compare the peak sizes on an equal basis. This range was selected because hydrocarbon groups have VUV features of similar absorbances (Lelevic et al., 2021).
The VUV-FID phase shift was calculated as follows:
Here,
2.2 Reference GCxGC-VUV quantitation
The PC method presented in this work will be compared against the existing approach that is based on the deconvolution procedure presented in the literature [3,4,8]. The method requires importing the GCxGC hydrocarbon group-type template from ChromSpace into Python and overlaying the template onto the VUV dataset so that each of the VUV timesteps can be classified into a corresponding hydrocarbon group. Because olefins most commonly elute within the iso-alkane and cycloalkane regions, these regions undergo further olefinic analysis while the other regions rely solely on GC-FID data for quantitation. The olefinic content is determined by resolving the linear combination of a representative olefin spectrum and a representative saturate spectrum. With a ratio of olefins to saturates, a weighting can then be applied to the GC-FID group result for a final mass-based olefinic quantitation.
2.3 NMR quantitation
13C and 1H NMR spectra were acquired at 125.65 and 499.67 MHz, respectively, on an Agilent 600 MHz instrument at room temperature in 5 mm NMR tubes. Quantitative 13C NMR spectra were acquired over a spectral width of 250 ppm, applying acquisition and relaxation delay times of 3 and 5 s, respectively. 1024 scans were collected and combined. Quantitative 1H spectra were obtained using acquisition and relaxation delays of 3 and 8 s, respectively. 128 spectra were collected and combined. All chemical shifts were referenced to the CDCl3 solvent (77.16 ppm for 13C, and 7.26 ppm for 1H). The 13C test mixture was prepared by mixing 0.40 mL of the sample with 0.15 mL of CDCl3 (containing 0.05 M chromium (III) acetylacetonate, added to reduce T1 relaxation time), and the 1H test mixture was prepared by mixing 0.05 mL of the sample with 0.75 mL of CDCl3. The CDCl3 and chromium (III) acetylacetonate were obtained from Sigma-Aldrich. The NMR spectra were processed using the MestReNova 10.0.2 software package. An automatic baseline correction and phase correction were performed before further data analysis.
3 Results
3.1 Principal component template
A PC template was created by plotting PC1 versus PC2, as shown in Figure 1. PC1 and PC2 comprise 66% and 16% of the explained variance in the VUV spectra, respectively. PC3 and PC4 have been omitted because they offer only a marginal improvement, capturing 7% and 4%, respectively, of the explained variance in the VUV spectra. Six distinct regions can be identified, including aromatics, diaromatics, conjugated dienes, cyclodienes, olefins, and alkanes. The olefin region comprises linear alkenes, branched alkenes, cycloalkenes, and unconjugated dienes. The alkane region comprises n-alkanes, iso-alkanes, monocycloalkanes, and dicycloalkanes. In general, species are more saturated at higher values of PC1. Linear alkenes progress from cis-2-pentene to 1-tetradecene as PC1 increases, indicating that longer linear alkene spectra behave similarly to alkanes. This can be explained by a dilution of the double bond as the length of the aliphatic chain increases. The meaning of the positive and negative PC values are discussed in the following paragraphs.
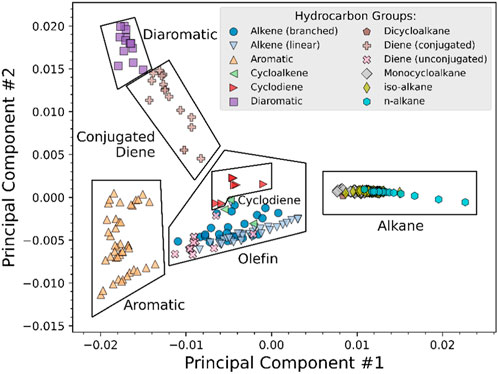
FIGURE 1. Principal component template generated using PC1 and PC2, with template regions in boxes. Specific hydrocarbon groups are listed in the legend.
The loadings of each principal component were plotted against their respective wavelengths to determine which spectral features the principal components align with, as shown in Figure 2. Each PC has a unique set of loadings associated with each feature. Once the loadings are determined, the PC is calculated as a linear combination of the original variables:

FIGURE 2. Loadings for PC1 and PC2 across the VUV wavelengths. Large positive loadings indicate a strong positive correlation between a principal component and a wavelength, and vice versa for large negative loadings.
Here,
PC1 has positive loadings below 160 nm and negative loadings above 160 nm. This explains why alkanes, which have spectral features at low wavelengths, have positive PC1 values. The opposite is true for aromatics, which have spectral features at 180 nm. PC2 crosses the x-axis at 200 nm, with negative loadings at 160–200 nm and positive loadings at 200–240 nm. Aromatics have spectral features at 180 nm, while diaromatics have spectral features at 220 nm. It follows that aromatics and diaromatics diverge over PC2 in Figure 1, with aromatics exhibiting negative PC2 values and diaromatics exhibiting positive PC2 values. It should be noted that while spectra can readily be converted to PCs, the opposite is not typically true. Unless the nonzero loadings of a PC are confined to a narrow wavelength range, a given PC has multiple possible spectra. This is evidenced by the aromatic/diaromatic divergence over PC2 in Figure 1.
3.2 Olefin quantitation—deconvolution method
The GCxGC template used in this study is shown in Figure 3, with the hydrocarbon groups called out in the legend. In general, the volatility of species increases from left to right and polarity increases from bottom to top. GCxGC-VUV analysis using the deconvolution method for the fuel intermediate determined that it consists of 93.4 wt% olefins, which is 0.95 times that of the PC method. This is likely due to olefins eluting in stencil regions other than those that were assigned to olefins, such as the n-alkane regions. The remaining species are as follows: 2.8 wt% iso-alkanes, 0.9 wt% monocycloalkanes, and 0.1 wt% dicycloalkanes. 2.8 wt% of the species were not identified because they fell outside of the GCxGC template regions.

FIGURE 3. GCxGC template used for the deconvolution method, with hydrocarbon regions indicated by color.
3.3 Olefin quantitation—Principal component method
PC olefin analysis for the fuel intermediate is depicted in Figures 4A, B isolates the trace species to give a better sense of their location. After the signal-to-noise filter was applied, 75.0 wt% of the spectra remained. The filtered spectra were 98.3 wt% olefins, 1.1 wt% alkanes, 0.01 wt% cyclodienes, and 0.5 wt% unmatched spectra. Many alkane peaks fall outside of the GCxGC template at RT1 ≈ 1,000 s. 99.5 wt% of the spectra were matched, indicating that the signal-to-noise processing was effective at removing noisy spectra.

FIGURE 4. (A) (left): Quantitation for the fuel intermediate, with larger FID peak areas represented by darker circles. The GCxGC template is overlayed for reference. (B) (right): Quantitation for the fuel intermediate with uniform shading for only the trace species. The GCxGC template is overlayed for reference.
Representative n-alkane, olefin, and cyclodiene spectra from this analysis are shown in Figure 5. As expected, the alkane spectrum has a large feature below 160 nm, and the olefin spectrum has a characteristic hump at 190 nm. The cyclodiene spectrum is right-shifted to 200 nm compared to the olefin spectrum, as expected from its higher PC2 value. The cyclodiene spectrum represented only 0.01 wt% of the sample, illustrating the ability of the PC method to resolve trace olefin peaks. The unmatched spectra are plotted over the PC template in Supplementary Figure S2. Most of the spectra fall below or between the olefin and alkane regions.
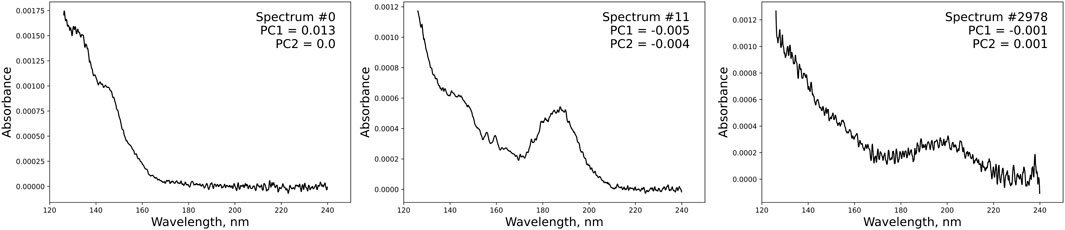
FIGURE 5. Representative alkane (left), olefin (middle), and cyclodiene (right) spectra from Figure 4A.
3.4 Olefin quantitation—NMR
As a means of validating the quantitative GCxGC-VUV analysis of the fuel intermediate investigated in this study, the mixture was analyzed via quantitative 13C and 1H NMR (see Supplementary Figure S3). By integrating key regions of each spectrum and presenting these values as a proportion of the whole, the mol% of hydrogen and carbon accounted for by key functional group types was determined. The values obtained are summarized in Table 1. This data suggests that the fuel intermediate mixture is a pure hydrocarbon (i.e., containing negligible quantities of common heteroatoms), contains little aromatic content, and has a high proportion of C-C double bonds.
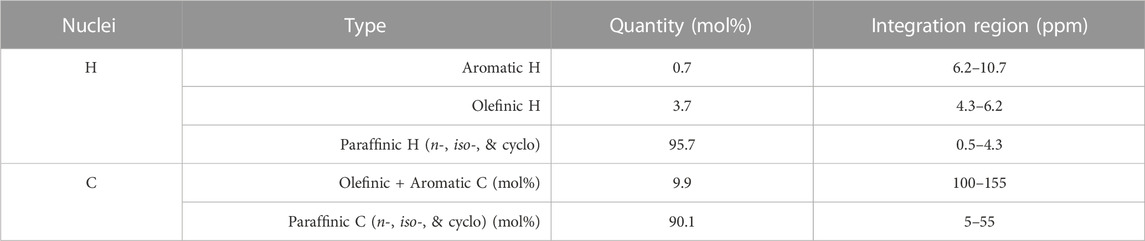
TABLE 1. Quantitative13C and 1H NMR data for key functional group types of the fuel intermediate analyzed in this study.
4 Discussion
The PC quantitation approach presented in this paper represents an alternative approach to olefin quantitation that relies on a PC template rather than a GCxGC template. One outcome is that quantitation with the GCxGC template resulted in an olefin concentration of 0.95 times that of the principal component method due to olefins falling outside of the expected GCxGC regions. The ability of the PC method to detect and quantify species that fell outside of the GCxGC template regions can help with template adjustment. In Supplementary Figure S2, unmatched VUV spectra were readily identified for further analysis. Other merits of the PC approach are: 1) it allows for visualization of VUV spectra on a timestep basis, 2) it has more nuanced hydrocarbon identification, and 3) it doesn’t rely on a single seed spectrum for quantitation. The trace cyclodiene detection depicted in Figure 4B illustrates merit #2. These cyclodienes, which were present at 0.01 wt%, were not detected by the deconvolution method.
One shortcoming of the PC approach is that it is currently unable to perform spectral deconvolution. One possible approach for PC deconvolution is to take the distance of a spectrum from the centroids of PC regions. It remains to be seen whether this would result in linear behavior in the PC space as the relative proportion of spectra is varied. Another possibility is that VUV spectra could be identified using the PC approach then deconvolution could be performed using the literature methods (ASTM D8071, 2021; Lelevic et al., 2021) to handle coelution. The PC approach could also benefit from coupling with the GCxGC template to enable more nuanced identification of hydrocarbon groups that are not present in the PC template (e.g., iso-alkanes, monocycloalkanes, and dicycloalkanes). Finally, the limits of detection of the VUV detector affect the comprehensiveness of this analysis. As mentioned in Section 3.3, 25 wt% of the spectra were not included in the quantitation because they did not meet the signal-to-noise criteria. Whether this is due to detector limits or coelution, coupling with the GCxGC template can potentially overcome this shortcoming.
Both 13C and 1H NMR agree with the GCxGC-VUV data qualitatively because they indicate that there is a significant amount of olefins and alkanes present in the sample. Direct comparison of the GCxGC-VUV with the NMR data is not possible because they are reported on a molecular and atomic basis, respectively. The 1H NMR picked up 0.7 mol% of aromatics, while the GCxGC-VUV did not detect any aromatics. It is unlikely that the unmatched spectra in Supplementary Figure S2 are aromatics, given that they are closer to the olefin and alkane regions. Additionally, species from the sample did not elute in the GCxGC template regions associated with aromatics, as is evident from a comparison of Figures 3, 4. The aromatics shown in Table 1 merit further study. A comparison study should be carried out in the future between the olefin quantitation method presented here and the bromine index (ASTM D2710, 2020) for validation purposes. Additional SAF intermediates should also be tested to ensure that the PC approach is valid over a wide composition range.
Data availability statement
The datasets presented in this article are not readily available because the source preferred to stay anonymous. Requests to access the datasets should be directed to SK, c2hhbmUua29zaXJAd3N1LmVkdQ==.
Author contributions
SK, JF, and JH conceptualization and project oversight. DB and DC contributed to the experimental investigation. SK and JF did the methodology, formal analysis, and data curation. SK, JF, DB, and RB writing, reviewing, and editing. All authors contributed to the article and approved the submitted version.
Funding
The authors would like to acknowledge funding from the U.S. Federal Aviation Administration Office of Environment and Energy through ASCENT, the FAA Center of Excellence for Alternative Jet Fuels and the Environment, project 65 through FAA Award 13-CAJFE-UD-026 (PI: JH) under the supervision of Dr. Anna Oldani. Additional support for this paper was provided by US DOE BETO through subcontract PO 2196073.
Conflict of interest
The authors declare that the research was conducted in the absence of any commercial or financial relationships that could be construed as a potential conflict of interest.
Publisher’s note
All claims expressed in this article are solely those of the authors and do not necessarily represent those of their affiliated organizations, or those of the publisher, the editors and the reviewers. Any product that may be evaluated in this article, or claim that may be made by its manufacturer, is not guaranteed or endorsed by the publisher.
Author disclaimer
Any opinions, findings, conclusions, or recommendations expressed in this material are those of the authors and do not necessarily reflect the views of the FAA or other sponsors.
Supplementary material
The Supplementary Material for this article can be found online at: https://www.frontiersin.org/articles/10.3389/ffuel.2023.1246950/full#supplementary-material
References
ASTM D2710 (2020). Standard test method for bromine index of petroleum hydrocarbons by electrometric titration. West Conshohocken: ASTM. doi:10.1520/D2710-20
ASTM D7566 (2022). Standard specification for aviation turbine fuel containing synthesized hydrocarbons. West Conshohocken: ASTM. doi:10.1520/D1655-10.2
ASTM D8071 (2021). Standard test method for determination of hydrocarbon group types and select hydrocarbon and oxygenate compounds in automotive spark-ignition engine fuel using gas chromatography with vacuum ultraviolet absorption spectroscopy detection (GC-VUV). West Conshohocken: ASTM. doi:10.1520/D8071-21
Cruse, C. A., and Goodpaster, J. V. (2021). A systematic study of the absorbance of the nitro functional group in the vacuum UV region. Anal. Chim. Acta 1185, 339042. doi:10.1016/j.aca.2021.339042
Feldhausen, J., Bell, D. C., Yang, Z., Faulhaber, C., Boehm, R., and Heyne, J. (2022). Synthetic aromatic kerosene property prediction improvements with isomer specific characterization via GCxGC and vacuum ultraviolet spectroscopy. Fuel 326, 125002. doi:10.1016/j.fuel.2022.125002
Graham, J. L., Rahmes, T. F., Kay, M. C., Belières, J.-P., Kinder, J. D., Millett, S. A., et al. (2011). Impact of alternative jet fuel and fuel blends on non-metallic materials used in commercial aircraft fuel systems. Federal Aviation Administration report.
Heyne, J., Bell, D., Feldhausen, J., Yang, Z., and Boehm, R. (2022). Towards fuel composition and properties from Two-dimensional gas chromatography with flame ionization and vacuum ultraviolet spectroscopy. Fuel 312, 122709. doi:10.1016/j.fuel.2021.122709
Kosir, S., Behnke, L., Heyne, J., Stachler, R., Flora, G., Zabarnick, S., et al. (2019). “Improvement in jet aircraft operation with the use of high-performance drop-in fuels,” in AIAA scitech 2019 forum (San Diego, California: AIAA). doi:10.2514/6.2019-0993
Lelevic, A., Geantet, C., Moreaud, M., Lorentz, C., and Souchon, V. (2021). Quantitative analysis of hydrocarbons in gas oils by two-dimensional comprehensive gas chromatography with vacuum ultraviolet detection. Energy & Fuels 35, 13766–13775. doi:10.1021/acs.energyfuels.1c01910
Roberson, Z. R., and Goodpaster, J. V. (2019). Differentiation of structurally similar phenethylamines via gas chromatography–vacuum ultraviolet spectroscopy (GC–VUV). Forensic Chem. 15, 100172. doi:10.1016/j.forc.2019.100172
Roberson, Z. R., Gordon, H. C., and Goodpaster, J. V. (2020). Instrumental and chemometric analysis of opiates via gas chromatography–vacuum ultraviolet spectrophotometry (GC-VUV). Anal. Bioanal. Chem. 412, 1123–1128. doi:10.1007/s00216-019-02337-5
Santos, I. C., Smuts, J., Choi, W.-S., Kim, Y., Kim, S. B., and Schug, K. A. (2018). Analysis of bacterial FAMEs using gas chromatography – vacuum ultraviolet spectroscopy for the identification and discrimination of bacteria. Talanta 182, 536–543. doi:10.1016/j.talanta.2018.01.074
Schug, K. A., Sawicki, I., Carlton, D. D., Fan, H., McNair, H. M., Nimmo, J. P., et al. (2014). Vacuum ultraviolet detector for gas chromatography. Anal. Chem. 86, 8329–8335. doi:10.1021/ac5018343
Staples, M. D., Malina, R., Suresh, P., Hileman, J. I., and Barrett, S. R. H. (2018). Aviation CO2 emissions reductions from the use of alternative jet fuels. Energy Policy 114, 342–354. doi:10.1016/j.enpol.2017.12.007
Tanen, J. L., Lurie, I. S., and Marginean, I. (2020). Gas chromatography with dual cold electron ionization mass spectrometry and vacuum ultraviolet detection for the analysis of phenylethylamine analogues. Forensic Chem. 21, 100281. doi:10.1016/j.forc.2020.100281
Yang, Z., Kosir, S., Stachler, R., Shafer, L., Anderson, C., and Heyne, J. S. (2021). A GC×GC Tier α combustor operability prescreening method for sustainable aviation fuel candidates. Fuel 292, 120345. doi:10.1016/j.fuel.2021.120345
Keywords: olefin quantitation, principal component analysis, vacuum ultraviolet spectroscopy, nuclear magnetic resonance spectroscopy, sustainable aviation fuel, gas chromatography
Citation: Kosir S, Feldhausen J, Bell D, Cronin D, Boehm R and Heyne J (2023) Quantitation of olefins in sustainable aviation fuel intermediates using principal component analysis coupled with vacuum ultraviolet spectroscopy. Front. Fuels. 1:1246950. doi: 10.3389/ffuel.2023.1246950
Received: 25 June 2023; Accepted: 22 November 2023;
Published: 01 December 2023.
Edited by:
Toufiq Reza, Florida Institute of Technology, United StatesReviewed by:
Bheru Lal Salvi, Maharana Pratap University of Agriculture and Technology, IndiaZia Haq, United States Department of Energy (DOE), United States
Copyright © 2023 Kosir, Feldhausen, Bell, Cronin, Boehm and Heyne. This is an open-access article distributed under the terms of the Creative Commons Attribution License (CC BY). The use, distribution or reproduction in other forums is permitted, provided the original author(s) and the copyright owner(s) are credited and that the original publication in this journal is cited, in accordance with accepted academic practice. No use, distribution or reproduction is permitted which does not comply with these terms.
*Correspondence: Shane Kosir, c2hhbmUua29zaXJAd3N1LmVkdQ==