 James R. Kerr
 Daniel P. Zielinski
 R. Andrew Goodwin
 Christopher M. Holbrook
 Robert L. McLaughlin
- 1Department of Integrative Biology, University of Guelph, Guelph, ON, Canada
- 2Great Lakes Fishery Commission, Ann Arbor, MI, United States
- 3Environmental Laboratory, U.S. Army Engineer Research and Development Center, Portland, OR, United States
- 4U.S. Geological Survey, Great Lakes Science Center, Hammond Bay Biological Station, Millersburg, MI, United States
Identifying commonalities in how fish navigate rivers near infrastructure will enhance water operations and design by improving our ability to predict engineering outcomes (e.g., barrier construction/removal, fish passage installation) in novel settings before the cost of real-world implementation. Evidence from intermediate-scale computer models (time scales of minutes to days and spatial scales <2 km) suggests that fish movement behavior in rivers is frequently governed by responses to one or more of the following hydrodynamic features: (1) flow direction (i.e., rheotaxis), (2) flow velocity magnitude, (3) turbulence, and (4) depth, plus (5) the integration of information over recent time periods (i.e., memory/experience). However, the lack of consistent modeling approaches, infrequent assessment of each response in isolation and combination, and a focus on a limited number of species means the generality of these responses is uncertain. We use a computer model, specifically a pattern-oriented modeling approach incorporating individual based models (IBMs), to apply responses to the four hydrodynamic features plus memory/experience in different combinations to study their value for reproducing the movement of an infrequently modeled species and lifestage, upriver migrating adult sea lamprey, Petromyzon marinus. The study site was the region downstream of the Sault Ste. Marie lock and dam complex located between Canada and the U.S.A on the St. Marys River joining Lake Superior and Lake Huron. Our analysis indicates that rheotaxis and a response to velocity magnitude as well as recent past experience improve sea lamprey spatio-temporal movement prediction compared to other, simpler forms of modeled behavior. Sea lamprey movement is also biased toward lower levels of turbulence (e.g., turbulent kinetic energy) or its precursor (i.e., the spatial gradient in water speed). A response to water depth was not found to be important, but the modeled domain was two-dimensional which limited our assessment. As similar responses to hydrodynamic features are found in very different fish, commonalities appear to underlie river navigation across a range of species and life stages that share the goal-oriented behavior of upriver and downriver movement. The systematic approach of our analysis highlights the accuracy trade-offs of each response, individually and in combination, that often accompany alternative behavioral formulations in a computer model of fish movement. The model structure provides a framework to which future findings from the analyses of additional species in different contexts can be added.
1 Introduction
Migratory movements of fishes in rivers can strongly influence ecosystem services (Almeida et al., 2023). Within their native ranges, migratory fishes are critical components of food webs, being predators (Ruaro et al., 2019) and prey (Lowery and Beauchamp, 2015), facilitating nutrient transfer that supports aquatic (Childress et al., 2014) and terrestrial (Payne and Moore, 2006; Levi et al., 2020) species, and increasing biodiversity (Tamario et al., 2019) and ecological resilience (Oliver et al., 2015). Migratory fishes are a crucial food source for millions of people (Ziv et al., 2011), and are economically and culturally important to commercial (Knapp et al., 2013), recreational (Stensland et al., 2021), and artisanal (Almeida et al., 2021) fisheries. Outside of their native ranges, migratory fishes can also have unwanted effects on ecosystem services, by reducing native biodiversity and altering food web structure (Marsden and Siefkes, 2019; Marshall et al., 2019; Chick et al., 2020).
Greater understanding of the environmental stimuli and behaviors that influence the migratory movement patterns of fishes over intermediate scales is needed to support the conservation and management of freshwater ecosystems. We define intermediate spatial and temporal scales of movement as up to 2 km and spanning minutes to days, respectively (Zielinski et al., 2024). Movement patterns at these scales are generally the outcome of recent behavioral decisions in response to local environmental variability, predominantly hydrodynamics (e.g., Goodwin et al., 2023; Kerr et al., 2023), but also features such as variation in water temperature (e.g., Brosnan and Welch, 2020), semiochemicals (e.g., pheromones: Buchinger et al., 2015, alarm substances: Hume et al., 2020) and resource availability and intraspecific competition (Hansen and Closs, 2009). Greater understanding of movement at this scale is needed to help maintain and restore free movement of fish and nature-like ecosystem services in rivers that have been greatly altered by human actions (e.g., through water abstraction, channelization and damming) and in more pristine systems being pressured by human development. Specifically, intermediate scale models can be particularly useful for studying fish movement in and around river infrastructure (e.g., dams, hydropower facilities, water diversions) that can introduce complex hydraulic signatures that result in passage delays, diversion toward high mortality areas, or outright blockage of movement (Silva et al., 2018). Improved understanding of fish behavior in response to hydrodynamics introduced by infrastructure, or naturally occurring, is key in developing and evaluating management strategies to mitigate for impeded fish passage (i.e., designing fishways, managing flows, diversion techniques).
Over the past several decades, there has been considerable effort to model the movement behaviors used by migratory fishes at intermediate scales (Mawer et al., 2023a; Zielinski et al., 2024). These studies have typically combined individual based models (IBMs) with empirical data to investigate the decisions fish make in response to various environmental cues encountered (e.g., Benson et al., 2021; Kerr et al., 2023). Such models show great promise for understanding fish movement by identifying potential behaviors that would be difficult to isolate and systematically test empirically. Here, we refer to the Levitis et al. (2009) definition in which “behavior is the internally coordinated responses (actions or inactions) of [an organism] to internal and/or external stimuli.” To date, more than 30 IBMs have been developed to describe movement of riverine fishes at intermediate scales (Zielinski et al., 2024). Generally, these models simulate the movement of fish as the result of a suite of responses to hydrodynamic features including: (1) flow direction (i.e., rheotaxis), (2) flow velocity magnitude, (3) turbulence, and (4) depth. Additionally, more complex models have modified how the fish internally coordinates responses by integrating hydrodynamic information over recent time periods (i.e., memory/experience) (Goodwin et al., 2006, 2014; Padgett, 2020; Gisen et al., 2022; Goodwin et al., 2023). For example, alignment with or against the direction of the water flow vector, negative and positive rheotaxis, respectively, has been identified as important in almost all IBMs (Zielinski et al., 2024). Many of these models also indicate that swimming orientation and speed appear to be regulated by the magnitude of flow velocity (Goodwin et al., 2006, 2014; Gao et al., 2016; Tan et al., 2018; Zielinski et al., 2018; Zhu et al., 2021; Goodwin et al., 2023) and turbulence, or its hydraulic precursors (e.g., the spatial velocity gradient also referred to as the spatial gradient in water speed) (Goodwin et al., 2006; Gao et al., 2016; Tan et al., 2018; Padgett, 2020; Kulić et al., 2021; Zhu et al., 2021; Goodwin et al., 2023), with fish orienting toward a preferred value or range of each. Less frequently, hydrostatic pressure and water depth have been shown to be important, particularly in models in which fish are modulating their movement behaviors according to fluctuating physiochemical conditions (e.g., in estuaries) (Willis and Teague, 2014; Rossington and Benson, 2020; Benson et al., 2021; Gross et al., 2021a). In addition to momentary stimuli, models also suggest movement decisions can be modulated by comparisons of instantaneous environmental stimuli against what a fish has experienced in the past 2 s−4 h (Goodwin et al., 2006, 2014; Padgett, 2020; Gisen et al., 2022; Goodwin et al., 2023).
We build upon findings to date from the historical and review literature to further our understanding of the generality of fish responses to hydrodynamic features while navigating complex environments, especially those created by in-river structures. Generalization is important in science as it allows us to extend inferences reached for one species, ecological situation, and river system to other species, situations, or systems, rather than progressing on an ad hoc case-by-case basis (Fox, 2019). Identification of four hydraulic cues that fish frequently respond to plus the integration of memory/experience from previous studies is promising evidence that generalizations can be made. However, limitations with the existing work indicate that additional research is needed. First, most of the earlier studies did not systematically examine the contributions of individual responses in different combinations. Second, despite examining a wide variety of species and ecological situations, the current examples do not adequately cover a number of factors that can shape the movement ecology of fishes, such as diversity in evolutionary history, body form (e.g., sub-carangiform vs. anguilliform), modes of propulsion (e.g., caudal vs. paired and median fins), movement direction (e.g., up vs. downriver), water column use (bottom vs. near surface), and absolute (e.g., sub-meter scale vs. kilometer scale) and relative (to body size) spatial scale.
Lamprey (e.g., Lampetra spp. and Petromyzon marinus) are a group of fish that present a great opportunity to further assess the generality of the hydrodynamic response characteristics that we find in the historical and review literature. From a biological perspective, lamprey represent one of the most ancient group of vertebrates, having existed for over 360 million years and hence are a keystone organism for studying the origin and evolution of other fish species (Xu et al., 2016). Numerous lamprey species are anadromous, such as sea lamprey (Petromyzon marinus), or potadromous, such as European brook lamprey (Lampetra planeri), with adults migrating annually up rivers to spawn (Maitland, 2003). They also swim using anguilliform locomotion but are morphologically unique from other eel-like fishes in that they lack paired fins and can attach to hard surfaces using their oral disc to hold position and rest between intermittent bouts of locomotion (Kerr et al., 2015). From management and conservation perspectives, lamprey are also economically and ecologically important, performing valuable ecosystem functions within their native ranges, including being ecosystem engineers of gravel and fine sediment, a food source for predators, and, for migratory species, providing nutrient subsidies to riverine and adjacent terrestrial habitats (reviewed in Lucas et al., 2021). Outside their native range, lamprey species can be extremely damaging to native fisheries. For example, sea lamprey in the Laurentian Great Lakes contributed to the decimation of native fish populations and, as a result, have been the focus of a decades-long multi-million dollar bi-national control program (Siefkes, 2017). For certain species, such as sea lamprey, there is also a considerable pool of data on space use that has been collected to better understand the species' movement ecology and improve potential control methods, such as trapping migrating adults in large rivers (Bravener, 2011; Holbrook et al., 2015; Rous et al., 2017). One predictive model has been developed for migrating adult European river lamprey, Lampetra fluviatilis, in a small river system (mean wetted width: ca. 20 m), but the model did not consider the influence of turbulence and experience on movement patterns (Kerr et al., 2023).
We systematically tested in silico if the movement patterns of upstream migrating sea lamprey approaching a lock and dam complex in a large river system are best predicted by a subset or all of the responses to hydrodynamic features identified in earlier studies of migratory fish. Specifically, we used multiple IBMs to systematically assess whether: (1) response to flow direction (i.e., rheotaxis), (2) response to flow velocity magnitude, (3) response to turbulence, (4) response to depth, and (5) memory/experience of hydrodynamic features are important for reproducing the observed upriver movement pattern of sea lamprey as they approached infrastructure connecting two of the Laurentian Great Lakes. The systematic modeling approach we use to analyse fish responses to hydraulic conditions could easily be used to study other migratory species, identify both species-specific and shared behavioral responses to flow conditions, and ultimately inform fish passage designs that accommodate multiple species.
2 Methods
2.1 Study site
2.1.1 Overview
The study site was the region downstream of the Sault Ste. Marie lock and dam complex located on the St. Marys River joining Lake Superior and Lake Huron (Figure 1). The river separates Canada to the north and the United States of America to the south. The study site is heavily modified anthropogenically, with four active hydropower stations (north to south: Clergue, New Power Plant, Unit 10, and Edison), three functional navigation locks (Soo Locks, ~240 m long and 25 m wide each on the US side and a lock 77 m long and 15 m wide on the Canadian side), and a semi-natural compensation channel fed by sluice gates (Figure 1).
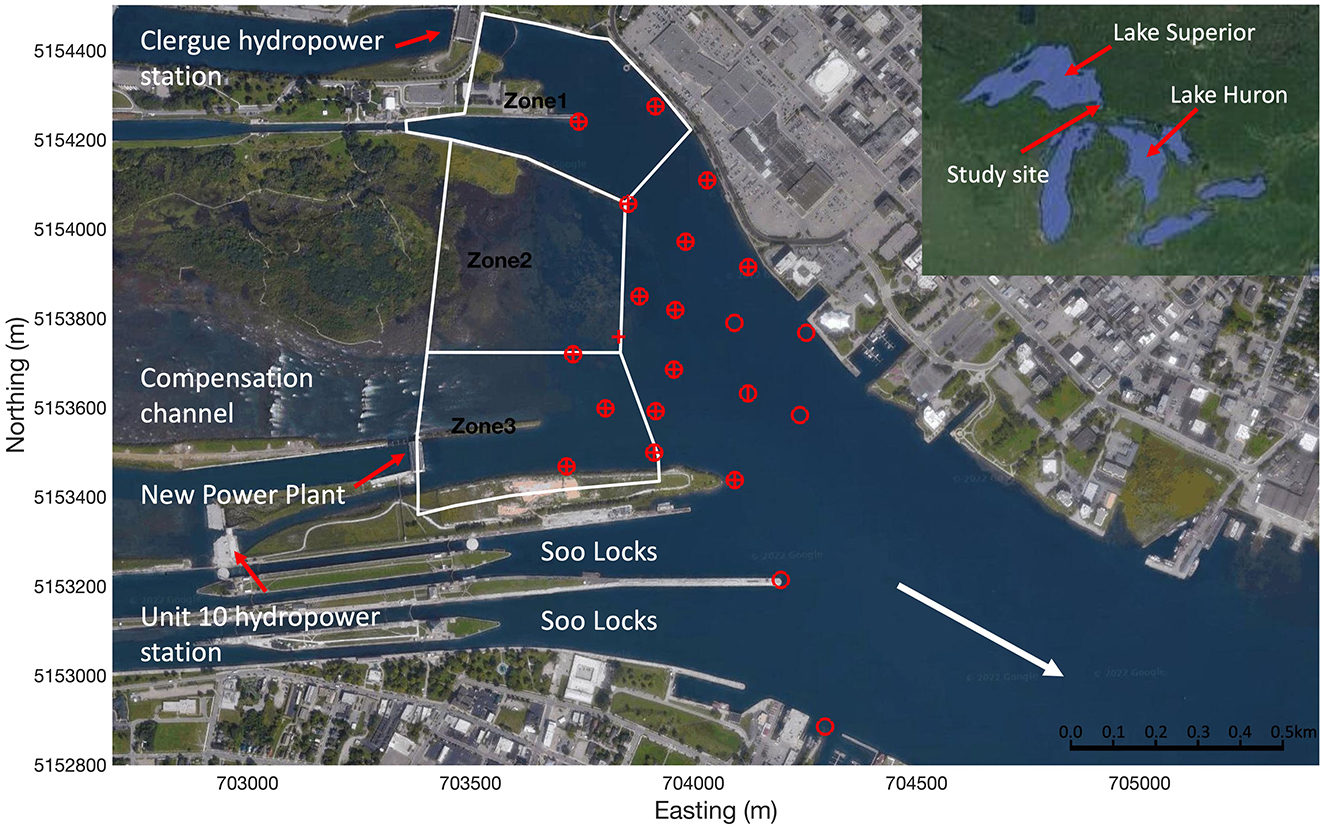
Figure 1. Aerial view of the Sault Ste. Marie lock and dam complex in the St. Marys River located between Canada and the U.S.A. within the Laurentian Great Lakes (inset). Acoustic telemetry hydrophone locations in 2010 (horizontal marker), 2011 (vertical marker), and 2012 (circular marker) are shown in red. The white arrow shows the direction of bulk flow. White polygons represent the zones of first approach to the lock and dam complex and were used to quantify route choice by the migrating sea lamprey. Map data © 2022 Google.
2.1.2 Fish telemetry
Adult sea lamprey (length: μ = 504 mm, range = 410–610 mm; mass: μ = 270 g, range = 131–498 g) were collected from traps in tributaries to northern Lake Huron (Cheboygan River) and Lake Michigan (Manistique River, Peshtigo River) and had either a V9-2H or V9P-2H (Innovasea, Nova Scotia, Canada) acoustic tag implanted (see Holbrook et al., 2016). The V9P-2H tags, of which only a limited number were used, incorporated pressure sensors which provided coarse resolution indication of swimming depth. Tagged sea lamprey were released at one of two locations: (1) at a narrow point in Munuscong Lake about 45–60 river kilometers (rkm) downstream (depending on route) of the dam and lock complex, and (2) in the North Channel north of St. Josephs Island about 35–48 rkm downstream (depending on route) of the dam and lock complex (Holbrook et al., 2016). Tagged sea lamprey were released in groups of 49–68 with roughly equal sex ratios at both locations on three dates during late spring 2010 (n = 300), 2011 (n = 398), and 2012 (n = 394) (Holbrook et al., 2016).
An array of autonomous VR2W acoustic telemetry receivers (Innovasea) were deployed to track the two-dimensional spatial-temporal upstream movement patterns of sea lamprey at the study site (Figure 1). More hydrophones were deployed further downstream in later years (n = 16, 17 and 21 in 2010–2012, respectively) (Figure 1) resulting in a slightly larger detection and tracking area for those years. All hydrophones were active at the site from mid-May till the end of July each year. During this time 139, 163 and 238 sea lamprey were detected in 2010, 2011, and 2012, respectively. Resource limitations and the large size and complexity of bathymetry at the site prohibited the use of three-dimensional acoustic telemetry but data from the V9P-2H tags indicated that sea lamprey mostly transited through the site near the bed, with a few individuals making transient vertical movements to higher in the water column. Sea lamprey were most active (highest number of detections) between 10 p.m. and 6 a.m. (Eastern Daylight Time). To limit hydrodynamic modeling requirements, data from 14 nights were selected as cases to be used in this study (5, 4, and 5 cases in 2010, 2011 and 2012, respectively) (Table 1). Cases were chosen to be approximately evenly distributed among years and on nights where high numbers of tagged individuals were moving (Table 1). Discharge at the site over the 14 cases ranged from 925 to 2,840 m3 s−1 (mean: 1,700 m3 s−1) (Table 1). Out of the 540 sea lamprey detected at the site over the 3 year study period, 131 moved upriver and approached the lock and dam complex during the 14 cases (median per night: 7, range: 2–20) (Table 1). Out of those released, the percentage of individuals that were detected at the site increased in later years (46%, 41%, and 60% in 2010, 2022, and 2012 respectively). However, it is unlikely that this was due solely to the larger spatial detection area of the hydrophone array as, in all years, a high percentage (ca. 80%) progressed directly upstream and entered one of the three approach zones (Figure 1) after they were first detected. Combining data for all cases, the proportion of sea lamprey entering each approach zone (Figure 1) was moderately correlated with mean nightly discharge from each zone (Pearson's correlation: r = 0.46, p < 0.01), suggesting that nightly variation in discharge between the channels influenced choice of route selected by the sea lamprey. Further details on fish capture, tagging, the hydrophone array, and position tracking are provided in Section 1 of the Supplementary material.
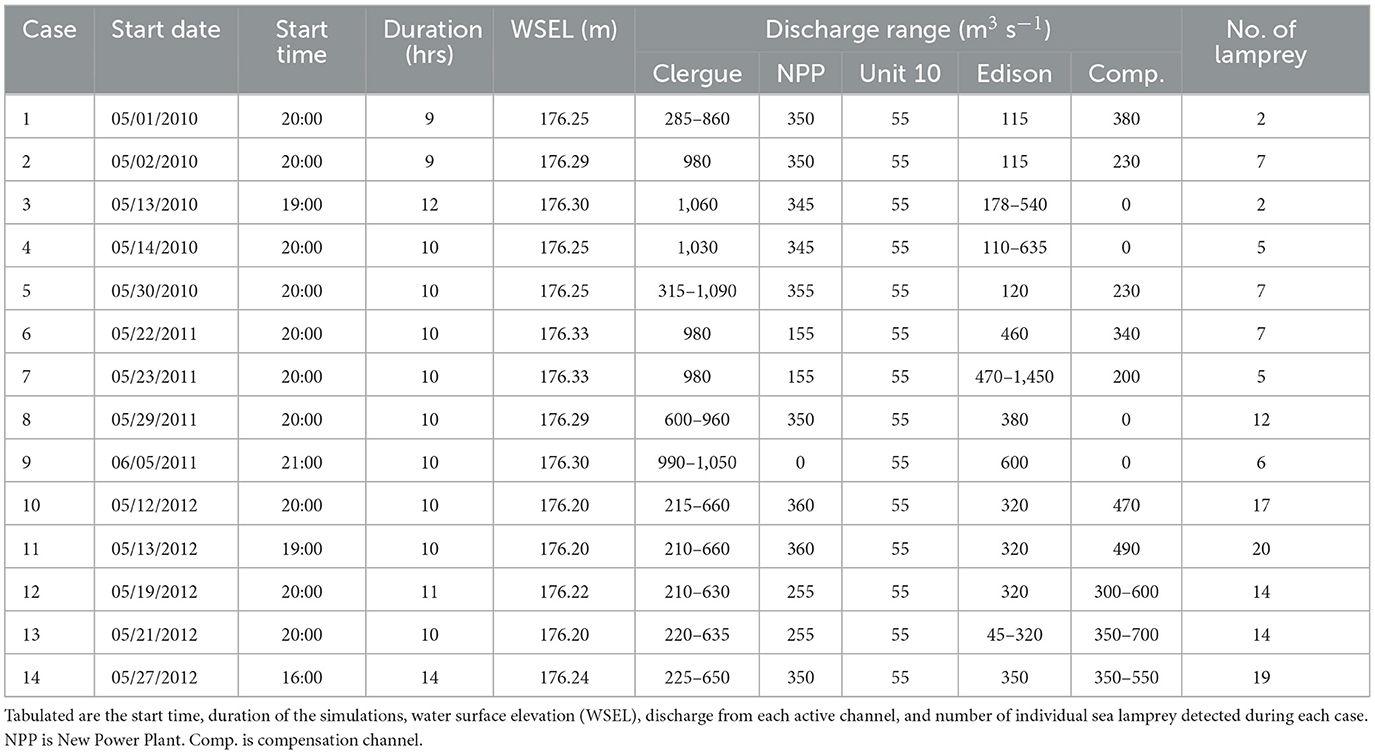
Table 1. Summary data for the 14 cases used to model the movement of adult sea lamprey approaching the Sault Ste. Mary lock and dam complex.
2.1.3 Quantification of space use patterns
Emergent space use patterns of upstream moving sea lamprey as they approached the lock and dam complex were quantified as the: (1) the approach zone (spatial pattern) and (2) movement speed through the system (temporal pattern). The approach zone was quantified as which of three zones the fish first entered (Figure 1) or if they were not detected. Zone 1 encompassed the Clergue hydropower plant and Canadian lock (Figure 1), it was selected to identify sea lamprey that were attracted to the high-discharge high-velocity flow from the Clergue hydropower plant (discharge from the Canadian lock was negligible) (Figure 2A). Zone 2 encompassed the shallow low-discharge low-velocity region to the north of the compensation channel (Figure 2B). Zone 3 encompassed the intermittent high velocity discharges from the compensation channel and the New Power Plant (NNP) (Figure 2B). Given hydrophone placement, it was not possible to confidently resolve which of these channels (compensation or NNP) sea lamprey selected. In addition, the high velocity plumes from both the compensation and NPP channels tended to merge so it was deemed appropriate to use a single zone to quantify attraction to the high-discharge high-velocity flow from both these channels. It was also not possible to confidently discern entry to the either of the Soo locks, so entry into these channels, when it was detected (infrequently), was ignored. The speed of travel for each sea lamprey was quantified as the quotient of the (1) distance traveled between where it was first detected and where it first entered an approach zone and (2) the time it took to travel that distance.

Figure 2. Snapshots of the predicted velocity magnitude (m s−1) (A, B), turbulent kinetic energy (TKE: m2 s−2) (C, D), spatial velocity gradient (SVG: s−1) (E, F), and observed movement tracks (telemetry data) (G, H) for Case 9 (left column: A, C, E, G) and Case 14 (right column: B, D, F, H) used to model the upriver movement of sea lamprey at the Sault Ste. Marie lock and dam complex.
2.1.4 Hydrodynamic model
A three-dimensional, time-variant flow field of the river reach extending ~6 km downstream of the Sault Ste. Marie lock and dam complex was modeled using the Reynolds averaged Navier-Stokes (RANS) equations with a Renormalization-Group (RNG) k−ε turbulence closure model in FLOW-3D v12.0 (Flow-Science, Santa Fe, New Mexico). Upstream inflows to the computational fluid dynamics (CFD) model included the four hydropower facilities and compensation works (Figure 3, Table 1). Flow through the navigational locks was assumed to be negligible and not included. The downstream boundary conditions were specified as a constant water surface elevation determined from water level gauges in the channels to the north and south of Sugar Island (Figure 3). A multi-block structured mesh was used over the 6 km long domain (Figure 3). Mesh block sizes ranged from 4 to 12.5 m in the horizontal plane and 1.3 m in the vertical plane (Figure 3). Finer mesh sizes were used in regions closer to the lock and dam complex (Figure 3) where multiple outflows converge. Use of the finer mesh for the entire river reach was not practical due to size of the reach, the number cases (n = 14), and their durations (Table 1). The mesh for the study site contained ~1.8 million elements. Unsteady flow conditions were simulated for each of the 14 cases examined. Discharge at each inflow boundary for the assigned time periods were prescribed with hourly averages (Table 1). Further details including CFD model equations, computational mesh and boundary conditions and validation are provided in Section 2 of the Supplementary material.
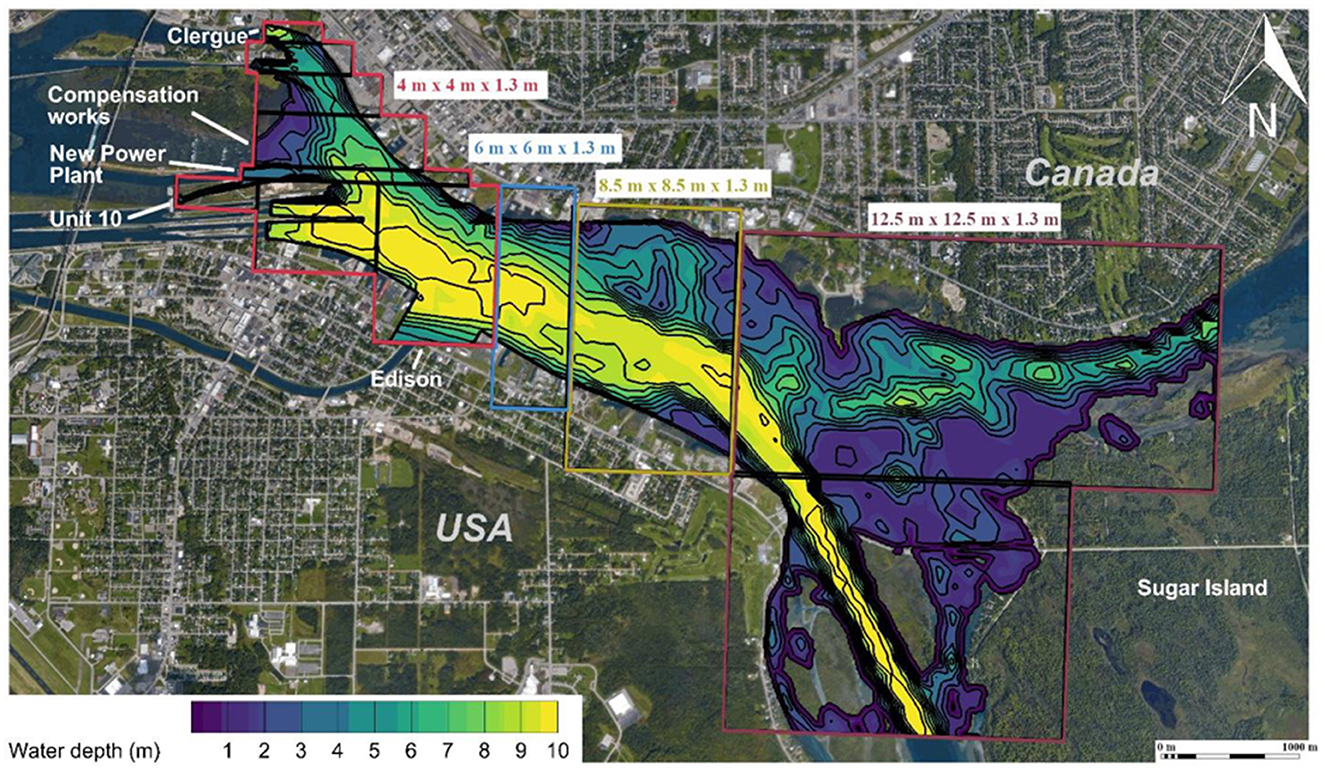
Figure 3. Aerial view of the St. Mary's River between the Soo Locks complex and Sugar Island with water depth contours relative to a water surface elevation of 176.2 m. Inflow boundaries and computational mesh grid sizes (L × W × D) are labeled. Orthogonal thick black lines indicate internal boundaries of mesh blocks.
Hydraulic variables were output from the CFD model at 15-min intervals, including: velocity magnitude (water speed) in x, y, and z directions (u, v, and w, respectively), water depth (d), turbulent kinetic energy (TKE) (Equation 1), and spatial velocity gradient (SVG, the spatial gradient in water speed) (Equation 2).
The fluctuating velocity component (u′, v′, w′) is a function of instantaneous and time-averaged velocity (e.g., ). TKE (m−2 sec−2) is the mean kinetic energy per unit mass associated with turbulence in the flow and the most commonly used hydraulic descriptor of turbulence in models of fish movement in rivers (Zielinski et al., 2024). SVG (magnitude, sec−1) represents the amount of mechanical distortion in the water flow field (Nestler et al., 2008). Mathematically, SVG is computed as the Frobenius or Euclidean norm of the rotation-rate and strain-rate tensors (Goodwin et al., 2023). While the mathematics are more involved, in simple conceptual terms, SVG can be viewed as a precursor to turbulence, whereas TKE reflects turbulence that has materialized. Variables SVG and TKE can be highly correlated (e.g., as in this study: Figure 2) and fish may respond to turbulence and to the distortion preceding it (Goodwin, 2004; Nestler et al., 2008).
There was considerable variation in the modeled velocity field both within and between cases (Figure 2), governed by variable discharge from each channel (Table 1) and flow instability. In all cases, there was instability in the flow field with large scale eddies associated with the high velocity plumes periodically being generated and translated downstream. In cases where discharge was highest from the Clergue hydropower plant (e.g., Case 9), TKE and SVG were highest along the north bank where the high velocity flow interacted with the domain boundary and shallow water depth (Figures 2A, C, E). In the cases where discharge was also high from the compensation channel and New Power Plant (e.g., Case 14), TKE and SVG were also very high in these channels, particularly in shallow regions (Figures 2B, D, F). In all cases, higher levels of TKE and SVG also occurred on the periphery of high velocity flow and associated with large scale eddies (Figures 2A–F).
2.2 Lamprey movement modeling
A pattern-oriented modeling approach (Grimm and Railsback, 2012) was used to systematically identify the environmental factors and responses that might be important for governing the movement patterns of sea lamprey. The pattern-oriented modeling approach provides a framework for assessing models of differing complexity to identify the most relevant predictors needed to describe observed ecological patterns (Grimm and Railsback, 2012). Using multiple patterns to assess model performance increases confidence that the underlying mechanisms are true and real (Gallagher et al., 2021). The patterns chosen to assess model performance in this study were the numbers of sea lamprey within each zone of the lock and dam complex on their first approach (spatial pattern) (Figure 1) and the speed at which the lamprey moved through the river reach (temporal pattern). The spatio-temporal variability in hydrodynamics within and between the approach zones and between cases (see Section 2.1.4 and Figure 2), coupled with the high number of sea lamprey movement observations during the cases (n = 131) means that variability in which approach zone lamprey first selected is likely to be a powerful performance measure of how they respond to hydrodynamics at the site. Using an additional pattern to assess performance, i.e., movement speed, greatly improves realism as it helps to ensure that spatial predictions are occurring for the right reasons. For example, a model that predicts the approach zone correctly but predicts that each sea lamprey took twice as long to get there (i.e., moved slower or covered more ground) compared to what was observed is less likely to be transferable to other sites and situations because the underlying movement rules are likely erroneous.
Our evaluation considered 18 models and was carried out in 4 phases (Table 2). Phase 1 involved testing three baseline models: a statistical (null; Model 1), reverse passive particle (Model 2), and simple biased (upriver) random walk (Model 3) model (See Section 2.2.3.1 for model descriptions). Phase 1 assessed how well the observed patterns could be reproduced without consideration of individual responses to hydrodynamic features (e.g., Models 1 and 2) and if inclusion of active swimming and positive rheotaxis improved model performance (e.g., Model 3). Phase 2 used individual-based models to assess independently if adding responses to flow velocity magnitude, turbulence, depth, and memory/experience of hydrodynamic features (n = 8) improved model performance relative to the biased random walk model (Table 2). We define movement responses (hereafter just behaviors) as the specific response (in terms of swim speed and orientation), or lack thereof, that an individual fish exhibits when it is exposed to certain environmental stimuli. Phases 3 and 4 involved testing combinations of two or three of the behaviors, respectively, that improved model performance in Phase 2 (Table 2).
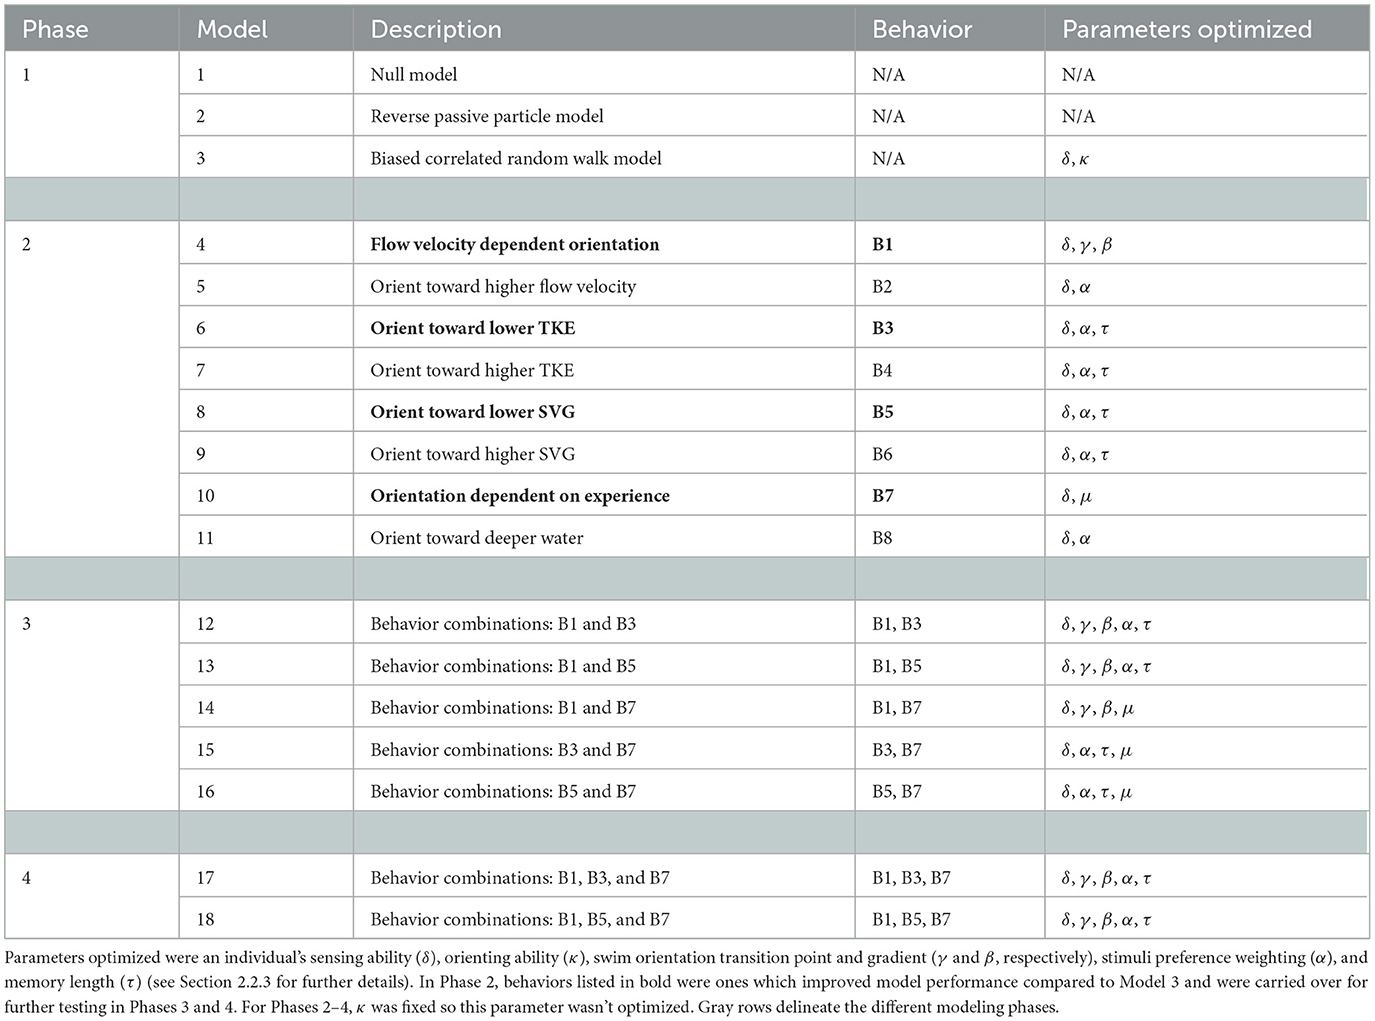
Table 2. Models developed to test which hydrodynamic features and subsequent responses are important for reproducing the upriver movement patterns of sea lamprey in a large river system.
Model 1, the null model, was a statistical model where the discharge through each of the approach zones was summed for the duration of each case and the proportion of simulated individuals first detected within each zone was assumed to be proportional to the relative discharge from each zone. The predicted speed at which the “agents” transited through the system was drawn from a distribution (normal: μ = 0.2488 m s−1, σ = 0.1095 m s−1) fitted to telemetry data of adult sea lamprey moving through a nearby river system (Mississagi River: Holbrook et al., 2015).
Models 2–18 applied an Eulerian–Lagrangian–agent method (ELAM), a type of spatially explicit individual-based modeling approach that couples (i) an Eulerian framework to capture features of the physical environment (e.g., hydrodynamics), (ii) a Lagrangian framework to capture sensory perception and movement trajectories of individual fish, and (iii) an agent framework where individual fish make decisions in response to perceived features of the environment (stimuli). Data are processed and passed between frameworks to enable the movement patterns of an organism to be modeled. For example, hydrodynamic data (e.g., flow velocity and direction) from the Eulerian framework are often passed to the Lagrangian and agent framework to enable both passive movement (i.e., advection) and behavioral responses (i.e., volitional movement speed and direction) to be modeled, respectively. In addition, in some ELAM models (but not in this study), the modeled organisms themselves influence the flow field with data such as organism position, size, orientation and movement direction passed from the Lagrangian to the Eulerian framework to be factored into flow calculations (e.g., Powalla et al., 2022). ELAM models provide a useful tool for exploring the hydrodynamic factors and behavioral processes important in determining the movement patterns of aquatic organisms. Examples have been developed for multiple fish species (e.g., Salmonidae spp.: Goodwin et al., 2006, 2014, 2023, European eel, Anguilla anguilla: Benson et al., 2021; European river lamprey, Lampetra fluviatilis: Kerr et al., 2023). In this study, the importance of individual or combinations of responses, or lack thereof, for reproducing upriver movement patterns of sea lamprey was explored by modifying the agent framework within each ELAM model. The specific code used to run each model was an adapted version of the ELAM code (v2021.1) developed by Dr. R. A. Goodwin (see Goodwin et al., 2006, 2014, 2023). For these models, particle advection was handled by Tecplot 360 2021 R2 (Tecplot, Inc) and agent responses were programmed in Fortran90. Agent responses and particle tracking interactions were combined using C++. The ELAM model was run, and output data retrieved and processed, using MATLAB R2020b (The MathWorks, Inc). Specific details of the Eulerian, Lagrangian and agent frameworks for each of the ELAM models are described in Sections 2.2.1–2.2.3.
2.2.1 Eulerian framework
For the ELAM models, a two-dimensional slice (x-y plane) at 0.5 m depth of the three-dimensional CFD model (see Section 2.1.4) was used to capture the hydrodynamic environment. This approach was taken because (i) there was limited information on the vertical position of sea lamprey at the study site and it was considered prudent to investigate two-dimensional movement rules before adding additional complexity and increasing uncertainty in results, and (ii) a slice at 0.5 m depth was considered to be more representative of the river's spatiotemporal hydraulic patterns than depth-averaged or near-bed velocities which tended to be influenced by near-bed hydraulic artifacts in the CFD boundary mesh due to coarse discretization of the undulating bathymetry (Figure 3).
2.2.2 Lagrangian framework
Models 2–18 had a 60 s movement timestep comparable to the detection frequency of tagged sea lamprey moving through the study system. For each case modeled, 100 virtual sea lamprey (agents) were released at the exact time and position that each tracked sea lamprey was first detected in the acoustic telemetry array. One hundred individuals per case was found to be a sufficient number of replicates to overcome model stochasticity. In Models 2–18, the agents sampled the environment for 20 timesteps prior to release. During this period, the agents sensed their environment, and model parameters were updated at each timestep, but the agents were not allowed to move. Iterative testing identified that this time was sufficient for agent's swim speed and orientation to be determined by local flow conditions and behavioral stochasticity at release. Two-dimensional movement occurred at each time step according to water velocity and volitional movement (i.e., swimming) as follows:
where x and y are the individual's spatial position (m), t is the current timestep, u and v are the water velocity vectors (m sec−1) in x and y, respectively, uswim and vswim are the vector components (m sec−1) of the agent's volitional swim speed, Uswim, and swim orientation, θ, and Δt is the time increment (sec). Each agent's response to its environment, which is primarily manifested as differences in volitional swimming (Equation 3), was the main difference between Models 2–18.
Agents were kept within the boundaries of the computational domain via checks made at each time step. If the agent's next movement would place it outside of a boundary, then a selection of 14 alternative movement locations were generated that fell on the perimeter of a circle centered on the last movement position and with a radius (r) equal to the current step length. The point closest to the erroneous position that was within, and did not cross, a boundary, was selected as the new movement location. This method allowed the agent's movement to continue in a direction similar to its “intended” movement direction and maintained the predetermined movement distance for that time step (Benson et al., 2021; Kerr et al., 2023).
Agents sensed their environment at five spatial points in an ovoid encompassing their body: the agent's centroid, plus four cardinal positions (front, back, left and right) located on the circumference of the sensory ovoid (Goodwin et al., 2006, 2014, 2023). The sensory ovoid was used for orienting the agents toward a desired environmental stimulus value, which in this study was either the fastest nearby water (B2), , deeper water (B8), or the smallest or largest nearby TKE (B3, B4) or SVG (B5, B6), depending on the movement rules being used. Preferred movement orientation, θo (orientation toward larger or smaller values) was determined by comparing Uwater, water depth (d), TKE or SVG at the available cardinal endpoint locations on the exterior shell of the sensory ovoid to their values at the centroid. The size of the ovoid and location of the sensory points was governed by the spatial resolution of hydrodynamic data but was not influenced directly by the Eulerian mesh (i.e., it was not limited to current or adjacent cells). Sizing the sensory ovoid to be small in comparison to the spatial resolution of the river hydrodynamics could result in the situation where Uwater, d, TKE and SVG had the same value at all five points, offering the fish no directional cues. Hence, the ovoid size changed each timestep to ensure sufficient difference in values between the fish centroid and the four cardinal positions so that appropriate movement decision could be made (see Goodwin et al., 2023 for further details).
2.2.3 Agent framework
Within the agent framework, swimming orientation, θ, is the direction in which the fish swims relative to the flow direction (i.e., direction of thrust). Movement orientation, θ′, is the direction the fish moves after advection and swim speed and orientation are factored in Equation 3. Preferred movement orientation, θo, is the direction the fish wants to move based on assessment of local environmental stimuli and internal decision processes. Note that preferred movement orientation and swimming orientation may differ due to an agent's inability to orient precisely (i.e., movement stochasticity). The specific equations that govern agent swimming behaviors within each model are outlined below.
For Models 2–18, swimming orientation was drawn randomly from a von Mises distribution, T(θ, θ′), where θ′ is the movement orientation at time t and θ is the swimming orientation at time t + t (Equation 4) (Codling et al., 2004; Goodwin et al., 2023).
where Jo(κ) is a modified Bessel function of order zero and is the mean turning angle:
where θo is the preferred movement orientation. As such, within Models 2–18, swimming orientation, θ, at time t + t is dependent on the adjustable parameters δ and κ, which are proxies for the agent's sensing and orienting abilities, respectively (Codling et al., 2004). The agent's sensing ability, δ, ranges from 0 to 1 and controls how quickly swimming orientation returns to the preferred movement orientation, θo, during the re-orientation process. When δ > 0 movement in the random walk is biased in the preferred movement orientation, θo (Codling et al., 2004), converging on the previous movement orientation θ′ when δ = 0 and θo when δ = 1. Orienting ability, κ, ranges from 0 to ∞ and controls the amount of randomness in the choice of each new swimming orientation, θ. Swimming orientation is drawn from a wrapped uniform distribution when κ = 0 and a wrapped normal distribution (with variance determined by κ) when κ > 0. A low value of κ corresponds to a poor (imprecise) orientating ability.
Analysis of the sea lamprey tracks in relation to the modeled hydrodynamic data indicated that lamprey swim speed, Uswim, was strongly and linearly correlated with flow speed, Uwater. To account for this, agent Uswim in the ELAM models for each individual at every time step was set as:
where a (0.91761) and b (0.44934), are the slope and intercept of the linear relationship, respectively, and R{X} is a random number from the distribution X and N(μ, σ) is a normal distribution with a mean, μ = 0, and a standard deviation, σ = 0.2158.
Tagged sea lamprey in this study also frequently held station at fixed locations for long periods. Station holding was implemented in the ELAM models by assigning a probability (PSH = 0.00285) that each agent would exhibit this behavior at each time step (Kerr et al., 2023). PSH was calculated as:
where, NSH is the number of sea lamprey observed to hold position, nl is the number of sea lamprey observed and μTL is the mean tracking duration. When initiated, the agent held station for a set number of time steps, randomly assigned from a distribution (exponential, μ = 75.2143, truncation: 10, 350) fitted to the empirical data. Station holding behavior was observed to be more prevalent and for longer during the day (this study; Kerr et al., 2023) but it was not necessary to account for this diurnal change in behavior in this study as the data used to calculate PSH was solely from night time activity and the models only simulated night time movement (i.e., Table 1).
Agent responses specific to each ELAM model are outlined in the following subsections (2.2.3.1–2.2.3.4).
2.2.3.1 Phase 1 (Models 2–3)
Model 2 was a reverse passive particle model, with volitional swimming (uswim and vswim) set to zero and all water velocity components (u and v) multiplied by −1 (Equation 3), to ensure particles traveled upstream against the flow vector. The model included no individual responses to hydrodynamic features, including station holding or flow velocity dependent swim speed, which were included in other ELAM models (3–18).
Model 3, a biased random walk model, was the first model in which agent movement was governed by volitional swimming (Equation 3). In Model 3, the preferred movement orientation, θo, was set 180° to the flow vector (i.e., upriver). The parameters varied during optimization of Model 3 were the agent's sensing (δ, range: 0.3–1) and orienting (κ, range: 20–300) ability.
2.2.3.2 Phase 2 (Models 4–11)
Models 4–11 each included one of eight potential movement behaviors in addition to the biased random walk model (Model 3). In Models 4–11, the orienting ability of each agent, κ, was fixed at 60, based on the optimization of Model 3, to reduce model complexity and to focus on the influence of other parameters more closely linked with each new behavior.
2.2.3.2.1 Model 4—flow velocity dependent orientation (B1)
Analysis of the telemetry data indicated that, when flow velocity was low, the orientation of swimming sea lamprey relative to the flow vector was more variable and their path more tortuous, whereas when flow velocity was high, swimming orientation was more consistently directed into the flow and the swimming path was straighter. Similar to Kerr et al. (2023), this behavior was included in Model 4 by making δ, the agent's sensing ability, dependent on Uwater using a sigmoid function:
where γ is the transition point of the slope, and β is the gradient of the slope that indicates how abruptly the agent transitions from more tortuous to straighter swimming behavior in response to Uwater. During optimization (see Section 2.2.4), γ was varied between 0.1 and 0.6 m s−1, and β was varied between 12.5 (gradual transition) and 200 (abrupt transition). For Model 4, the preferred movement orientation, θ0, was 180° to the flow vector (i.e., upriver) and the parameters that were varied during optimization were δ (range: 0.3–1), γ (range: 0.1–0.6 m s−1) and β (range: 12.5–200).
2.2.3.2.2 Model 5—orient toward higher flow velocity (B2)
In Model 5, flow velocity dependent orientation was implemented by weighting, α, the agents' preferred movement orientation, θo, upriver (180° to the flow vector) when α = 0 and toward the highest sensed flow velocity when α = 1 (Equation 9). Values higher than 0.5 frequently resulted in the agent's preferred movement orientation being lateral (ca. +/−90°) or even downstream (0°) to the flow vector which resulted in them rapidly being advected downriver. The parameters varied during optimization of Model 5 were δ (range: 0.3–1) and α (range: 0–0.5).
Where atan2 is a function for the four-quadrant inverse tangent in Fortran90, usensory and vsensory are the normalized vector components in x and y pointing toward the preferred stimulus value (in this case the highest sensed flow velocity) and u and v are the flow vectors in x and y.
2.2.3.2.3 Model 6 and 7—orient toward lower (B3) or higher (B4) TKE
In Model 6 and 7, turbulence-dependent orientation was implemented by weighting, α, the agent's preferred movement orientation, θo (default: 180° to the flow vector), toward either lower (Equation 10) or higher (Equation 11) TKE, respectively. A threshold, τ, level of TKE above (Model 6) or below (Model 7) which the behavior was implemented was also set to allow the behavior to be context dependent. During optimization, τ was set so that orienting toward either lower or higher TKE ranged from being almost ubiquitous to only occurring when the highest or lowest levels of TKE were experienced. The parameters varied during optimization of Model 6 and 7 were δ (range: 0.3–1), α (range: 0–0.5) and τ (Model 6: 0–0.004 m2 sec−2; Model 7: 0.0001–0.004 m2 sec−2).
2.2.3.2.4 Model 8 and 9—orient toward lower (B5) or higher (B6) SVG
To consider the importance of SVG, the approach implemented in Model 6 and 7 for TKE was adapted for SVG in Models 8 and 9, respectively. Models 8 and 9 also included a threshold level, τ, of SVG above or below which the behavior would occur. The equations dictating these behaviors were identical to Equations 10, 11, except the preferred stimulus and threshold was SVG. The parameters varied during optimization of Model 8 and 9 were δ (range: 0.3–1), α (range: 0–0.5) and τ (Model 8: 0–0.05 s−1; Model 9: 0.003125–0.0125 s−1).
2.2.3.2.5 Model 10—orientation dependent on experience (B7)
In Model 10, sensory experience was implemented by setting the preferred movement orientation, θo, to the angular mean (Equation 12) of the momentary flow direction θwater that each agent experienced over a fixed number of timesteps, μ.
The parameters varied during optimization of Model 10 were δ (range: 0.3–1) and μ (range: 2–20).
2.2.3.2.6 Model 11—orient toward deeper water (B8)
In Model 11, the agent's preferred movement orientation, θo, was weighted, α, toward deeper water, such that θo was upriver (180° to the flow vector) when α = 0 and toward the maximum depth on the sensory ovoid when α = 1. The equation dictating this behavior was identical to Equation 9, except the preferred stimulus was deeper water. The parameters varied during optimization of Model 10 were δ (range: 0.3–1) and α (range: 0–0.5).
2.2.3.3 Phase 3 (Models 12–16)—two behavior combinations
For Phase 3, combinations of two of the four behaviors found to improve the model performance (Section 2.2.4) over the best fitting model in the previous phase (Model 3) were tested, including: orientation dependent on flow velocity (B1), toward lower TKE (B3), toward lower SVG (B5), and dependent on recent past experience (B7) (Table 2). The combination of B3 and B5 was not considered due to high correlation between TKE and SVG. The remaining combinations resulted in five models (Table 2) in which the functionality of the individual behaviors (Sections 2.2.3.2.1–2.2.3.2.6) was preserved. For example, in Model 12, flow velocity dependent orientation (B1) and orienting toward lower TKE (B3) were combined. This was achieved by making δ, the agent's sensing ability, dependent on the Uwater as per Equation 8 (B1) and weighting, α, the agent's preferred movement orientation, θo, as per Equation 10, with the preferred stimulus being lowest TKE (B3).
2.2.3.4 Phase 4 (Models 17 and 18)—three behavior combinations
For Phase 4, combinations of three of the four behaviors found to improve the model performance in Phase 2 (B1, B3, B5, and B7: Table 2) were tested. As in Phase 3, the combination of B3 and B5 was not tested resulting in two possible models (Table 2). As for Phase 3, no adjustment to how each individual behavior functioned was required in the Phase 4 models.
2.2.4 Model optimization and performance
Models 2–18 differed in number of parameters to estimate, with later models with multiple behaviors having more parameters (Table 2). Where possible, parameter values were selected through quantitative assessment of the empirical telemetry tracks. Examples include, probability of station holding (NSH, nl, and μTL for Equation 7) and swim speed in response to flow speed (a and b in Equation 6). Parameters that could not be estimated empirically were estimated in two steps. First, an iterative visual assessment of model output was used to identify a range of sensible parameter values. This involved identifying a parameter range that made agents move upriver and approach one of the upstream channels (Figure 1), regardless of route. Second, the parameters were optimized by testing combinations of parameter values (within the range identified in step 1) to identify which combination of values performed best for all cases. For Phase 2 models, a full factorial optimization was conducted resulting in 72–384 possible parameter combinations per model. For Phase 3 and 4 models, a one-at-a-time optimization approach was used with the optimal values identified in Phase 2 selected as the starting point and then varying each of the parameter values singly, resulting in 32–60 parameter combinations per model. Parameter optimization results were graphed and visually assessed to identify the influence of parameter values on model performance.
Model performance was quantified in terms of the mean absolute difference (deviation score) between the simulated and empirical probability distributions of the spatial (approach zone) and temporal (speed through the system) movement patterns for all cases. This was achieved by binning the spatial and temporal data into standardized increments and calculating the mean absolute difference between the bins for the simulated and empirical data for all cases (spatial and temporal deviation, respectively). For the spatial data the same four bins were used, Zone 1, 2 and 3 and “Not detected” (Figure 1). The temporal data were binned into 0.1 m s−1 increments, starting at 0 m s−1. Combined overall model predictive performance (total deviation: ) was assessed as the mean of the spatial (Dspat) and temporal (Dtemp) deviation scores for all 14 cases (e.g., ). Each model was rerun fifty times using optimal parameter values and the mean total deviation () used to assess the relative performance of each model, with a lower score being better. Assessment of model performance in Phase 2–4, compared the performance of each model in that phase to the performance of the best model from the previous phase. Statistically significant differences in mean total deviation between one model and another were identified using Kruskal–Wallis tests. In Phase 2, only those behaviors that significantly reduced the mean total deviation (Kruskal–Wallis: p < 0.05) and reduced the deviation score by 0.01 or more were carried forward for further testing in Phase 3 and 4. A threshold reduction in total deviation of 0.01 was used because any statistically detectable improvement in total deviation <0.01 had negligible effect on the predicted spatial and temporal patterns (i.e., probability distributions).
3 Results
Over the 14 study nights (cases), sea lamprey most frequently (57%) approached the lock and dam complex at Zone 1 first (Figure 4A), which tended to have the highest discharge, containing the outflow from the Clergue hydropower station (Table 1). Zones 2 and 3 were approached first less frequently at 4% and 18%, respectively (Figure 4A). Zones 2 and 3 tended to have the lowest and intermediate levels of discharge across the 3 zones, respectively (Table 1). Only 20% of the tagged sea lamprey were not detected in any zone in the same night that they were first detected downstream (Figure 4A). The median movement speed of sea lamprey through the system was 0.41 m s−1 (range: 0.00–0.80 m s−1) (Figure 4B).
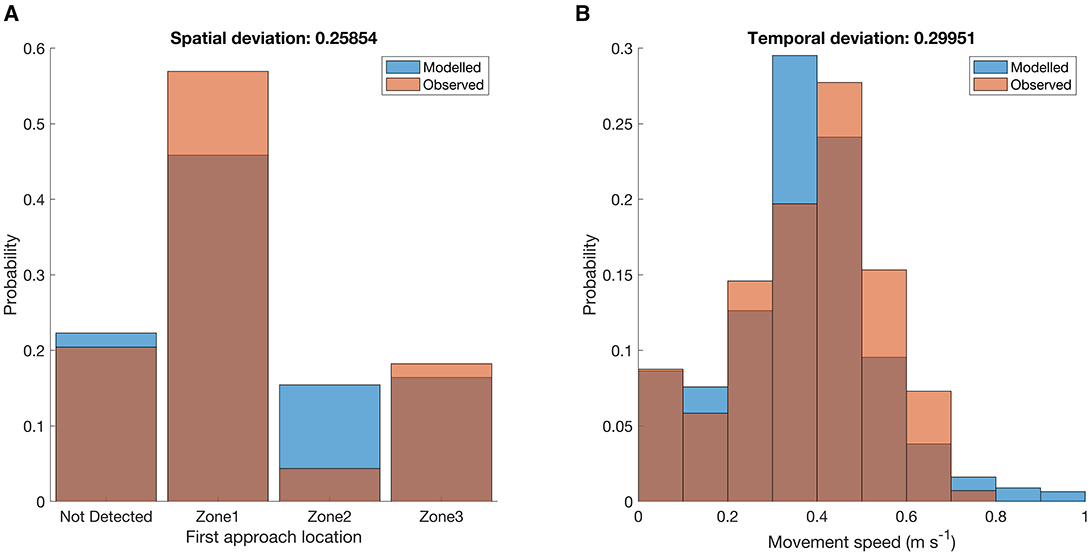
Figure 4. Frequency distributions of the (A) spatial (zone approached first) and (B) temporal (speed, m s−1) patterns used to quantify the upriver movement of sea lamprey (n = 131) for all cases (n = 14) at the Sault Ste. Marie lock and dam complex, Canada. Orange bars represent the distribution for approaches observed in the field and blue bars the results of a single iteration of the best performing model (Model 17). Dark orange indicates that the two bars overlap. See Figure 1 for the zone locations. The spatial and temporal deviation score between the observed and predicted distributions are noted above each graph (see Section 2.2.4). Note that the scores presented are deviations based on the results of a single model run.
Models 13 and 17 performed best at reproducing the observed movement patterns with similar scores for mean total deviation (), 0.2578 and 0.2690, respectively (Figure 5; Table 3). Model 13 performed slightly better than Model 17 (Table 3) and was the most parsimonious of the two models, including two behaviors, flow velocity dependent orientation (B1) and orienting toward lower SVG (B5), rather than the three behaviors included in Model 17, which includes flow velocity dependent orientation (B1), orienting toward lower TKE (B3), and orientation dependent on experience (B7). However, Model 13 reproduced the spatial patterns well (: 0.1102), but the movement speed less well (: 0.4054), while the mean spatial () and temporal () deviations scores were more evenly balanced for Model 17 (: 0.2504; : 0.2876) (Table 3). We therefore consider Model 17 to be the best model from the set of models we assessed for predicting upriver movement patterns of sea lamprey at the study site.
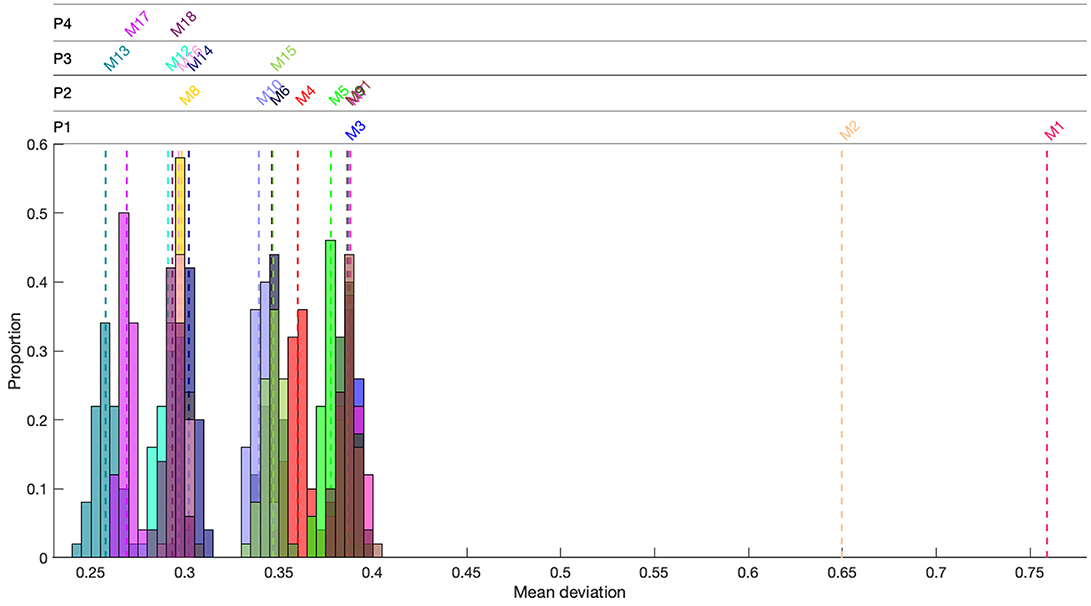
Figure 5. Mean (dashed colored line) total deviation score for models (M1-18) used to systematically test the importance of environmental factors and behaviors expected to govern the upstream movements of sea lamprey in a large river system. Colored histograms are the distribution of the deviation score for models (M3-18) where each model was rerun fifty times using optimal parameters. P1 to P4 relate to the four phases of modeling. Lower deviation equates to better model performance.
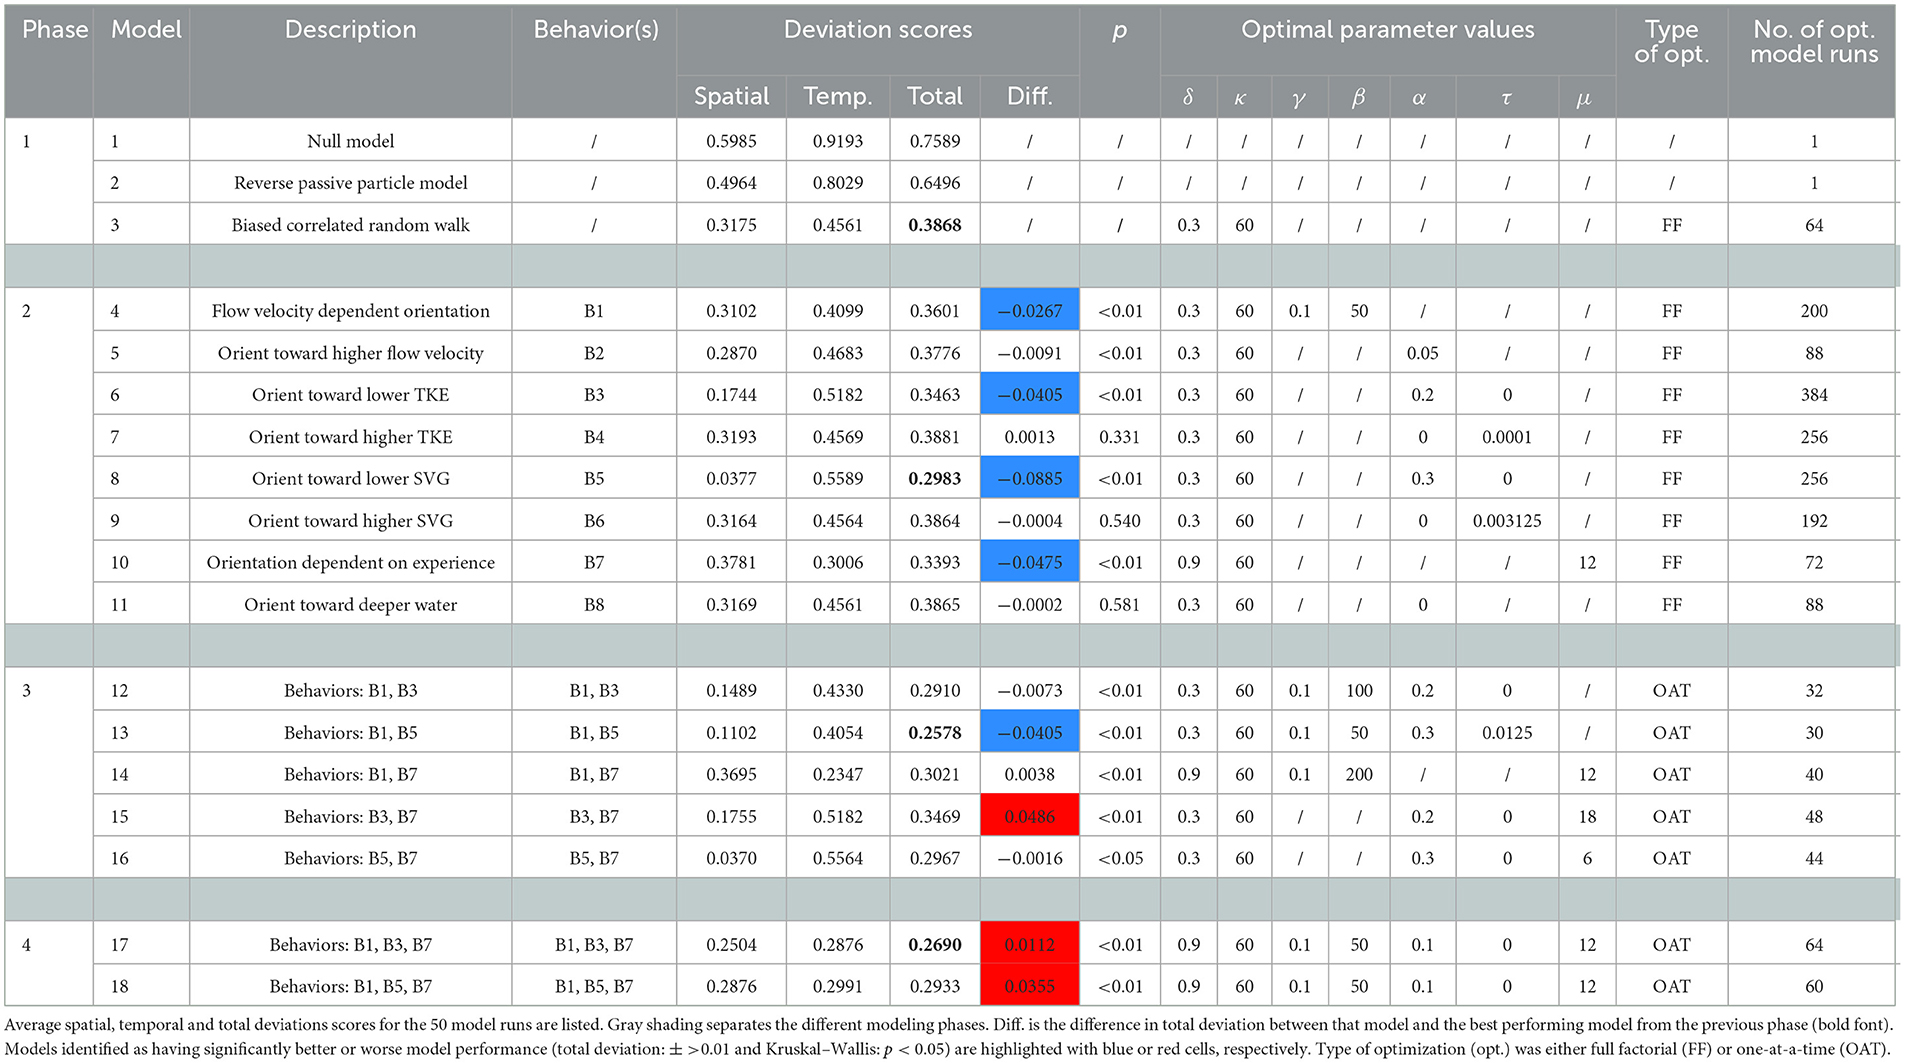
Table 3. Results of modeling used to evaluate which hydrodynamic features and subsequent responses best predict the spatiotemporal movements of sea lamprey in a large river system.
Despite reproducing the observed spatial and temporal movement patterns of sea lamprey reasonably well (Figure 4), Model 17 tended to underestimate the number of lamprey entering Zone 1 and overestimate the number entering Zone 2 (Figure 4A), and it slightly underestimated the speeds at which lamprey moved through the study reach (Figure 4B). In addition, the movement tracks for Model 17 tended to be slightly more tortuous, and more evenly distributed across the channel, compared to observed movement tracks (Figure 6). Similar visual discrepancies also occurred between the observed tracks and the results of Model 13. For Model 13 and 17, using alternate parameter values, i.e., increasing sensing ability, δ, or longer memory length, μ, increased tortuosity and provided a movement pattern that more closely visually matched what was observed, but this negatively affected each model's ability to predict the first approach zone and movement speed of sea lamprey (i.e., higher scores).
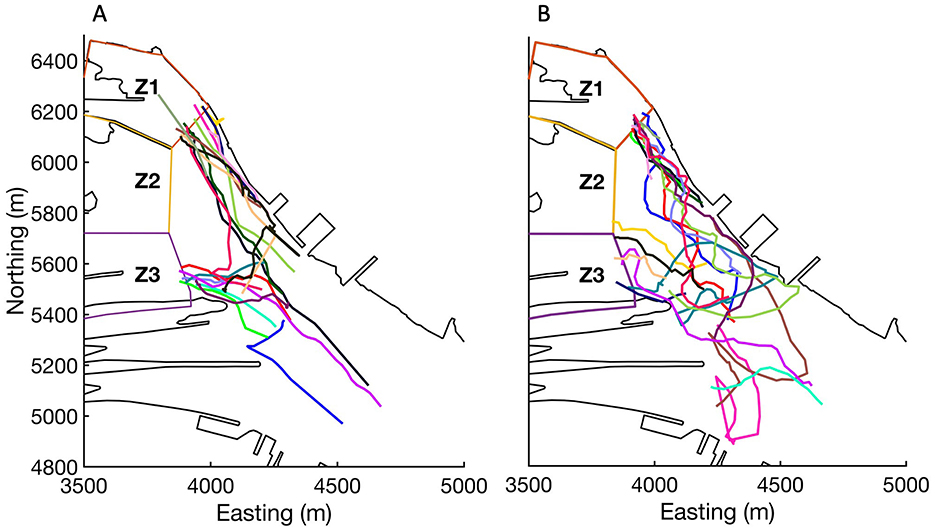
Figure 6. Observed (A) and predicted (Model 17) (B) movement tracks of sea lamprey during case 11 as they moved upriver and approaching the Sault Ste. Marie lock and dam complex, Canada. Different color lines represent different individuals.
The pattern-oriented modeling process highlighted that the majority of the responses to hydrodynamic features that were identified as important for influencing the movement patterns of riverine fish were also crucial for upriver migrating sea lamprey. Rheotaxis was identified as crucially important in Phase 1, in which a movement model based solely on bulk discharge from different zones and average movement speed at other sites (Model 1) and a reverse passive particle model (Model 2) performed poorly (: 0.7589 and 0.6496, respectively) (Figure 5, Table 3). Model 3, in which agents exhibited upriver oriented volitional swimming (positive rheotaxis) with movement stochasticity (d = 0.3 and k = 60) was the best performing model in Phase 1 (: 0.3868) (Figure 5, Table 3).
A response to flow velocity was highlighted as important through behavior B1, flow velocity dependent orientation, which individually performed well (i.e., Model 4), and was also included in the best performing models (Model 13 and 17, respectively) (Figure 5, Table 3). Optimal values of B1 were found to be a gradual transition (β = 50) to more upriver directed swimming with the transition occurring at a low flow velocity (γ = 0.1 m s−2) (Table 3).
A response to turbulence was highlighted as important through behaviors involving orientation toward either lower TKE (B3) and SVG (B5). These two behaviors performed well individually (e.g., Models 6 and 8) and were included in the best performing models (B3 in Model 13 and B5 in 17, respectively) (Figure 5, Table 3). Although both seemed to be potential viable metrics for governing a fish's response to turbulence, the best model included orienting toward lower TKE (B3) (Model 17: Table 3). Specifically, partially orienting (α = 0.1) toward lower levels of TKE every timestep regardless of the absolute value of TKE at its current location (τ = 0 m−2 s−2).
A response to water depth was not found to be important in this study. Modeling agents orienting toward deeper water (e.g., B8, Model 11) did not improve model performance (Table 3).
The individual's recent past experience was highlighted as important through behavior B7, which performed well individually (e.g., Model 10) and was included in the best model overall (Model 17). The crucial improvement in model performance provided by B7, in which orientation by the sea lamprey was based on the weighted mean of the flow direction experienced over μ timesteps, was that it sped up the movement of agents through the system (i.e., reduced scores). The optimal value of μ was identified as 12 timesteps (i.e., Model 17) (Table 3), which equates to fish orienting based on the average flow direction experienced in the last 12 min.
4 Discussion
Our results provide evidence that, on an intermediate scale, the upriver movements of sea lamprey approaching a lock and dam complex are shaped by four of the five commonly proposed movement responses. Specifically, the movements of the sea lamprey appear to be influenced by (1) positive rheotaxis, (2) a greater propensity to reorient directly upstream and swim faster when flow velocity is higher, (3) a slight but consistent orientation toward lower levels of turbulence, and (4) a swim orientation that is dependent on the mean flow direction recently experienced, not just what they are presently exposed too. Because our analysis systematically tested each response, in isolation and combination, we believe the importance of each of these responses was evaluated thoroughly and objectively. A response to water depth was not found to be important in this study, but our assessment of this response was less thorough because of our decision to model the spatial domain in two dimensions.
Our study is one of the first systematic analyses of the relative importance of key responses to hydrodynamic features and memory/experience cited in the literature as influencing the movement patterns of riverine fish. With the exception of Goodwin et al. (2014, 2023), an incremental approach to model complexity (i.e., incorporation of multiple variable responses in a range of combinations) is lacking amongst most modeling studies. The majority of studies assess the importance of only one or two of hydrodynamic response characteristics in a specific setting or report only on the most complex model, rarely seeking to understand universality of the individual responses (Zielinski et al., 2024). A systematic approach reveals the interdependency of individual responses on the overall accuracy of the model in both space and time. In the case of sea lamprey, orientation toward lower levels of turbulence (TKE or SVG) improved spatial accuracy at the expense of temporal accuracy. Alternatively, orientation dependent on velocity magnitude and incorporation of memory led to a greater improvement to temporal accuracy. If the intermediate steps of a systematic approach were ignored, the relative contribution of responses to overall model performance would be difficult to discern and conclusions toward the best fit model could be erroneous. For example, if each model in Phase 2–4 were considered in vacuo, all but model 7, could be considered as an improvement on Phase 1 models.
Our focus on sea lamprey provides additional evidence supporting the possibility that the hydrodynamic features important to fish movement, and how the fish respond to those features, may span a diverse range of species and life stages. The sea lamprey is a species from an ancient group of vertebrates that have existed for over 360 million years and is used as a keystone species for studying the origin and evolution of other fish species (Xu et al., 2016). Evidence that sea lamprey movement patterns can be explained by the most commonly proposed responses to hydrodynamic features (e.g., Zielinski et al., 2024) suggests those responses are either shared adaptations that evolved in fish millions of years ago or the outcome of convergent evolution for similar movement responses in distantly-related taxa. It is also noteworthy that responses identified as important during the upriver migration of adult sea lamprey (e.g., responses to flow direction, velocity magnitude, and turbulence) have frequently been identified as important for downriver moving juvenile salmonids (Goodwin et al., 2006, 2014). Finally, sea lamprey also use the distinct, anguilliform mode of locomotion, where body undulations occur as waves propagated posteriorly along the whole length of the animal, propelling the animal forward (Sfakiotakis et al., 1999). This type of motion differs from more common modes of sub-carangiform or carangiform locomotion, where the amplitude of the body undulations is limited anteriorly and increase only in the posterior half of the body (Sfakiotakis et al., 1999). Future studies strategically applying the approach developed here to fishes with different evolutionary histories and body forms, moving using different modes of locomotion, and in different ecological contexts will help resolve how widely the commonly proposed responses to hydrodynamic features (e.g., Zielinski et al., 2024) apply and when they might have evolved.
As in other modeling studies (e.g., Ben Jebria, 2022; Olivetti et al., 2021; Kerr et al., 2023), in this study rheotaxis was found to be a crucial response to flow that governs the movement patterns of a riverine fish at intermediate scales. Our results indicate that rheotactic behavior is not a fixed response, but a behavior mediated by other environmental factors, as sea lamprey exhibited stronger positive rheotaxis when flow velocity was high than when flow velocity was low. Similar mediated responses to flow direction have been observed for other lamprey species (e.g., European river lamprey: Kerr et al., 2023) where they are thought to be an adaptation that helps individuals orient away from low-velocity flow-recirculating regions where navigation cues are poor (Kerr et al., 2023). Similar mediated responses to flow direction have also been observed in other fish species, life stages, and environmental contexts. For example, when flow velocity is low, juvenile salmonids tend to orient with the flow (Olivetti et al., 2021) likely to use currents to efficiently move downriver. However, in higher velocity flows they tend to orient against the flow (Ben Jebria, 2022; Olivetti et al., 2021), which is thought to increase readiness for escape from potentially threatening situations (Enders et al., 2009). Overall, velocity magnitude dependent orientation improved temporal accuracy of the model, as evidenced by its inclusion in 6 of the 7 models with improved temporal deviations than a simple bias random walk model (Model 3).
In all the models that incorporated volitional swimming (Models 3–18) swim speed was mediated by flow velocity magnitude, as sea lamprey at the study site were observed to typically swim upstream at speeds ~0.4 m s−1 (0.8 body lengths [BL] s−1) faster than the flow speed. This observed mean ground speed was consistent with other studies which ranged from 0.5 to 1.0 BL s−1 (Almeida et al., 2002; Quintella et al., 2009; Holbrook et al., 2015; Kerr et al., 2023). Swimming at a speed slightly higher than the flow speed enables fish to progress upstream, but fish will begin to fatigue when the resulting effort exceeds their aerobic threshold, which can have dire fitness consequences. When fish swim at high speeds, maintaining a swim speed near a theoretical optimal-ground speed can enable fish to maximize their distance covered (Trump and Leggett, 1980; Castro-Santos, 2005). Although Castro-Santos (2005) found that not all species excel at swimming near the optimal ground speed, it is still advantageous for fish to modulate their swim speed relative to flow speeds in order to optimize energy expenditure. For example, Quintella et al. (2009) found sea lamprey ground speeds approached 1.0 BL s−1 in slow flow but were generally less than 0.4 BL s−1 in fast flow. Site-specific variation in ground speed is one reason that the null model (Model 1) in this study performed poorly, as mean ground speeds of sea lamprey in a local river system (0.25 m s−1: Holbrook et al., 2015) were used to parameterize the model and they did not accurately reflect the mean ground speed at the study site.
The response of sea lamprey to tend to move toward regions of lower turbulence had the greatest influence on spatial accuracy of the model compared to all other responses or memory/experience. The preference toward lower or optimal levels of turbulence was consistent with other models of upriver swimming fish (e.g., lower: brown trout, Salmo trutta: Padgett, 2020; rainbow trout, Oncorhynchus mykiss: Kulić et al., 2021; Schizothorax spp.: Zhu et al., 2021, and optimal: silver carp: Hypophthalmichthys molitrix: Tan et al., 2018; Salmonidae: Gao et al., 2016). Depending on its intensity, periodicity, orientation, and scale, turbulence can have a destabilizing impact on fish swimming (e.g., Tritico and Cotel, 2010). Thus, avoidance of high turbulence may be a strategy for sea lamprey to minimize energy expenditure when navigating upstream in a large river with relatively low levels of turbulence. Although context dependent responses to turbulence have been observed for sea lamprey in situ (Kirk et al., 2017; Lewandoski et al., 2021; Zielinski et al., 2020), parameter optimization determined that the model performing best had sea lamprey consistently orient toward lower SVG or TKE, regardless of current levels. Models that solely featured responses to turbulence (Model 6 and 8) also had decreased temporal accuracy. In general, agents moved through the domain slower than observed sea lamprey. Lack of temporal accuracy is not surprising due to the chaotic nature of turbulence in both space and time and inherent averaging resulting from Reynolds-averaged Navier-Stokes (RANS) simulations. While the CFD simulations were not able to recreate the temporal evolution of all the relevant scales of turbulence, the simulations did capture large scale spatial structure of SVG and TKE. Regardless, improvements in model spatial accuracy points toward responses to turbulence as important in navigating complex flow conditions.
Our results provide evidence that direct measures of turbulence “intensity” (e.g., TKE) are likely adequate for guiding agents at the scale of intermediate models. However, such decisions should be made on a case-by-case basis until more focused research is undertaken because nuanced differences in TKE and SVG are likely site specific and dependent on the type of hydrodynamic modeling undertaken (Goodwin et al., 2023). Common metrics associated with turbulence that are used to assess fish movement are TKE (e.g., Gao et al., 2016; Kerr et al., 2016; Tan et al., 2018), which is a direct measure of turbulence “intensity” (see Lacey et al., 2012), and SVG (Zhu et al., 2021; Elings et al., 2023; Goodwin et al., 2023), which is a measure of flow instability and can be considered a precursor to turbulence (Nestler et al., 2008; Goodwin et al., 2023). Spatial patterns in metrics of turbulence intensity and its precursors tend to be highly correlated but it is possible that nuanced differences in each might be important for informing space use of riverine fish. For example, Goodwin et al. (2023) chose to use SVG as the predictor variable in their model because they identified it as important stimulus in areas where tagged salmon were re-orienting, whilst little-to-no TKE signature existed in these areas. Others have discussed the nuanced differences in navigational information gained between orientating in response to direct measures of turbulence, such as TKE, versus SVG (see Goodwin et al., 2023). However, this is the first study to systematically test which might be the best for predicting spatio-temporal movement patterns. Importantly, TKE and SVG do not account for coherency and scale of turbulent features (e.g., eddies). Depending on the nature of the turbulence (e.g., rotational vs. shear) and scale and periodicity, turbulence can destabilize fish (e.g., Tritico and Cotel, 2010) or can present features that can be exploited by fish (e.g., von Karman vortex street: Liao et al., 2003). In this study, while the best performing model (Model 17) included a response to TKE rather than SVG, SVG did perform well as guidance stimuli in simpler models (e.g., Model 13) and as an individual behavior (e.g., Model 8).
Water depth (i.e., variation in bathymetry) (Mawer et al., 2023b) and swimming depth (i.e., variation in hydrostatic pressure) (Gross et al., 2021a) are also important factors influencing space use patterns of riverine fish. However, inclusion of these factors is typically limited to movement models with three-dimensional environmental domains, which include vertical variation in hydrodynamics and allow agents to move up and down in the water column (Zielinski et al., 2024). For these models, common ways of incorporating vertical fish movement include agents seeking to maintain the swim depth to which they are acclimated (i.e., downriver migrating juvenile salmonids: Goodwin et al., 2006, 2014), seeking a preferred depth (i.e., upriver migrating carp: Zielinski et al., 2018; Finger et al., 2019; Gilmanov et al., 2018; Whitty et al., 2022; downriver migrating juvenile salmonids: Gross et al., 2021b) or, in tidally influenced rivers, varying their preferred swimming and water depth at different times of the tidal cycle to gain assistance from currents (i.e., juvenile European eel, Anguilla anguilla: Benson et al., 2021; Delta smelt, Hypomesus transpacificus: Gross et al., 2021a). In this study, as with many others, the environmental domain for the ELAM model was two-dimensional; solely focusing on hydrodynamic variation to the x-y plane and limiting fish movement to within this plane. For this study, this was undertaken because there was limited information on the vertical position of sea lamprey at the study site and it was considered prudent to investigate two-dimensional movement rules before adding additional complexity and increasing uncertainty in results. Common other reasons for a reduction in dimensionality include resource limitations (i.e., computational speed limits resolution of either the CFD model or IBM) or because vertical variation in hydrodynamics is assumed to be negligible (i.e., in very shallow or uniform flow environments). Even though the environmental domain in this study wasn't three-dimensional, spatial variation in water depth in the x-y plane was included as a predictor variable that could influence agent movement behavior. However, despite evidence that lamprey movement patterns are influenced by water depth (Meckley et al., 2017; Kerr et al., 2023), this was not observed in this study with a behavior in which agents oriented toward deeper water not improving model performance. As computational power increases and as high-resolution three-dimensional telemetry data becomes more readily available it is likely that more movement models will include a fully three-dimensional environmental domain and we speculate that absolute water depth and swimming depth will be an important component of most riverine fish movement models in the future.
Experience and memory are important components of animal movement for a range of taxa (e.g., to optimize foraging or in philopatry: Kamil and Roitblat, 1985; Fagan et al., 2013; Bracis et al., 2015). In this study, agents integrated knowledge of the flow vectors they had recently experienced and used that information to orient upstream against the “bulk” rather than “momentary” flow direction. Although infrequently considered, similar functionality has been incorporated in other riverine fish movement models, with agent decisions being modulated by spatial memory (Gisen et al., 2022) or by comparison of current environmental stimuli against what a fish has recently experienced (Goodwin et al., 2006, 2014, 2023). As such, these movement models incorporate how environmental stimuli or spatial location influence the internal state of the agent, whether this be the perception of bulk flow orientation (e.g., this study; Padgett, 2020), location (Gisen et al., 2022) or hydrodynamic gradients (e.g., in water acceleration: Goodwin et al., 2014). However, unlike physiological attributes such as energy reserves or hormone levels, memory is an internal state and cannot be measured directly (Bracis et al., 2015). As such, there is typically a sparsity of information available for variable parameterization. In addition, incorporating aspects of memory and learning in animal movement simulations can considerably increase model complexity, requiring more movement parameters to be simulated and the use of efficient methods to store and process large volumes of data. However, individual based ELAM models, such as those used in this study, also provide a powerful tool for evaluating the importance of factors such as memory and experience as they allow for the systematic testing of movement behaviors that it would be difficult/impossible to isolate and test in the field. It is likely that, as movement models of riverine fish become more advanced, with more confidence in core movement behaviors, consideration of fish memory and learning will become common practice.
The hydrodynamic stimuli that we consider in this study are not the only factors influencing the movement patterns of riverine fish. For example, at larger spatio-temporal scales salmonids use magnetic cues to navigate to natal streams (Naisbett-Jones and Lohmann, 2022) and lamprey use olfactory cues to migrate to biologically productive spawning areas (Vrieze et al., 2011). Abiotic factors such as temperature (Byron et al., 2014; Clancey et al., 2017), dissolved oxygen content (LaBone et al., 2021; Lukas et al., 2021), and salinity gradient (Benson et al., 2021) can also influence space use patterns over a range of scales. At smaller spatial scales, biotic factors such as predator/prey density (e.g., Lucas and Bubb, 2014) and con-specifics (Lecchini et al., 2007) are likely also important. How animals integrate multiscale and multisensory cues to navigate at both small and large spatio-temporal scale is the focus of much research (e.g., Gleitman and Razin, 1971; Bett and Hinch, 2016; Raithel and Gottfried, 2021). Importantly, this study and others (see Zielinski et al., 2024) suggest that, at intermediate spatio-temporal scales, hydrodynamic cues, such as flow orientation, magnitude and turbulence, and how fish respond to them explain a large proportion of the variance seen in movement patterns of fish across a broad range of riverine species, life stages, and settings. Other environmental cues (e.g., temperature, concentrations of chemicals or salinity) can be incorporated in CFD simulations as their transport in guild flow has been well studied (e.g., Hu et al., 2023). However, de-coupling fish responses to non-hydrodynamic and hydrodynamic cues is not straightforward as non-hydrodynamic cues (e.g., salinity and temperature) are typically driven by hydrodynamic forces and often exhibit high spatio-temporal correlation.
5 Conclusions
The findings of this study present a significant advancement in our general understanding of the movement patterns of riverine fish. The results represent a step toward the development of more generalized movement models that can be used to predict the space use of multiple species and lifestages in various settings; something that will aid in the timely and resource-efficient management and conservation of vulnerable fish species. For sea lamprey specifically, the results of this study will enable improved prediction of space use patterns that will aid in the conservation of populations within their native range (i.e., improve the placement of fish passage technology) and in focusing efforts to control numbers outside of their native ranges (i.e., trapping of adults). Further work is required to refine the behavioral characteristics developed here for sea lamprey including (1) out of sample testing at the same and alternative sites (i.e., assess how well our model performs on new data that was not used to develop the model), (2) evaluating the importance of vertical movement, bathymetry and hydrostatic pressure, (3) assessing the influence of finer scale flow features (e.g., turbulence structure vs. averaged statistics), and (4) investigating the potential importance of olfactory cues at intermediate scales of movement. Future studies should also seek to evaluate how common hydrodynamic response characteristics can be applied to other species, lifestages and settings to better understand the movement patterns of all riverine fishes.
Data availability statement
The original contributions presented in the study are included in the article/Supplementary material, further inquiries can be directed to the corresponding author.
Ethics statement
Ethical approval was not required for the study involving animals in accordance with the local legislation and institutional requirements because it was not required at the time that the telemetry work was undertaken. All applicable international, national, and/or institutional guidelines for the care and use of animals were followed.
Author contributions
JK: Formal analysis, Investigation, Methodology, Software, Visualization, Writing – original draft, Writing – review & editing. DZ: Conceptualization, Formal analysis, Funding acquisition, Methodology, Project administration, Writing – original draft, Writing – review & editing. RG: Conceptualization, Formal analysis, Funding acquisition, Methodology, Software, Writing – original draft, Writing – review & editing. CH: Conceptualization, Data curation, Funding acquisition, Methodology, Writing – original draft, Writing – review & editing. RM: Conceptualization, Funding acquisition, Methodology, Writing – review & editing.
Funding
The author(s) declare that financial support was received for the research and/or publication of this article. This project was primarily funded by the Great Lakes Fishery Commission (project grant number: 2018_ZIE_54071) with additional support from a Natural Sciences and Engineering Research Council of Canada Discovery Research Grant to Robert L. McLaughlin (RGPIN-2018-04624). Collection of fish tracking data was funded by the Great Lakes Fishery Commission through Great Lakes Restoration Initiative appropriations.
Acknowledgments
We thank John Fryxell and Andrew Muir for their insights at the developmental stage of the project and who, along with several of the authors, helped to secure funding from the Great Lakes Fishery Commission.
Conflict of interest
The authors declare that the research was conducted in the absence of any commercial or financial relationships that could be construed as a potential conflict of interest.
Generative AI statement
The author(s) declare that no Gen AI was used in the creation of this manuscript.
Publisher's note
All claims expressed in this article are solely those of the authors and do not necessarily represent those of their affiliated organizations, or those of the publisher, the editors and the reviewers. Any product that may be evaluated in this article, or claim that may be made by its manufacturer, is not guaranteed or endorsed by the publisher.
Author disclaimer
Any use of trade, firm, or product names is for descriptive purposes only and does not imply endorsement by the U.S. Government.
Supplementary material
The Supplementary Material for this article can be found online at: https://www.frontiersin.org/articles/10.3389/ffwsc.2025.1528481/full#supplementary-material
References
Almeida, P., Quintella, B., and Dias, N. (2002). Movement of radio-tagged anadromous sea lamprey during the spawning migration in the River Mondego (Portugal). Hydrobiologia 483, 1–8. doi: 10.1023/A:1021383417816
Almeida, P. R., Arakawa, H., Aronsuu, K., Baker, C., Blair, S.-R., Beaulaton, L., et al. (2021). Lamprey fisheries: history, trends and management. J. Great Lakes Res. 47, S159–S185. doi: 10.1016/j.jglr.2021.06.006
Almeida, P. R., Mateus, C. S., Alexandre, C. M., Pedro, S., Boavida-Portugal, J., Belo, A. F., et al. (2023). The decline of the ecosystem services generated by anadromous fish in the Iberian Peninsula. Hydrobiologia 850, 2927–2961. doi: 10.1007/s10750-023-05179-6
Ben Jebria, N. (2022). Modelling Atlantic juvenile Salmon Behaviour Approaching Downstream Migration Passage Facility [Thesis]. Villeurbanne: Claude Bernard University Lyon.
Benson, T., de Bie, J., Gaskell, J., Vezza, P., Kerr, J. R., Lumbroso, D., et al. (2021). Agent-based modelling of juvenile eel migration via selective tidal stream transport. Ecol. Model. 443:109448. doi: 10.1016/j.ecolmodel.2021.109448
Bett, N. N., and Hinch, S. G. (2016). Olfactory navigation during spawning migrations: a review and introduction of the hierarchical navigation hypothesis. Biol. Rev. 91, 728–759. doi: 10.1111/brv.12191
Bracis, C., Gurarie, E., Van Moorter, B., and Goodwin, R. A. (2015). Memory effects on movement behavior in animal foraging. PLoS ONE 10:e0136057. doi: 10.1371/journal.pone.0136057
Bravener, G. A. (2011). Trapping for Control: Behaviour and Spatial Distribution of Sea Lamprey Around Traps on the St. Marys River [Master's thesis]. Guelph, ON: University of Guelph.
Brosnan, I. G., and Welch, D. W. (2020). A model to illustrate the potential pairing of animal biotelemetry with individual-based modeling. Animal Biotele. 8:36. doi: 10.1186/s40317-020-00221-z
Buchinger, T. J., Siefkes, M. J., Zielinski, B. S., Brant, C. O., and Li, W. (2015). Chemical cues and pheromones in the sea lamprey (Petromyzon marinus). Front. Zool. 12:32. doi: 10.1186/s12983-015-0126-9
Byron, C. J., Pershing, A. J., Stockwell, J. D., Xue, H., and Kocik, J. (2014). Migration model of post-smolt Atlantic salmon (Salmo salar) in the Gulf of Maine. Fish. Oceanograp. 23, 172–189. doi: 10.1111/fog.12052
Castro-Santos, T. (2005). Optimal swim speeds for traversing velocity barriers: an analysis of volitional high-speed swimming behavior of migratory fishes. J. Experi. Biol. 208, 421–432. doi: 10.1242/jeb.01380
Chick, J. H., Gibson-Reinemer, D. K., Soeken-Gittinger, L., and Casper, A. F. (2020). Invasive silver carp is empirically linked to declines of native sport fish in the Upper Mississippi River System. Biol. Invasions 22, 723–734. doi: 10.1007/s10530-019-02124-4
Childress, E. S., Allan, J. D., and McIntyre, P. B. (2014). Nutrient subsidies from iteroparous fish migrations can enhance stream productivity. Ecosystems 17, 522–534. doi: 10.1007/s10021-013-9739-z
Clancey, K., Saito, L., Hellmann, K., Svoboda, C., Hannon, J., and Beckwith, R. (2017). Evaluating head-of-reservoir water temperature for juvenile chinook salmon and steelhead at Shasta lake with modeled temperature curtains. N. Am. J. Fish. Manage. 37, 1161–1175. doi: 10.1080/02755947.2017.1350223
Codling, E. A., Hill, N. A., and Pitchford, J. W. (2004). Random walk models for the movement and recruitment of reef fish larvae. Marine Ecol. Prog. Series 279, 215–224. doi: 10.3354/meps279215
Elings, J., Mawer, R., Bruneel, S., Pauwels, I. S., Pickholtz, E., Pickholtz, R., et al. (2023). Linking fine-scale behaviour to the hydraulic environment shows behavioural responses in riverine fish. Move. Ecol. 11:50. doi: 10.1186/s40462-023-00413-1
Enders, E. C., Gessel, M. H., and Williams, J. G. (2009). Development of successful fish passage structures for downstream migrants requires knowledge of their behavioural response to accelerating flow. Canad. J. Fish. Aquatic Sci. 66, 2109–2117. doi: 10.1139/F09-141
Fagan, W. F., Lewis, M. A., and Auger-Méthé, M. (2013). Spatial memory and animal movement. Ecol. Lett.16, 1325–1338. doi: 10.1111/ele.12165
Finger, J. S., Riesgraf, A. T., Zielinski, D. P., and Sorensen, P. W. (2019). Monitoring upstream fish passage through a Mississippi River lock and dam reveals species differences in lock chamber usage and supports a fish passage model which describes velocity-dependent passage through spillway gates. River Res. App. 36, 36–46. doi: 10.1002/rra.3530
Fox, J. W. (2019). The many roads to generality in ecology. Philoso. Topics 47, 83–104. doi: 10.5840/philtopics20194715
Gallagher, C. A., Chudzinska, M., Larsen-Gray, A., Pollock, C. J., Sells, S. N., White, P. J. C., et al. (2021). From theory to practice in pattern-oriented modelling: identifying and using empirical patterns in predictive models. Biol. Rev. 96, 1868–1888. doi: 10.1111/brv.12729
Gao, Z., Andersson, H. I., Dai, H., Jiang, F., and Zhao, L. (2016). A new Eulerian–Lagrangian agent method to model fish paths in a vertical slot fishway. Ecol. Eng. 88, 217–225. doi: 10.1016/j.ecoleng.2015.12.038
Gilmanov, A., Zielinski, D., Voller, V., and Sorensen, P. (2018). The Effect of modifying a CFD-AB approach on fish passage through a model hydraulic dam. Water 11:1776. doi: 10.3390/w11091776
Gisen, D. C., Schütz, C., and Weichert, R. B. (2022). Development of behavioral rules for upstream orientation of fish in confined space. PLoS ONE 17:e0263964. doi: 10.1371/journal.pone.0263964
Gleitman, H., and Razin, P. (1971). “4 - learning and memory” in Fish Physiology, eds. W. S. Hoar and D. J. Randall (New York, NY: Academic Press), 191–278. doi: 10.1016/S1546-5098(08)60149-1
Goodwin, R., Marcela, P., Justin, G., Nestler, J. M., Hay, D., Anderson, J. J., et al. (2014). Fish navigation of large dams emerges from their modulation of flow field experience. Proc. Natl. Acad. Sci. U.S.A. 111. 5277–5282. doi: 10.1073/pnas.1311874111
Goodwin, R. A. (2004). Hydrodynamics and Juvenile Salmon Movement Behavior at Lower Granite Dam: Decoding the Relationship Using 3-D Space-Time (Celagent IBM) Simulation [Thesis]. Ithaca, NY: Cornell University.
Goodwin, R. A., Lai, Y. G., Taflin, D. E., Smith, D. L., McQuirk, J., Trang, R., et al. (2023). Predicting near-term, out-of-sample fish passage, guidance, and movement across diverse river environments by cognitively relating momentary behavioral decisions to multiscale memories of past hydrodynamic experiences. Front. Ecol. Evolut. 11:703946. doi: 10.3389/fevo.2023.703946
Goodwin, R. A., Nestler, J. M., Anderson, J. J., Weber, L. J., and Loucks, D. P. (2006). Forecasting 3-D fish movement behavior using a Eulerian–Lagrangian–agent method (ELAM). Ecol. Model. 192, 197–223. doi: 10.1016/j.ecolmodel.2005.08.004
Grimm, V., and Railsback, S. F. (2012). Pattern-oriented modelling: a ‘multi-scope' for predictive systems ecology. Philo. Transact. R. Soc. London B Biol. Sci. 367, 298–310. doi: 10.1098/rstb.2011.0180
Gross, E. S., Holleman, R. C., Thomas, M. J., Fangue, N. A., and Rypel, A. L. (2021b). Development and evaluation of a chinook salmon smolt swimming behavior model. Water 13:2904. doi: 10.3390/w13202904
Gross, E. S., Korman, J., Grimaldo, L. F., MacWilliams, M. L., Bever, A. J., and Smith, P. E. (2021a). Modeling delta smelt distribution for hypothesized swimming behaviors. San Francisco Estuary Watershed Sci. 19:3. doi: 10.15447/sfews.2020v19iss1art3
Hansen, E. A., and Closs, G. P. (2009). Long-term growth and movement in relation to food supply and social status in a stream fish. Behav. Ecol. 20, 616–623. doi: 10.1093/beheco/arp039
Holbrook, C. M., Bergstedt, R., Adams, N. S., Hatton, T. W., and McLaughlin, R. L. (2015). Fine-scale pathways used by adult sea lampreys during riverine spawning migrations. Transact. Am. Fish. Soc. 144, 549–562. doi: 10.1080/00028487.2015.1017657
Holbrook, C. M., Bergstedt, R. A., Barber, J., Bravener, G. A., Jones, M. L., and Krueger, C. C. (2016). Evaluating harvest-based control of invasive fish with telemetry: performance of sea lamprey traps in the Great Lakes. Ecol. App. 26, 1595–1609. doi: 10.1890/15-2251.1
Hu, K., Meselhe, E. A., and Reed, D. J. (2023). Understanding drivers of salinity and temperature dynamics in Barataria Estuary, Louisiana. J. Geophys. Res. Oceans 128:e2023JC019635. doi: 10.1029/2023JC019635
Hume, J. B., Luhring, T. M., and Wagner, C. M. (2020). Push, pull, or push–pull? An alarm cue better guides sea lamprey towards capture devices than a mating pheromone during the reproductive migration. Biol. Invasions 22, 2129–2142. doi: 10.1007/s10530-020-02242-4
Kamil, A. C., and Roitblat, H. L. (1985). The ecology of foraging behavior: implications for animal learning and memory. Ann. Rev. Psychol. 36, 141–169. doi: 10.1146/annurev.ps.36.020185.001041
Kerr, J. R., Karageorgopoulos, P., and Kemp, P. S. (2015). Efficacy of a side-mounted vertically oriented bristle pass for improving upstream passage of European eel (Anguilla anguilla) and river lamprey (Lampetra fluviatilis) at an experimental Crump weir. Ecol. Eng. 85, 121–131. doi: 10.1016/j.ecoleng.2015.09.013
Kerr, J. R., Manes, C., and Kemp, P. S. (2016). Assessing hydrodynamic space use of brown trout, Salmo trutta, in a complex flow environment: a return to first principles. J. Experi. Biol. 219, 3480–3491. doi: 10.1242/jeb.134775
Kerr, J. R., Tummers, J. S., Benson, T., Lucas, M. C., and Kemp, P. S. (2023). Modelling fine scale route choice of upstream migrating fish as they approach an instream structure. Ecol. Model. 478:110210. doi: 10.1016/j.ecolmodel.2022.110210
Kirk, M. A., Caudill, C. C., Syms, J. C., and Tonina, D. (2017). Context-dependent responses to turbulence for an anguilliform swimming fish, Pacific lamprey, during passage of an experimental vertical-slot weir. Ecol. Eng. 106, 296–307. doi: 10.1016/j.ecoleng.2017.05.046
Knapp, G., Guetttabi, M., and Goldsmith, S. (2013). The Economic Importance of the Bristol Bay Salmon Industry. Report prepared for the Bristol Bay Regional Seafood Development Association. Institute of Social and Economic Research, University of Alaska. Available online at: http://hdl.handle.net/11122/3863 (accessed 29 September 2024).
Kulić, T., Lončar, G., Kovačević, M., and Fliszar, R. (2021). Application of agent-based modelling for selecting configuration of vertical slot fishway. GRAĐEVINAR 73, 235–247. doi: 10.14256/JCE.3150.2021
LaBone, E. D., Rose, K. A., Justic, D., Huang, H., and Wang, L. (2021). Effects of spatial variability on the exposure of fish to hypoxia: a modeling analysis for the Gulf of Mexico. Biogeosciences 18, 487–507. doi: 10.5194/bg-18-487-2021
Lacey, R. W. J., Neary, V. S., Liao, J. C., Enders, E. C., and Tritico, H. M. (2012). The IPOS framework: linking fish swimming performance in altered flows from laboratory experiments to rivers. River Res. App. 28, 429–443. doi: 10.1002/rra.1584
Lecchini, D., Planes, S., and Galzin, R. (2007). The influence of habitat characteristics and conspecifics on attraction and survival of coral reef fish juveniles. J. Experi. Marine Biol. Ecol. 341, 85–90. doi: 10.1016/j.jembe.2006.10.006
Levi, T., Hilderbrand, G. V., Hocking, M. D., Quinn, T. P., White, K. S., Adams, M. S., et al. (2020). Community ecology and conservation of bear-salmon ecosystems. Front. Ecol. Evol. 8:513304. doi: 10.3389/fevo.2020.513304
Levitis, D. A., Lidicker, W. Z., and Freund, G. (2009). Behavioural biologists do not agree on what constitutes behaviour. Animal Behav. 78, 103–110. doi: 10.1016/j.anbehav.2009.03.018
Lewandoski, S. A., Hrodey, P., Miehls, S., Piszczek, P. P., and Zielinski, D. P. (2021). Behavioral responses of sea lamprey (Petromyzon marinus) and white sucker (Catostomus commersonii) to turbulent flow during fishway passage attempts. Canad. J. Fish. Aquatic Sci. 78, 409–421. doi: 10.1139/cjfas-2020-0223
Liao, J. C., Beal, D. N., Lauder, G. V., and Triantafyllou, M. S. (2003). The Kármán gait: novel body kinematics of rainbow trout swimming in a vortex street. J. Experi. Biol. 206, 1059–1073. doi: 10.1242/jeb.00209
Lowery, E. D., and Beauchamp, D. A. (2015). Trophic ontogeny of fluvial bull trout and seasonal predation on pacific salmon in a riverine food web. Transact. Am. Fish. Soc. 144, 724–741. doi: 10.1080/00028487.2015.1035452
Lucas, M. C., and Bubb, D. H. (2014). Variability in space use by stream fishes. J. Zool. 293, 126–133. doi: 10.1111/jzo.12129
Lucas, M. C., Hume, J. B., Almeida, P. R., Aronsuu, K., Habit, E., Silva, S., et al. (2021). Emerging conservation initiatives for lampreys: research challenges and opportunities. J. Great Lakes Res. 47, S690–S703. doi: 10.1016/j.jglr.2020.06.004
Lukas, J., Auer, F., Goldhammer, T., Krause, J., Romanczuk, P., Klamser, P., et al. (2021). Diurnal changes in hypoxia shape predator-prey interaction in a bird-fish system. Front. Ecol. Evol. 9:619193. doi: 10.3389/fevo.2021.619193
Maitland, P. S. (2003). Ecology of the River, Brook and Sea Lamprey. Conserving Natura 2000 Rivers Ecology Series No. 5. English Nature, Peterborough.
Marsden, J. E., and Siefkes, M. J. (2019). “Control of invasive sea lamprey in the Great Lakes, Lake Champlain, and Finger Lakes of New York” in: Lampreys: Biology, Conservation and Control, Fish & Fisheries Series, eds M. Docker (Dordrecht: Springer), 411–479. doi: 10.1007/978-94-024-1684-8_5
Marshall, J. C., Blessing, J. J., Clifford, S. E., Hodges, K. M., Negus, P. M., and Steward, A. L. (2019). Ecological impacts of invasive carp in Australian dryland rivers. Aqu. Conserv. 29, 1870–1889. doi: 10.1002/aqc.3206
Mawer, R., Bruneel, S. P., Pauwels, I. S., Elings, J., Pickholtz, E., Pickholtz, R., et al. (2023b). Individual variation in the habitat selection of upstream migrating fish near a barrier. Move. Ecol. 11:49. doi: 10.1186/s40462-023-00414-0
Mawer, R., Pauwels, I. S., Bruneel, S. P., Goethals, P. L. M., Kopecki, I., Elings, J., et al. (2023a). Individual based models for the simulation of fish movement near barriers: current work and future directions. J. Environ. Manage. 335:117538. doi: 10.1016/j.jenvman.2023.117538
Meckley, T. D., Gurarie, E., Miller, J. R., and Wagner, M. C. (2017). How fishes find the shore: evidence for orientation to bathymetry from the non-homing sea lamprey. Canad. J. Fish. Aquatic Sci. 74, 2045–2058. doi: 10.1139/cjfas-2016-0412
Naisbett-Jones, L. C., and Lohmann, K. J. (2022). Magnetoreception and magnetic navigation in fishes: a half century of discovery. J. Comp. Physiol. A 208, 19–40. doi: 10.1007/s00359-021-01527-w
Nestler, J. M., Goodwin, R. A., Smith, D. L., Anderson, J. J., and Li, S. (2008). Optimum fish passage and guidance designs are based in the hydrogeomorphology of natural rivers. River Res. App. 24, 148–168. doi: 10.1002/rra.1056
Oliver, T. H., Heard, M. S., Isaac, N. J. B., Martín-López, B., Woodcock, B. A., Bullock, J. M., et al. (2015). Biodiversity and resilience of ecosystem functions. Trends Ecol. Evol. 30, 673–684. doi: 10.1016/j.tree.2015.08.009
Olivetti, S., Gil, M. A., Sridharan, V. K., and Hein, A. M. (2021). Merging computational fluid dynamics and machine learning to reveal animal migration strategies. Methods Ecol. Evol. 12, 1186–1200. doi: 10.1111/2041-210X.13604
Padgett, T. E. (2020). Development and Application of Individual-Based Models for Predicting Upstream Passage of European Fish. Thesis. Leeds (UK), University of Leeds.
Payne, L. X., and Moore, J. W. (2006). Mobile scavengers create hotspots of freshwater productivity. Oikos 115, 69–80. doi: 10.1111/j.2006.0030-1299.14899.x
Powalla, D., Hoerner, S., Cleynen, O., and Thévenin, D. (2022). A numerical approach for active fish behavior modelling with a view toward hydropower plant assessment. Renew. Energy 188, 957–966. doi: 10.1016/j.renene.2022.02.064
Quintella, B. R., Póvoa, I., and Almeida, P. R. (2009). Swimming behaviour of upriver migrating sea lamprey assessed by electromyogram telemetry. J. Appl. Ichthyol. 25, 46–54. doi: 10.1111/j.1439-0426.2008.01200.x
Raithel, C. U., and Gottfried, J. A. (2021). Using your nose to find your way: ethological comparisons between human and non-human species. Neurosci. Biobehav. Rev. 128, 766–779. doi: 10.1016/j.neubiorev.2021.06.040
Rossington, K., and Benson, T. (2020). An agent-based model to predict fish collisions with tidal stream turbines. Renew. Energy 151, 1220–1229. doi: 10.1016/j.renene.2019.11.127
Rous, A. M., McLean, A. R., Barber, J., Bravener, G., Castro-Santos, T., Holbrook, C. M., et al. (2017). Spatial mismatch between sea lamprey behaviour and trap location explains low success at trapping for control. Canad. J. Fish. Aquatic Sci. 74, 2085–2097. doi: 10.1139/cjfas-2016-0445
Ruaro, R., Conceição, E. O., Silva, J. C., Cafofo, E. G., Angulo-Valencia, M. A., Mantovano, T., et al. (2019). Climate change will decrease the range of a keystone fish species in La Plata River Basin, South America. Hydrobiologia 836, 1–19. doi: 10.1007/s10750-019-3904-0
Sfakiotakis, M., Lane, D. M., and Davies, J. B. C. (1999). Review of fish swimming modes for aquatic locomotion. IEEE J. Ocean. Eng. 24, 237–252. doi: 10.1109/48.757275
Siefkes, M. J. (2017). Use of physiological knowledge to control the invasive sea lamprey (Petromyzon marinus) in the Laurentian Great Lakes. Conserv. Physiol. 5:cox031. doi: 10.1093/conphys/cox031
Silva, A. T., Lucas, M. C., Castro-Santos, T., Katopodis, C., Baumgartner, L. J., Thiem, J. D., et al. (2018). The future of fish passage science, engineering, and practice. Fish Fish. 19, 340–362. doi: 10.1111/faf.12258
Stensland, S., Dugstad, A., and Navrud, S. (2021). The Recreational value of Atlantic salmon angling under different fishing regulations. Fish. Manage. Ecol. 28, 362–372. doi: 10.1111/fme.12487
Tamario, C., Sunde, J., Petersson, E., Tibblin, P., and Forsman, A. (2019). Ecological and evolutionary consequences of environmental change and management actions for migrating fish. Front. Ecol. Evol. 7:271. doi: 10.3389/fevo.2019.00271
Tan, J., Tao, L., Gao, Z., Dai, H., and Shi, X. (2018). Modeling fish movement trajectories in relation to hydraulic response relationships in an experimental fishway. Water 10:1511. doi: 10.3390/w10111511
Tritico, H. M., and Cotel, A. J. (2010). The effects of turbulent eddies on the stability and critical swimming speed of creek chub (Semotilus atromaculatus). J. Experi. Biol. 213, 2284–2293. doi: 10.1242/jeb.041806
Trump, C. L., and Leggett, W. C. (1980). Optimum swimming speeds in fish: the problem of currents. Canad. J. Fish. Aquatic Sci. 37, 1086–1092. doi: 10.1139/f80-141
Vrieze, L. A., Bergstedt, R. A., and Sorensen, P. W. (2011). Olfactory-mediated stream-finding behavior of migratory adult sea lamprey (Petromyzon marinus). Canad. J. Fish. Aquatic Sci. 68, 523–533. doi: 10.1139/F10-169
Whitty, J. M., Riesgraf, A. T., Zielinski, D. P., and Sorensen, P. W. (2022). Movements of a model fish, the common carp, through a generic Mississippi River lock and dam demonstrate how fish swimming performance, behavior, and discharge-driven flow-fields determine fish passage rates in ways that can be predicted and modified using fish passage models. River Res. App. 38, 670–683. doi: 10.1002/rra.3942
Willis, J., and Teague, N. N. (2014). Modelling fish in hydrodynamic models: an example using the Severn Barrage SEA. WIT Transact. State Art Sci. Eng. 71, 179–190. doi: 10.2495/978-1-84564-849-7/015
Xu, Y., Zhu, S. W., and Li, Q. W. (2016). Lamprey: a model for vertebrate evolutionary research. Zool. Res. 37, 263–269. doi: 10.13918/j.issn.2095-8137.2016.5.263
Zhu, L., Li, J., Deng, Y., Liao, B., Liao, L., and An, R. (2021). Based on a biological particle model to predict the trace behavior of fish. Water Supply 21, 4044–4057. doi: 10.2166/ws.2021.159
Zielinski, D. P., Kerr, J., Bærum, K. M., Simmons, O. M., Silva, A. T., and Goodwin, R. A. (2024). Advancements in riverine fish movement modeling: bridging environmental complexity and fish behavior. Rev. Fish. Sci. Aquacult. 2024, 1–16. doi: 10.21079/11681/49423
Zielinski, D. P., Miehls, S., Burns, G., and Coutant, C. (2020). Adult sea lamprey respond to induced turbulence in a low current system. J. Ecohydraulics 6, 82–90. doi: 10.1080/24705357.2020.1775504
Zielinski, D. P., Voller, V. R., and Sorensen, P. W. (2018). A physiologically inspired agent-based approach to model upstream passage of invasive fish at a lock-and-dam. Ecol. Model. 382, 18–32. doi: 10.1016/j.ecolmodel.2018.05.004
Keywords: modeling, telemetry, fish movement behavior, flow speed, rheotaxis, turbulence, memory, lamprey
Citation: Kerr JR, Zielinski DP, Goodwin RA, Holbrook CM and McLaughlin RL (2025) Upriver migrating sea lamprey exhibit similar responses to hydrodynamic features as other up and downriver-moving species. Front. Freshw. Sci. 3:1528481. doi: 10.3389/ffwsc.2025.1528481
Received: 14 November 2024; Accepted: 17 February 2025;
Published: 14 April 2025.
Edited by:
Peter Goethals, Ghent University, BelgiumReviewed by:
Thomas P. Loch, Michigan State University, United StatesEden Effert-Fanta, Eastern Illinois University, United States
Copyright © 2025 Kerr, Zielinski, Goodwin, Holbrook and McLaughlin. This is an open-access article distributed under the terms of the Creative Commons Attribution License (CC BY). The use, distribution or reproduction in other forums is permitted, provided the original author(s) and the copyright owner(s) are credited and that the original publication in this journal is cited, in accordance with accepted academic practice. No use, distribution or reproduction is permitted which does not comply with these terms.
*Correspondence: James R. Kerr, amtlcnIyMUB1b2d1ZWxwaC5jYQ==