 Florian Ferchiche1*
 Camilla Liénart1
 Karine Charlier2
 Alexandra Coynel2Laureline Gorse-Labadie2
 Nicolas Savoye1
- 1Univ. Bordeaux, CNRS, Bordeaux INP, EPOC, UMR 5805, Arcachon, France
- 2Univ. Bordeaux, CNRS, Bordeaux INP, EPOC, UMR 5805, Pessac, France
Particulate organic matter (POM) characteristics and variability have been widely studied along the land-ocean aquatic continuum, yet, gaps remain in quantifying its source composition, fluxes, and dynamics at the river-estuary interface. POM in rivers consists of a complex mixture of sources, derived both from locally produced (i.e. phytoplankton) and from adjacent ecosystems (e.g. terrestrial POM). Each source differ in its trophic and biogeochemical characteristics, hence impacting its integration into local food webs, its transfer to estuaries and sea, and its contribution to biogeochemical processes. In this study, we use a robust approach based on in situ POM to characterize river POM end-members, to quantify POM composition and dynamics, and to identify the related key drivers. This study was performed at the River-Estuary interface of one of the main rivers in Western Europe (the Loire River, France). For 3 years, we conducted bimonthly measurements of carbon and nitrogen isotopic (δ13C, δ15N) and elemental (C/N) ratios to quantify the contribution of two sources (phytoplankton and terrestrial POM) to the POM mixture and calculated annual fluxes of particulate organic carbon (POC) and nitrogen (PN) sources. Throughout the year, POM consisted of ~65% phytoplankton and 35% terrestrial POM. The mean annual export fluxes were 40.6 tPOC/year and 2.45 tPN/year over the studied period, with half of it originating from phytoplankton (53 and 55% for POC and PN, respectively). We observed a clear seasonal pattern in POM composition: phytoplankton predominated from March to October, in relation to high primary production, while terrestrial contributions were the highest from November to February, driven by greater autumn-winter hydrodynamics. Our study illustrate the interest of such an approach to quantify POM composition in aquatic system and estimate source fluxes, and provide fundamental results for estimating seasonal baselines in food webs, establishing biogeochemical budgets, and quantifying POM exports to estuarine and marine environments. Applying this methodology across a broad spectrum of aquatic systems should enhance our understanding of biogeochemical processes and organic matter transformation along the land-ocean continuum and illustrates the contribution of these ecosystems to global biogeochemical cycles.
1 Introduction
The Land-Ocean Aquatic Continuum (LOAC), which refers to the integrated network of rivers, estuaries, and coastal waters, facilitates the transfer of water, nutrients, and organic material from terrestrial to marine environments. It forms a dynamic zone of intense matter and energy exchanges that support food webs and overall aquatic ecosystems functioning. Along the LOAC, rivers and estuaries act as producers of organic matter, but also receive terrestrial material from watersheds, that is transformed (Middelburg and Herman, 2007; Dürr et al., 2011) and transported toward coastal oceans, supporting the productivity of coastal shelves (Dagg et al., 2004). If budget estimations of LOAC ecosystems export to continental shelf exists (Bianchi and Bauer, 2011), a key challenge remains in precisely quantifying exact amounts and fluxes of river and estuaries POM sources (i.e. end-members), their seasonal dynamics and drivers along the LOAC.
Among all material in transition within the LOAC ecosystems, POM is a key compartment because of its overall biogeochemical reactivity and its availability to food webs. POM, non-mineral living or once-living particles, is composed of a mixture of autochthonous and allochthonous material (Dalu et al., 2016; Liénart et al., 2017). Autochthonous POM generally originates from in situ pelagic (e.g. phytoplankton) and benthic (e.g. microphytobenthos, macrophytes) primary producers (Tunēns et al., 2022), while allochthonous POM is primarily derived from terrestrial sources and is transported via upstream systems, runoffs, or artificial outlets (e.g. terrestrial litter and soil particles, Sun et al., 2021; Zhang et al., 2021). According to its origin and composition, the chemical characteristics and reactivity of POM varies and subsequently influence its transformation and fate in the ecosystem (Etcheber et al., 2007). For instance, phytoplankton, as a highly labile resource, is rapidly degraded and readily bioavailable to food webs, whereas terrestrial-derived is usually mostly refractory, already largely degraded, and of low nutritional value (David et al., 2006; Brett et al., 2017).
Throughout its transit along the LOAC, POM is produced and transformed through physical and chemical (e.g. adsorption/desorption, photodegradation; Sanchez-Vidal et al., 2013; Higueras et al., 2014), and biological processes (e.g. bacterial degradation and remineralization Hou et al., 2021; Marshall et al., 2021). These processes result in varying contribution from different sources to the POM mixture (Pradhan et al., 2014; Liénart et al., 2017). Each source of POM also exhibits its own spatial and temporal variability linked with environmental drivers from physical, chemical, hydrological or climatic origins. Seasonal production of phytoplankton, for example, varies over an annual cycle in relation to water temperature, light, and nutrient availability (Falkowski et al., 1998; Field et al., 1998), while terrestrial POM inputs increase with river flows and rainfalls (Goñi et al., 2009; Lebreton et al., 2016). Spatially, POM composition fluctuates along the LOAC with parameters such as salinity, turbidity or nutrient availability (Bonin et al., 2019), and differs greatly depending on the type of system, e.g. dominated by refractory material in turbid estuaries (Savoye et al., 2012) vs. more productive and less turbid systems dominated by fresh primary production (Golubkov et al., 2020). Additionally, watershed properties (e.g. land use, river infrastructure) and climate (e.g. precipitation) impact POM fluxes and biogeochemical quality (Palinkas et al., 2019; Kelso and Baker, 2020; Pradhan et al., 2020). The transformation and fate of river POM along the LOAC and in the oceanic shelves are thus largely influenced by POM composition and dynamics. Therefore, quantifying POM composition and characterizing its dynamics in the upper systems of the LOAC, in the river part, is essential to understand the role of river ecosystems as suppliers of organic material and as contributors to the global biogeochemical cycles.
In the classical set of tools available to determine the origin of POM and quantify its composition (i.e. the contribution of each source to the POM pool), measurements such as suspended particulate matter (SPM), particulate organic carbon (POC) and nitrogen (PN) concentrations provide a comprehensive overview of the bulk POM mixture, and quantify it without being able to distinguish its origin. Additional indicators such as chlorophyll a and phaeopigments concentrations serve as markers of photo-autotrophs biomass and its degradation state. Ratios of some of these descriptors help in characterizing POM quality and origin, by partly discriminating between the different sources. For instance, the POC/chl a ratio is typically used to distinguish living phytoplankton (~50–150 g/g) or phytoplankton-dominated POM (< 200 g/g) from other material (>200 g/g; Savoye et al., 2003 and references therein). The POC/PN ratio discriminates phytoplankton (~6–7 mol/mol) from terrestrial material (>12 mol/mol). Finally, carbon and nitrogen stable isotopic ratios (δ13C, δ15N) are widely employed to determine the origin (terrestrial vs. marine reservoirs) and fate of POM, and to study its role in C and N cycles and food web structure and (Bauer et al., 2013; Glibert et al., 2019). Usually, δ13C values discriminate POM origin (e.g. terrestrial matter < -29‰ vs. phytoplankton >-28‰ in temperate rivers, Gawade et al., 2018), while δ15N values strongly vary depending on the studied ecosystem (Sato et al., 2006; Middelburg and Herman, 2007). Nevertheless, the combination of C/N, δ13C and δ15N is largely used to characterize POM origin, as well as to quantify POM composition in mixing models, especially in coastal zones (Liénart et al., 2017; Kelso and Baker, 2020; St. Pierre et al., 2022).
Although POM composition and dynamics has been studied in a variety of temperate (Liénart et al., 2017; García-Martín et al., 2023) and tropical coastal ecosystems (Pradhan et al., 2014; Pelage et al., 2022), focusing primarily on continental vs. marine end-members as sources of the POM mixture, there is a lack of studies specifically quantifying the composition and dynamics of POM sources in the upper LOAC ecosystems. In this study, we focus on POM composition from the freshwater side of the river-estuary interface, aiming at (1) quantifying the contribution of each source to the river POM mixture, (2) characterizing the seasonal dynamics of the river POM composition, (3) identifying its drivers, and (4) calculating the fluxes of the POM sources at the river-estuary interface. For this study, we use a 3-years POM monitoring at the river-estuary interface of the Loire River, one of the main rivers of the Western Europe. The Loire River serves as a textbook case to illustrate our approach for determining and quantifying POM sources and for highlighting the drivers to their dynamics. With this study, we would like to bring to light processes and sources contributing to the POM at the river-estuary interface of the LOAC in order to better refine POM nature and fluxes for future studies on organic material budgets in estuaries and toward the sea.
2 Materials and methods
2.1 Study area
The Loire River (Figure 1), one of the main river in Western Europe, has the largest watershed (117,356 km2, ~20% of continental France) and length (1,006 km) of the French rivers. The mean river flow is 931 m3/s, with a 5-year return period floods of 4,300 m3/s and a 5-year low-waters of 134 m3/s, which can exceptionally reach a 20-year flood of 5,900 m3/s (Hydroportail, https://www.hydro.eaufrance.fr/sitehydro/M5300010/synthese, last visit 10/23/2023). The pluvio-nival regime results in patterns of high flows in fall, reinforced by snow melt on Spring, then low levels in Summer. Compared with other large rivers of Western Europe, the Loire watershed is little affected by human activities; it is characterized by a large proportion of natural landscapes (62%), a low occupation of agriculture (35%) and especially of artificial spaces (3%; Corine Land cover data, https://www.statistiques.developpement-durable.gouv.fr/corine-land-cover-0, last visit 10/27/2022). The Loire hydrodynamics is only slightly altered by anthropogenic constructions; the only dams are at the headwaters, 600 km upstream from the study site, and the banks are sparsely developed, only in the vicinity of cities. The river course is naturally braided and characterized by a wide bed. The Loire River was still considered as eutrophic (Descy et al., 2012), even if phytoplankton biomass has drastically decreased since the 90s (Minaudo et al., 2015, 2021).
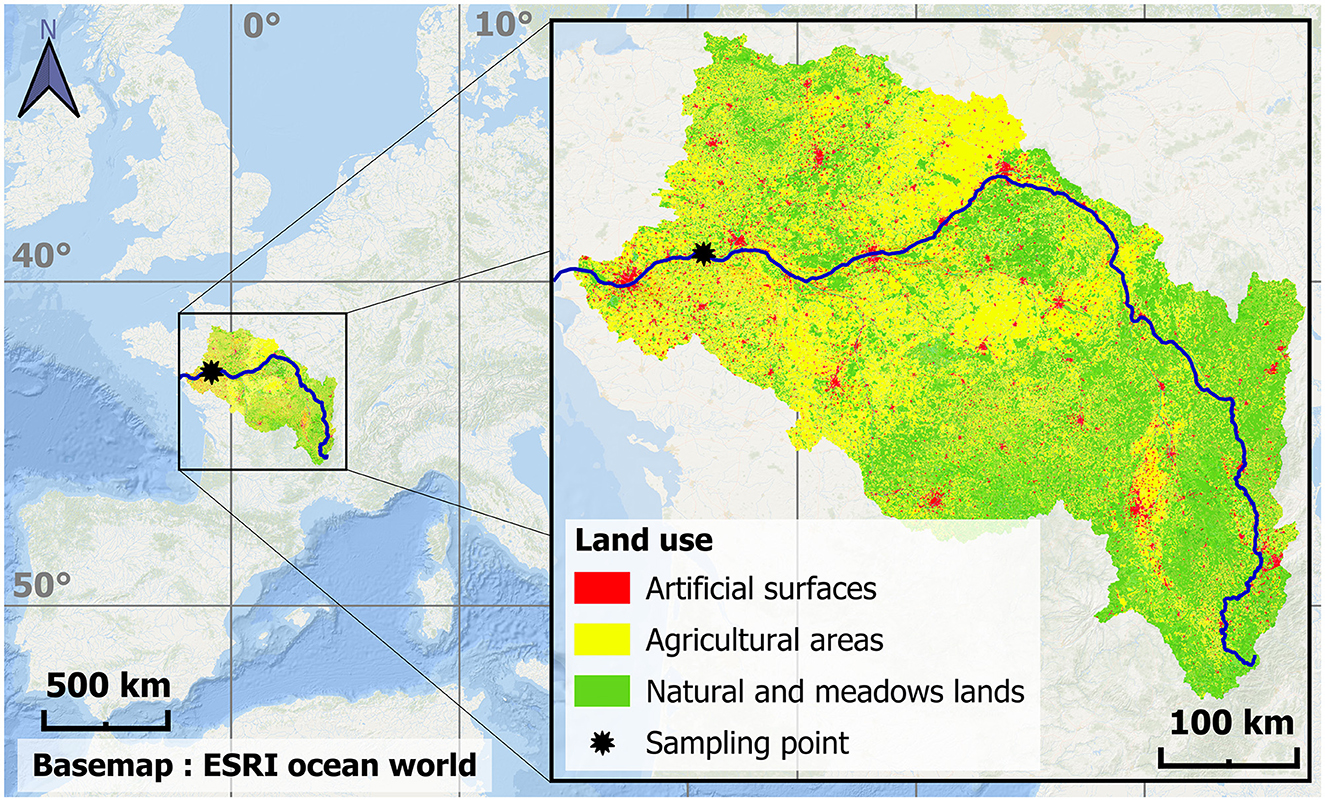
Figure 1. Localization of the Loire river (deep blue) and the study site of Montjean-sur-Loire (black star) in France, and the land use in the Loire watershed.
2.2 Sampling strategy
The study site is located at Montjean-sur-Loire (N 47.392174, W −0.860421; Figure 1), about 130 km from the river mouth, and upstream of the upper limit of the tidal propagation. Hence, this site is considered at the interface between the riverine and estuarine parts of the Loire River in a tidal definition. The sampling location is exempt of salinity and tidal effect (i.e. freshwater at all times), and the river flow is only directed downstream. Sampling was performed bimonthly from October 2009 to November 2012. The sampling frequency and 3-year duration allowed sampling of a range of river flows, including flood peaks (Figure 2A). Seven parameters were measured on water POM samples: suspended particulate matter (SPM), carbon and nitrogen stable isotopic (δ13C, δ15N) and elemental (C/N) ratios, particulate organic carbon (POC), particulate nitrogen (PN), chlorophyll a (chl a) and phaeopigments (phaeo). Secondary parameters used to determine the isotopic and elemental signatures of POM sources and/or used as environmental drivers to explain POM dynamics were also measured (nitrate, nitrite, ammonium, water temperature), or retrieved from databases (river flow and meteorological parameters, see Section 2.5).
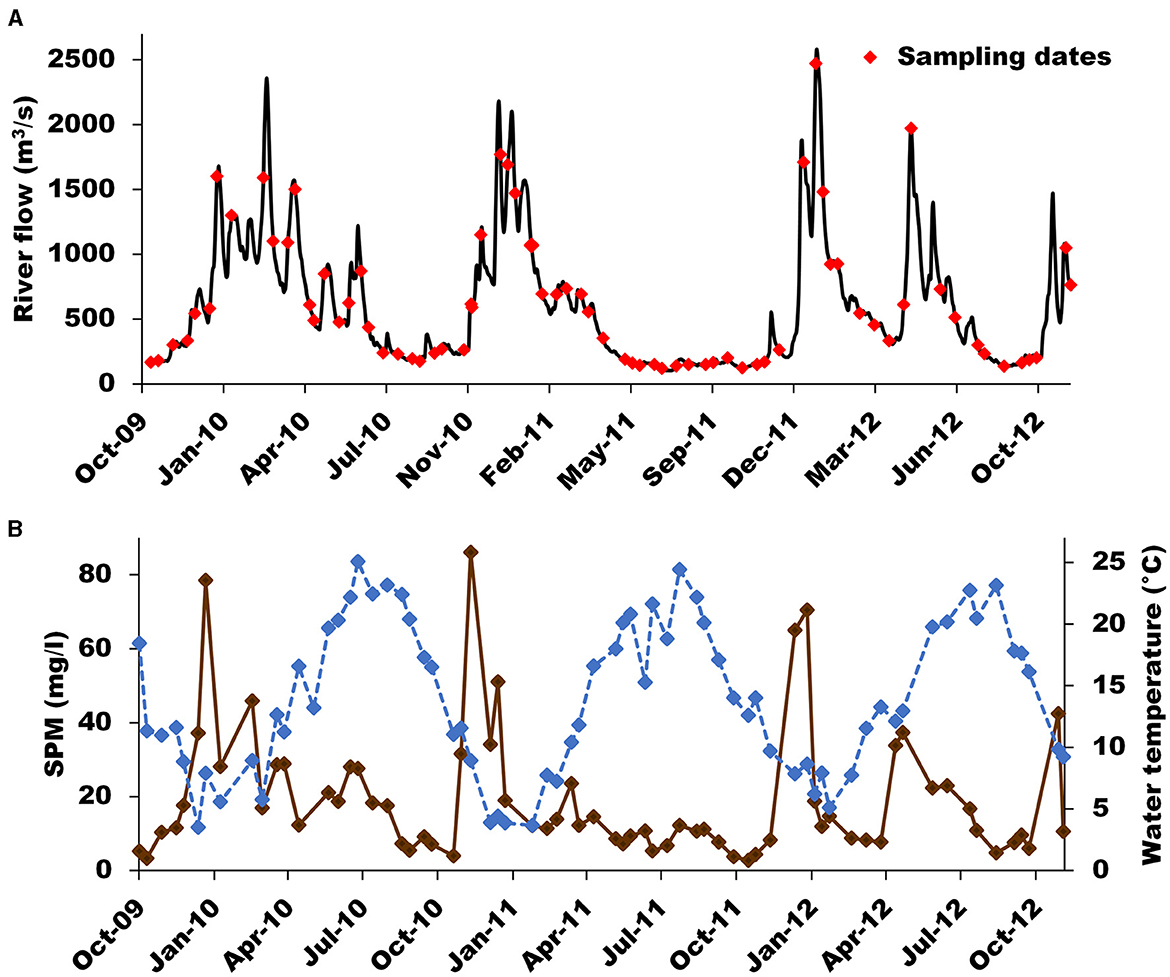
Figure 2. Temporal variation of the Loire River (A) daily river flow (blue line) and sampling dates (red diamonds), and (B) suspended particulate matter concentrations (SPM; brown line) and water temperature (blue dotted line) during the study period (October 2009–December 2012).
2.3 Sampling, processing and storage
Surface water of the river was manually sampled from a pontoon located on the left bank of the Loire River, using a telescopic arm and cleaned bottles (previously rinsed three times with water from the site), then poured in a clean tank. Water temperature was measured in situ using a TetraCon96® probe (PROFILINE, WTW). Samples were immediately filtered onsite through GF/F filters to measure all particulate parameters. Pre-combusted (6 h, 500°C) filters were used for SPM, POC, PN, δ13C and δ15N, then dried (50°C, overnight), and stored in the dark at room temperature. Filters for chlorophyll a and phaeopigments where directly stored after filtration in a freezer at −80°C. For nutrient measurements, samples were filtered onsite through 0.20 μm cellulose acetate syringe filters and stored in polypropylene tubes in darkness at −18°C before analyses.
2.4 Sample chemical analyses
SPM concentration was determined gravimetrically. After SPM measurement, SPM filters were acidified with HCl 2N to remove carbonate and dried at 60°C for 24 h for later POC analyses using a LECO CS 125 analyzer. Filters for PN were analyzed without any pre-treatment using a Flash Elemental Analyser Series 1112 (ThermoFinnigan®). Chlorophyll a and phaeopigments were extracted from filters using 90% acetone and fluorescence was measured using a Turner Designs trilogy fluorimeter (Yentsch and Menzel, 1963; Strickland and Parsons, 1972). δ13C, δ15N, and C/N ratio were measured on a same filter that was decarbonated according to Lorrain et al. (2003) before analyses. Isotope analyses were performed using an Elemental Analyzer (NC2500, CarloErba) connected to an Isotope Ratio Mass Spectrometer (Isoprime, GV Instruments). Isotopic ratios are expressed in the conventional δ notation (Coplen, 2011). Analysis uncertainty was equal to or better than 0.2‰ for δ13C and δ15N, and better than 0.2 mol/mol for C/N ratio. Samples for nitrate, nitrite, and ammonium were analyzed spectrophotometrically (Wood et al., 1967; Koroleff, 1969; Strickland and Parsons, 1972).
2.5 Environmental databases
Daily river-flow data were downloaded from Hydroportail public service website (https://www.hydro.eaufrance.fr/; station Montjean-sur-Loire). Daily values of meteorological data (rainfall, rainfall duration, mean air temperature, radiation, wind direction, and wind speed) were retrieved from Météo France data archives (https://meteo.data.gouv.fr/, Beaucouzé station, label 49020001). Wind data, initially given as direction and speed, were combined using scalar product to get zonal and meridional wind speed, which range between minus and plus infinity (see Lheureux et al., 2022 for details).
2.6 Source signature determination and mixing models
In biogeochemistry, mixing models are used to determine proportions of sources in a mixture (e.g. POM: Liénart et al., 2017). Here, we use a Bayesian framework for isotopic mixing models that gives proportions (percentages) as probabilities of contribution of each source to the mixture of POM. In order to run the mixing models, plausible sources of POM composing the mixture must be identified, and the elemental and isotopic signatures of these sources estimated. In environmental water such as river or lakes, the sources of POM identified are either autochthonous sources such as phytoplankton, microphytobenthos or macrophytes, or allochthonous sources such as terrestrial and anthropogenic POM (e.g. Savoye et al., 2012; Liénart et al., 2017). At the study site of Montjean-sur-Loire, phytoplankton and terrestrial POM were considered as the two sources of POM. Indeed, (1) at our study site and in its vicinity, the intertidal sediment was mainly sandy and microphytobenthos was likely absent since it needs mudflats to grow, (2) there was no wastewater treatment plant in the upstream vicinity of the study site, and (3) the macrophyte biomass was low year-round probably because of the sandy sediment that is not favorable to macrophyte growth (Jones et al., 2012). Consequently, microphytobenthos, anthropogenic POM and macrophytes were considered as negligible sources of POM at the study site of Montjean-sur-Loire. Nevertheless, one cannot completely discard the presence of highly degraded macrophytic detritus coming from far upstream the sampling area and transported by the river flow and that aquatic macrophyte detritus may lightly contributes to the pool that we define as terrestrial POM. In a previous study Minaudo et al. (2016) considered that POC in the Loire River can be distinguished as “detrital” and “algal” POC, “detrital” POC corresponding to terrestrial POC, and “algal” POC being partly composed of phytoplankton. Our assumption is very similar as we consider that “algal” POC is total-phytoplankton POC.
Terrestrial isotopic signatures are usually relatively stable over time (Savoye et al., 2012; Godin et al., 2017), hence we considered a constant value over time (see Section 3.3). On the contrary, phytoplankton isotopic signatures can vary up to a few permil within an annual cycle due to the variability in environmental conditions (Savoye et al., 2003; Sigman et al., 2009; Miller et al., 2013; Lowe et al., 2014; Liénart et al., 2017, 2018) and cannot be considered as constant over time. Hence, phytoplankton isotopic signatures were estimated from linear equations including a combination of significant environmental variables (e.g. chlorophyll a concentration, nitrate; see Section 3.3). The best fit was found using the add-in program Solver implemented in Microsoft Office Excel (2016).
In order to calculate POM composition, “simmr” bayesian mixing model was chosen (“simmr” R package, version 0.4.5, Parnell, 2021). This model solves mixing equations based on bulk POM elemental and isotopic values and source signatures as inputs for each sampling date. Two mixing models were run: one for carbon, using δ13C and N/C ratio (Equation 1), and one for nitrogen, using δ15N and C/N ratio (Equation 2). Note that N/C and C/N ratios provide information on the mixing of carbon and nitrogen, respectively (Perdue and Koprivnjak, 2007). The two models were:
Carbon mixing model
Nitrogen mixing model
The models were set with no prior information on sources contributions to the mixture [uninformative prior (1, 1)], and followed the Dirichlet distribution, considering that all the sources have an equal probability to contribute to the mixture at each date (Phillips et al., 2014). Following the recommendations of Phillips et al. (2014), Markov MonteCarlo chains (MCMC) were set as “very long” (iter = 1,000,000, burn = 500,000, thin = 500, n.chain = 4). Models outputs were approved with Gelman diagnostics to check for models convergence, and by checking the posterior predictive distributions to ensure the good fit of the models to the observed data. Models outputs are given as medians. Absolute uncertainties are of about 11 and 9% for carbon and nitrogen models respectively.
2.7 Flux calculations
Annual fluxes of phytoplankton and terrestrial POC and PN were calculated from daily river flows, and bimonthly SPM concentrations, and phytoplankton and terrestrial POC and PN concentrations as following Equation 3:
where: : annual average weighted-concentration expressed in mg/L; Qa: annual river flow, Qi: daily river flow corresponding for each sampling date; [Xi]: daily phytoplankton and terrestrial POC and PN concentration estimates.
2.8 Statistical analyses
To investigate the drivers of POM composition dynamics, redundancy analyses (RDA) were performed (Borcard et al., 2011; “ade 4” R package, version 1.7-19). An RDA uses a set of explanatory variables, in our case environmental parameters (i.e. the drivers) that are direct or indirect proxies of POM sources processes (e.g. phytoplankton production, horizontal advection), with the aim to explain a set of response variables, in our case POM composition (proportions of sources from mixing models outputs for each date as in Liénart et al., 2018). To run the RDAs of the Loire POM composition, 13 explanatory variables were selected: meteorological parameters, water temperature, river flow, nutrients, SPM, chlorophyll a, phaeopigments, POC proportion in SPM.
3 Results and discussion
3.1 Temporal variability of environmental characteristics
The daily Loire River flows ranged between 126 and 2,480 m3/s and followed a classic seasonal pattern with high and low flows occurring roughly in winter-spring and summer-fall, respectively (Figure 2A). However, the last winter-spring period (2011–2012) exhibited a somewhat different pattern compared to the previous ones: a short low-flow period separated two high-flow sub-periods. No extreme event occurred during the study period when considering the 5-year floods of 4,300 m3/s in the Loire River. The range of daily river flow recorded during the sampling days of our study covers 94.6% of the range of all daily flow recorded over the period 2000–2023 (Figure 2A). Water temperature ranged from ~3 to 25°C with the lowest and highest values recorded in December–January and July–August, respectively. SPM concentration ranged from ~3 to 86 mg/L during the study period (Figure 2B). SPM concentration was mostly lower than 40 mg/L with the highest values occurring systematically during the increasing phase of high flows (Figure 2B). Overall, these results and the dynamics of these parameters are very usual for temperate rivers and especially for the Loire River (Grosbois et al., 2001; Latapie et al., 2014).
3.2 Dynamics of bulk POM
Concentration in POC and PN ranged from 0.3 to 5 mg/L (average ± standard deviation: 1.6 ± 1.1 mg/L) and from 49 to 657 μg/L (242 ± 161 μg/L), respectively. The temporal patterns of POC and PN (Figure 3A) are highly similar with the pattern of SPM concentrations during the increasing phase of high flow, and with the pattern of chlorophyll a concentration (Figure 3B) during spring and summer. Concentration in chlorophyll a varied between 1 and 103 μg/L (15 ± 19 μg/L), the highest values occurring between April and September. Concentration in phaeopigments (not shown) ranged from 1.8 to 27 μg/l (7.2 ± 5.6 μg/L) and showed a clear seasonal pattern, similar to the SPM one. The POC/ chl a ratio ranged from 39 to 685 (210 ± 167). The seasonal pattern of POC/chl a is the reverse of that of chlorophyll a (Figure 3B). Especially, the ratios lower than 100, characteristic of living phytoplankton cells, largely occurred during spring and summer. The δ13C (Figure 3C) and δ15N (Figure 3D) are comprised between −31.0 and −25.1‰ (−28.4 ± 1.1‰) and between 2.7 and 9.8‰ (6.9 ± 1.6‰), respectively. Isotopic ratios exhibited no clear temporal pattern. The C/N ratio ranged between 6.2 and 10.1 (7.9 ± 0.8 mol/mol) and showed a clear seasonal pattern with the highest values occurring during the high-flow and low- chlorophyll a period and the lowest values occurring during the low-flow and high- chl a period. The N/C ratio being the mathematical inverse of the C/N ratio, its temporal pattern is the reverse of the C/N one.
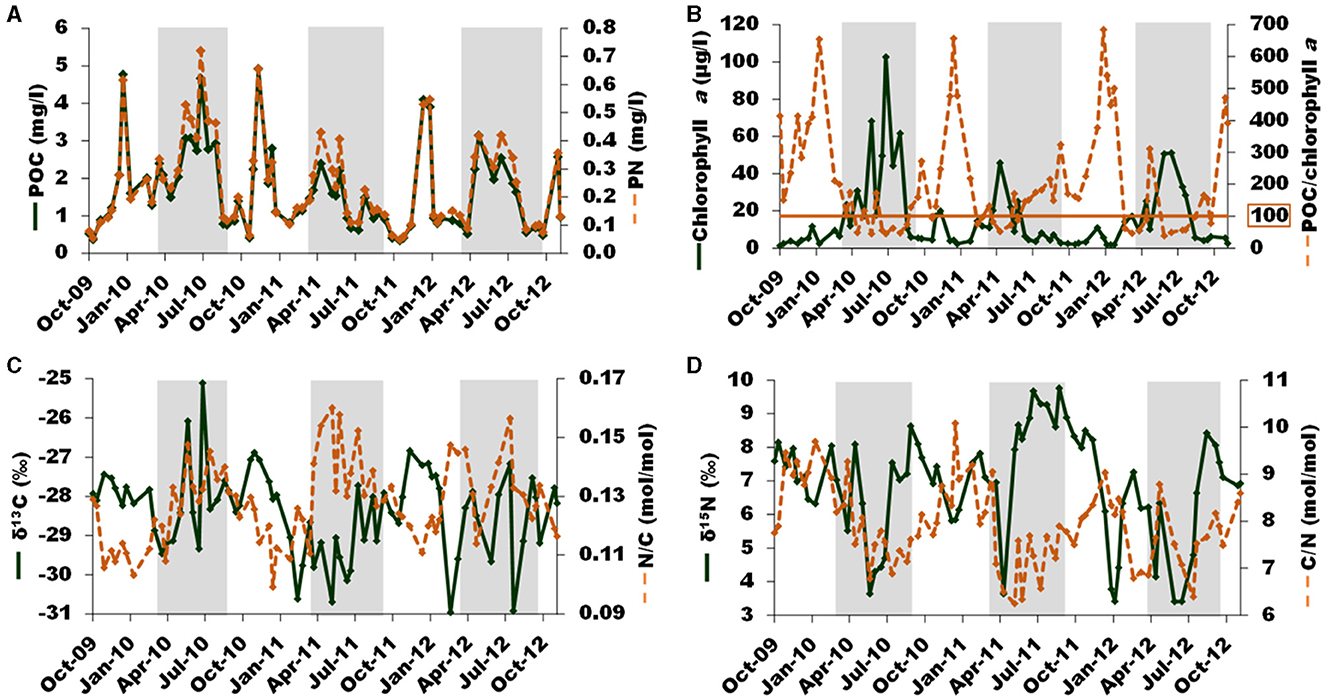
Figure 3. Temporal variation of (A) POC (green full line) and PN (brown dotted line), (B) chl a (green full line) and POC/chl a ratio (brown dotted line), (C) δ13C (green full line) and PN/POC (N/C; brown dotted line), (D) δ15N (green full line) and POC/PN (C/N; brown dotted line) during the study period (October 2009–to December 2012). Gray shaded areas represent the summer-like period.
To summarize, most of the above POM parameters mainly pointed out two contrasted seasons: one winter-like season characterized by high river flow, SPM concentration, and POC/chl a and C/N ratios associated with low chlorophyll a concentration on the one hand, and one summer-like season characterized by low river flow, SPM concentration, and POC/chl a and C/N ratios associated with high chlorophyll a concentration on the other hand. Note that POC and PN concentrations peaked during both seasons. The range of concentrations measured for the particulate parameters during the study period is consistent with previous studies of the Loire River for SPM, POC (Meybeck, 1988), and chlorophyll a (Minaudo et al., 2015). Most of the POM descriptors followed a seasonal pattern discriminating two main seasons each year. Specifically, the summer-like season (from March to September) is characterized by low POC/chl a (99 ± 59) and C/N ratios (7.4 ± 0.7 mol/mol), values that are characteristic of phytoplankton-dominated POM (Savoye et al., 2003 and references therein). In contrast, the winter-like season (from October to February) is characterized by higher POC/chl a (314 ± 169) and C/N ratios (8.4 ± 0.7 mol/mol). These values indicate that POM was less phytoplankton-dominated. Allochthonous POM, likely terrestrial POM, brought during the high river flow may also contribute to the POM pool. Nevertheless, these ratios are still not very high, indicating that the proportion of phytoplankton within POM was not negligible even during the winter-like season. Such seasonal patterns are consistent with previous studies of the Loire River (Meybeck, 1988; Minaudo et al., 2016).
3.3 Determining elemental and isotopic signatures of POM sources
In order to quantify POM composition with mixing models, one has to determine elemental and isotopic signatures of the sources, in our case phytoplankton and terrestrial POM (see Section 2.6). Both sources cannot be sampled directly as it is technically impossible to isolate phytoplankton cells or terrestrial particles from the whole particle pool in the water. However, it is possible to estimate these signatures using a numerical approach based on bulk POM elemental and isotopic values, following the methods developed by Savoye et al. (2012) and Liénart et al. (2017) for the estuarine and coastal systems. This approach has the great advantage (1) to take into account the temporal variability of the δ13C and δ15N signatures of phytoplankton due to growth conditions and (2) to take into account the effect of POM reworking within the river to elemental and isotopic signatures of terrestrial POM compared to direct measurement of e.g. terrestrial litter.
Living phytoplankton usually exhibits POC/chl a values comprised between 20 and 140 and consequently it is usually considered that POM with a POC/chl a ratio lower than 100 is mainly composed of living phytoplankton (Savoye et al., 2003 and references therein). In the present study, such a low ratio was measured for 24 of the 70 samples dates. This subset of samples has a δ13C of −28.8 ± 1.5‰, a δ15N of 6.2 ± 1.7‰ and a C/N ratio of 7.2 ± 0.6 mol/mol, which could be considered as the signatures of phytoplankton dominated POM at the study site. The standard deviation of the C/N ratio was quite low, hence we considered that phytoplankton C/N ratio was constant over time (7.2 ± 0.6 mol/mol). Similarly, phytoplankton N/C ratio was considered constant over time (0.140 ± 0.011 mol/mol). In contrast, standard deviations of phytoplankton δ13C and δ15N were rather large (1.5 and 1.7‰ respectively), and thus we considered this signature as varying over time and with environmental conditions. It is largely documented that phytoplankton δ13C and δ15N vary with, e.g. dissolved inorganic carbon-δ13C or dissolved inorganic nitrogen-δ15N, growth rate, nutrient utilization (Fry, 1996; Savoye et al., 2003; Sigman et al., 2009; Miller et al., 2013; Lowe et al., 2014; Liénart et al., 2017; Yan et al., 2022). Thus, similarly to Liénart et al. (2017), empirical models were performed for phytoplankton δ13C and δ15N signatures using environmental parameters explaining the variability of phytoplankton isotopic signal (Equations 4, 5).
The best fits between empirical models and data sets were obtained with the following equations that includes chlorophyll a and phaeopigments concentrations (chl a+phaeo: R2 = 0.47)(chl a/phaeo: R2 = 0.44):
The uncertainty associated to each model was estimated as the standard deviation of the difference between model and measured values. They were 0.9‰ for δ13C and 1.2‰ for δ15N, which is better than the initial 1.5 and 1.7‰ reported above.
Chlorophyll a and phaeopigments are proxies of living-phytoplankton biomass and decayed-phytoplankton biomass, respectively. Thus, their sum and their ratio are proxies of total (i.e. living and decayed) phytoplankton biomass and “freshness” of the phytoplankton population, respectively. Such relationships between phytoplankton biomass and/or “freshness” and phytoplankton δ13C and/or δ15N have already been reported in multiple studies (e.g. Savoye et al., 2003; Miller et al., 2013; Lowe et al., 2014; Liénart et al., 2017) and indicate that phytoplankton isotopes increase with increasing phytoplankton biomass, and that phytoplankton δ13C increases with phytoplankton decay. These relationships were found using the subset of 24 samples that cover the months ranging from February to October. Despite the fact that few months were not represented in the subset, we hypothesized that these two equations were valid year-round. Using these equations, the isotopic signatures of phytoplankton were calculated for each sampling date. The estimated signatures ranged from −30.6 to −25.0‰ for δ13Cphytoplankton and from 3.0 to 10.4‰ for δ15Nphytoplankton (Figure 4). These values are in agreement with those found, e.g. for the phytoplankton-dominated POM of Texan rivers (δ13C = −31.4‰; Lebreton et al., 2016) for phytoplankton of Indian rivers (δ13C = −30.6 ± 1.7‰, δ15N = 7.0 ± 2.3‰; Gawade et al., 2018), and for the freshwater phytoplankton of the Gironde Estuary (δ13C = −34.5‰; Savoye et al., 2012).
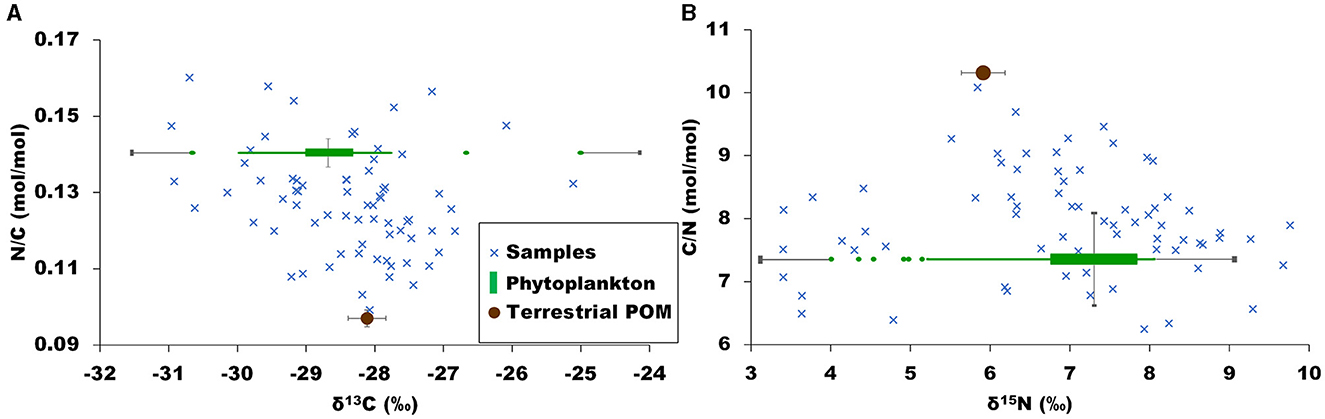
Figure 4. Biplot of POM bulk data (blue crosses) and estimated sources signatures for phytoplankton (green boxplot, variable signature over time estimated from models) and terrestrial POM (brown circle, constant value), and their uncertainties (black lines). (A) N/C ratio as a function of δ13C. (B) C/N ratio as a function of δ15N.
Elemental and isotopic signatures of terrestrial POM were also estimated from the bulk δ13C, δ15N and C/N ratio, and environmental parameters. Samples exhibiting the highest POC/chl a ratio (>600), i.e. containing the lowest proportions of phytoplankton, and the highest C/N ratio were selected and considered as terrestrial-dominated POM (see Savoye et al., 2003 and references therein). Two samples (the ones from December and January) corresponded to these criteria. Since these samples contained chlorophyll a (2.4 and 4.3 μg/L), they could not be considered as pure terrestrial POM. Thus, terrestrial POM signatures were calculated by removing the phytoplankton interference (Equations 6–8). This calculation was performed using the following equations for δ13C:
where POC/chl amean is the mean POC/ chl a ratio of the samples used to determine phytoplankton signatures. Similar equations were used to estimate terrestrial δ15N and C/N ratio. The final estimated signatures of terrestrial POM were: δ13C = −28.1 ± 0.06‰, δ15N = 5.9 ± 0.3‰, C/N = 10.3 ± 0.2 mol/mol and N/C = 0.097 ± 0.022 mol/mol.
Terrestrial δ13C values are similar to values found in temperate rivers, e.g. in the USA (Jordan River and the Mill Creek River; δ13C = −27.2 ± 1.2‰, Kelso and Baker, 2020), in France (Gironde Estuary, δ13C = −28.7 ± 0.9‰; Savoye et al., 2012). Such values are also similar to the ones of C3 plants directly collected on land (−28.0 ± 1.3‰, Dubois et al., 2012; −29.2 ≤ δ13C ≤ −26.8‰, Lebreton et al., 2016; −26.5 ± 1.6‰, Lu et al., 2016; δ13C = −26.5 ± 1.6‰, Gawade et al., 2018). δ15N values of terrestrial POM are highly variable in the literature (e.g. 4.5 ≤ δ15N ≤ 10.0‰, Lebreton et al., 2016; 0.8 ± 2.9‰, Dubois et al., 2012). Nevertheless the isotopic values of this study are similar to those of Kelso and Baker (2020) (δ15N = 5.8 ± 3.1‰). At last, the values of C/N ratio found here are lower than the usual ones (e.g. >12, Bordovskiy, 1965; 40 ± 26 mol/mol, Dubois et al., 2012; 19.7 ± 5.1 mol/mol, Gawade et al., 2018). The main difference between the literature and the present values is that literature values result from direct measurement of terrestrial material, whereas we estimated terrestrial POM values from the pool of particles present in the water (as explained above). This approach is of high interest since it takes into account possible reworking of terrestrial POM within the water column (Thornton and McManus, 1994; Bianchi and Bauer, 2011; Savoye et al., 2012; Liénart et al., 2020).
The comparison of the isotopic and elemental values between bulk POM and the sources indicates that, taking into account the analytical uncertainty and the variability of sources signatures over time, most of the bulk POM values are bracketed by sources signatures (Figure 4). This is an essential validation step to further perform mixing models.
3.4 POM composition and its seasonal dynamics
Mixing models outputs show highly similar results for carbon and nitrogen models (Figure 5). Over the study period, phytoplankton accounts for 64 ± 19% of POC and 66 ± 19% of PN composition and terrestrial POM accounts for 36 ± 19% of POC and 34 ± 19% of PN composition (Figure 5). Results also show a large variability of each source contribution over time. Phytoplankton contribution to POC and PN concentrations ranged from 7 to 94% and from 9 to 100%, respectively, and terrestrial contribution to POC and PN compositions ranged from 6 to 93% and from 0 to 91%, respectively. A clear seasonal pattern appears with two main periods, one from March to October, dominated by phytoplankton (75 ± 13%), another from November to February where proportions of terrestrial material are larger than the rest of the year (57 ± 15%). An episodic terrestrial input is observed in May 2012 during a springtime flood (Figures 2A, 5).
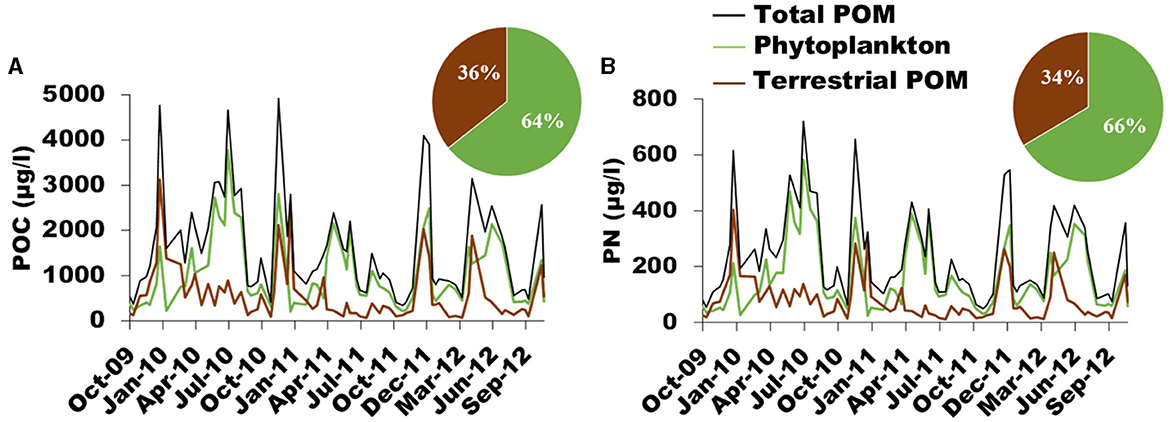
Figure 5. Temporal dynamics of (A) POC (black line) and (B) PN (black line) concentrations of terrestrial (brown) and phytoplankton (green) origin over time. Pie charts correspond to the relative contribution of each source to POC and PN averaged over the study period (October 2009–December 2012).
The seasonal variability of POM composition in the Loire river is very similar to that reported by Minaudo et al. (2016). However, these authors estimated that “algal” POC accounted for 44% of POC for the period November 2011 to November 2013, while the present study estimates that phytoplankton POC accounted for 64% of POC for the period October 2009 to September 2013 at the same site. Since both POM composition estimates were performed at the same site and since the interannual variability was not that high, the difference in estimated values (20%) is likely due to the different approach used to estimate POM source in each study. Minaudo et al. (2016) used the POC/pigments ratio determined during high pigments concentration to convert pigments (chlorophyll a + pheopigments) concentration at each date into algal POC. Then, detrital POC was subtracted from total and algal POC. Since pigments decay more quickly than the whole POC at the death of algal cells, the lowest POC/pigments ratio (i.e. POC/pigments ratio determined during high pigments concentration) converts pigments into living and recently-dead algae. Thus, in the study of Minaudo et al. (2016), algal POC is the POC of living and recently-dead algae, and detrital POC is terrestrial POC + detrital algae POC. Consequently, our estimates cannot be directly compared with their study.
To our knowledge, our study is one of the only three studies quantifying suspended POM composition in rivers using an isotope-based Bayesian mixing model, with those of Dalu et al. (2016) and Kelso and Baker (2020). However, direct comparison or our results with these studies is difficult since none of them did considered phytoplankton for running the mixing models, either because authors could not measure nor estimate isotopic signatures of phytoplankton (Dalu et al., 2016) or because phytoplankton has not been considered as a potential source of POM (Kelso and Baker, 2020). Also, the study of Kelso and Baker (2020) was performed in an urban river system (Jordan river and Mill creek, USA). In this latter study, the contribution of natural terrestrial OM to river POM increased from July (~10%) to December (~50%), in contrast to the contribution of lake POM and benthic organic matter sources, whereas anthropogenic POM peaked in November. In the Kowie river (South Africa; Dalu et al., 2016), terrestrial POM never dominates river POM except in winter and in after-flood spring time at the station located right upstream the tidal influence.
Hydrological processes are usual drivers of POM dynamics and its composition in natural as well as human-controlled systems. More specifically, the contribution of terrestrial POM to river POM is driven by natural flood (e.g. Ye et al., 2017), by lock-gate opening, or by water release (e.g., David et al., 2020; Kelso and Baker, 2020). The temporal variability of POC and PN composition in the Loire River is typically what is expected in temperate rivers, which makes this study a clear textbook case: terrestrial material is brought to the system during high river flow and phytoplankton dominates the POM composition during the rest of the year. Indeed, in the Loire River, terrestrial POC and PN are highly correlated to river flow, whereas phytoplankton POM and PN are correlated to pigment concentration (Figure 6). Interestingly, SPM is also tightly correlated to river flow and terrestrial POM, indicating similar dynamics and origin between terrestrial POM and SPM, and reflecting terrestrial erosion and soil leaching. These results are very similar to those of Hounshell et al. (2022) in the Neuse River (USA). Our results illustrate the role of river flow and flood events in structuring environmental processes that occur in rivers and especially the export of terrestrial inorganic and organic particles along the LOAC (Dalzell et al., 2007). These results also validate the approach we used to determine the signature of the sources, run the mixing models, and also validate the quantification of each source contribution to the POM mixture.
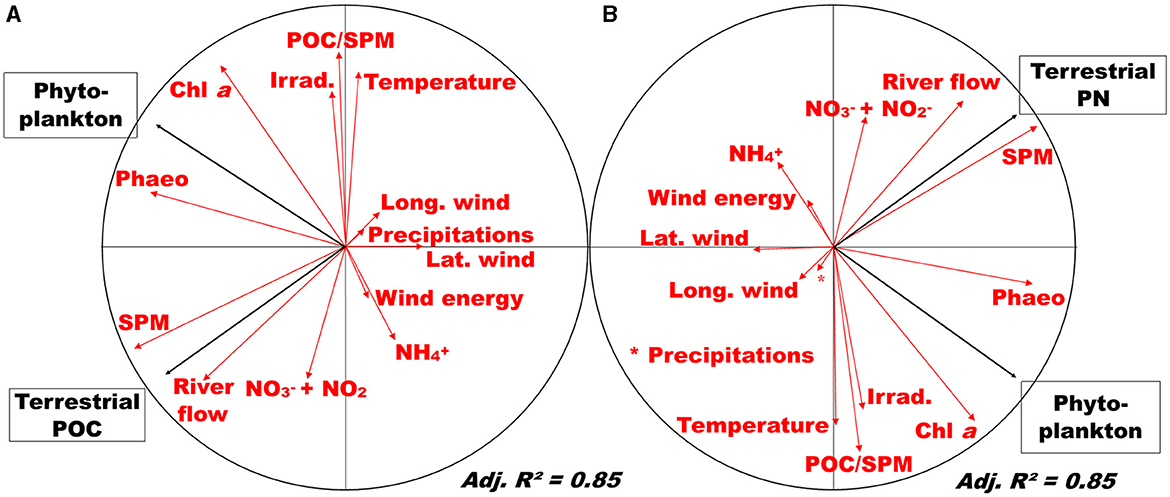
Figure 6. Redundancy analysis (correlation circle) of POM sources contributions (black arrows) and environmental parameters (red arrows) for (A) POC and (B) PN. SPM, suspended particulate material; Chl a, chlorophyll a; Phaeo, phaeopigments; NH4+, ammonium; NO, nitrite; NO, nitrate; Irrad., irradiance; Lat. Wind, latitudinal wind; long. wind, longitudinal wind.
3.5 Estimating fluxes of phytoplankton and terrestrial POC and PN
The transport of terrestrial material from land to sea through the rivers is an essential process of global biogeochemical cycles (Regnier et al., 2013), highlighting the need to quantify POC and PN riverine export. In the Loire River, the mean annual fluxes for the period October 2009–September 2012 amounted 40.6 103 t/year for POC and 5.65 103 t/year for PN. This is similar to fluxes found at the same site for the period 2011–2013 (53.8 103 tC/year, Minaudo et al., 2016), and in the lower range of the main Western-Europe rivers (e.g. Rhône River, 42.7 103 tC/year; Dordogne River, 46.1 103 tC/year; Po River, 57.3 103 tC/year; Garonne River, 72.5 103 tC/year; Rhine River, 89.7 103 tC/year; Ludwig et al., 1996 and references therein, Schäfer et al., 2002).
Depending on its origin and thus on its lability, POM is differently involved in biogeochemical and ecological fluxes like transport, remineralization or food web fueling (e.g. Etcheber et al., 2007; David et al., 2018), justifying the need to quantify POM fluxes but also fluxes of the different POM sources. In the Loire River the average export flux for the period October 2009–September 2012 was 22.2 103 and 18.4 103 t/year for phytoplankton and terrestrial POC, respectively, and 3.20 103 and 2.45 103 t/year for phytoplankton and terrestrial PN, respectively. Phytoplankton represented 55% and 57% of the total POC and PN fluxes, respectively. For the period 2011–2013 at the same site, Minaudo et al. (2016) estimated algal and detrital POC fluxes at 14.65 103 tC/year and 39.15 103 tC/year respectively. The proportion of algal POC found by these authors is lower than our estimate (27 vs. 55%) likely because of the difference in the approach used in each study [see discussion in Section 3.4; in Minaudo et al. (2016) algal POC is the POC of living and recently-dead algae, and detrital POC is terrestrial POC + detrital algae POC].
In the Loire River, fluxes varied over years with a factor of ~1.5 between the lowest and the highest values recorded during the period October 2010–September 2011 and the period October 2009–September 2010, respectively. Interestingly, the seasonality was different between phytoplankton and terrestrial POC as well as PN fluxes: depending of the year, 45–70% of the annual phytoplankton POC and PN fluxes are exported to the estuary in 20% of the time. These values reached 60–80% for terrestrial POC and PN (Supplementary Figure S1). This illustrates the pulsed nature of terrestrial fluxes in relation to pulsed river flow.
4 Conclusion and perspectives
Our study is one of the only studies quantifying the contribution of phytoplankton and terrestrial POM to riverine POM using equations-based determination of POM sources together with Bayesian mixing models. The originality of the approach described above lie on the equations-based determination of POM end-members that takes into account the temporal variability of phytoplankton signature and the reworking of terrestrial POM. The results highlight a clear seasonal dynamic in POM composition in the Loire River with highly bioavailable material during summer compared to winter, and estimated annual fluxes from the river to the estuary (at the river-estuary interface). Over the year, the Loire River POM was on average mostly composed of phytoplankton (65%) with less terrestrial POM contribution (35%) meaning this system is a producer of fresh organic material. The mean annual flux exported to the estuary for the studied period amounted 40.6 103 t/year for POC and 2.45 103 t/year for PN, with phytoplankton accounting for ~50% of the fluxes. POM composition followed a classic seasonal pattern: phytoplankton dominated during spring-summer (March–October), whereas a high proportion of terrestrial POM was brought in winter (November–February). Such seasonal patterns were explained by specific drivers for each source: high chlorophyll a and phaeopigments concentrations were correlated with high phytoplankton contribution, reflecting a high primary production during summer season, while high suspended particles concentrations and daily river flows were correlated with high terrestrial POM contribution, reflecting the role of hydrodynamics during winter.
Such results represent a significant contribution to the estimation of biogeochemical budgets along the LOAC; it helps to better understand organic matter cycle and degradation locally and provides seasonal baselines for food web studies, and provides essential information on the quantity of material brought from upstream to the estuaries. The lack of such data in the literature calls for more detailed estimations of phytoplankton and terrestrial POC and PN fluxes at the river-estuary interface, along with those of total POC and PN. Understanding precisely these fluxes will improve our knowledge of biogeochemical processes both locally and downstream within estuaries, and elucidate the role of rivers and estuaries as biogeochemical reactors in the land-ocean continuum. This study serves as a textbook case that could guide future research. Specifically, the methodology employed here to determine the isotopic and elemental signatures of POM sources and POM composition and fluxes, is widely applicable across a broad range aquatic systems along the LOAC. Such studies are crucial for refining our knowledge of the contributions made by rivers, estuaries, and coastal zones to the global carbon and nitrogen cycles.
Data availability statement
The raw data supporting the conclusions of this article will be made available by the authors, without undue reservation.
Author contributions
FF: Formal analysis, Investigation, Visualization, Writing – original draft. CL: Conceptualization, Supervision, Writing – review & editing. KC: Investigation, Writing – review & editing. AC: Investigation, Methodology, Writing – review & editing. LG-L: Investigation, Methodology, Writing – review & editing. NS: Conceptualization, Formal analysis, Investigation, Methodology, Supervision, Writing – original draft, Writing – review & editing.
Funding
The author(s) declare financial support was received for the research, authorship, and/or publication of this article. FF was granted by the French Ministère de l'Enseignement Supérieur et de la Recherche through the Ecole Doctorale Sciences et Environnement of Univ. Bordeaux.
Acknowledgments
This work is linked with the AMELIE project (GIPLE) leaded by Henri Etcheber and Florentina Moatar. The authors thanks Hervé Couët, Eric Lassalle, Anne Latapie for sampling and field processing of the samples, and Sabrina Bichon for PN analyses.
Conflict of interest
The authors declare that the research was conducted in the absence of any commercial or financial relationships that could be construed as a potential conflict of interest.
Publisher's note
All claims expressed in this article are solely those of the authors and do not necessarily represent those of their affiliated organizations, or those of the publisher, the editors and the reviewers. Any product that may be evaluated in this article, or claim that may be made by its manufacturer, is not guaranteed or endorsed by the publisher.
Supplementary material
The Supplementary Material for this article can be found online at: https://www.frontiersin.org/articles/10.3389/ffwsc.2024.1437431/full#supplementary-material
References
Bauer, J. E., Cai, W.-J., Raymond, P. A., Bianchi, T. S., Hopkinson, C. S., and Regnier, P. A. G. (2013). The changing carbon cycle of the coastal ocean. Nature 504, 61–70. doi: 10.1038/nature12857
Bianchi, T. S., and Bauer, J. E. (2011). “5.03 - Particulate organic carbon cycling and transformation,” in Treatise on Estuarine and Coastal Science, eds. E. Wolanski and D. McLusky (Waltham: Academic Press), 69–117. doi: 10.1016/B978-0-12-374711-2.00503-9
Bonin, P., Prime, A.-H., Galeron, M.-A., Guasco, S., and Rontani, J.-F. (2019). Enhanced biotic degradation of terrestrial POM in an estuarine salinity gradient: interactive effects of organic matter pools and changes of bacterial communities. Aquat. Microb. Ecol. 83, 147–159. doi: 10.3354/ame01908
Borcard, D., Legendre, P., and Gillet, F. (2011). Numerical Ecology with R. Springer. Available online at: https://link.springer.com/book/10.1007/978-1-4419-7976-6 (accessed June 2, 2022).
Bordovskiy, O. K. (1965). Accumulation of organic matter in bottom sediments. Mar. Geol. 3, 33–82. doi: 10.1016/0025-3227(65)90004-6
Brett, M. T., Bunn, S. E., Chandra, S., Galloway, A. W. E., Guo, F., Kainz, M. J., et al. (2017). How important are terrestrial organic carbon inputs for secondary production in freshwater ecosystems? Freshw. Biol. 62, 833–853. doi: 10.1111/fwb.12909
Coplen, T. B. (2011). Guidelines and recommended terms for expression of stable-isotope-ratio and gas-ratio measurement results. Rapid Commun. Mass Spectrom. 25, 2538–2560. doi: 10.1002/rcm.5129
Dagg, M., Benner, R., Lohrenz, S., and Lawrence, D. (2004). Transformation of dissolved and particulate materials on continental shelves influenced by large rivers: plume processes. Cont. Shelf Res. 24, 833–858. doi: 10.1016/j.csr.2004.02.003
Dalu, T., Richoux, N. B., and Froneman, P. W. (2016). Nature and source of suspended particulate matter and detritus along an austral temperate river–estuary continuum, assessed using stable isotope analysis. Hydrobiologia 767, 95–110. doi: 10.1007/s10750-015-2480-1
Dalzell, B. J., Filley, T. R., and Harbor, J. M. (2007). The role of hydrology in annual organic carbon loads and terrestrial organic matter export from a midwestern agricultural watershed. Geochim. Cosmochim. Acta 71, 1448–1462. doi: 10.1016/j.gca.2006.12.009
David, F., Marchand, C., Taillardat, P., Thành-Nho, N., and Meziane, T. (2018). Nutritional composition of suspended particulate matter in a tropical mangrove creek during a tidal cycle (Can Gio, Vietnam). Estuar. Coast. Shelf Sci. 200, 126–130. doi: 10.1016/j.ecss.2017.10.017
David, V., Sautour, B., Galois, R., and Chardy, P. (2006). The paradox high zooplankton biomass–low vegetal particulate organic matter in high turbidity zones: what way for energy transfer? J. Exp. Mar. Biol. Ecol. 333, 202–218. doi: 10.1016/j.jembe.2005.12.045
David, V., Tortajada, S., Savoye, N., Breret, M., Lachaussée, N., Philippine, O., et al. (2020). Impact of human activities on the spatio-seasonal dynamics of plankton diversity in drained marshes and consequences on eutrophication. Water Res. 170:115287. doi: 10.1016/j.watres.2019.115287
Descy, J.-P., Leitao, M., Everbecq, E., Smitz, J. S., and Deliège, J.-F. (2012). Phytoplankton of the River Loire, France: a biodiversity and modelling study. J. Plankton Res. 34, 120–135. doi: 10.1093/plankt/fbr085
Dubois, S., Savoye, N., Grémare, A., Plus, M., Charlier, K., Beltoise, A., et al. (2012). Origin and composition of sediment organic matter in a coastal semi-enclosed ecosystem: an elemental and isotopic study at the ecosystem space scale. J. Marine Syst. 94, 64–73. doi: 10.1016/j.jmarsys.2011.10.009
Dürr, H. H., Laruelle, G. G., van Kempen, C. M., Slomp, C. P., Meybeck, M., and Middelkoop, H. (2011). Worldwide typology of nearshore coastal systems: defining the estuarine filter of river inputs to the oceans. Estuar. Coasts 34, 441–458. doi: 10.1007/s12237-011-9381-y
Etcheber, H., Taillez, A., Abril, G., Garnier, J., Servais, P., Moatar, F., et al. (2007). Particulate organic carbon in the estuarine turbidity maxima of the Gironde, Loire and Seine estuaries: origin and lability. Hydrobiologia 588, 245–259. doi: 10.1007/s10750-007-0667-9
Falkowski, P. G., Barber, R. T., and Smetacek, V. (1998). Biogeochemical controls and feedbacks on ocean primary production. Science 281, 200–206. doi: 10.1126/science.281.5374.200
Field, C. B., Behrenfeld, M. J., Randerson, J. T., and Falkowski, P. (1998). Primary production of the biosphere: integrating terrestrial and oceanic components. Science 281, 237–240. doi: 10.1126/science.281.5374.237
Fry, B. (1996). 13C/12C fractionation by marine diatoms. Mar. Ecol. Prog. Ser. 134, 283–294. doi: 10.3354/meps134283
García-Martín, E. E., Sanders, R., Evans, C. D., Kitidis, V., Lapworth, D. J., Spears, B. M., et al. (2023). Sources, composition, and export of particulate organic matter across British estuaries. J. Geophys. Res. Biogeosci. 128:e2023JG007420. doi: 10.1029/2023JG007420
Gawade, L., Krishna, M. S., Sarma, V. V. S. S., Hemalatha, K. P. J., and Venkateshwara Rao, Y. (2018). Spatio-temporal variability in the sources of particulate organic carbon and nitrogen in a tropical Godavari estuary. Estuar. Coast. Shelf Sci. 215, 20–29. doi: 10.1016/j.ecss.2018.10.004
Glibert, P. M., Middelburg, J. J., McClelland, J. W., and Jake Vander Zanden, M. (2019). Stable isotope tracers: enriching our perspectives and questions on sources, fates, rates, and pathways of major elements in aquatic systems. Limnol. Oceanogr. 64, 950–981. doi: 10.1002/lno.11087
Godin, P., Macdonald, R. W., Kuzyk, Z. Z. A., Goñi, M. A., and Stern, G. A. (2017). Organic matter compositions of rivers draining into Hudson Bay: present-day trends and potential as recorders of future climate change. J. Geophys. Res. Biogeosci. 122, 1848–1869. doi: 10.1002/2016JG003569
Golubkov, M. S., Nikulina, V. N., Tiunov, A. V., and Golubkov, S. M. (2020). Stable C and N isotope composition of suspended particulate organic matter in the neva estuary: the role of abiotic factors, productivity, and phytoplankton taxonomic composition. J. Mar. Sci. Eng. 8:959. doi: 10.3390/jmse8120959
Goñi, M. A., Voulgaris, G., and Kim, Y. H. (2009). Composition and fluxes of particulate organic matter in a temperate estuary (Winyah Bay, South Carolina, USA) under contrasting physical forcings. Estuar. Coast. Shelf Sci. 85, 273–291. doi: 10.1016/j.ecss.2009.08.013
Grosbois, C., Négrel, P., Grimaud, D., and Fouillac, C. (2001). An overview of dissolved and suspended matter fluxes in the loire river basin: natural and anthropogenic inputs. Aquat. Geochem. 7, 81–105. doi: 10.1023/A:1017518831860
Higueras, M., Kerhervé, P., Sanchez-Vidal, A., Calafat, A., Ludwig, W., Verdoit-Jarraya, M., et al. (2014). Biogeochemical characterization of the riverine particulate organic matter transferred to the NW Mediterranean Sea. Biogeosciences 11, 157–172. doi: 10.5194/bg-11-157-2014
Hou, P., Eglinton, T. I., Yu, M., Montluçon, D. B., Haghipour, N., Zhang, H., et al. (2021). Degradation and aging of terrestrial organic carbon within estuaries: biogeochemical and environmental implications. Environ. Sci. Technol. 55, 10852–10861. doi: 10.1021/acs.est.1c02742
Hounshell, A. G., Fegley, S. R., Hall, N. S., Osburn, C. L., and Paerl, H. W. (2022). Riverine discharge and phytoplankton biomass control dissolved and particulate organic matter dynamics over spatial and temporal scales in the Neuse River Estuary, North Carolina. Estuar. Coasts 45, 96–113. doi: 10.17615/wd2e-7595
Jones, J. I., Collins, A. L., Naden, P. S., and Sear, D. A. (2012). The relationship between fine sediment and macrophytes in rivers. River Res. Appl. 28, 1006–1018. doi: 10.1002/rra.1486
Kelso, J. E., and Baker, M. A. (2020). Organic matter is a mixture of terrestrial, autochthonous, and wastewater effluent in an Urban River. Front. Environ. Sci. 7:202. doi: 10.3389/fenvs.2019.00202
Koroleff, F. (1969). Determination of total nitrogen in natural waters by means of persulfate oxidation. ASC 1969 - C - Hydrography committee. doi: 10.17895/ices.pub.21517881.v1
Latapie, A., Camenen, B., Rodrigues, S., Paquier, A., Bouchard, J. P., and Moatar, F. (2014). Assessing channel response of a long river influenced by human disturbance. Catena 121, 1–12. doi: 10.1016/j.catena.2014.04.017
Lebreton, B., Beseres Pollack, J., Blomberg, B., Palmer, T. A., Adams, L., Guillou, G., et al. (2016). Origin, composition and quality of suspended particulate organic matter in relation to freshwater inflow in a South Texas estuary. Estuar. Coast. Shelf Sci. 170, 70–82. doi: 10.1016/j.ecss.2015.12.024
Lheureux, A., David, V., Del Amo, Y., Soudant, D., Auby, I., Ganthy, F., et al. (2022). Bi-decadal changes in nutrient concentrations and ratios in marine coastal ecosystems: the case of the Arcachon bay, France. Prog. Oceanog. 201, 102–740. doi: 10.1016/j.pocean.2022.102740
Liénart, C., Savoye, N., Bozec, Y., Breton, E., Conan, P., David, V., et al. (2017). Dynamics of particulate organic matter composition in coastal systems: a spatio-temporal study at multi-systems scale. Prog. Oceanogr. 156, 221–239. doi: 10.1016/j.pocean.2017.03.001
Liénart, C., Savoye, N., Conan, P., David, V., Barbier, P., Bichon, S., et al. (2020). Relationship between bacterial compartment and particulate organic matter (POM) in coastal systems: an assessment using fatty acids and stable isotopes. Estuar. Coast. Shelf Sci. 239:106720. doi: 10.1016/j.ecss.2020.106720
Liénart, C., Savoye, N., David, V., Ramond, P., Rodriguez Tress, P., Hanquiez, V., et al. (2018). Dynamics of particulate organic matter composition in coastal systems: forcing of spatio-temporal variability at multi-systems scale. Prog. Oceanogr. 162, 271–289. doi: 10.1016/j.pocean.2018.02.026
Lorrain, A., Savoye, N., Chauvaud, L., Paulet, Y.-M., and Naulet, N. (2003). Decarbonation and preservation method for the analysis of organic C and N contents and stable isotope ratios of low-carbonated suspended particulate material. Anal. Chim. Acta 491, 125–133. doi: 10.1016/S0003-2670(03)00815-8
Lowe, A. T., Galloway, A. W. E., Yeung, J. S., Dethier, M. N., and Duggins, D. O. (2014). Broad sampling and diverse biomarkers allow characterization of nearshore particulate organic matter. Oikos 123, 1341–1354. doi: 10.1111/oik.01392
Lu, L., Cheng, H., Pu, X., Wang, J., Cheng, Q., and Liu, X. (2016). Identifying organic matter sources using isotopic ratios in a watershed impacted by intensive agricultural activities in Northeast China. Agric. Ecosyst. Environ. 222, 48–59. doi: 10.1016/j.agee.2015.12.033
Ludwig, W., Probst, J.-L., and Kempe, S. (1996). Predicting the oceanic input of organic carbon by continental erosion. Glob. Biogeochem. Cycles 10, 23–41. doi: 10.1029/95GB02925
Marshall, D. A., La Peyre, M. K., Palmer, T. A., Guillou, G., Sterba-Boatwright, B. D., Beseres Pollack, J., et al. (2021). Freshwater inflow and responses from estuaries across a climatic gradient: an assessment of northwestern Gulf of Mexico estuaries based on stable isotopes. Limnol. Oceanogr. 66, 3568–3581. doi: 10.1002/lno.11899
Meybeck, M. (1988). “How to establish and use world budgets of riverine materials,” in Physical and Chemical Weathering in Geochemical Cycles, eds. A. Lerman and M. Meybeck (Dordrecht: Springer Netherlands), 247–272. doi: 10.1007/978-94-009-3071-1_12
Middelburg, J. J., and Herman, P. M. J. (2007). Organic matter processing in tidal estuaries. Mar. Chem. 106, 127–147. doi: 10.1016/j.marchem.2006.02.007
Miller, R. J., Page, H. M., and Brzezinski, M. A. (2013). δ13C and δ15N of particulate organic matter in the Santa Barbara Channel: drivers and implications for trophic inference. Mar. Ecol. Progr. Ser. 474, 53–66. doi: 10.3354/meps10098
Minaudo, C., Abonyi, A., Leitão, M., Lançon, A. M., Floury, M., Descy, J.-P., et al. (2021). Long-term impacts of nutrient control, climate change, and invasive clams on phytoplankton and cyanobacteria biomass in a large temperate river. Sci. Total Environ. 756:144074. doi: 10.1016/j.scitotenv.2020.144074
Minaudo, C., Meybeck, M., Moatar, F., Gassama, N., and Curie, F. (2015). Eutrophication mitigation in rivers: 30 years of trends in spatial and seasonal patterns of biogeochemistry of the Loire River (1980–2012). Biogeosciences 12, 2549–2563. doi: 10.5194/bg-12-2549-2015
Minaudo, C., Moatar, F., Coynel, A., Etcheber, H., Gassama, N., and Curie, F. (2016). Using recent high-frequency surveys to reconstitute 35 years of organic carbon variations in a eutrophic lowland river. Environ. Monit. Assess. 188:41. doi: 10.1007/s10661-015-5054-9
Palinkas, C. M., Testa, J. M., Cornwell, J. C., Li, M., and Sanford, L. P. (2019). Influences of a River Dam on delivery and fate of sediments and particulate nutrients to the adjacent estuary: case study of conowingo dam and Chesapeake Bay. Estuar. Coasts 42, 2072–2095. doi: 10.1007/s12237-019-00634-x
Parnell, A. (2021). simmr: A Stable Isotope Mixing Model. Available online at: https://CRAN.R-project.org/package=simmr (accessed July 17, 2024).
Pelage, L., Ferreira, V., Lucena-Frédou, F., Ferreira, G. V. B., Gonzalez, J. G., Viana, A. P., et al. (2022). Estuarine food web structure and relative importance of organic matter sources for fish in a highly connected Northeastern Brazil ecotone. Estuar. Coast. Shelf Sci. 275:107972. doi: 10.1016/j.ecss.2022.107972
Perdue, E. M., and Koprivnjak, J.-F. (2007). Using the C/N ratio to estimate terrigenous inputs of organic matter to aquatic environments. Estuar. Coast. Shelf Sci. 73, 65–72. doi: 10.1016/j.ecss.2006.12.021
Phillips, D. L., Inger, R., Bearhop, S., Jackson, A. L., Moore, J. W., Parnell, A. C., et al. (2014). Best practices for use of stable isotope mixing models in food-web studies. Can. J. Zool. 92, 823–835. doi: 10.1139/cjz-2014-0127
Pradhan, U. K., Wu, Y., Shirodkar, P. V., Kumar, H. S., and Zhang, J. (2020). Connecting land use–land cover and precipitation with organic matter biogeochemistry in a tropical river–estuary system of western peninsular India. J. Environ. Manag. 271:110993. doi: 10.1016/j.jenvman.2020.110993
Pradhan, U. K., Wu, Y., Shirodkar, P. V., Zhang, J., and Zhang, G. (2014). Sources and distribution of organic matter in thirty five tropical estuaries along the west coast of India-a preliminary assessment. Estuar. Coast. Shelf Sci. 151, 21–33. doi: 10.1016/j.ecss.2014.09.010
Regnier, P., Friedlingstein, P., Ciais, P., Mackenzie, F. T., Gruber, N., Janssens, I. A., et al. (2013). Anthropogenic perturbation of the carbon fluxes from land to ocean. Nat. Geosci. 6, 597–607. doi: 10.1038/ngeo1830
Sanchez-Vidal, A., Higueras, M., Marti, E., Liquete, C., Calafat, A., Kerherv,é, P., et al. (2013). Riverine transport of terrestrial organic matter to the North Catalan margin, NW Mediterranean Sea. Progr. Oceanogr. 118, 71–80. doi: 10.1016/j.pocean.2013.07.020
Sato, T., Miyajima, T., Ogawa, H., Umezawa, Y., and Koike, I. (2006). Temporal variability of stable carbon and nitrogen isotopic composition of size-fractionated particulate organic matter in the hypertrophic Sumida River Estuary of Tokyo Bay, Japan. Estuar. Coast. Shelf Sci. 68, 245–258. doi: 10.1016/j.ecss.2006.02.007
Savoye, N., Aminot, A., Tréguer, P., Fontugne, M., Naulet, N., and Kérouel, R. (2003). Dynamics of particulate organic matter d15N and d13C during spring phytoplankton blooms in a macrotidal ecosystem (Bay of Seine, France). Mar. Ecol. Progr. Ser. 255, 27–41. doi: 10.3354/meps255027
Savoye, N., David, V., Morisseau, F., Etcheber, H., Abril, G., Billy, I., et al. (2012). Origin and composition of particulate organic matter in a macrotidal turbid estuary: the Gironde Estuary, France. Estuar. Coast. Shelf Sci. 108, 16–28. doi: 10.1016/j.ecss.2011.12.005
Schäfer, J., Blanc, G., Lapaquellerie, Y., Maillet, N., Maneux, E., and Etcheber, H. (2002). Ten-year observation of the Gironde tributary fluvial system: fluxes of suspended matter, particulate organic carbon and cadmium. Mar. Chem. 79, 229–242. doi: 10.1016/S0304-4203(02)00066-X
Sigman, D. M., DiFiore, P. J., Hain, M. P., Deutsch, C., Wang, Y., Karl, D. M., et al. (2009). The dual isotopes of deep nitrate as a constraint on the cycle and budget of oceanic fixed nitrogen. Deep-Sea Res. 56, 1419–1439. doi: 10.1016/j.dsr.2009.04.007
St. Pierre, K. A., Hunt, B. P. V., Giesbrecht, I. J. W., Tank, S. E., Lertzman, K. P., Del Bel Belluz, J., et al. (2022). Seasonally and spatially variable organic matter contributions from watershed, marine macrophyte, and Pelagic Sources to the Northeast Pacific Coastal Ocean Margin. Front. Mar. Sci. 9:863209. doi: 10.3389/fmars.2022.863209
Strickland, J. D. H., and Parsons, T. R. (1972). A Practical Handbook of Seawater Analysis, 2nd edition. Ottawa, ON: Fisheries Research Board of Canada. doi: 10.25607/OBP-1791
Sun, X., Fan, D., Cheng, P., Hu, L., Sun, X., Guo, Z., et al. (2021). Source, transport and fate of terrestrial organic carbon from Yangtze River during a large flood event: insights from multiple-isotopes (δ13C, δ15N, Δ14C) and geochemical tracers. Geochim. Cosmochim. Acta 308, 217–236. doi: 10.1016/j.gca.2021.06.004
Thornton, S. F., and McManus, J. (1994). Application of organic carbon and nitrogen stable isotope and C/N ratios as source indicators of organic matter provenance in estuarine systems: evidence from the Tay Estuary, Scotland. Estuar. Coast. Shelf Sci. 38, 219–233. doi: 10.1006/ecss.1994.1015
Tunēns, J., Aigars, J., Poikāne, R., Jurgensone, I., Labucis, A., Labuce, A., et al. (2022). Stable carbon and nitrogen isotope composition in suspended particulate matter reflects seasonal dynamics of phytoplankton assemblages in the Gulf of Riga, Baltic Sea. Estuar. Coast. 45, 2112–2123. doi: 10.1007/s12237-022-01071-z
Wood, E. D., Armstrong, F. J., and Richards, F. A. (1967). Determination of nitrate in sea water by cadmium-copper reduction to nitrite. J. Mar. Biol. Assoc. U. K. 47, 23–31. doi: 10.1017/S002531540003352X
Yan, X., Yang, J.-Y. T., Xu, M. N., Wang, H., Dai, M., and Kao, S.-J. (2022). Nitrogen isotope constraint on the zonation of multiple transformations between dissolved and particulate organic nitrogen in the Changjiang plume. Sci. Total Environ. 818:151678. doi: 10.1016/j.scitotenv.2021.151678
Ye, F., Guo, W., Shi, Z., Jia, G., and Wei, G. (2017). Seasonal dynamics of particulate organic matter and its response to flooding in the Pearl River Estuary, China, revealed by stable isotope (δ13C and δ15N) analyses. J. Geophys. Res. Oceans 122, 6835–6856. doi: 10.1002/2017JC012931
Yentsch, C. S., and Menzel, D. W. (1963). A method for the determination of phytoplankton chlorophyll and phaeophytin by fluorescence. Deep-Sea Res. 10, 221–231. doi: 10.1016/0011-7471(63)90358-9
Keywords: carbon and nitrogen biogeochemistry, stable isotopes, mixing models, land-ocean aquatic continuum, particulate organic matter, quantification
Citation: Ferchiche F, Liénart C, Charlier K, Coynel A, Gorse-Labadie L and Savoye N (2024) Quantifying particulate organic matter: source composition and fluxes at the river-estuary interface. Front. Freshw. Sci. 2:1437431. doi: 10.3389/ffwsc.2024.1437431
Received: 23 May 2024; Accepted: 10 July 2024;
Published: 30 July 2024.
Edited by:
James E. Garvey, Southern Illinois University Carbondale, United StatesReviewed by:
Matthew Cooper, Grand Valley State University, United StatesDaniel E. Kroes, Lower Mississippi Gulf Water Science Center, United States
Copyright © 2024 Ferchiche, Liénart, Charlier, Coynel, Gorse-Labadie and Savoye. This is an open-access article distributed under the terms of the Creative Commons Attribution License (CC BY). The use, distribution or reproduction in other forums is permitted, provided the original author(s) and the copyright owner(s) are credited and that the original publication in this journal is cited, in accordance with accepted academic practice. No use, distribution or reproduction is permitted which does not comply with these terms.
*Correspondence: Florian Ferchiche, Zmxvcmlhbi5mZXJjaGljaGVAdS1ib3JkZWF1eC5mcg==