 Anil Kumar
 Khilendra Singh Kanwal
 Shiv Paul
 Raj Kumar Verma
95% of researchers rate our articles as excellent or good
Learn more about the work of our research integrity team to safeguard the quality of each article we publish.
Find out more
ORIGINAL RESEARCH article
Front. For. Glob. Change , 03 April 2025
Sec. Temperate and Boreal Forests
Volume 8 - 2025 | https://doi.org/10.3389/ffgc.2025.1566614
The Himalayas are a crucial centre of biological diversity, supporting a wide range of habitats of floral and faunal communities. Conserving this ecosystem is vital for sustaining life on Earth, including human well-being. Today, maintaining forest ecosystems in the Indian Himalayan Region (IHR) is indispensable not only for the endemic species, but also for the conservation of global biodiversity. The current study covers Talra Wildlife Sanctuary of northwest Himalaya to quantify the biomass and carbon stock in the conifer and broadleaved forest. The data acquisition was performed through random sampling using 50 × 50 m plots along the different altitudinal gradients. The plants having a diameter at breast height (dbh) >10 cm at a 1.37 girth height were identified, enumerated and measured. The result showed that a total of 14 forest communities were specified based on IVI. The total carbon stock values were found to be varied consistently from 131.5 to 357.7 Mg ha–1 in the TWS. The Picea smithiana-Abies pindrow (Ps-Ap) mixed forest community contained a highest amount of carbon stock, 357.7 ± 48.3 Mg ha–1; followed by Picea smithiana (Ps) and Abies Pindrow (Ap) dominant, respectively. The understory biomass was also found in a range from 2.10 to 4.4 Mg ha–1 (avg. 3.34 ± 0.66Mg ha–1). The litter biomass was in a range of 1.2–2.9 Mg ha–1 (avg. 2.04 ± 0.48 Mg ha–1). Soil properties showed that on the top layer (0–15 cm), soil moisture (%) and soil organic carbon (%) were 30.2 ± 4.7 (%) and 2.9 ± 0.55 (%), whereas 21.3 ± 4.8 (%) and 1.9 ± 0.53 (%), respectively, at a depth of 15–30 cm. The correlation coefficient indicated a positive correlation (r = 0.85; p < 0.05) between tree carbon stock and tree density.
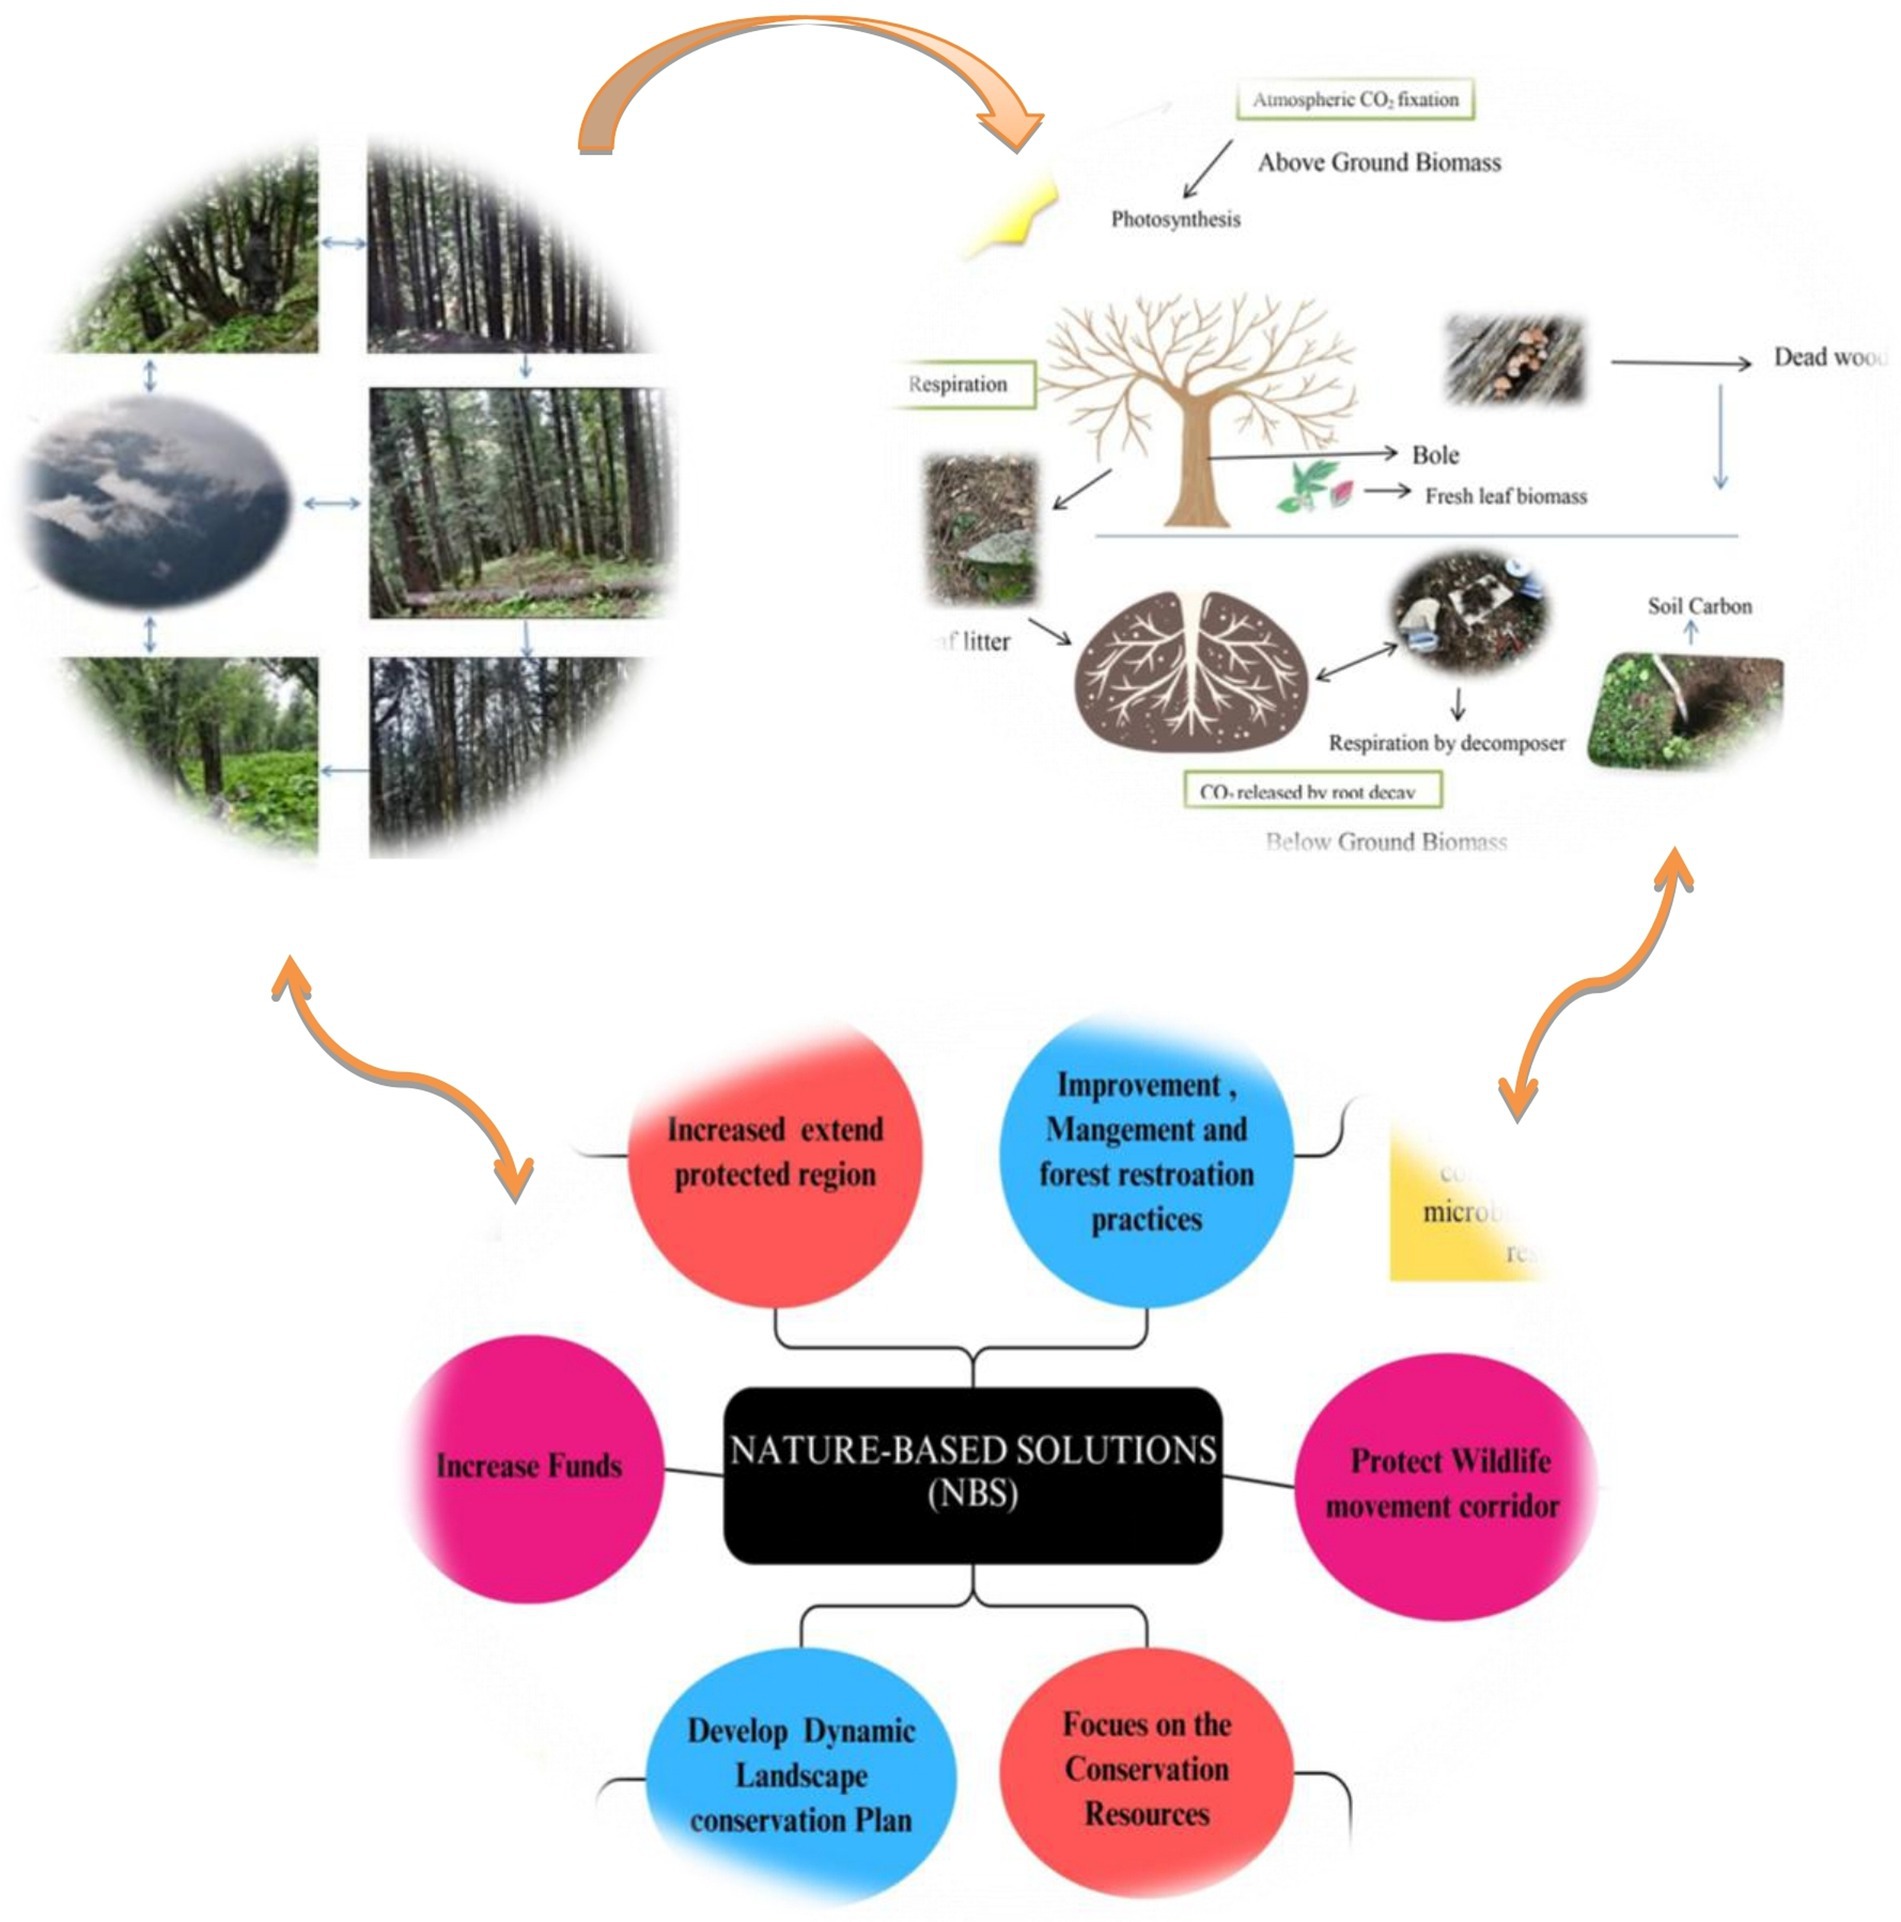
Graphical Abstract.
Vegetation patterns around the globe have deteriorated to varying degrees over time due to multiple human-induced activities (Pimm et al., 2014; Gaury and Devi, 2017; Altaf et al., 2022). The forest ecosystem of the Indian Himalayan Region (IHR) has also been affected to a great extent as a result of various commercial and industrial initiatives and expanding Himalayan cities and towns as well (Kumar and Chopra, 2009; Tiwari et al., 2018; Jana et al., 2020). Increasing population pressure, agricultural intensification, expansion of hydro project construction in hilly areas, land degradation practices, and urban development in the Himalayan states have been the major threats to the mountain region (Dhyani and Dhyani, 2016; Baboo et al., 2017; Bisht et al., 2022). These factors influence the carrying capacity of the IHR. The overexploitation of natural resources has created a big gap between the demand and supply of goods and services (Bisht et al., 2023; Fartyal et al., 2025). As a result, the natural habitat and the number of consequential species have shifted to a marginalized scale, which is of grave concern (Gupta et al., 2019; Olokeogun and Kumar, 2020; Mishra et al., 2020; Dhimal et al., 2021; Kumar et al., 2021). Efforts are being made for forest conservation, but ecosystem manipulation has become a severe obstacle from earlier decades (Ren et al., 2012).
Forest ecosystems worldwide are considered one of the most significant terrestrial carbon sinks (Ahirwal et al., 2021; Kumar et al., 2023). The Indian Himalayan Forest Ecosystem (IHFE) comprises different forest types such as western mixed coniferous, kharsu oak, moist temperate deciduous, subalpine, and alpine grassland forests; therefore, having a magnificent potential to sink carbon (Ahirwal et al., 2021; Gogoi et al., 2022). Maintaining ecosystem components and species functions is significant for the longevity and resilience of IHFE (Singh, 2006; Mehta et al., 2020). Multiple dominant species, including coniferous and broad-leaf tree species, play a crucial role in carbon sequestration and mitigation strategies (Sharma et al., 2011; Bohara et al., 2018). The trees utilize CO2 during photosynthesis, transforming it into O2 and virtually sustaining its presence in the ambient air (Lambers et al., 2019). Notably, through photosynthesis, trees utilize CO2 from the environment and keep it as organic compounds (Das et al., 2023). Over time, as the plants and litter fragments decompose, the carbon is retained and integrated into the soil as organic matter (Mamidala et al., 2023). This process is vital for maintaining the humus and quality of the soil, contributing to the overall health of the forest ecosystem and environment (Vance et al., 1987).
The meticulous computation of forest carbon stock in the Indian forest ecosystem has demonstrated an increasing trend recently. According to the Forest Survey of India (FSI), the carbon stock in forests increased from 6.663 million tons to 7,204 million tons during ca. 2011. Moreover, attending sensation has also revealed a notable increase of 541 million tons between ca. 2011 and 2021 (FSI, 20211). Albeit, this is a positive, but it seems insufficient because there is a surplus of possibilities to enhance the carbon sink potential in the Indian forest ecosystem. There is an accountability to accelerate acceptable forest rehabilitation practices and devise a robust composition for forest carbon stock and biodiversity conservation in the Indian forest ecosystem (Sheikh et al., 2020; Haq et al., 2023). For instance, specifically due to topographic attributes of the IHFE and cost constraint, the vegetation and biomass studies have broadly been executed only up to the approachable zones (Bisht and Thakur, 2021; Ahirwal et al., 2021; Kumar et al., 2024a). However, there is a pressing need to explore the uncharted provinces within the IHFE to determine the optimal biomass and carbon sink capacities of the forest ecosystem (Devi and Lepcha, 2023; Kumar et al., 2024a). Hence, possessing all these attributes in the marble, the current study is motivated by the importance of biomass and carbon stock in the Talra Wildlife Sanctuary, which serves various purposes, such as incentivizing intervention strategies to strengthen the ecological and carbon science of the IHFE. Due to remoteness, stratigraphic constraints, and lack of previous studies in the TWS, anticipating the forest community’s patterns and forest biomass carbon stock in the TWS is essential (Kumar et al., 2024a). The current study tried to investigate the answer to the following research questions (RQs):
• How does biomass and carbon stock distribution vary across different altitudinal and habitat types in TWS?
• What role do soil properties (e.g., soil depth, moisture %, organic carbon (%), and bulk density) play in influencing soil carbon stock?
The hypothesis of the current study is that there is no significant relationship between soil properties and tree biomass distribution across different altitudinal gradients in TWS.
Talra Wildlife Sanctuary lies in Jubbal and Chopal tehsils of district Shimla, Himachal Pradesh, northwest Himalaya, India, at 30° 57’ N to 31° 03’ N Latitude, 77° 43′ E to 77° 48′ E Longitude, and an elevation of 1,395–3392 m above mean sea level recorded through Garmin GPSMAP 64sc with 3 m accuracy (Garmin Ltd., 2016) (Figure 1). The Sanctuary encompasses spectacular mountains, small valleys, and lush green alpine pastures, sprinkled with multifarious and multi-colored medicinal plants. The high altitudes and different types of forests and grasslands in the Sanctuary create natural scenic beauty and cold weather conditions. Heavy winter snowfall makes tribal Gujjar community or other locals inaccessible for a few months. The Sanctuary is located at a high altitude in the Pabbar Valley, one of the most beautiful places and hunting points since British times. The Government of Himachal Pradesh (India) initiated the conservation process of this forest through notification No.5–11/70-\SF dated 27-3-1974. The administration has included the Kanger Protected Forest in Tharoch and the Protected Demarcated Forest in the Jubbal region, including Chajpur, Sashan, and Kashta (Figure 1), thereby forming the Talra Wildlife Sanctuary. The government also carried out essential steps to strengthen and improve the administration of the Sanctuary until the region was transferred to the concerned wildlife authorities. Afterwards, protected areas in Tharoch and Jubbal were notified as Talra Wildlife Sanctuary in 1999; vide notification FFE-(B) F 6–21/99. Afterward, the government transferred the area to the Wildlife Wing of the Himachal Pradesh Forest Department in 1987–88. The Wildlife Range office was established at Tharoch by adding a new 6.48 km2 region to the Sanctuary. Thus, currently, the Sanctuary comprises a total area of about 46.48 km2 (HP Forest Department, 2020).
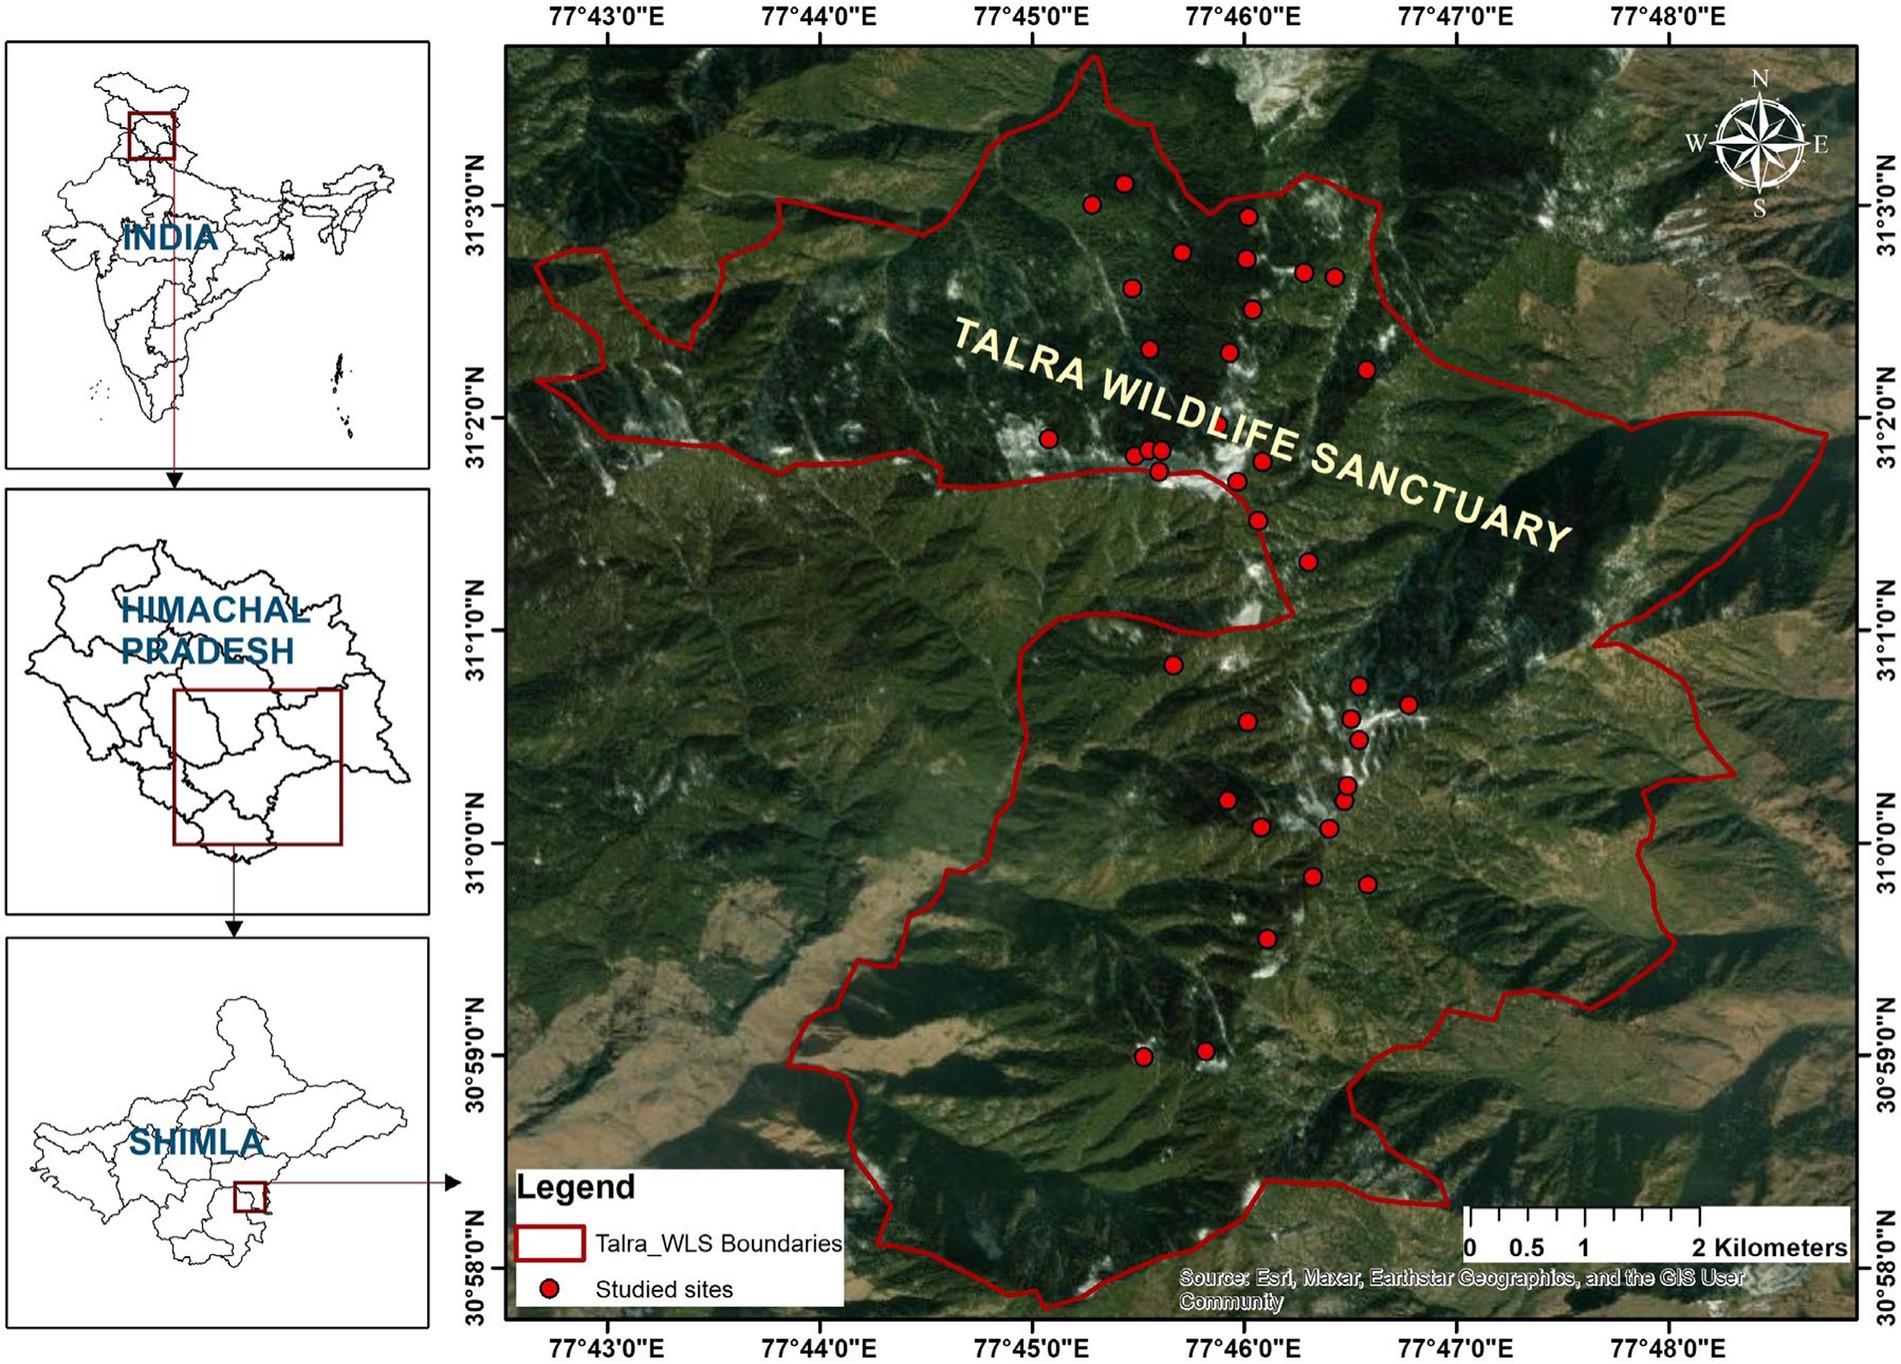
Figure 1. Location of the Talra Wildlife Sanctuary.
The Talra Wildlife Sanctuary lies in the lesser Himalayan. The Sanctuary is nestled in a small V-shaped valley and small patches of the thach, i.e., Talra thach at a height of 3392 msL and Chajpur thach at 3336 msL (Kumar et al., 2024b). The geology includes granite, quartzite, muscovite, schist, chlorite, and magnetite, types of rocks belonging to the Jutogh formation of the Archean age. The rock is dark with yellow-green tones. The soil is profoundly loamy and fertile, with a fine texture, loamy to loamy-brown, and podzolic; this is favorable for the oak, fir, and spruce forests. The top alpine pasture, which is locally called Talra thach, is located in the middle and top peak of the Sanctuary. It is the passes and dividing lines between the Chajpur and Tharoch, and in the past, it was the divider lines between the Jubbal and Tharoch states. During British times, the reins were passed through this link to communicate between the Jubbal and Tharoch states for business.
The TWS typically exhibits sub-alpine and alpine pastures. Most of the area is covered with mixed broad and conifer forest stands. During winter, most of the regions of the Sanctuary get covered with snow from Chajpur to the Talra thach. Rainfall is mostly confined to the rainy season. The Talra Wildlife Sanctuary has been surrounded by Chaupal, Jubbal, and Rohru tehsils in the Shimla district. The years 2022 and 2023 showed the average rainfall patterns of these regions. The data showed that the highest rainfall occurred during the monsoon months of July and August, mainly in Rohru, which recorded an extraordinary 1,046 mm rainfall in July 2023. In contrast, rainfall was consistently low in all locations in the winter months (November to February). Annual comparisons indicated that Chaupal obtained comparable average rainfall in 2022 and 2023, respectively, while Jubbal noticed a slight decline in 2023. In contrast, the Rohru region experienced significant growth compared to the Chaupal and Jubbal regions during 2023 (Figure 2a) (IMD, 2024). However, the average monthly rainfall of the three regions, Chaupal, Jubbal, and Rohru, illustrates the observation of the TWS region (Figure 2b)2.
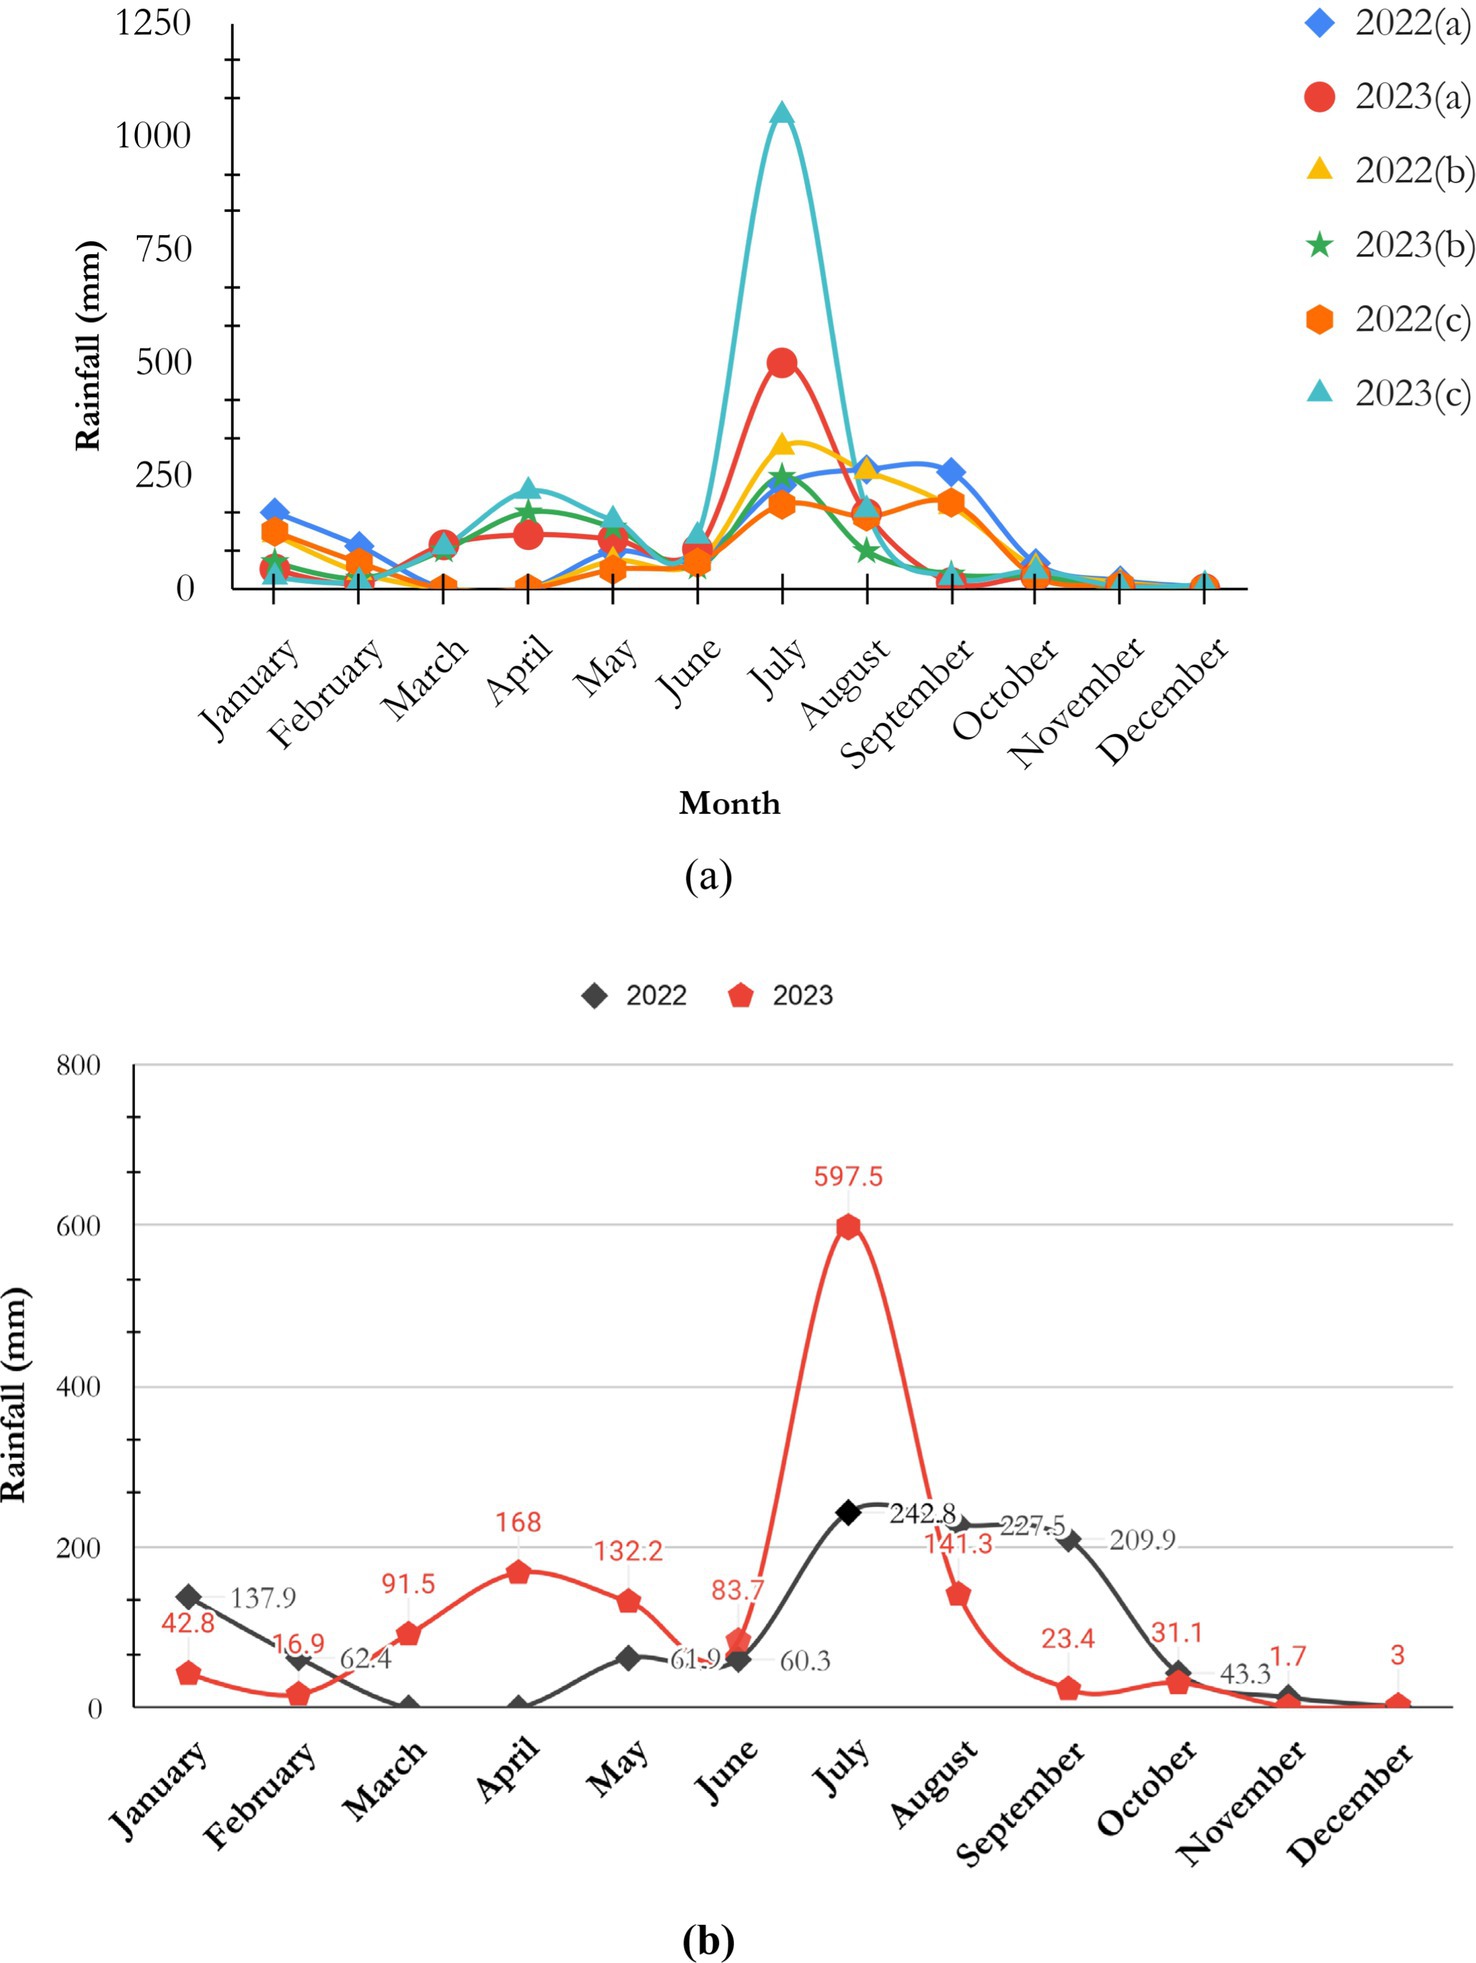
Figure 2. (a) Illustrates the average rainfall patterns for Chaupal (a), Jubbal (b), and Rohru (c), while (b) presents the average rainfall of all three regions collectively, representing the Pabbar Valley, which includes the Talra Wildlife Sanctuary (source: https://dsp.imdpune.gov.in).
The different topographical variations, small valleys, unique geological features, different habitat types, slopes, and aspects of the TWS create favorable conditions and unique habitats for the rare and endemic species and various vegetation types in the Sanctuary. Talra Wildlife Sanctuary’s vegetation types lie in 2B Himalayan in the north-western Himalayan biogeographic zone comprising Himalayan moist temperate forest, including Moist temperate deciduous forest, kharsu oak forest, western Himalayan upper oak fir forest, western mixed conifer forest, and moist alpine scrubs, including dwarf rhododendron scrub forest (Champion and Seth, 1968). The major species in the TWS ecosystems are Abies pindrow, Aesculus indica, Corylus jacquemontii, Picea smithiana, Quercus semecarpifolia, Cedrus deodara, Betula alnoides, Juglans regia, Pinus wallichiana, Prunus cornuta, Rhododendron arboreum, Taxus contorta, etc. The major alpine ecosystem grassland vegetation is mainly characterized by alpine grasses, herbs, scrubs, and sedges. The dominant alpine herbs are Sibbaldia cuneata, Trifolium repens, Geum elatum, Ligularia amplexicaulis, Anemonastrum obtusilobum, Fragaria nubicola, Galium acutum, Poa alpina, Poa annua, Potentilla atrosanguinea, Rumex acetosa, etc. The significant medicinal plant species are Achillea millefolium, Aconitum heterophyllum, Aconitum violaceum, Anaphalis triplinervis, Bistorta amplexicaulis, Bupleurum longicaule, Caltha palustris, Capsella bursa-pastoris, Delphinium vestitum, Dactylorhiza hatagirea, Fritillaria cirrhosa, Meconopsis aculeata, Morina longifolia, Rubia cordifolia, Trillium govanianum, etc.
The main faunal diversity includes Himalayan monal, koklass, leopard, Asiatic black bear, Indian porcupine, yellow-throated marten, etc. The Sanctuary is a habitat for multiple bird species. Mahabal (2000) studied bird species in the TWS and found 61 species belonging to 19 families. Of these, 32 species were endemic to the Himalayan region. Furthermore, major associated villages near the Sanctuary are Chajpur, Nandpur, Sainj, Sansog, Saraji, Salana, Batar, Gorar, Auli, Tharoch, and Sashan.
The habitat of the selected sites was determined based on physical characteristics and the dominant vegetation types (Figure 3). Sites with closed canopies and forest cover with high moisture content are considered shaded, moist habitats. However, sites with more than 50% boulders and rocks have been considered boulder habitats. The construction of forest communities was outlined based on the importance value index (IVI). The tree species that had contributed ≥50% (150) values of the (300) IVI were classified as pure communities of that particular species. In addition, sites where two or more species contributed ≥50% to the total IVI were classified as mixed communities of those species (Wani and Pant, 2023).
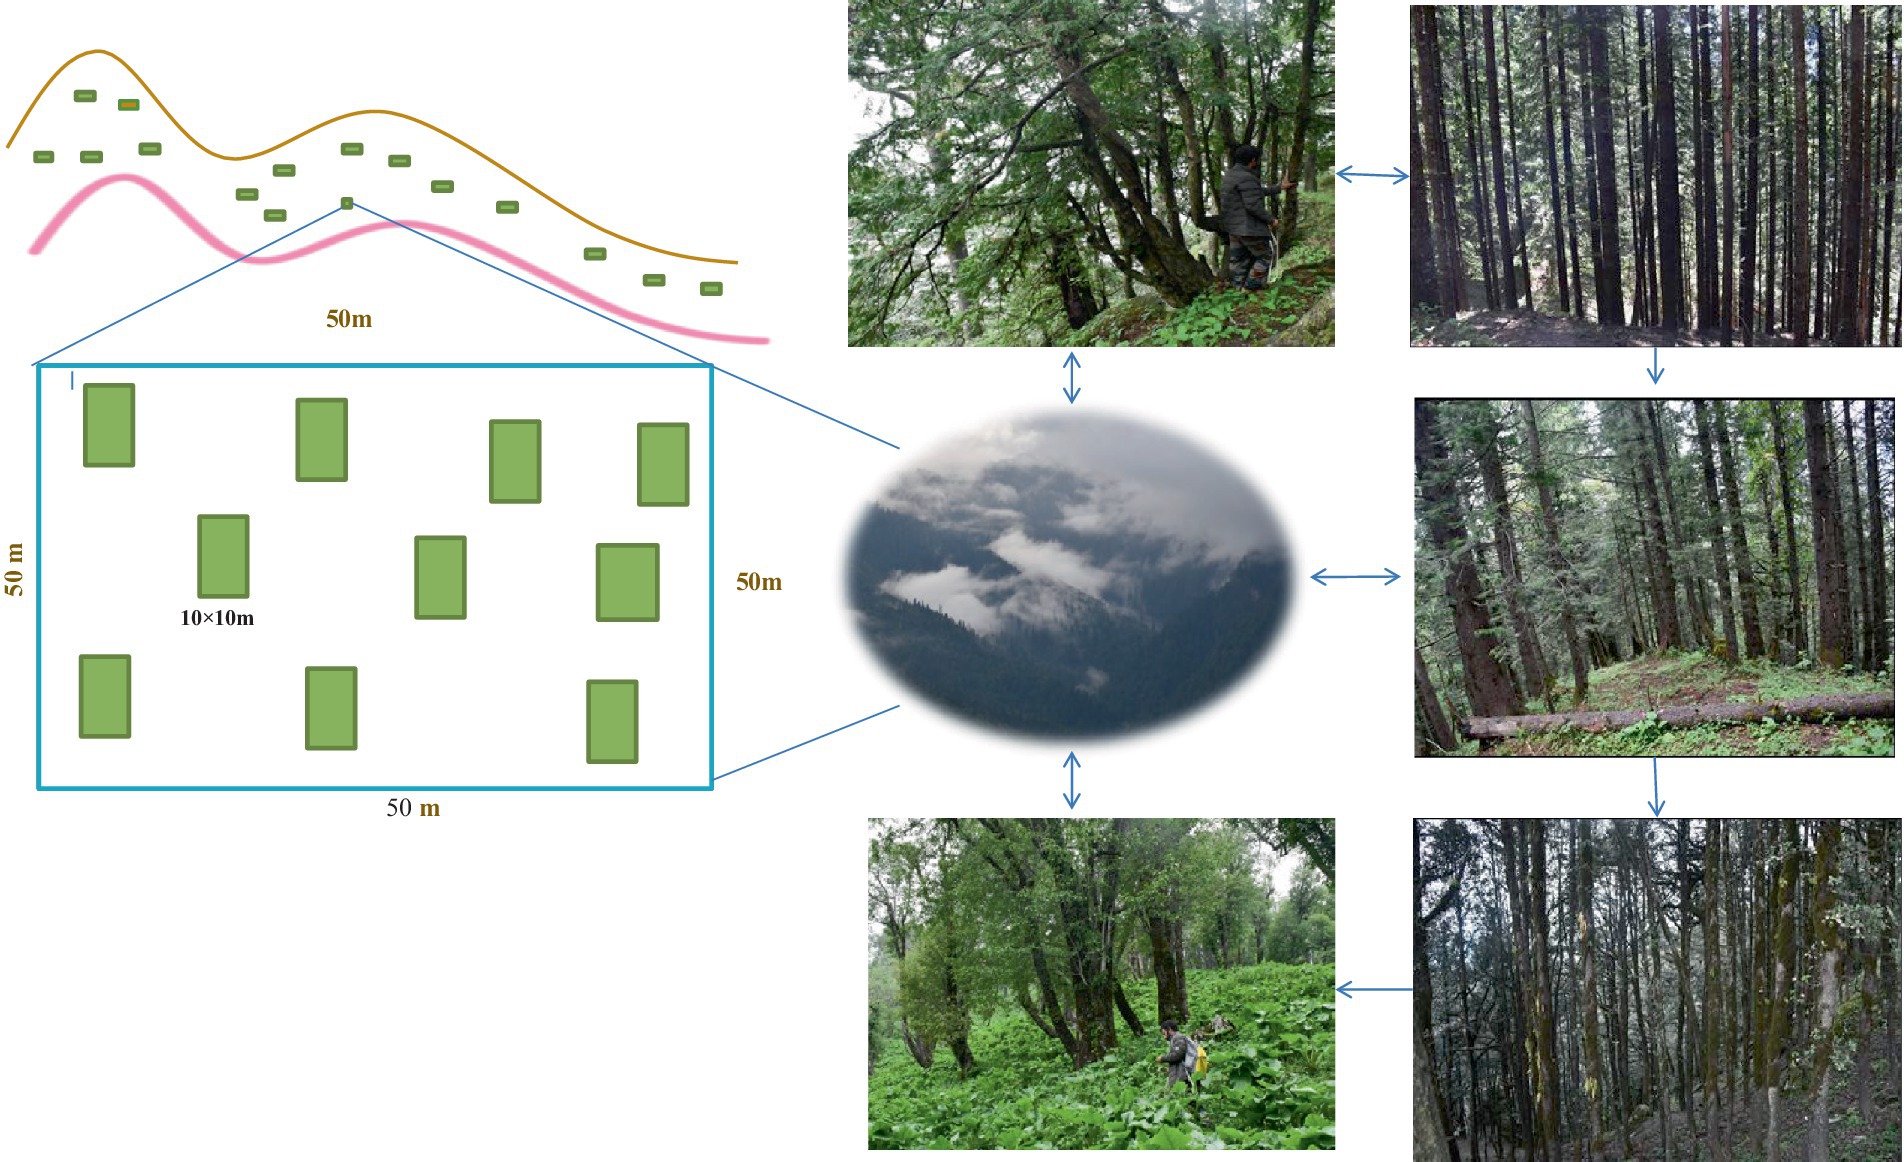
Figure 3. Layout of the plots and sampling technique in different forest stands at TWS.
The biomass and carbon stock of TWS were computed using the Intergovernmental Panel on Climate Change-Good Practice Guidance (IPCC-GPG; Penman et al., 2003). A significant portion of the total biomass was above-ground biomass (AGB) and below-ground biomass (BGB), calculated using non-destructive methods. Furthermore, Soil and dead organic matter (DOM), including deadwood and litter, was estimated to constitute the five pools of carbon (Tables 1, 2; FSI, 1996). The diameter at breast height (dbh) of all present species in the plot was measured with a dbh >10 cm at 1.37 m tree girth height. Furthermore, the volume of each tree species was calculated using standard volume regional equations developed by the FSI (1996). During the field data collection periods, we measured various ecological attributes, including dbh of particular trees, site characteristics, topographic features, habitat type, elevation, slope, etc., to understand the communities’ patterns and structure of the forest for further research. The tree species were initially identified through visual observations based on specific characteristics of that species in the field. Furthermore, authentication was done by consulting various published literature and referring to herbarium samples in the ICFRE-Himalayan Forest Research Institute (HFRI), Shimla.
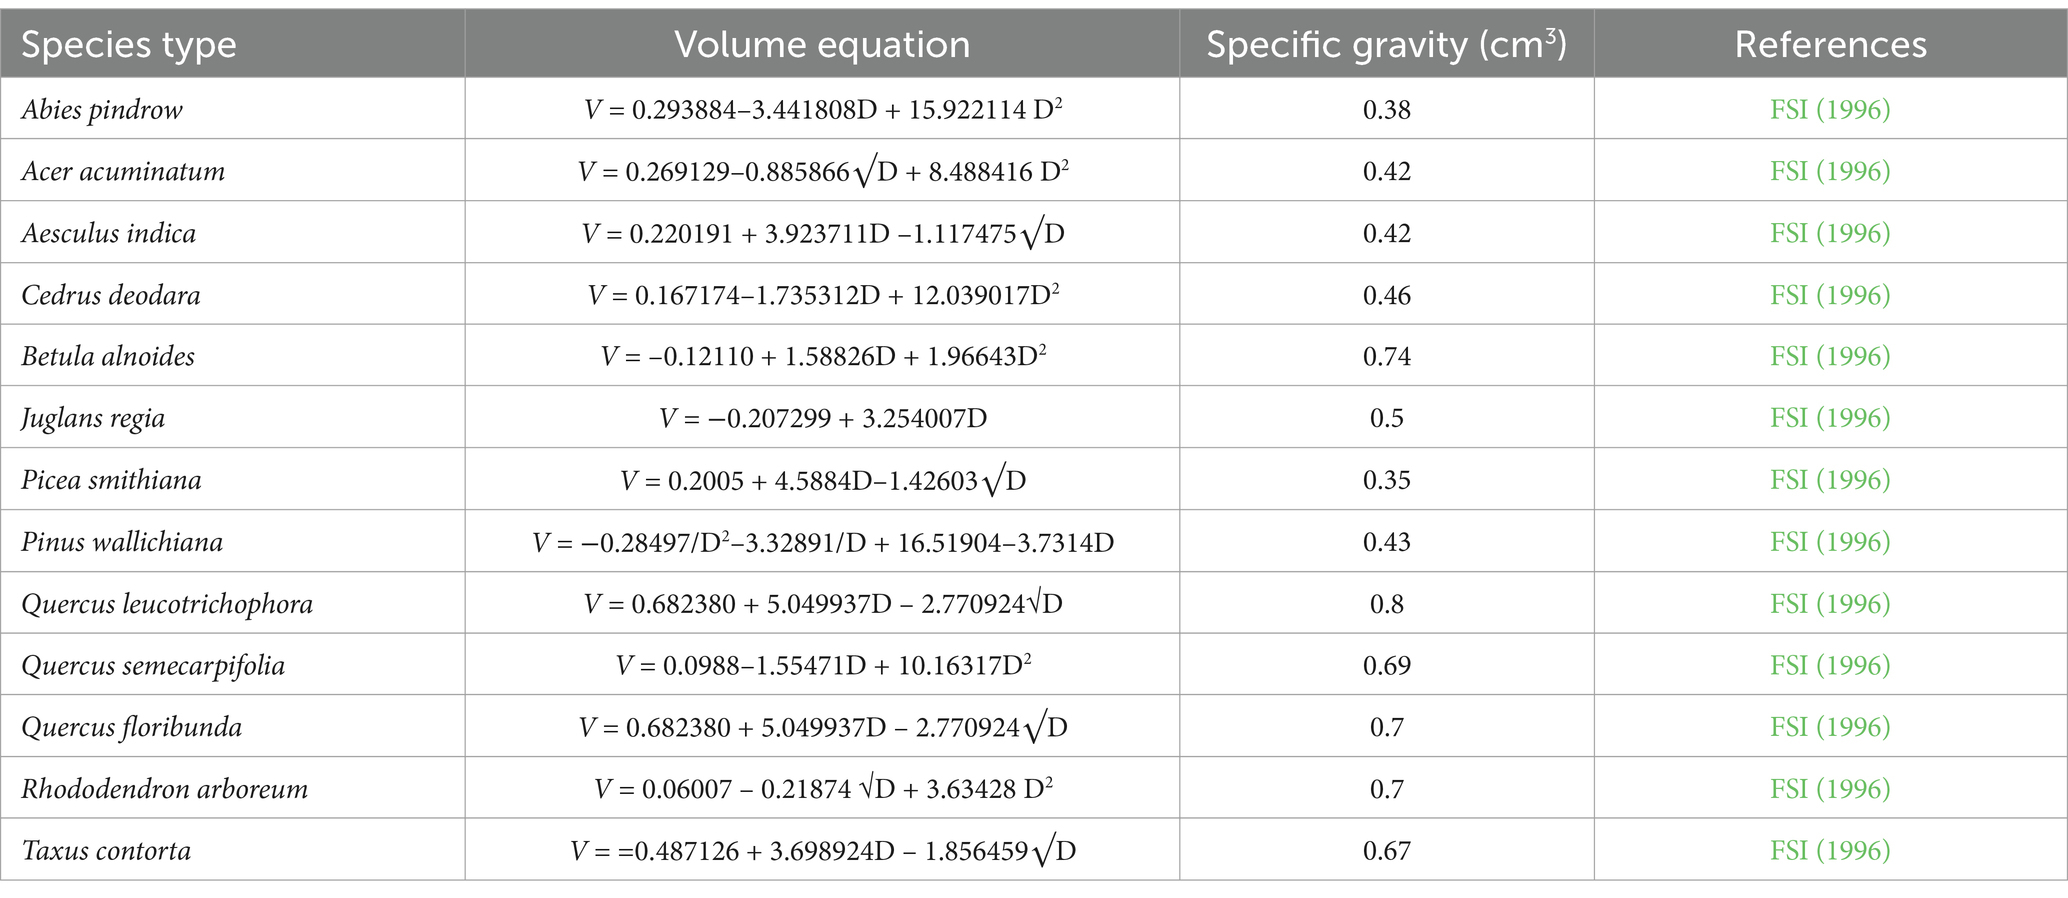
Table 1. Volume equation of each individual species.
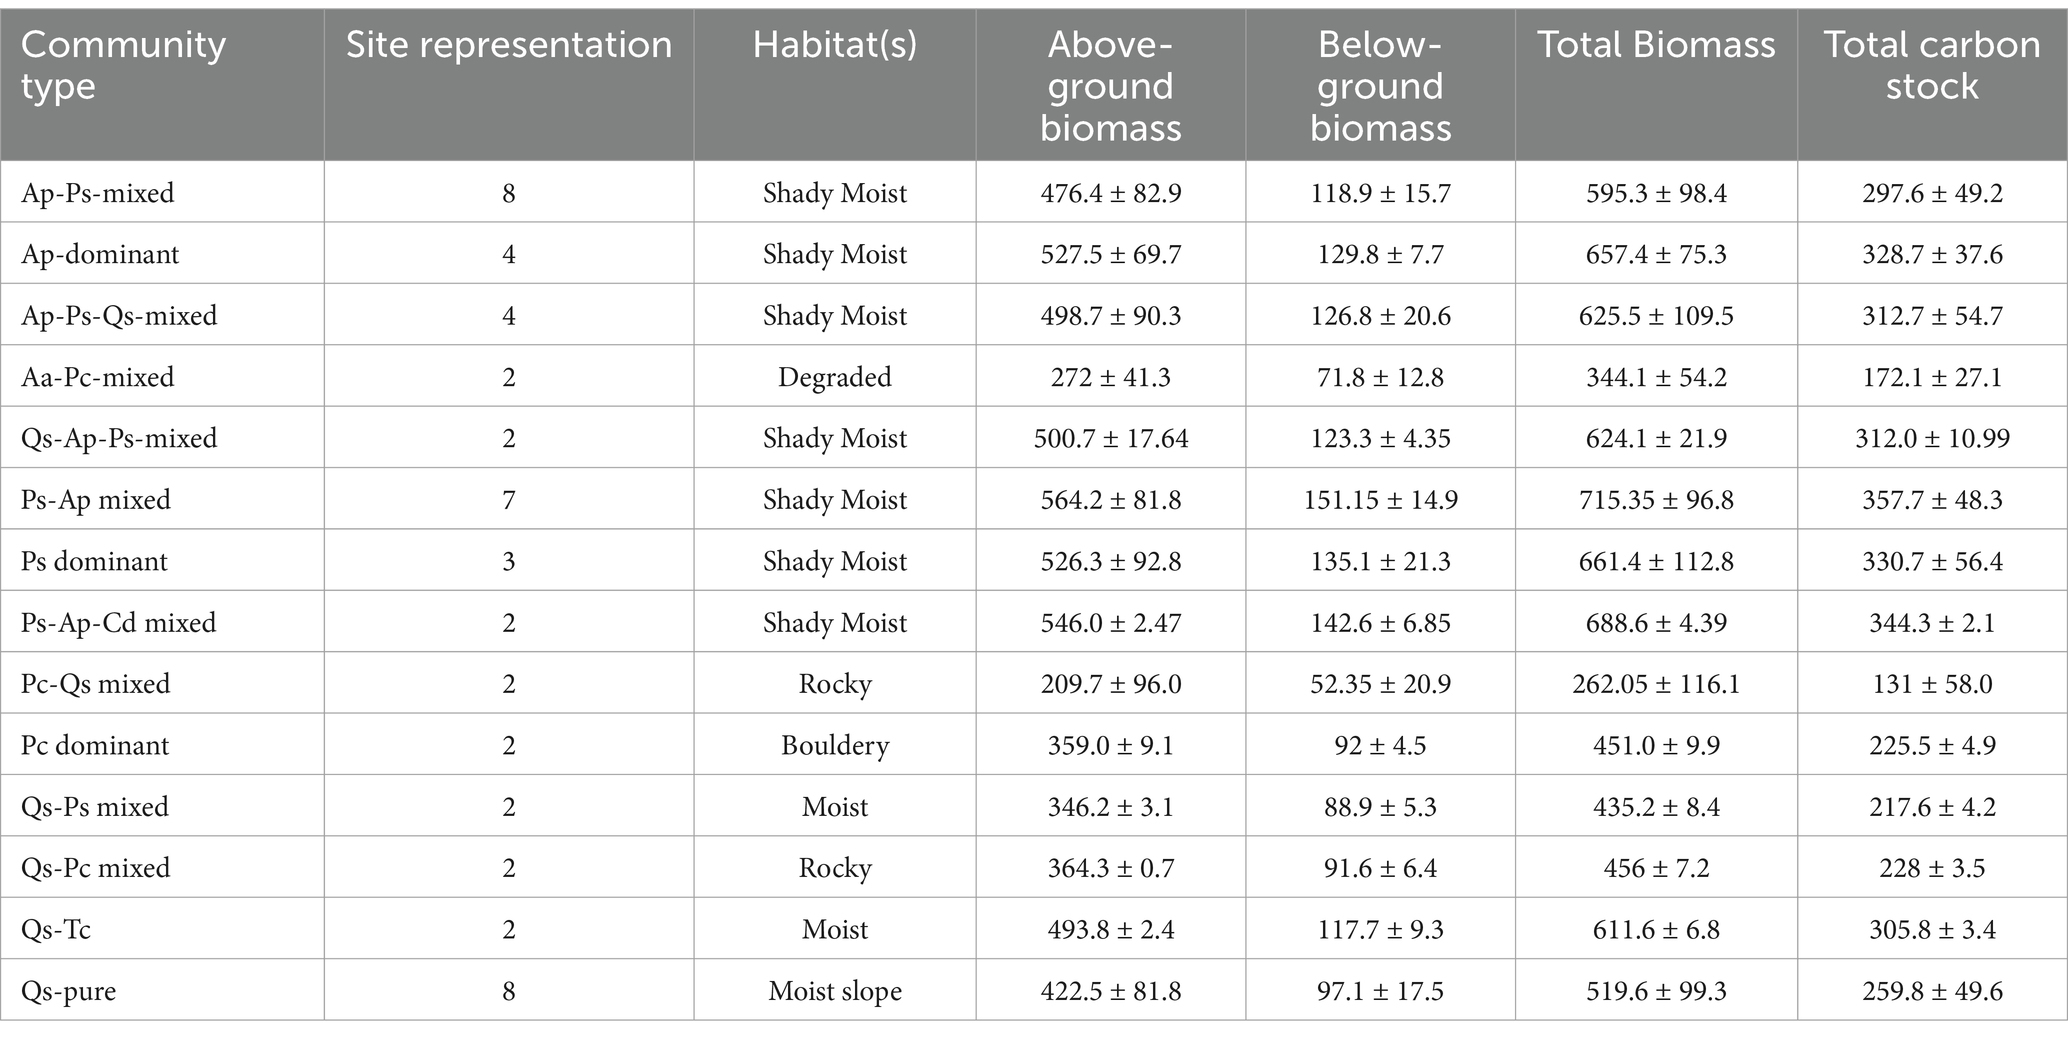
Table 2. Biomass and carbon stocks of different communities in the TWS.
Sample plots of 50 × 50 m were selected in different forest stands. Within this plot, 10 (10 × 10 m) subplots (total 1,000 m2) were randomly placed to estimate the biomass of the forest stand (Mishra, 1968; Kershaw, 1973) (Figure 3). Furthermore, standard forest inventory exercises such as dbh, height, site characteristic, and altitude range were accomplished after site enumeration (Table 1).
The below-ground biomass of tree species comprised coarse and fine roots and was estimated using the allometric equation developed by Cairns et al. (1997). Thereafter, the AGB and BGB were integrated to get the total biomass (TB). Similarly, the total carbon stock (TCS) was specified by multiplying the total biomass (Mg ha−1) by a factor of 0.5 (Intergovernmental Panel on Climate Change (IPCC), (2003); Eggleston et al., 2006).
The random multiple plots of 1 × 1 m were laid out to estimate the herbaceous and litter biomass and 5 × 5 m for shrubs in the selected site. All the collected litter understory and herbaceous samples were weighed using a portable digital balance. Thereafter, it was oven-dried at 65 ± 5°C till the attainment of a constant weight in the lab. The fresh litter subsamples of 250 (g) were brought from the field and oven dried at 80°C for further analysis (Hairiah et al., 2001; Sheikh et al., 2020).
Five soil samples, preferably one from the center and four from the four corners, were randomly collected from each selected site in the TWS. After the site identification, soil layers were cored to a depth of 0–15 cm and 15–30 cm. Afterward, all samples were brought to the lab for further analysis per global standard protocols. The samples were taken out from the sample bag and dried in air (48–72 h) until the samples became completely dry. Then, all dried samples were passed through a 2-mm standard sieve (ISS: 460–1962) (Jackson, 1967). The soil fractions (>2 mm) were stored after washing in running tap water for further analysis. Finally, dried and processed soil samples were used for further analysis using a standard protocol (Walkley and Black, 1934; Jackson, 1967).
All collected soil samples from different depths were dried in an oven at 100 ± 5°C for 48 h in the lab to obtain a constant weight for further analysis. Bulk density, the mass of oven-dry soil per unit volume (Wilde et al., 1973; Blake, 1965; Hao et al., 2008), was calculated using a standard formula.
The >2 mm coarse fragment rate was calculated in the collected soil samples. The coarse fraction was retained in the 2-mm sieve. Running water was passed through the sample. Soil particles <2 mm in size were allowed to be washed away with running water. The remaining sieved fraction of 2 mm was dried and weighed to estimate the coarse fraction. However, moisture content was calculated using the standard method (Mishra, 1968). For example, moisture content (%) = (fresh weight minus dry weight)/fresh weight × 100.
The Walkley and Black method was used to estimate soil organic carbon (%) using the rapid titration method (Walkley and Black, 1934). The soil organic carbon pool for a particular depth was computed by multiplying the SOC (%) with bulk density, fraction of coarse elements, and depth was calculated by following formula (Bates, 1996):
Whereas, Q = total organic carbon (Mg m−2), and ρi is the bulk density (Mg m−3) of the soil later. Pi is the organic carbon proportion (g C g−1) in the layer. Di is the thickness of the layer (m) and Si is the extracted fraction of coarse fragments (>2 mm) in the layer, while k is the total depth of layers.
Descriptive statistical tools, i.e., MS Excel, Paleontological Statistics (PAST) and Origin-Pro, were used to calculate critical parameters such as the dataset’s mean median, range, and standard deviation. Pearson correlation coefficient analysis examined associations between variables (Hammer and Harper, 2001; Edwards, 2002). The trend between significant variables was observed using the regression line with height as a continuous variable. The principal component analysis (PCA) was used to identify the variables (components) that explain most of the variance in the multidimensional.
A total of 14 forest communities, including Abies pindrow–Picea smithiana mixed (Ap-Ps), Abies pindrow dominant (Ap), Abies pindrow–Picea smithiana–Quercus semecarpifolia mixed (Ap-Ps-Qs), Acer acuminatum–Prunus cornuta mixed (Aa-Pc), Abies Quercus semecarpifolia–Abies pindrow–Picea smithiana mixed (Qs-Ap-Ps), Picea smithiana–Abies pindrow mixed (Ps-Ap), Picea smithiana dominant (Ps), Picea smithiana–Abies pindrow–Cedrus deodara mixed (Ps-Ap-Cd), Prunus cornuta–Quercus semecarpifolia mixed (Pc-Qs), Prunus cornata dominant (Pc), Quercus semecarpifolia–Picea smithiana (Qs-Ps), Quercus semecarpifolia–Prunus cornata mixed (Qs-Pc), Quercus semecarpifolia–Taxus contorta (Qs-Tc), and Quercus semecarpifolia (Qs) communities, were specified based on IVI in the TWS (Figure 4).
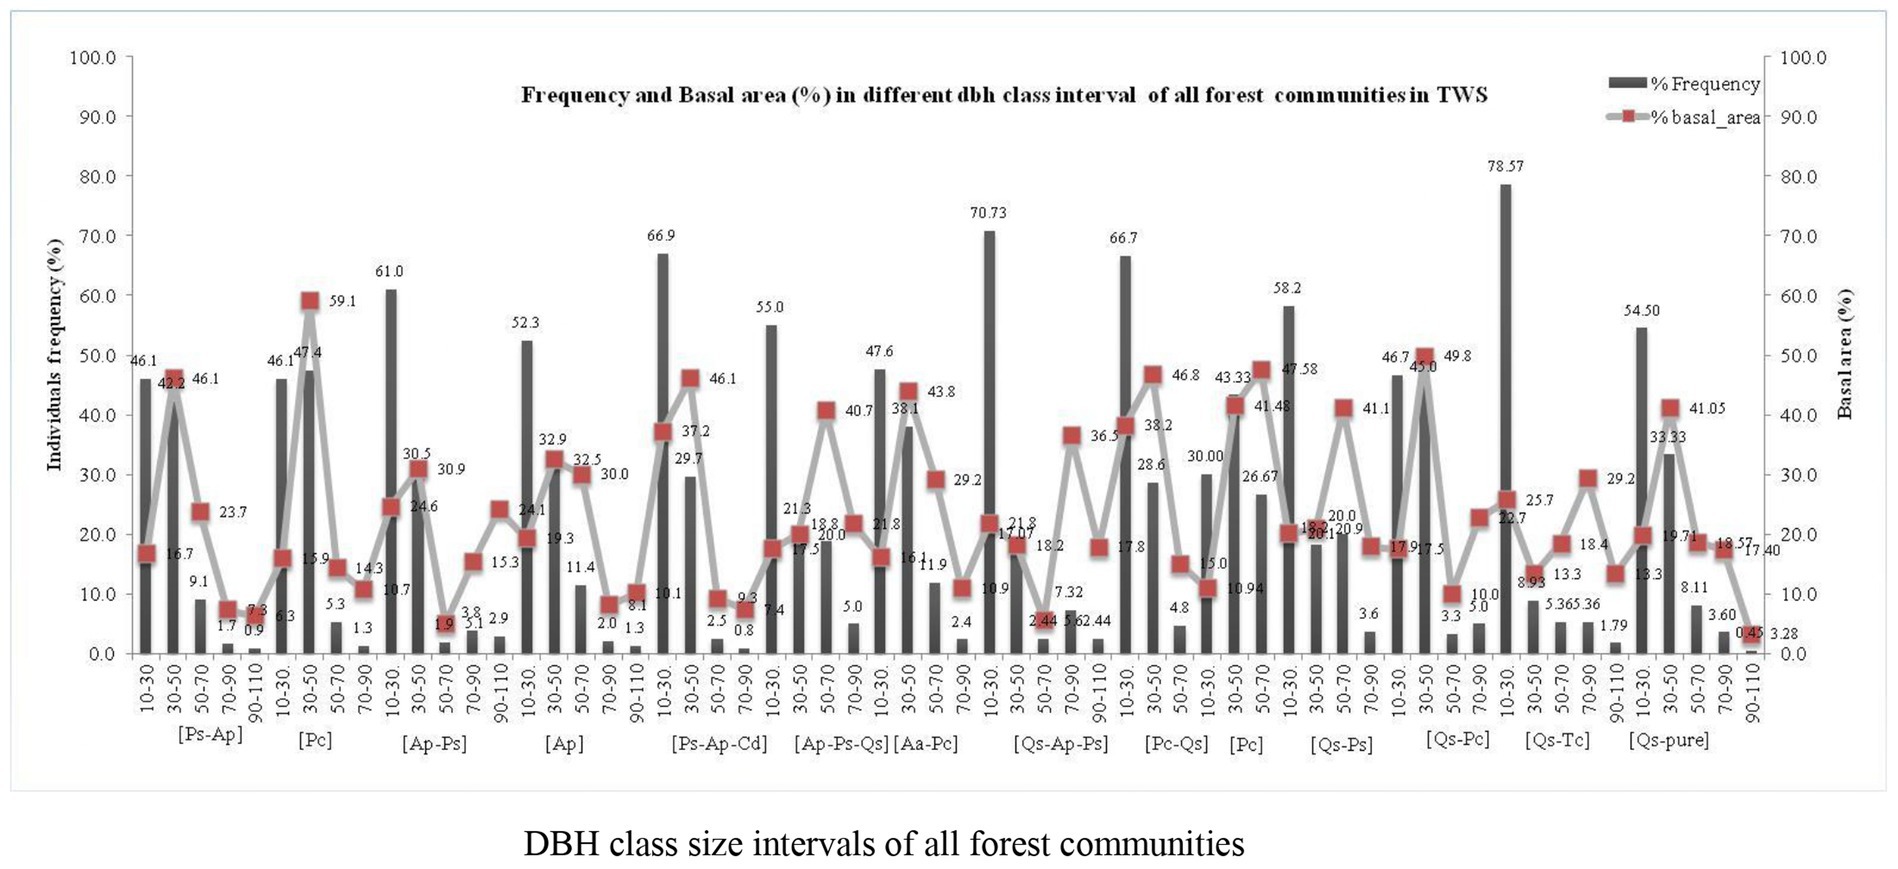
Figure 4. Communities structure patterns in TWS.
In TWS, the community’s distribution structure patterns varied from lower (10–30 cm) to higher dbh (90–110 cm) class intervals. The elevation of the selected community stands was in the range of 2,434 (Picea smithiana dominant) to 3,390 (Quercus semecarpifolia pure). The dbh class intervals from 10–30 to 90–110 cm showed a high frequency in most of the identified communities (Figure 4). The lower class had high tree frequency (10–30 cm), and it consistently decreased by increasing the class size (90–110 cm). However, the circumstance of basal area distribution among all communities revealed that the middle classes, such as 30–50 and 50–70 cm, shared the highest proportion of basal area in the forest communities, which indicated that most of the trees having 30–50 to 50–70 cm class was accountable for forming higher basal area. It also indicated that mature trees were located within the 30–50 and 50–70 cm range, while highly mature and old trees were present in the 70–90 and 90–110 cm dbh class intervals, respectively. Additionally, trees with higher class sizes 90–110 had a significantly lower frequency but contributed a more significant percentage of basal area (Figure 4). The dbh of various tree species in the forest communities differs widely depending on the forest’s nature and growth pattern. The highest dbh was observed in the Ap-Ps mixed community, having 35 ± 19.1 dbh and 753 ± 119.3 (ind. ha−1) tree density, followed by the Ap-Ps-Qs, having 34 ± 18.1 and 567 ± 134 (ind ha−1) and the Pc dominant, having 34.07 ± 8.9 and 336 ± 50.3 (ind ha−1). On the other hand, the Ap dominant community had greater tree density (861 ind ha−1) with 32.5 ± 16.4 dbh, followed by the Ap-Ps mixed community (762 ind ha−1) with 31.5 ± 17.7 dbh, and Ps-Ap-Cd mixed had 752 ± 113 (ind ha−1) tree density, followed by the rest of the community (Table 3).
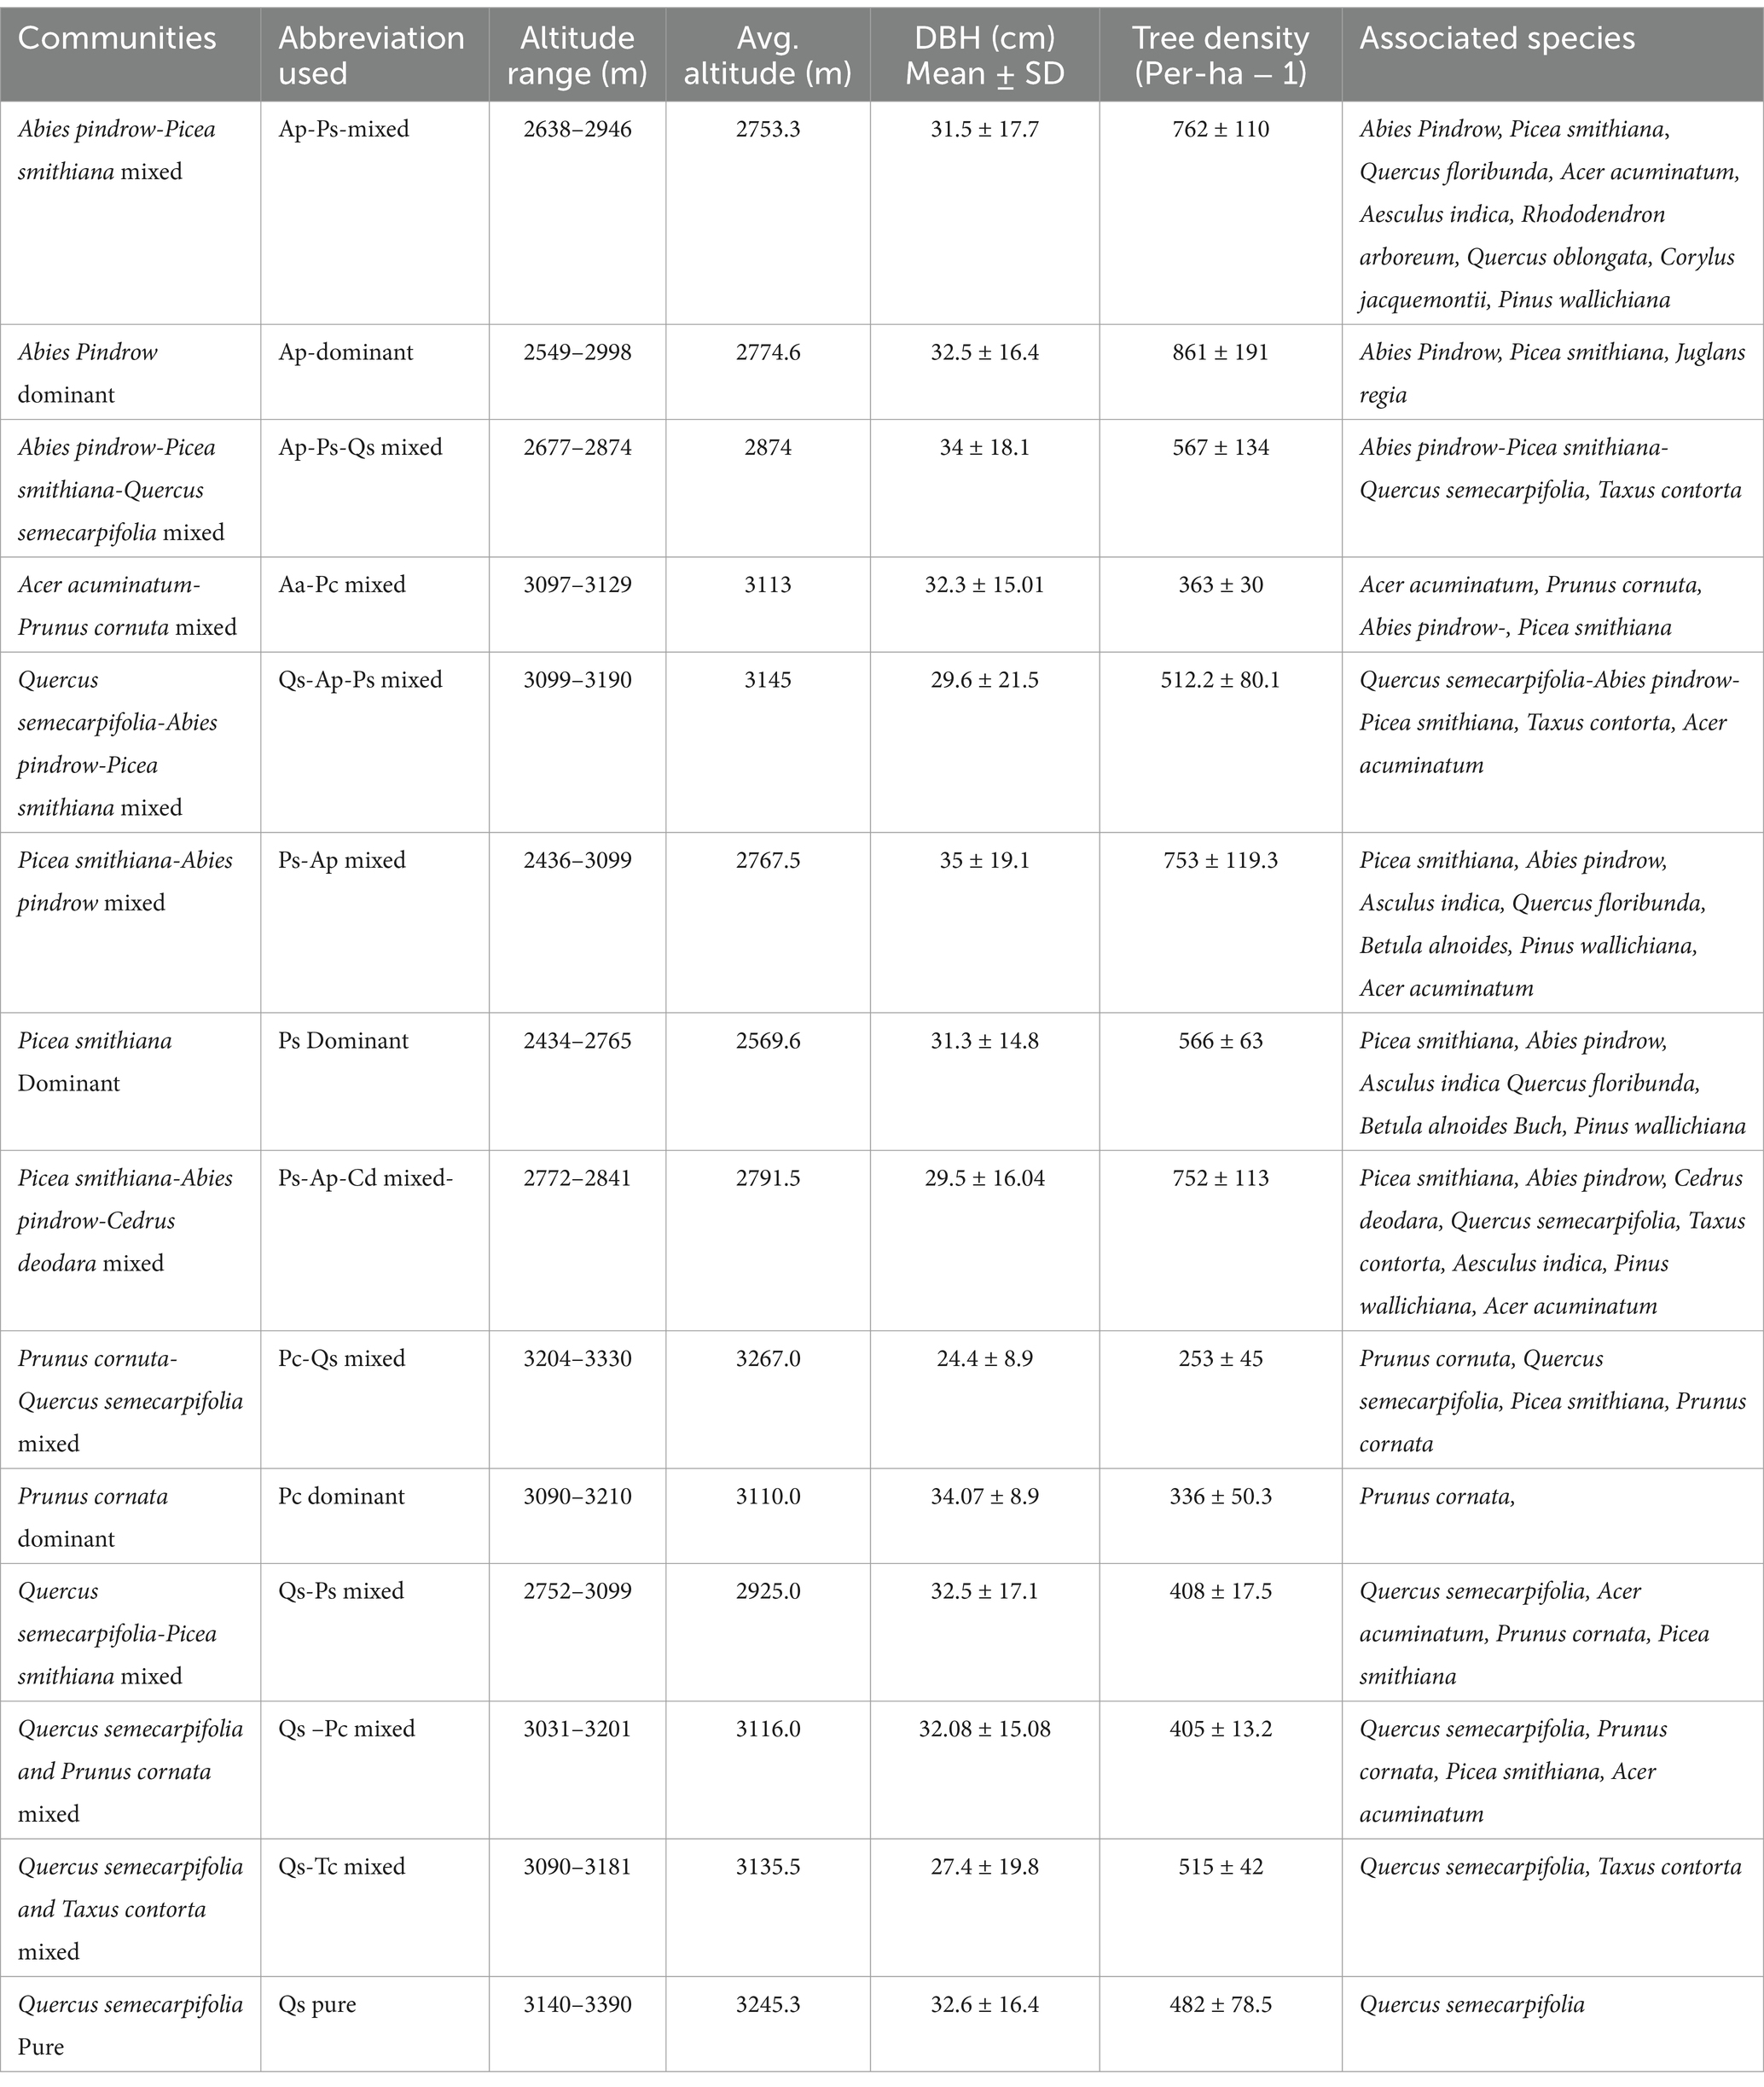
Table 3. Presents the average DBH, altitude, and tree density of the total communities, including canopy-forming associated species in the TWS.
The results of biomass and carbon stock of different communities obtained in this study are shown in Table 2. A total of 50 sites were sampled, and 14 different forest communities were encountered at an altitude of 2400 to 3392 m, respectively (Table 2). The results observed that moist shady habitats had higher biomass and carbon stocks, followed by boulder, degraded, and rocky habitats, respectively (Figure 5). The AGB, BGB, and TCS contents from each forest community significantly varied at each hierarchal level. Variables such as greater dbh and altitudinal range and factors such as different habitat types that influence the biomass and carbon stock potentials of the forest ecosystem were noticed in the current study. The TCS values varied from 131.0 to 357.7 Mg ha−1 (273.1 ± 68.7 Mg ha−1). The Ps-Ap mixed community (357.7 ± 48.3 C Mg ha−1) had the highest total carbon stock, followed by the Ps-Ap-Cd (344.3 ± 2.1 Mg ha−1), Ps (330.7 ± 56.4 Mg ha−1), Ap (328.7 ± 37.6 Mg ha−1), and Ap-Ps-Qs (312.7 ± 54.7 Mg ha−1). Likewise, the Qs-Ap-Ps mixed community had a carbon stock of 312.0 ± 10.9 Mg ha−1. However, in Qs-Tw, it was 305.8 ± 3.4 Mg ha−1; in the Ap-Ps mixed community, it was 297.6 ± 49.2 Mg ha−1, respectively (Table 2).
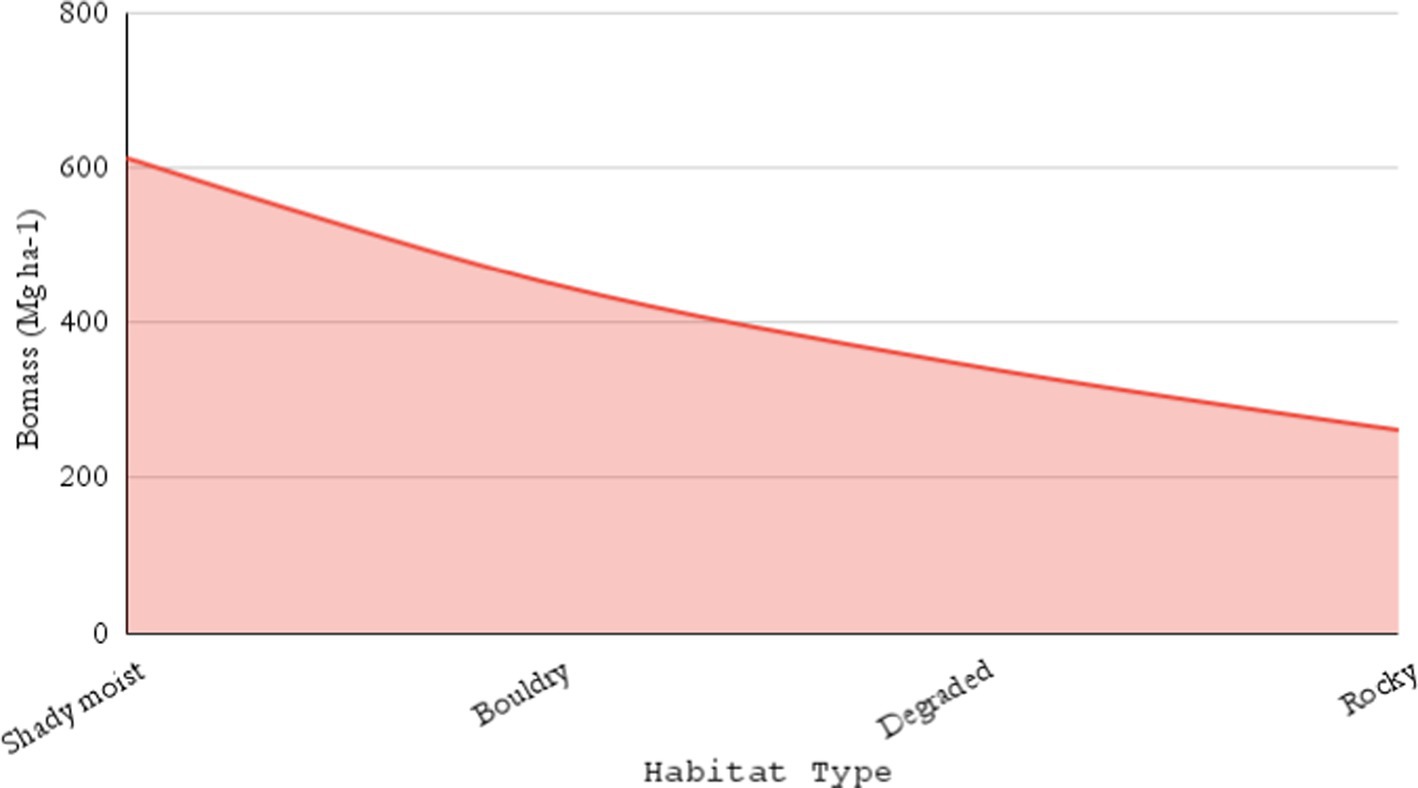
Figure 5. Biomass allocation across different habitat types in TWS.
The result showed that the forest’s allocation and storage capacity trends were dynamic along the increasing altitude in TWS. It showed that the carbon storage capacity was proportional to the tree density, abundance, and significant environmental variables. The result showed that at the beginning altitudes, such as 2569.6 to 2,874 m, the tree carbon stock was relatively high, ranging from 297.6 to 357.7 Mg ha−1. A similar trend was observed in the tree density. The tree density at this altitude ranged from 567 to 861 (Ind. ha−1) (Figure 6). However, carbon stocks declined significantly toward higher altitudes. For example, from altitude 2,925 to 3,267 m, carbon stock ranged from 131 to 259.8 Mg ha−1. Similarly, tree density measuring 253 to 515 (Ind. ha−1) was observed in higher elevation gradients in the TWS (Figures 6a,b).
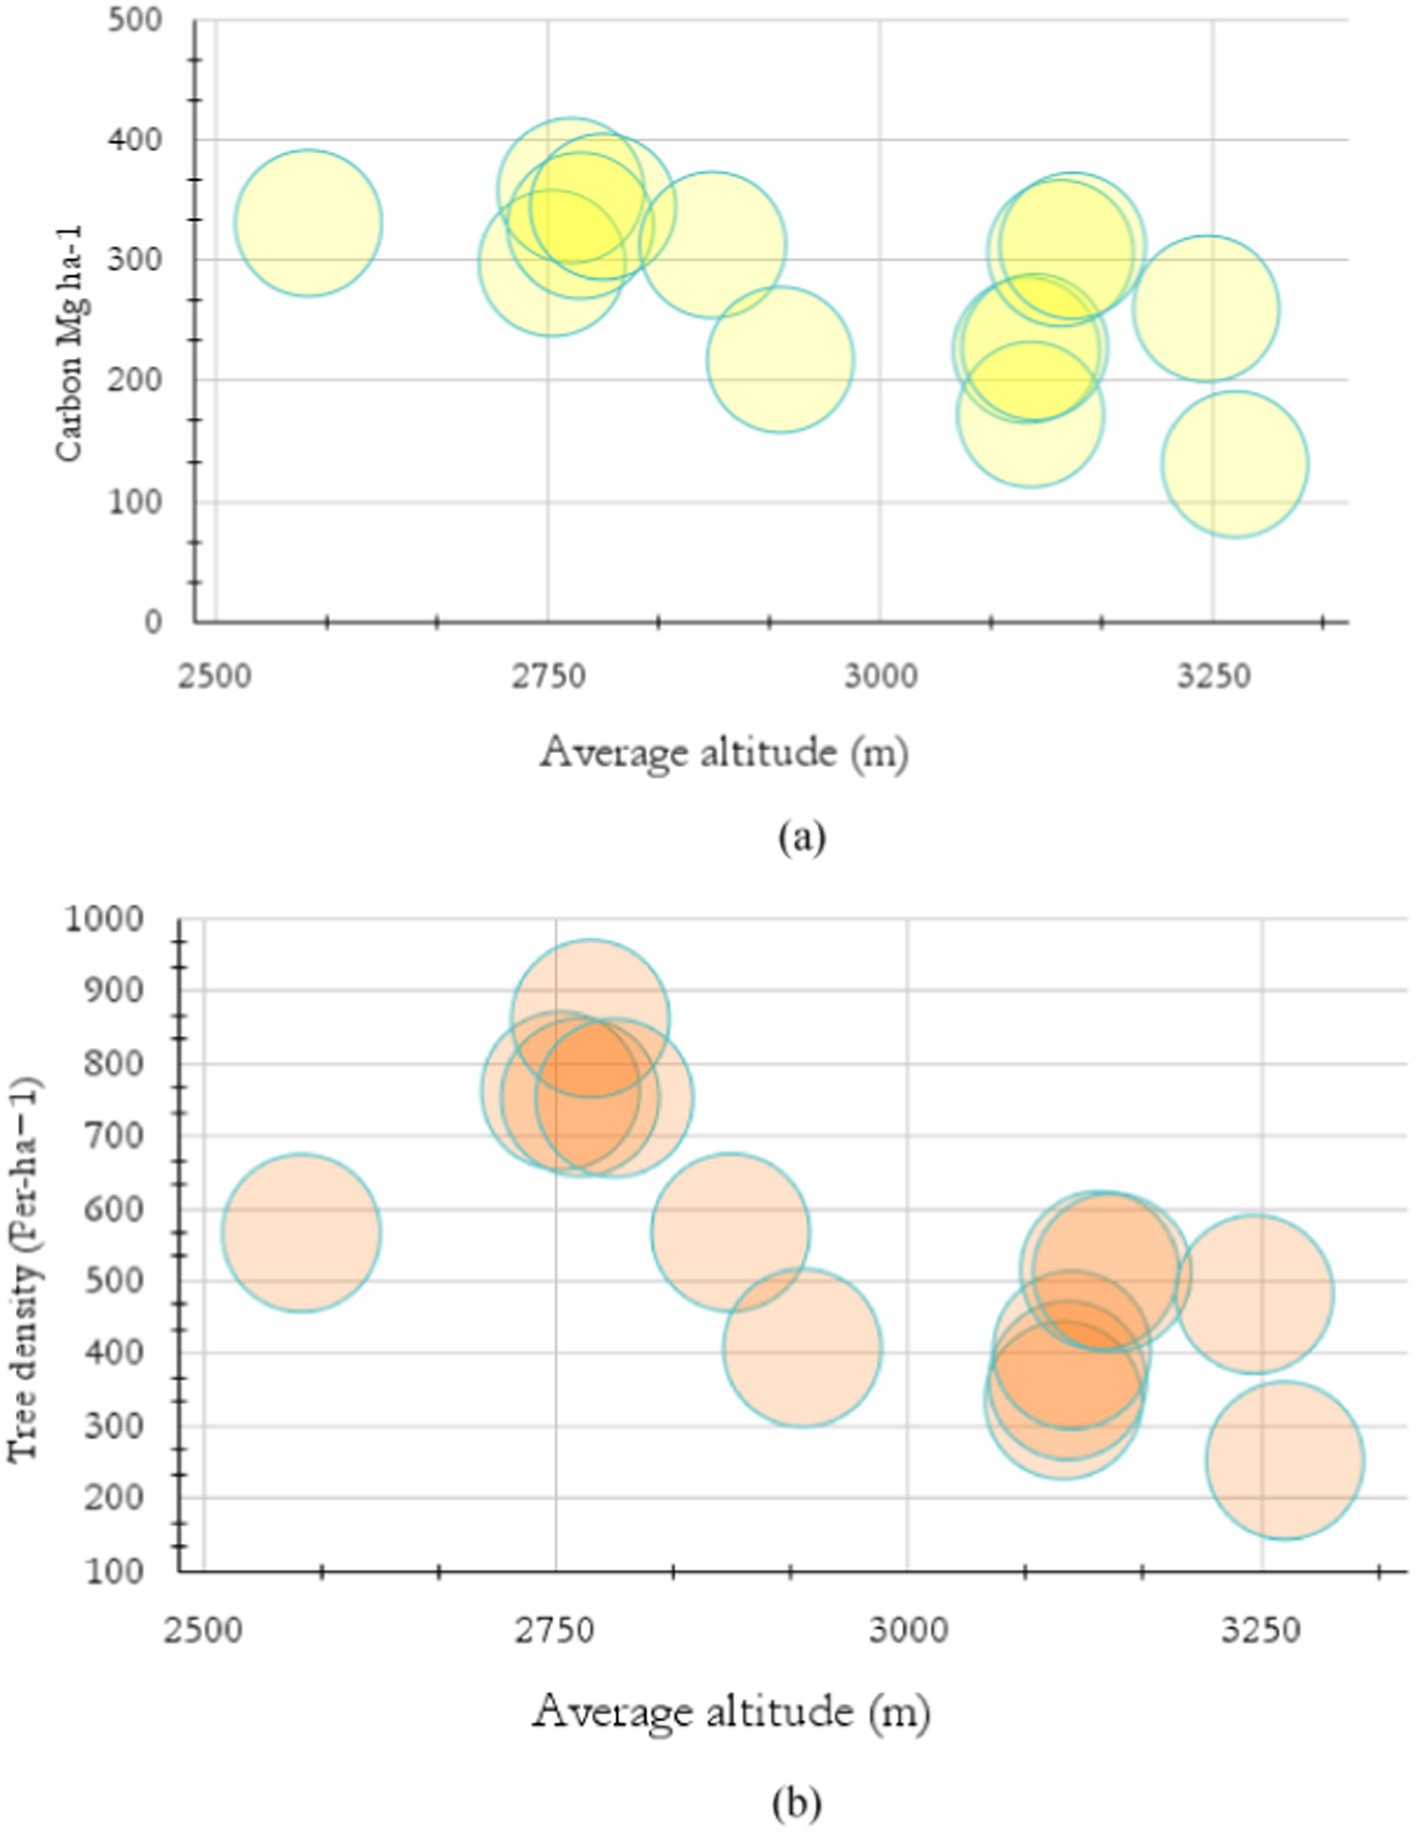
Figure 6. Trends of carbon stock by the pace of altitude.
The understory biomass and litter fall patterns in the conifer and broad-leaf forest stand varied and were consistent with the density and frequency of shrub and herb layers. The diversity of shrubs and herb species in the mixed forest stand was relatively high; however, species such as Prinsepia spp., Rosa spp., and Viburnum spp. were found in cluster and clumped patterns in these forests; consequently, biomass was found to be slightly high. In contrast, the pure forest stands exhibited lower shrub diversity and were more sparsely distributed. The results showed that the total understory biomass across all 14 forest communities ranged from 2.10 to 4.4 Mg ha−1 (avg. 3.34 ± 0.66 Mg ha−1). At the same time, litter production biomass was determined in a range of 1.2–2.9 Mg ha−1 (avg. 2.04 ± 0.48 Mg ha−1). The understory biomass and carbon stock of the Ap-Ps-Qs-mixed forest community was higher, i.e., (4.4 ± 2.03 Mg ha−1) and (2.2 ± 0.054 Mg ha−1), followed by Qs-pure (4.2 ± 2.03 Mg ha−1) and (2.9 ± 0.66 Mg ha−1), Qs-Pc mixed (3.85 ± 1.93 Mg ha−1) and (2.05 ± 0.85 Mg ha−1), and Aa-Pc-mixed (3.85 ± 1.93 Mg ha−1) and (2.05 ± 0.85 Mg ha−1), respectively. Conversely, litter biomass (2.9 ± 0.66 mg ha−1) and carbon stock (1.48 ± 0.33 mg ha−1) were higher in the Qs pure community, followed by Qs-Pc mixed (2.4 ± 0.86 Mg ha−1) and (1.22 ± 0.43 Mg ha−1), Qs-Tc mixed (2.2 ± 0.62 Mg ha−1) and (1.13 ± 0.31 Mg ha−1), Aa-Pc-mixed (2.32 ± 0.81 Mg ha−1) and (1.14 ± 0.4 Mg ha−1), and Ap-Ps-Qs-mixed (2.2 ± 0.68 Mg ha−1) and (1.1 ± 0.34 Mg ha−1), respectively (Table 4). Table 4 shows the allocation patterns, understory, and litter carbon stock in different forest communities. It was found that understory and litter carbon stocks ranged from 1.22 to 1.7 Mg ha−1 and 0.73 and 0.85 Mg ha−1 in (2400–2,800 m), while at 2800–3100 m were 2.05 and 1.14 Mg ha−1. Correspondingly, at 3100–3300 m, it was found to be 2.9 and 1.48 Mg ha−1, respectively (Figure 7).
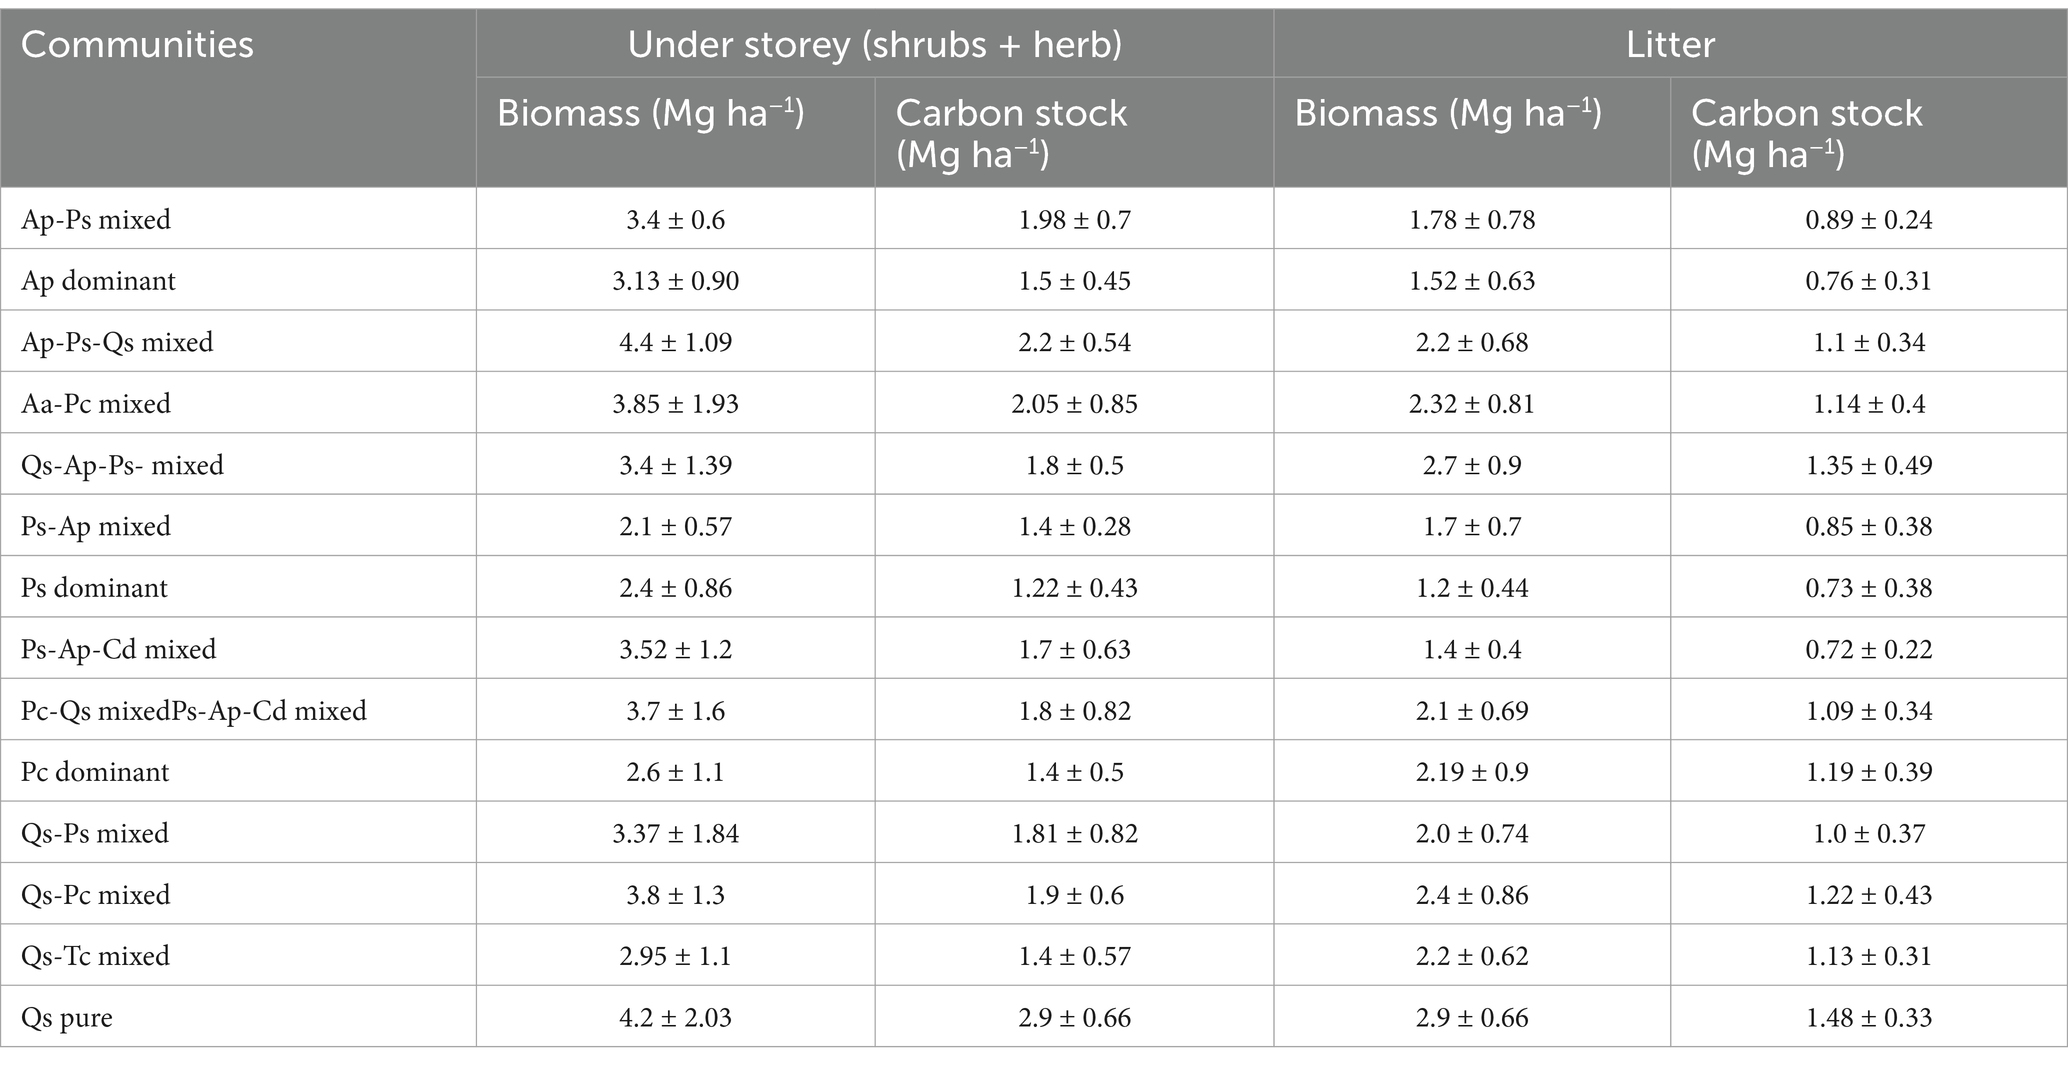
Table 4. Understory and litter biomass and carbon stocks of different communities obtained in the TWS.
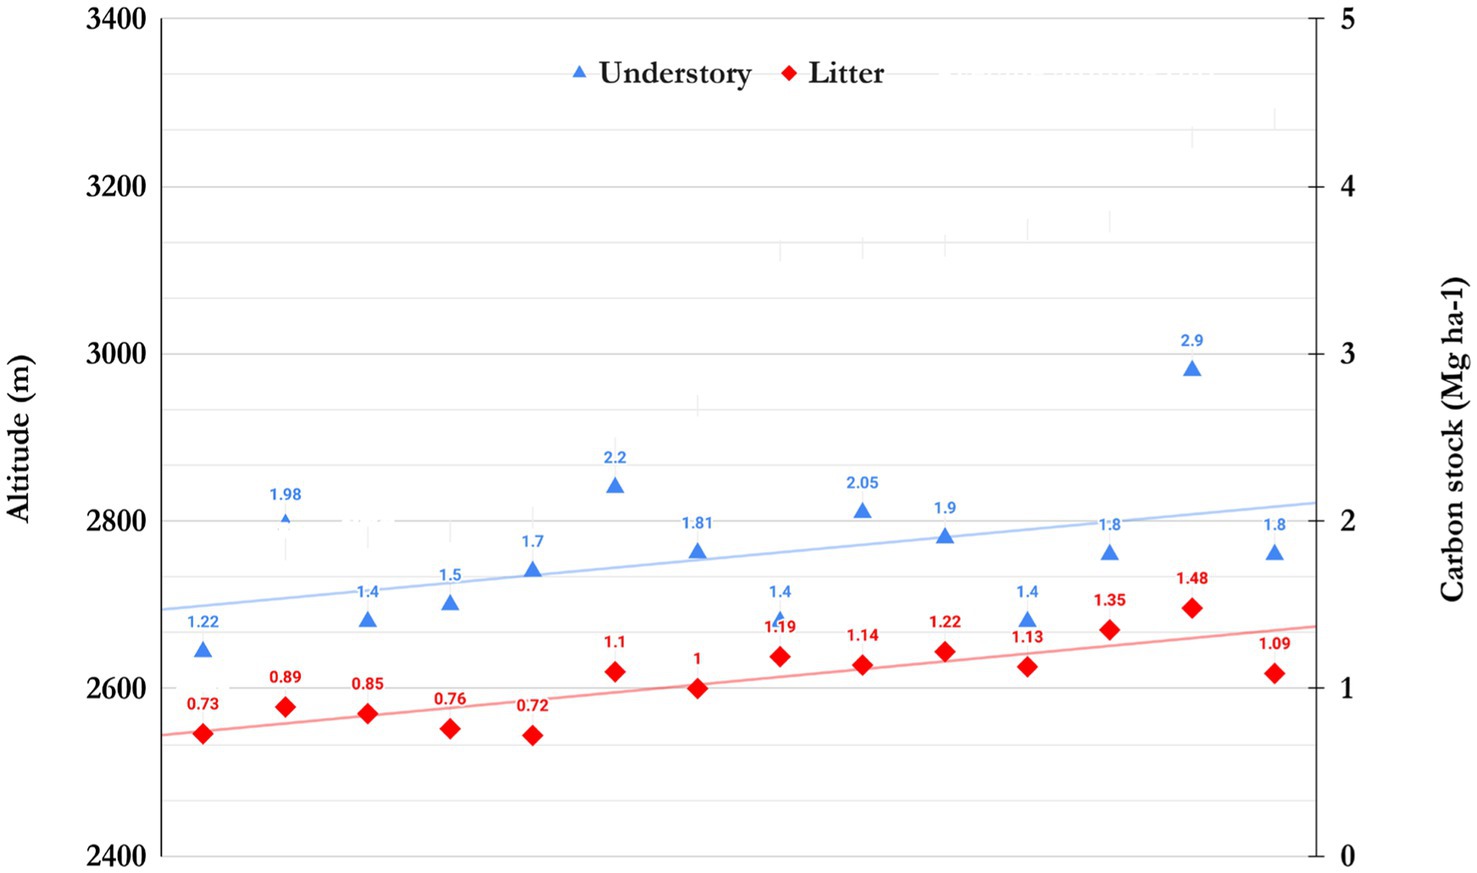
Figure 7. Allocation of understory and litter carbon stock of different communities by the pace of altitude in TWS.
The outcome of soil analysis showed that on the top layer (0–15 cm), moisture and organic carbon (%) were 30.2 ± 4.7 and 2.9 ± 0.55 (%). Similarly, at 15–30 cm, the result was 21.3 ± 4.8 and 1.9 ± 0.53 (%), respectively. Moreover, the bulk density at 0–15 cm was 0.7 ± 0.04 g/cm3, whereas at 15–30 cm, it was encountered 0.83 ± 0.05 g/cm3. Soil carbon stock in the top 0–15 cm layer was 30.6 ± 5.4 Mg ha−1, while at 15–30, it was 21.5 ± 6.1 Mg ha−1 in the TWS. The SOC% and carbon stock, including moisture (%), BD, CF (%), and SOC%, showed notable results in all 14 forest communities. At depths of (0–15) and (15–30), SOC% in the QS pure forest community was 3.8 ± 0.8 and 2.9 ± 0.49%, respectively, and total soil carbon stock was 35.6 ± 7.19 and 33.1 ± 5.9 Mg ha−1, respectively. While trends in the Pc community, the SOC% and total soil carbon stock were low, with a value of 1.7 ± 0.7% at 0–15 cm depth and 1.08 ± 0.5% at 15–30 cm. Similarly, soil carbon stock was 19.6 ± 10.2 Mg ha−1 and 13.5 ± 7.7 Mg ha−1, respectively, at above depths. A further impressive result was that the moisture% decreased and bulk density increased by increasing soil depth in all the forest communities, respectively (Table 5).
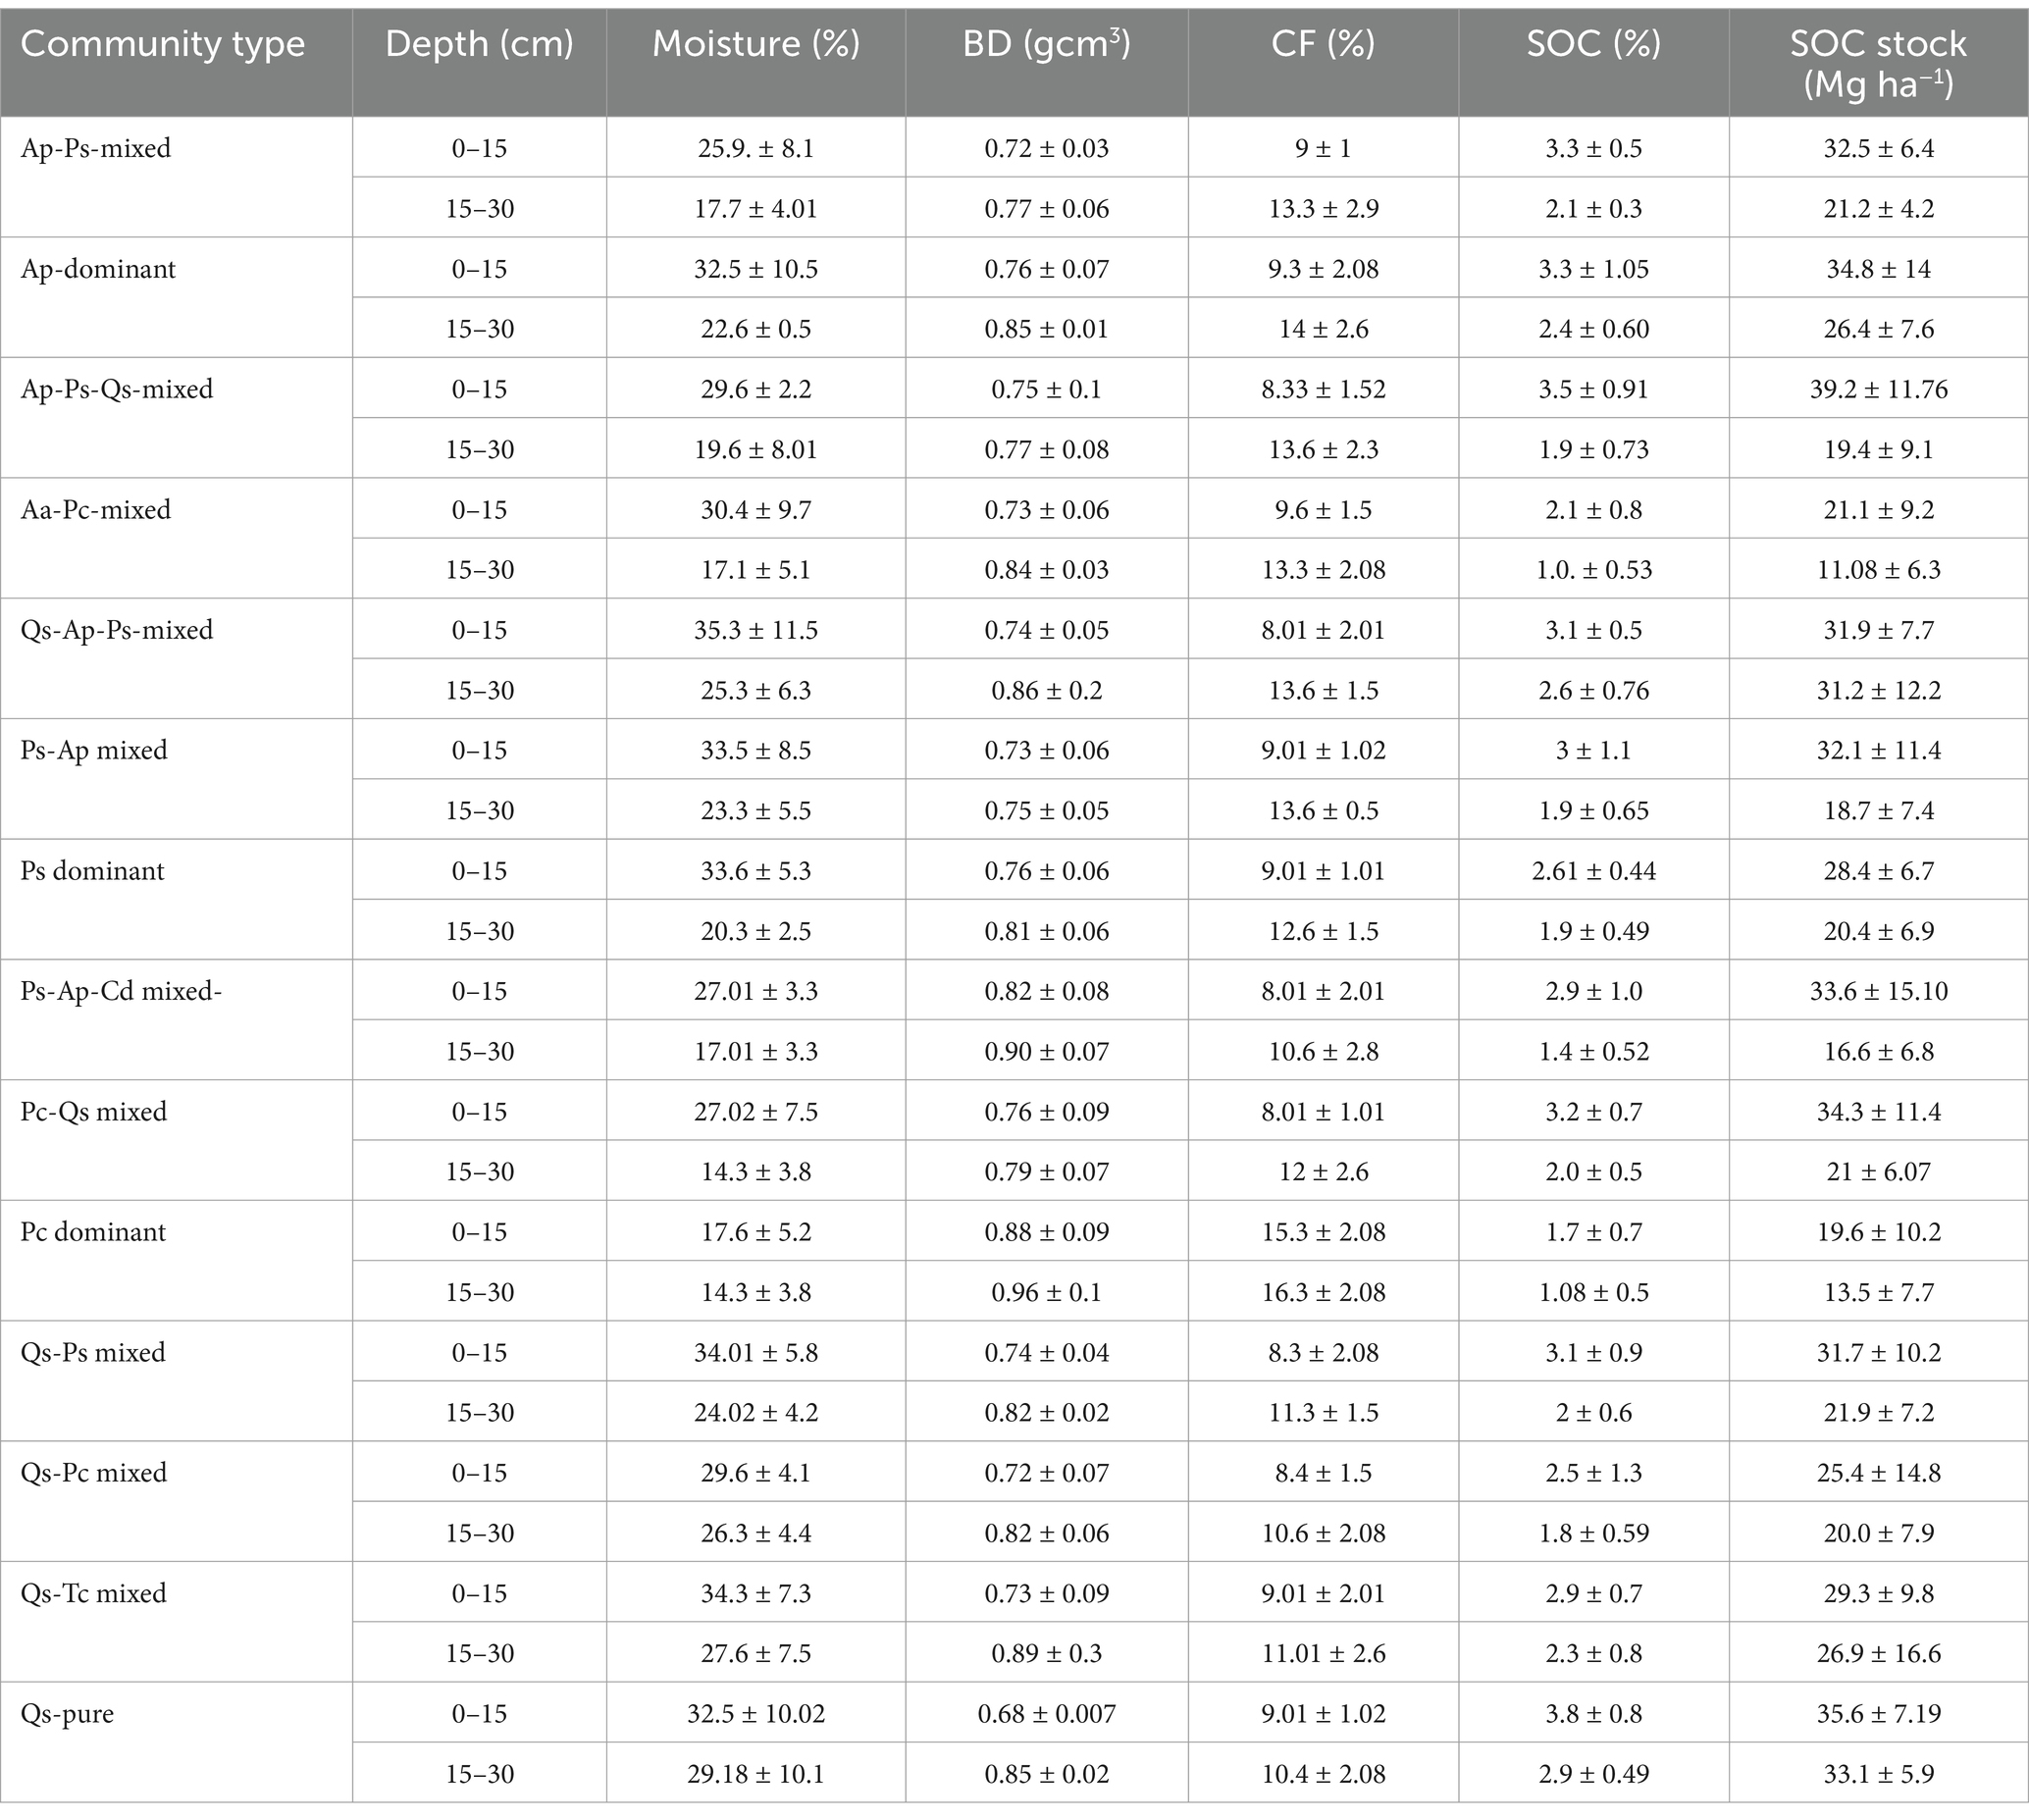
Table 5. Physical properties of soil in different forest communities in the TWS.
The linear relationship between the significant attributes, i.e., tree density, total tree carbon stock, dbh, bulk density, soil moisture, understory carbon stock, litter carbon, etc., was performed to comprehend the associations between all the variables. We found a positive and significant correlation between tree carbon stock and tree density across all the forest communities (Figure 8a). The correlation coefficient between tree carbon stock and tree density was r = 0.85; p < 0.05, indicating a positive correlation between them. In the forest ecosystem, the TC tends to increase as the tree density increases. At the same time, as the tree density along with dbh decreases, the TC tends to decrease in the forest ecosystem. Furthermore, the relationship between soil organic carbon (%) and bulk density was moderately negative (r = −056; p < 0.05), which signifies that as the soil depth increases the bulk density increases, and the SOC% tends to decrease; similarly, the understory carbon stock and SOC% and litter carbon and SOC% had a moderate positive correlation (r = 0.44; p < 0.05) (r = 0.53; p < 0.05), which indicated that understory and litter decompose residue positively increased the content of the organic carbon in the soil (Figures 6b, 8a).
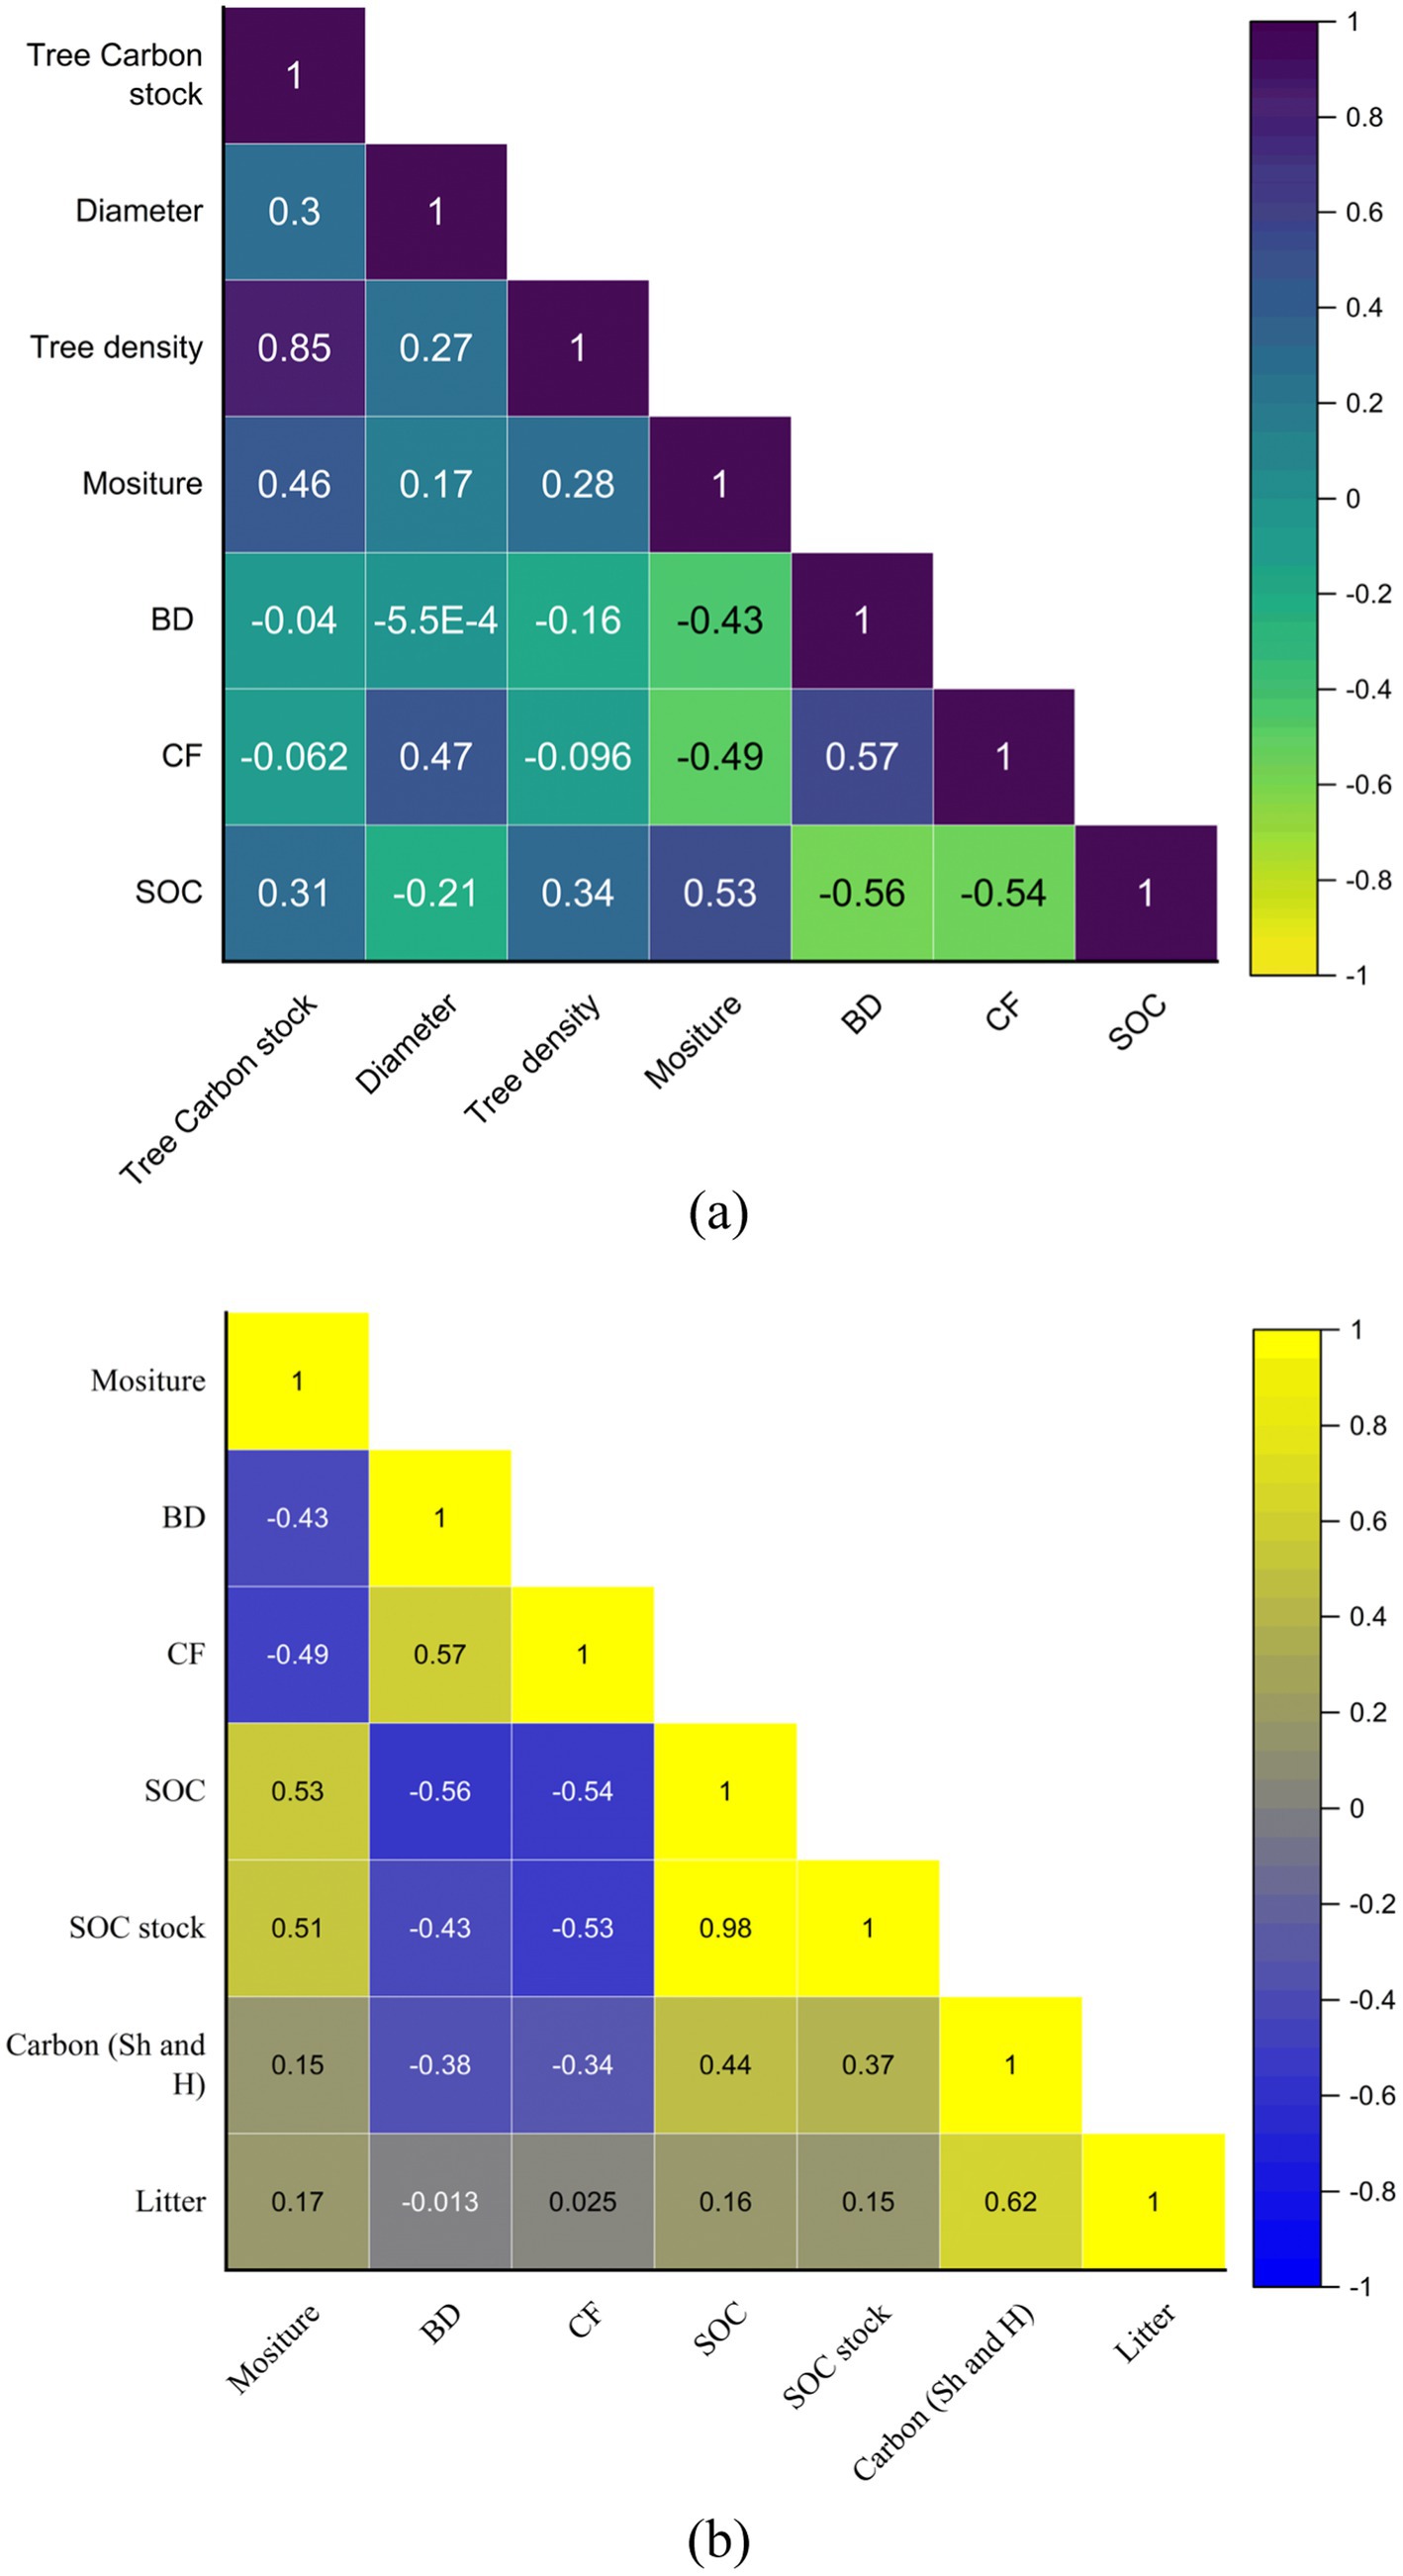
Figure 8. (a,b) Pearson correlation outcomes diagram of multiple variables among all forest communities in TWS.
The PCA revealed the role of specified attributes and their relationship between forest biomass and carbon stock in the forest stands (Figure 9). The principal components observed in the present analysis are tree carbon stock, tree density, dbh, soil organic carbon stock (SOC), and bulk density. The outcomes demonstrate the variance described by each principal component, with PC1 (41.8) illustrating the most comprehensive proportion of variance, PC2 (27.8). The tree carbon stock has a significant positive relationship between tree density and diameter, showing pragmatic trends. The PCA plot showed distinguishable relationships between all communities and their principal environment variables. The mixed communities are clustered in different junctions, with single-species stands dominating in some areas and pure forest communities in others, as illustrated in the plots below. This pattern indicates that each forest community is dependent on its significant environmental factors and plays a unique role in forming the fundamental forest ecosystem (Figure 7). All forest communities contribute significantly to strengthening the forest biomass and carbon stock with their dominant ecological factors. All of these communities’ tree density and dbh were the principal variables, as illustrated in the PCA plot (Figure 8).
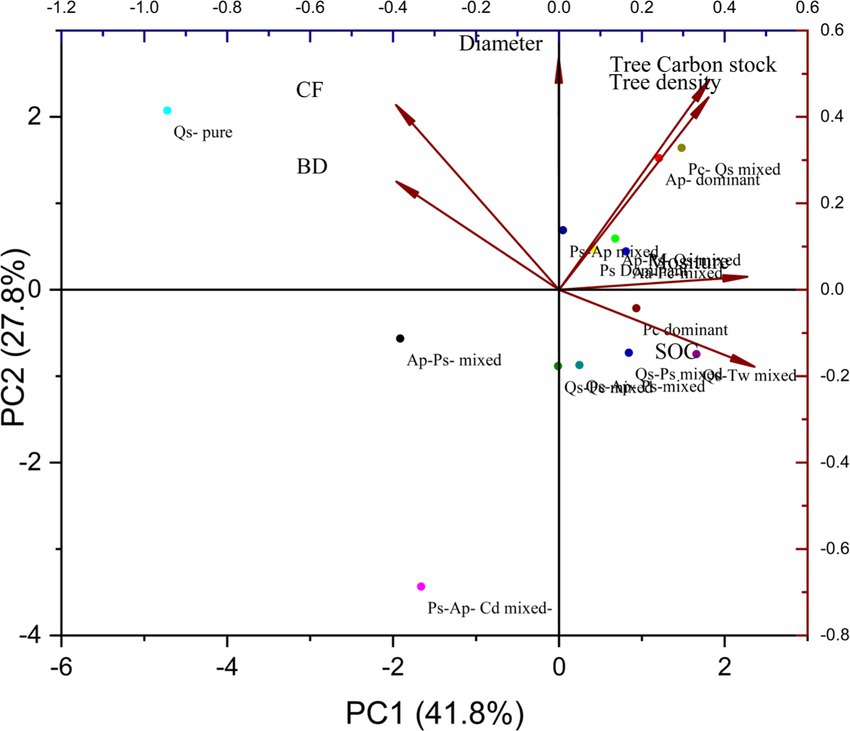
Figure 9. Principal component analyses (PC-1 and PC-2), showing the most comprehensive proportion of variance in Talra Wildlife Sanctuary.
Forests such as ban oak, western mixed coniferous, kharsu, moist temperate deciduous, subalpine, and alpine grassland exhibit a substantial capacity to act as carbon sinks. The results showed that the forest communities of Abies pindrow-Picea smithiana mixed (Ap-Ps), Abies Pindrow dominant (Ap), Abies pindrow-Picea smithiana-Quercus semecarpifolia mixed (Ap-Ps-Qs), Acer acuminatum-Prunus cornuta mixed, and Quercus semecarpifolia pure community were the dominant forest communities in the Talra Wildlife Sanctuary. The current study found that forests characterized by maximum diameter at breast height (dbh) and tree density significantly positively store biomass and carbon, thus sequestering more carbon from the atmosphere. The Kaushal and Baishya (2021) also monitored this kind of relationship. The study found that the predominant variables of total basal area, greater tree density, significantly increased biomass carbon stock. The study also found that tree biomass and carbon stock decrease significantly with increasing altitude. In the present study, at an altitude of 2569.6 to 2,874 m, tree carbon stock was relatively high, ranging from 297.6 to 357.7 Mg ha−1. Similarly, at an altitude of 2,925 to 3,267 m, carbon stock ranged from 131 to 259.8 Mg ha−1. However, in high altitudes, most of the forest stands were dominated by the Quercus semecarpifolia forest stand, which concluded that larger trees of confer forest stand, including Abies Pindrow and Picea smithiana forest stands, store more significant amounts of biomass and carbon than kharsu forest stand; this trend was also reported by Kaushal and Baishya (2021).
In a previous study, Sheikh et al. (2020) confirmed the negative trend of the allocation of biomass and carbon stock by the pace of altitude. The result showed that the total carbon stock (including soil, trees, and forest floor) of Cedrus deodara forest at distinguishable altitudes range was 395.4 t ha−1 (lower), 321.6 t ha−1 (middle), and 282.5 t ha−1 (high). A further study has also confirmed that the carbon stock of the biomass decreases with an increase in altitude (Nath et al., 2022). Earlier studies have also shown a similar kind of distribution of biomass carbon stock patterns in different parts of the Indian Himalayan Region (Devi et al., 2013; Haq et al., 2022; Gogoi et al., 2022; Haq et al., 2023). However, these trends and principles do not apply to all forest ecosystems. It can vary according to the specific functional characteristics of each forest ecosystem, its different environmental characteristics, structural patterns, and the topographic constraints it encounters (Shen et al., 2016; Dimri et al., 2017; Bu et al., 2019). Additionally, forest biomass is positively associated with tree density, basal area (%), forest structure and species dominance in TWS. Earlier studies (Wang et al., 2011; Cavanaugh et al., 2014; Behera et al., 2017; Kaushal and Baishya, 2021) highlighted positive associations between these forest characteristics. The study demonstrated that dominant species such as Abies pindrow, Quercus semecarpifolia, Picea smithiana, and Cedrus deodara were the major contributor species to carbon stock potential in the Talra Wildlife Sanctuary. The present study found a positive correlation between litter biomass and soil organic carbon. This mechanism is due to the thick layer of litter and plant species richness (PCR) biomass, which provides a profitable condition and accelerates the prompt microbial reaction through decomposition. These phenomena are a critical input of organic matter in the soil (Prommer et al., 2020; Wang et al., 2021; Simon et al., 2018). Microorganisms and other fungi bacteria decompose the litter into different compounds, such as cellulose, lignin, and proteins, forming humus substances and ultimately strengthening the recalcitrant carbon pools (Prommer et al., 2020; Berg and McClaugherty, 2020). A similar result was observed in the current study. The upper litter layer maintains the humus substance with understory and litter biomass, favoring carbon accumulation. This circulation of microbial mechanism is positively related to SOC% and humus content to maintain and amplify the soil carbon cycle in the forest ecosystem. The soil results in this study indicated a significant depth-wise variation of the physico-chemical properties among the forest communities. In the highly dissected landscapes of mountainous ecosystems, bioclimatic conditions change rapidly and vary within short distances, resulting in a pronounced heterogeneity of soils and their chemical, physical, and biological properties (Bargali et al., 2018; Fartyal et al., 2025). Physico-chemical properties of soils vary in space and time because of variations in topography, climate, weathering processes, vegetation cover, and microbial activities (Paudel and Sah, 2003; Bargali et al., 2019; Manral et al., 2022) and several other biotic and abiotic factors (Manral et al., 2020; Pandey et al., 2024). Consequently, it could directly affect the vegetation types and their functions in these fragile ecosystems (Baumler, 2015). The high SOC% on top layers may be due to the prompt decomposition of forest litter and accumulation and retention of organic materials of the litter layer on the top soil surface. Similar results were also documented in the temperate Cedrus deodara forests by Sheikh et al., 2020, in the moist temperate forest ecosystem by Gairola et al. (2012), and in the temperate forest ecosystem by Ahmad and Somaiah (2015). The decline in the SOC% content with increasing soil depth in the forest ecosystem may be due to declining organic matter input and crucial environmental factors such as humus, soil porosity and less microbial exudates, decomposition rate, and higher bulk density soil with less porosity in the deep down, which reduce the carbon content by the pace of soil depth (Lepcha and Devi, 2020; Hao et al., 2021; Fontaine et al., 2007).
Our present study observed that the Ap-Ps-Qs-mixed forest community’s understory biomass and carbon stock are a little bit higher than those of other forest communities. This may be because microclimatic circumstances in broad-leaf, conifer, and mixed forest communities could vary more widely. The mixed forest stand creates more profitable conditions due to its unique forest structure. The heterogeneous canopy, shaped by diverse crown structures and leaf dynamics, allows for enhanced sunlight penetration, creating dappled light conditions that foster a favorable environment and support the coexistence of small shrub and herb layer vegetation. Such a supportive coexistence symbiosis relationship in the deciduous-evergreen broad-leaved mixed forest stands was reported by Dormann et al. (2020) and Mestre et al. (2017). The different forest structural patterns in the forest communities in the TWS varied in their different habitat types. Concerning solar radiation variables, it is known that conifer forests have pyramidal crowns and fewer seasonal needle drops; therefore, they transmit only a tiny proportion of sunlight to the forest floor (Pelt and Franklin, 2000; Liu et al., 2015). The adequate amount of radiation reaching the forest floor is determined by canopy structure and forest density. According to this, we expected the highest level of solar radiation in Quercus semecarpifolia because the canopy of broad-leaf is relatively sparse and wide, with flat leaves and open canopy during the dormant season than conifer forest. However, due to a lack of study, we are unable to detect disparities in solar radiation between deciduous and evergreen forests. However, in Quercus semecarpifolia forest stand generally had more significant seasonal litter fall and variations in microclimatic conditions, including faster decomposition rates and distinct chemical compositions. Based on that, we can say that there could be the possibility of higher litter fall biomass than in conifer forests. A similar result was obtained in Kumaun Himalaya by Bohara et al. (2018) and in the subtropical oak forest by Pandey et al. (2024).
We conclude that Talra Wildlife Sanctuary is a rich hotspot, with multiple types of forest communities and canopy layers. The composition of different forest communities has significantly contributed to the growth of biomass and carbon stock in the whole forest ecosystem. The biomass and carbon stock and forest structure change along the altitudinal gradients in notable ways. For example, the conifer forest stand at a lower altitude followed by mixed stands determines structural features at the understory level. In comparison, the broad-leaf component at a higher altitude determines a pure community’s specific composition and dominant assemblage. The mixed forest communities were the most diverse and had higher amounts of biomass and carbon stock including the understory layer than pure conifer forests. Lack of litter accumulation in the forest floor of conifer forest results in little litter biomass. In the transition zone between the conifer and broad forest layers as transitional habitats, conifer and broad-leaf forests, which form mixed forest communities, had greater understory biomass. At the same time, our results indicate that habitat type, tree density, and basal area have a major influence on forest carbon storage. This study proposes that maintaining the subalpine and alpine regions of the mountain ecosystems along with their microhabitat and canopy patch types within mixed stands will be important for conserving the natural patterns of understory plant composition, biomass, and carbon stock in TWS.
The datasets presented in this study can be found in online repositories. The names of the repository/repositories and accession number(s) can be found in the article/Supplementary material.
AK: Conceptualization, Data curation, Investigation, Methodology, Resources, Software, Visualization, Writing – original draft, Writing – review & editing. KK: Writing – review & editing. SP: Software, Writing – review & editing. RV: Supervision, Writing – review & editing.
The author(s) declare that no financial support was received for the research and/or publication of this article.
The author would like to thank the Director of ICFRE-HFRI for providing the necessary facilities for this research. The author also expresses gratitude to all the researchers, especially Amit Singh, who assisted during the field data collection. Special thanks are extended to the IMD Pune for providing the rainfall data of the study region.
The authors declare that the research was conducted in the absence of any commercial or financial relationships that could be construed as a potential conflict of interest.
The author(s) declare that no Generative AI was used in the creation of this manuscript.
All claims expressed in this article are solely those of the authors and do not necessarily represent those of their affiliated organizations, or those of the publisher, the editors and the reviewers. Any product that may be evaluated in this article, or claim that may be made by its manufacturer, is not guaranteed or endorsed by the publisher.
The Supplementary material for this article can be found online at: https://www.frontiersin.org/articles/10.3389/ffgc.2025.1566614/full#supplementary-material
Ahirwal, J., Nath, A., Brahma, B., Deb, S., Sahoo, U. K., and Nath, A. J. (2021). Patterns and driving factors of biomass carbon and soil organic carbon stock in the Indian Himalayan region. Sci. Total Environ. 770:145292. doi: 10.1016/j.scitotenv.2021.145292
Ahmad, D. J., and Somaiah, S. (2015). Altitudinal variation of soil organic carbon stocks in temperate forests of Kashmir Himalayas, India. Environ. Monit. Assess. 187, 11–15. doi: 10.1007/s10661-014-4204-9
Altaf, A., Haq, S. M., Shabnum, N., and Jan, H. A. (2022). Comparative assessment of phyto diversity in Tangmarg Forest division in Kashmir Himalaya, India. Acta Ecol. Sinica. Assessment 42, 609–615. doi: 10.1016/j.chnaes.2021.04.009
Baboo, B., Sagar, R., Bargali, S. S., and Verma, H. (2017). Tree species composition, regeneration and diversity of an Indian dry tropical forest protected area. Trop. Ecol. 58, 409–423.
Bargali, K., Manral, V., Padalia, K., Bargali, S. S., and Upadhyay, V. P. (2018). Effect of vegetation type and season on microbial biomass carbon in central Himalayan forest soils, India. Catena 171, 125–135. doi: 10.1016/j.catena.2018.07.001
Bargali, S. S., Padalia, K., and Bargali, K. (2019). Effects of tree fostering on soil health and microbial biomass under different land use systems in the Central Himalayas. Land Degrad. Dev. 30, 1984–1998. doi: 10.1002/ldr.3394
Bates, N. H. (1996). Total carbon and soil nitrogen in the soils of the world. Eur. J. Soil Sci. 47, 151–163. doi: 10.1111/j.1365-2389.1996.tb01386.x
Baumler, R. (2015). “Soils” in Nepal: An introduction to the natural history, ecology and human environment in the Himalayas—A companion to the Flora of Nepal. ed. C. A. Miehe, vol. 171. 1st ed (The Royal Botanical Garden Edinburgh: Publisher), 125–135.
Behera, S. K., Sahu, N., Mishra, A. K., Bargali, S. S., Behera, M. D., and Tuli, R. (2017). Aboveground biomass and carbon stock assessment in Indian tropical deciduous forest and relationship with stand structural attributes. Ecol. Eng. 99, 513–524. doi: 10.1016/j.ecoleng.2016.11.046
Berg, B., and McClaugherty, C. (2020). “Decomposition as a process—some main features” in Plant Litter: Decomposition, Humus Formation, Carbon Sequestration (Springer), 13–43. doi: 10.1007/978-3-030-59631-6_2
Bisht, S., Bargali, S. S., Bargali, K., Rawat, Y. S., and Rawat, G. S. (2023). Dry matter dynamics and carbon flux along riverine forests of Gori valley, Western Himalaya. Front. Forests Global Change 6:1206677. doi: 10.3389/ffgc.2023.1206677
Bisht, S., Bargali, S. S., Bargali, K., Rawat, G. S., Rawat, Y. S., and Fartyal, A. (2022). Influence of anthropogenic activities on forest carbon stocks—a case study from Gori Valley, Western Himalaya. Sustainability 14:16918. doi: 10.3390/su142416918
Bisht, A. S., and Thakur, N. S. (2021). Identification & prioritisation of barriers in the growth of pine needle biomass gasification plants (< 250 kW) for electricity generation in the Western Himalayan region: Uttarakhand, India. Process Integrat. Optimiz. Sustain. 6, 37–60. doi: 10.1007/s41660-021-00199-y
Blake, G. R. (1965). Bulk density. Methods of soil analysis: part 1 physical and mineralogical properties. Including statistics measurement sampling 9, 374–390. doi: 10.2134/agronmonogr9.1.c30
Bohara, R., Chand, H. B., and Tewari, A. (2018). Biomass and carbon stock in Kharsu oak (Quercus semecarpifolia) dominated Forest in Nainital District of Kumaun Himalaya. J. Energy Res. Environ. Technol. 921, 170896–170850.
Bu, W., Huang, J., Xu, H., Zang, R., Ding, Y. L., and Zhang, C. (2019). Plant functional traits are the mediators in regulating effects of abiotic site conditions on aboveground carbon stock-evidence from a 30 ha tropical forest plot. Front. Plant Sci. 9:1958. doi: 10.3389/fpls.2018.01958
Cairns, M. A., Brown, S., Helmer, E. H., and Baumgardner, G. A. (1997). Root biomass allocation in the world’s upland forests. Oecologia 111, 1–11. doi: 10.1007/s004420050201
Cavanaugh, K. C., Gosnell, J. S., Davis, S. L., Ahumada, J., Boundja, P., Clark, D. B., et al. (2014). Carbon storage in tropical forests correlates with taxonomic diversity and functional dominance on a global scale. Glob. Ecol. Biogeogr. 23, 563–573. doi: 10.1111/geb.12143
Champion, H. G., and Seth, S. K. (1968). A revised survey of the forest types of India : Manager of Publications, 404.
Das, S., Deb, S., Sahoo, S. S., and Sahoo, U. K. (2023). Soil microbial biomass carbon stock and its relation with climatic and other environmental factors in forest ecosystems: a review. Acta Ecol. Sin. 43, 933–945. doi: 10.1016/j.chnaes.2022.12.007
Devi, B., Bhardwaj, D. R., Panwar, P., Pal, S., Gupta, N. K., and Thakur, C. L. (2013). Carbon allocation, sequestration and carbon dioxide mitigation under plantation forests of north western Himalaya, India. Ann. For. Res. 56, 123–135.
Devi, N. B., and Lepcha, N. T. (2023). Carbon sink and source function of eastern Himalayan forests: implications of change in climate and biotic variables. Environ. Monit. Assess. 195:843. doi: 10.1007/s10661-023-11460-x
Dhimal, M., Bhandari, D., Dhimal, M. L., Kafle, N., Pyakurel, P., Mahotra, N., et al. (2021). Impact of climate change on health and well-being of people in Hindu Kush Himalayan region: a narrative review. Front. Physiol. 12:651189. doi: 10.3389/fphys.2021.651189
Dhyani, S., and Dhyani, D. (2016). “Strategies for reducing deforestation and disaster risk: lessons from Garhwal Himalaya, India” in Ecosystem-Based Disaster Risk Reduction and Adaptation in Practice (Springer), 507–528. doi: 10.1007/978-3-319-43633-3_22
Dimri, S., Baluni, P., and Sharma, C. M. (2017). Biomass production and carbon storage potential of selected old-growth temperate forests in Garhwal Himalaya, India. Proceed. Natl. Acad. Sci. India Section B 87, 1327–1333. doi: 10.1007/s40011-016-0708-0
Dormann, C. F., Bagnara, M., Boch, S., Hinderling, J., Janeiro-Otero, A., Schäfer, D., et al. (2020). Plant species richness increases with light availability, but not variability, in temperate forests understorey. BMC Ecol. 20, 43–49. doi: 10.1186/s12898-020-00311-9
Edwards, P. M. (2002). Origin 7.0: scientific graphing and data analysis software. J. Chem. Inf. Comput. Sci. 42, 1270–1271. doi: 10.1021/ci0255432
Eggleston, H. S., Buendia, L., Miwa, K., Ngara, T., and Tanabe, K. (2006). 2006 IPCC guidelines for national greenhouse gas inventories. Japan. Available at: https://www.ipcc-nggip.iges.or.jp/public/2006gl: IGES.
FSI (1996). Volume equations for forests of India, Nepal and Bhutan. Forest Survey of India. Available at: https://fsi.nic.in/uploads/documents/volume-equations-for-forests-of-india-nepal-and-bhutan-2803-2023.pdf
Fartyal, A., Bargali, S. S., Bargali, K., and Negi, B. (2025). Changes in soil properties, organic carbon, and nutrient stocks after land-use change from forests to grasslands in Kumaun Himalaya. India: Land Degradation & Development.
Fontaine, S., Barot, S., Barré, P., Bdioui, N., Mary, B., and Rumpel, C. (2007). Stability of organic carbon in deep soil layers controlled by fresh carbon supply. Nature 450, 277–280. doi: 10.1038/nature06275
Forest Survey of India. (2021). India State of Forest Report 2021. Ministry of Environment, Forest and Climate Change, Government of India. Available at: https://www.fsi.nic.in/forest-report-2021-details
Gairola, S., Sharma, C. M., Ghildiyal, S. K., and Suyal, S. (2012). Chemical properties of soils in relation to forest composition in moist temperate valley slopes of Garhwal Himalaya, India. Environmentalist 32, 512–523. doi: 10.1007/s10669-012-9420-7
Gaury, P. K., and Devi, R. (2017). Plant species composition and diversity at the Aravalli Mountain range in Haryana, India. J. Biodivers 8, 34–43. doi: 10.31901/24566543.2017/08.01.03
Gogoi, A., Ahirwal, J., and Sahoo, U. K. (2022). Evaluation of ecosystem carbon storage in major forest types of eastern Himalaya: implications for carbon sink management. J. Environ. Manag. 302:113972. doi: 10.1016/j.jenvman.2021.113972
Gupta, A. K., Negi, M., Nandy, S., Alatalo, J. M., Singh, V., and Pandey, R. (2019). Assessing the vulnerability of socio-environmental systems to climate change along an altitude gradient in the Indian Himalayas. Ecol. Indic. 106:105512. doi: 10.1016/j.ecolind.2019.105512
Garmin Ltd (2016). Garmin GPSMAP 64sc : Garmin Ltd. Available at: https://www.garmin.com.
Hairiah, K., Sitompul, S. M., Van Noordwijk, M., and Palm, C. (2001). Methods for sampling carbon stocks above and below ground. Bogor, Indonesia: ICRAF, 1–23.
Hammer, Ø., and Harper, D. A. (2001). Past: paleontological statistics software package for educaton and data anlysis. Palaeontol. Electron. 4:1.
Hao, X., Ball, B. C., Culley, J. L. B., Carter, M. R., and Parkin, G. W. (2008). Soil density and porosity. Soil Sampling Methods Analysis 2, 743–759.
Hao, J., Chai, Y. N., Lopes, L. D., Ordóñez, R. A., Wright, E. E., Archontoulis, S., et al. (2021). The effects of soil depth on the structure of microbial communities in agricultural soils in Iowa (United States). Appl. Environ. Microbiol. 87, e02673–e02620. doi: 10.1128/AEM.02673-20
Haq, S. M., Rashid, I., Calixto, E. S., Ali, A., Kumar, M., Srivastava, G., et al. (2022). Unravelling patterns of forest carbon stock along a wide elevational gradient in the Himalaya: implications for climate change mitigation. For. Ecol. Manag. 521:120442. doi: 10.1016/j.foreco.2022.120442
Haq, S. M., Rashid, I., Waheed, M., and Khuroo, A. A. (2023). From forest floor to tree top: partitioning of biomass and carbon stock in multiple strata of forest vegetation in Western Himalaya. Environ. Monit. Assess. 195:812. doi: 10.1007/s10661-023-11376-6
Himachal Pradesh Forest Department (2020). Management Plan Talra Wildlife Sanctuary. Himachal Pradesh Forest Department. Available at: https://hpforest.gov.in.
IMD. (2024). Data supply portal (DSP). Available at: https://dsp.imdpune.gov.in (Accessed October 16, 2024).
Intergovernmental Panel on Climate Change (IPCC) (2003). Good practice guidance for land use, land-use change and forestry. Institute for Global Environmental Strategies. Available at: https://www.ipcc nggip.iges.or.jp/public/gpglulucf/gpglulucf.html
Jana, C., Mandal, D., Shrimali, S. S., Alam, N. M., Kumar, R., Sena, D. R., et al. (2020). Assessment of urban growth effects on green space and surface temperature in Doon Valley, Uttarakhand, India. Environ. Monit. Assess. 192, 1–17. doi: 10.1007/s10661-020-8184-7
Kaushal, S., and Baishya, R. (2021). Stand structure and species diversity regulate biomass carbon stock under major central Himalayan forest types of India. Ecol. Process. 10, 1–18. doi: 10.1186/s13717-021-00283-8
Kershaw, K. R. (1973). Quantitative and Dynamic Plant Ecology. Hodder \u0026amp; Stoughton Ltd, London, 318 p.
Kumar, V., and Chopra, A. K. (2009). Impact of climate change on biodiversity of India with special reference to Himalayan region-an overview. J. Appl. Natl. Sci. 1, 117–122. doi: 10.31018/jans.v1i1.48
Kumar, A., Kumar, P., Srivastava, V. C., Giri, A., Pant, D., and Verma, R. K. (2023). “Terrestrial carbon stock and sink potential of Indian Himalayan Forest ecosystem: a tool for combating climate change” in Soil carbon dynamics in Indian Himalayan region (Singapore: Springer Nature Singapore), 77–91.
Kumar, A., Shashni, S., Kumar, P., Pant, D., Singh, A., and Verma, R. K. (2021). Phytochemical constituents, distributions and traditional usages of Arnebia euchroma: a review. J. Ethnopharmacol. 271:113896. doi: 10.1016/j.jep.2021.113896
Kumar, A., Verma, R. K., and Kumar, P. (2024a). “Biomass and carbon stock in protected areas across northwest Himalaya: an optimal sustainable Forest land management strategy to amplify carbon sequestration potential” in Sustainable land Management in India (Singapore: Springer), 117–128.
Kumar, A., Verma, R. K., Kumar, P., and Dushyant, (2024b). “Indigenous acquaintance and perceptions of local inhabitants towards biodiversity conservation in Talra wildlife sanctuary, North Western Himalaya, India” in Learning ‘from’and ‘with’the locals: Traditional knowledge Systems for Environmental Sustainability in the Himalayas (Cham: Springer Nature Switzerland), 53–72.
Lambers, H., and Oliveira, R. S. (2019). “Photosynthesis, respiration, and long-distance transport: photosynthesis” in Plant Physiological Ecology. 4th ed (Springer), 11–114. doi: 10.1007/978-3-030-29639-1_2
Lepcha, N. T., and Devi, N. B. (2020). Effect of land use, season, and soil depth on soil microbial biomass carbon of eastern Himalayas. Ecol. Process. 9, 1–14. doi: 10.1186/s13717-020-00269-y
Liu, T. Y., Lin, K. C., Vadeboncoeur, M. A., Chen, M. Z., Huang, M. Y., and Lin, T. C. (2015). Understorey plant community and light availability in conifer plantations and natural hardwood forests in Taiwan. Appl. Veg. Sci. 18, 591–602. doi: 10.1111/avsc.12178
Mahabal, A. (2000). Birds of Talra Wildlife Sanctuary in lower western Himalaya, HP, with notes on their status and altitudinal movements. Zoos’ Print J. 15, 334–338. doi: 10.11609/joz.2000.15.10.334-338
Mamidala, H. P., Ganguly, D., Purvaja, R., Singh, G., Das, S., Rao, M. N., et al. (2023). Interspecific variations in leaf litter decomposition and nutrient release from tropical mangroves. J. Environ. Manag. 328:116902. doi: 10.1016/j.jenvman.2022.116902
Manral, V., Bargali, K., Bargali, S. S., Jhariya, M. K., and Padalia, K. (2022). Relationships between soil and microbial biomass properties and annual flux of nutrients in central Himalaya forests, India. Land Degrad. Develop. 33, 2014–2025. doi: 10.1002/ldr.4283
Manral, V., Bargali, K., Bargali, S. S., and Shahi, C. (2020). Changes in soil biochemical properties following replacement of Banj oak forest with Chir pine in central Himalaya, India. Ecol. Process. 9, 1–9. doi: 10.1186/s13717-020-00235-8
Mehta, P., Sekar, K. C., Bhatt, D., Tewari, A., Bisht, K., Upadhyay, S., et al. (2020). Conservation and prioritization of threatened plants in Indian Himalayan region. Biodivers. Conserv. 29, 1723–1745. doi: 10.1007/s10531-020-01959-x
Mestre, L., Toro-Manríquez, M., Soler, R., Huertas-Herrera, A., Martínez-Pastur, G., and Lencinas, M. V. (2017). The influence of canopy-layer composition on understory plant diversity in southern temperate forests. Forest Ecosyst. 4, 1–13. doi: 10.1186/s40663-017-0093-z
Mishra, P. K., Rai, A., and Rai, S. C. (2020). Land use and land cover change detection using geospatial techniques in the Sikkim Himalaya, India. Egypt. J. Remote Sens. Space Sci. 23, 133–143. doi: 10.1016/j.ejrs.2019.02.001
Nath, P. C., Ahmed, A., Bania, J. K., Majumdar, K., Nath, A. J., and Das, A. K. (2022). Tree diversity and biomass carbon stock along an altitudinal gradient in old-growth secondary semi-evergreen forests in North East India. Trop. Ecol. 63, 20–29. doi: 10.1007/s42965-021-00185-y
Olokeogun, O. S., and Kumar, M. (2020). An indicator based approach for assessing the vulnerability of riparian ecosystem under the influence of urbanization in the Indian Himalayan city, Dehradun. Ecol. Indicat. 119:106796. doi: 10.1016/j.ecolind.2020.106796
Pandey, R., Bargali, S. S., Bargali, K., Karki, H., and Chaturvedi, R. K. (2024). Dynamics of nitrogen mineralization and fine root decomposition in sub-tropical Shorea robusta Gaertner f. forests of central Himalaya, India. Sci. Total Environ. 921:170896. doi: 10.1016/j.scitotenv.2024.170896
Paudel, S., and Sah, J. P. (2003). Physiochemical characteristics of soil in tropical Sal (Shorea robusta Gaertn.) forests in eastern Nepal. Himal. J. Sci. 1, 107–110. doi: 10.3126/hjs.v1i2.207
Pelt, R. V., and Franklin, J. F. (2000). Influence of canopy structure on the understory environment in tall, old-growth, conifer forests. Can. J. For. Res. 30, 1231–1245. doi: 10.1139/x00-050
Penman, J., Gytarsky, M., Hiraishi, T., Krug, T., Kruger, D., Pipatti, R., et al. (2003). Good practice guidance for land use, land-use change and forestry. Available at: https://www.ipcc-nggip.iges.or.jp/public/gpglulucf/gpglulucf_files/GPG_LULUCF_FULL.pdf (Accessed December 12, 2024).
Pimm, S. L., Jenkins, C. N., Abell, R., Brooks, T. M., Gittleman, J. L., Joppa, L. N., et al. (2014). The biodiversity of species and their rates of extinction, distribution, and protection. Science 344:1246752. doi: 10.1126/science.1246752
Prommer, J., Walker, T. W., Wanek, W., Braun, J., Zezula, D., Hu, Y., et al. (2020). Increased microbial growth, biomass, and turnover drive soil organic carbon accumulation at higher plant diversity. Glob. Chang. Biol. 26, 669–681. doi: 10.1111/gcb.14777
Ren, H., Lu, H., Wang, J., Liu, N., and Guo, Q. (2012). Forest restoration in China: advances, obstacles, and perspectives. Tree Forestry Sci. Biotechnol. 6, 7–16.
Sharma, C. M., Gairola, S., Baduni, N. P., Ghildiyal, S. K., and Suyal, S. (2011). Variation in carbon stocks on different slope aspects in seven major forest types of temperate region of Garhwal Himalaya, India. J. Biosci. 36, 701–708. doi: 10.1007/s12038-011-9103-4
Sheikh, M. A., Kumar, M., Todaria, N. P., and Pandey, R. (2020). Biomass and soil carbon along altitudinal gradients in temperate Cedrus deodara forests in central Himalaya, India: implications for climate change mitigation. Ecol. Indic. 111:106025. doi: 10.1016/j.ecolind.2019.106025
Shen, Y., Yu, S., Lian, J., Shen, H., Cao, H., Lu, H., et al. (2016). Tree aboveground carbon storage correlates with environmental gradients and functional diversity in a tropical forest. Sci. Rep. 6:25304. doi: 10.1038/srep25304
Simon, A., Dhendup, K., Rai, P. B., and Gratzer, G. (2018). Soil carbon stocks along elevational gradients in eastern Himalayan mountain forests. Geoderma Reg. 12, 28–38. doi: 10.1016/j.geodrs.2017.11.004
Singh, J. S. (2006). Sustainable development of the Indian Himalayan region: linking ecological and economic concerns. Curr. Sci. 90, 784–788.
Tiwari, P. C., Tiwari, A., and Joshi, B. (2018). Urban growth in Himalaya: understanding the process and options for sustainable development. J. Urban Regional Stud. Contemp. India 4, 15–27.
Vance, E. D., Brookes, P. C., and Jenkinson, D. S. (1987). An extraction method for measuring soil microbial biomass C. Soil Biol. Biochem. 19, 703–707. doi: 10.1016/0038-0717(87)90052-6
Walkley, A., and Black, I. A. (1934). An examination of the Degtjareff method for determining soil organic matter, and a proposed modification of the chromic acid titration method. Soil Sci. 37, 29–38. doi: 10.1097/00010694-193401000-00003
Wang, W., Lei, X., Ma, Z., Kneeshaw, D. D., and Peng, C. (2011). Positive relationship between aboveground carbon stocks and structural diversity in spruce-dominated forest stands in New Brunswick, Canada. Forest Sci. 57, 506–515. doi: 10.1093/forestscience/57.6.506
Wang, M., Tian, Q., Liao, C., Zhao, R., and Liu, F. (2021). Effect of litter-derived dissolved organic carbon addition on Forest soil microbial community composition. Front. Soil Sci. 1:733431. doi: 10.3389/fsoil.2021.733431
Wani, Z. A., and Pant, S. (2023). Status of biodiversity in a protected area of Kashmir Himalaya: Gulmarg wildlife sanctuary. Nord. J. Bot. 2023:e03982. doi: 10.1111/njb.03982
Keywords: carbon stock potential, understory biomass, climate change, soil organic carbon, biomass
Citation: Kumar A, Kanwal KS, Paul S and Verma RK (2025) Biomass and carbon stock of conifer and broad-leaf forest stands in Talra Wildlife Sanctuary across Northwest Himalayas, India. Front. For. Glob. Change. 8:1566614. doi: 10.3389/ffgc.2025.1566614
Edited by:
Manoj Kumar Jhariya, Sant Gahira Guru Vishwavidyalaya, IndiaReviewed by:
Donald Mlambo, National University of Science and Technology, ZimbabweCopyright © 2025 Kumar, Kanwal, Paul and Verma. This is an open-access article distributed under the terms of the Creative Commons Attribution License (CC BY). The use, distribution or reproduction in other forums is permitted, provided the original author(s) and the copyright owner(s) are credited and that the original publication in this journal is cited, in accordance with accepted academic practice. No use, distribution or reproduction is permitted which does not comply with these terms.
*Correspondence: Anil Kumar, c2hhcm1hYW5pbDIxOTJAZ21haWwuY29t
Disclaimer: All claims expressed in this article are solely those of the authors and do not necessarily represent those of their affiliated organizations, or those of the publisher, the editors and the reviewers. Any product that may be evaluated in this article or claim that may be made by its manufacturer is not guaranteed or endorsed by the publisher.
Research integrity at Frontiers
Learn more about the work of our research integrity team to safeguard the quality of each article we publish.