 Christopher E. Looney
 John D. Shaw
94% of researchers rate our articles as excellent or good
Learn more about the work of our research integrity team to safeguard the quality of each article we publish.
Find out more
ORIGINAL RESEARCH article
Front. For. Glob. Change, 26 March 2025
Sec. Forest Growth
Volume 8 - 2025 | https://doi.org/10.3389/ffgc.2025.1566459
Forest stocking guidelines traditionally reference self-thinning lines representing the tradeoff between maximum trees per unit area vs. maximum mean tree size for even-aged stands. While self-thinning lines are roughly linear on logarithmic scales, certain forest types display a curvilinear “mature stand boundary” (MSB). The existence of the MSB suggests that beyond self-thinning, processes such as recruitment limitation, density-independent mortality, and their interactions with site quality may also contribute to a more universal maximum size-density boundary (MSDB). To advance forest modeling and the management of mature stands under global change, we investigated: (1) how the MSDB may differ as stands biologically mature in response to climate and N deposition, (2) whether mortality and recruitment contribute to the curvilinearity of the MSDB. To accomplish this, we compiled forest inventory, climate, and total N deposition data for four western U.S. forest types (California mixed-conifer, ponderosa pine, Douglas-fir, and pinyon-juniper). We examined three aspects of climate: thermal loading, aridity, and seasonality of precipitation. We used 0.95 quantile regression to model the MSDB and generalized linear modeling for mortality and recruitment. Unlike studies of even-aged stands that found abrupt MSBs, we found evidence for curvilinear MSDBs in all four forest types, with climate and/or N deposition modulating the degree of curvilinearity. Aridity constrained maximum stocking in medium-large diameter stands of California mixed-conifer and Douglas-fir, while higher growing-season precipitation constrained maximum stocking in large-diameter ponderosa pine. Heavier N deposition lowered maximum stocking in large-diameter stands of California mixed-conifer and pinyon-juniper. In California mixed-conifer and Douglas-fir, N deposition steepened the slope of the MSDB in small-diameter stands. Mortality was consistent along the MSDB for ponderosa pine, concentrated in large-diameter California mixed-conifer and Douglas-fir stands, and small-diameter pinyon-juniper stands. Recruitment was elevated in small-diameter stands of all four forest types. Our results support roles for both mortality and recruitment in driving curvilinear MSDBs. Our findings caution against assuming that self-thinning consistently defines the MSDB throughout stand development, while having important implications for the management of mature and old-growth stands under global change, especially at extremes of resource availability where the limitations of traditional tools may be most acute.
Density management diagrams are used to illustrate the range of possible forest stand structures in terms of tree size and number, from the minimum stocking needed to achieve site occupancy to the maximum stocking which avoids accelerated density-dependent mortality, when managing forest stands for a variety of objectives (Ray et al., 2023). Originally develop for young, even-aged stands, density management diagrams draw upon the-3/2 log self-thinning “rule” of plant ecology, and empirical tradeoff between individual performance and population density that has been found to apply widely across the plant kingdom (Yoda, 1963; Gorham et al., 1979; Keddy, 2001). This accordance across species, combined with the historical assumption that self-thinning lines are independent of site quality, led to the suggestion that the −3/2 self-thinning rule might be among the few universal constants of forest ecology (Long et al., 2004). Subsequent research (e.g., Shaw, 2006; Ducey et al., 2017), however, has raised questions as to whether self-thinning (a) remains linear throughout forest stand development and (b) is consistent across gradients of resource availability.
Whereas self-thinning lines are roughly linear when plotted in log–log scaled space (Reineke, 1933; Yoda, 1963; Drew and Flewelling, 1979), they are not consistently linear for all species at all stand developmental stages (Shaw, 2006; Zeide, 2010). For example, Shaw and Long (2007) constructed a density management diagram for even-aged, pure longleaf pine (Pinus palustris Marsh) with a flatter, nonlinear boundary at high quadratic mean diameter (QMD), which the authors attributed to an inability of overstory trees and regeneration in mature stands of this shade-intolerant species to fully reoccupy canopy gaps. The resulting additional constraint on size-density space has been called the mature stand boundary (MSB) (Shaw, 2006; Shaw and Long, 2007). Studies providing evidence of an MSB in both shade-intolerant pines and shade-tolerant true firs (Abies spp.) suggest this phenomenon is not a function of shade tolerance (Charru et al., 2012; Vacchiano et al., 2013). Zeide (2010) proposed that elevated mortality risk in large trees, rather than purely a lack of regeneration in small trees, contributed to the fall-off in maximum density in mature stands.
In addition to the linearity of the self-thinning line, there is conflicting evidence as to whether the intercept of the line, and thus overall maximum SDI, varies with resource availability. This issue is partly one of semantics, as the original concept of SDI defined a single maximum for a given forest type regardless of age or site quality, acknowledging that local conditions may prevent a stand from approaching full potential (Andrews et al., 2018). Studies of lodgepole pine (Pinus contorta), Scots pine (Pinus sylvestris), and Douglas-fir (Pinus sylvestris) established that maximum stocking is consistent over a range of site quality (Drew and Flewelling, 1979; Jack and Long, 1996; Pretzsch and Biber, 2022). Whereas fertilization only temporarily increases stand carrying capacity (Jack and Long, 1996; Pretzsch and Biber, 2022), studies in the Pacific Northwest (Kimsey et al., 2019), Lake States (Ducey et al., 2017), and New England regions of the U.S. (Andrews et al., 2018; Weiskittel and Kuehne, 2019) found that maximum SDI locally declines with resource limitation. Furthermore, an experiment with quaking aspen (Populus tremuloides) found that maximum SDI may increase with atmospheric CO2 (Kubiske et al., 2019). Climatic factors such as temperature extremes, aridity, and thermal loading may also limit local maximum SDI (Ducey et al., 2017; Andrews et al., 2018; Kimsey et al., 2019). Whether the linearity of the self-thinning line itself varies with abiotic factors remains unexplored.
Soil nutrient status, most commonly nitrogen (N), often presents the primary limitation to stand growth after moisture availability (Powers, 1999). N deposition from agricultural and industrial activity is a key aspect of global change impacts on forests (Clark et al., 2019). Particularly since the advent of synthetic ammonia production in the early 20th century, anthropogenic N inputs have dramatically augmented natural sources. Impacts on forests range from positive to negative and include accelerated-to-reduced tree growth, declining soil buffering capacity, higher rates of tree damage, and the loss of N-sensitive species (Bowman et al., 2008; Bobbink et al., 2010; Fenn et al., 2020). N deposition effects on tree growth may offset increases in aridity or N limitation from rising ambient CO2 levels (Ibáñez et al., 2018). Given trends of declining N deposition in the United States and Europe (Walker et al., 2019) and the anticipated increase in N limitation under rising CO2 (Finzi et al., 2006), understanding the historical role of N deposition on the self-thinning line may provide important insights into sustaining mature and old-growth forests under global change.
Prior studies have generally treated the self-thinning line and the MSB as separate characteristics of stand dynamics. The self-thinning line became entrenched as an ecological “law” through the work of Yoda (1963) and Reineke (1933), but questions about variability of shape, slope, and intercept are more recent. Self-thinning implies a competitive interaction wherein the stand trajectory in size-density space is limited by a biological maximum. This biological maximum can further be defined as what is possible within the natural range of a species. The true nature of this limit at very low stand diameters is likely never to be known, owing to lack of data. Rarely do forest stands establish with enough seedlings to reach maximum stocking, so the resulting observations of natural stands can suggest nonlinearity. The concept of the MSB (Shaw, 2006; Shaw and Long, 2007) suggests that the size-density limit for some forest types is not strictly guided by competition, but that other stand characteristics or phenomena define the limits of size-density combinations in maturing, natural stands. The absence of a competitive self-thinning dynamic can arise when there is an imbalance between the release of growing space and the recapture of that space by survivor trees and recruitment. In Oliver and Larson’s (1996) stand dynamics model, the MSB might routinely delineate the transition between the understory-reinitiation and old-growth stages, if recruitment and survivor tree growth cannot keep up with mortality as disturbance replaces competition as the primary force driving stand dynamics in maturing stands (Larson et al., 2015). Recruitment failure and/or excessive mortality rates may result in size-density combinations that are well below the MSB rather than necessarily defining it. Another possibility is that, instead of describing a consistent self-thinning threshold, the MSB reflects gradual changes in the intercept of the self-thinning relationship. Generational changes in maximum stocking driven by management gains or global change could alter the intercept of a linear limit while giving the appearance of nonlinear distortions in size-density space (Yang and Brandeis, 2022).
Extending traditional plant ecology and density management concepts to mature and old-growth stands would both help predict the trajectory and inform the design of treatments to sustain or recruit these forest structures under global change. Because of the complexity of processes potentially limiting size density space, including those that we explore in this paper, from this point forward we refer to the combined limitation on size-density space as the maximum size-density boundary (MSDB). Regardless of the mechanisms constraining size-density space, understanding the nature of the MSDB is critical to guide the design and scheduling of thinning treatments and final harvest. It defines a “no-go” space that would be violated in cases of stand development planning with strict adherence to the self-thinning relationship. Likewise, understanding whether MSDBs shift during stand maturation could improve estimates of mortality in forest growth and yield modeling (Crookston and Dixon, 2005), since many models rely at least in part on the self-thinning concept to guide mortality. Furthermore, determining whether the shapes of MSDBs vary with climate and N deposition would help anticipate nuanced forest responses to global change. We used forest inventory data for four important, western U.S. forest types to examine the consistency of density management guidelines across broad gradients of stand development and abiotic stress. Our definitions of mature and old-growth stands correspond to the process-based understory reinitiation and old-growth stages of Oliver and Larson (1996), respectively. However, given the lack of a universal consensus on definitions of mature and old-growth stands (Pelz et al., 2023) and the common unavailability of the age structure data needed to make robust classifications (Oliver and Larson, 1996), we interpret mean stand diameter as a continuous indicator of biological maturity (related to mean tree size, e.g., Pretzsch, 2009) rather than define discrete age or structural thresholds of stand development. Our objectives were to understand (Q1) how the maximum size-density boundary may respond differently to climate and N deposition as stands biologically mature, (Q2) whether mortality and recruitment potentially contribute to the curvilinearity of the MSDB.
We used U.S. Forest Service Forest Inventory and Analysis (FIA) national inventory data, covering the contiguous U.S. from the Pacific Coast to the Rocky Mountain states and western South Dakota (Figure 1). The current National FIA annualized inventory design was established in 1998, with initial plot installation taking place over the following two decades depending on state (Gillespie, 1999). Plots are organized into panels that are scheduled for measurement every 5 to 10 years, depending on the state and funding constraints, with the panels in a full cycle comprising a statistical sample (Bechtold and Patterson, 2005). All states in our analysis are currently under 10-year remeasurement cycles, except for South Dakota, which is on a 5-year cycle.
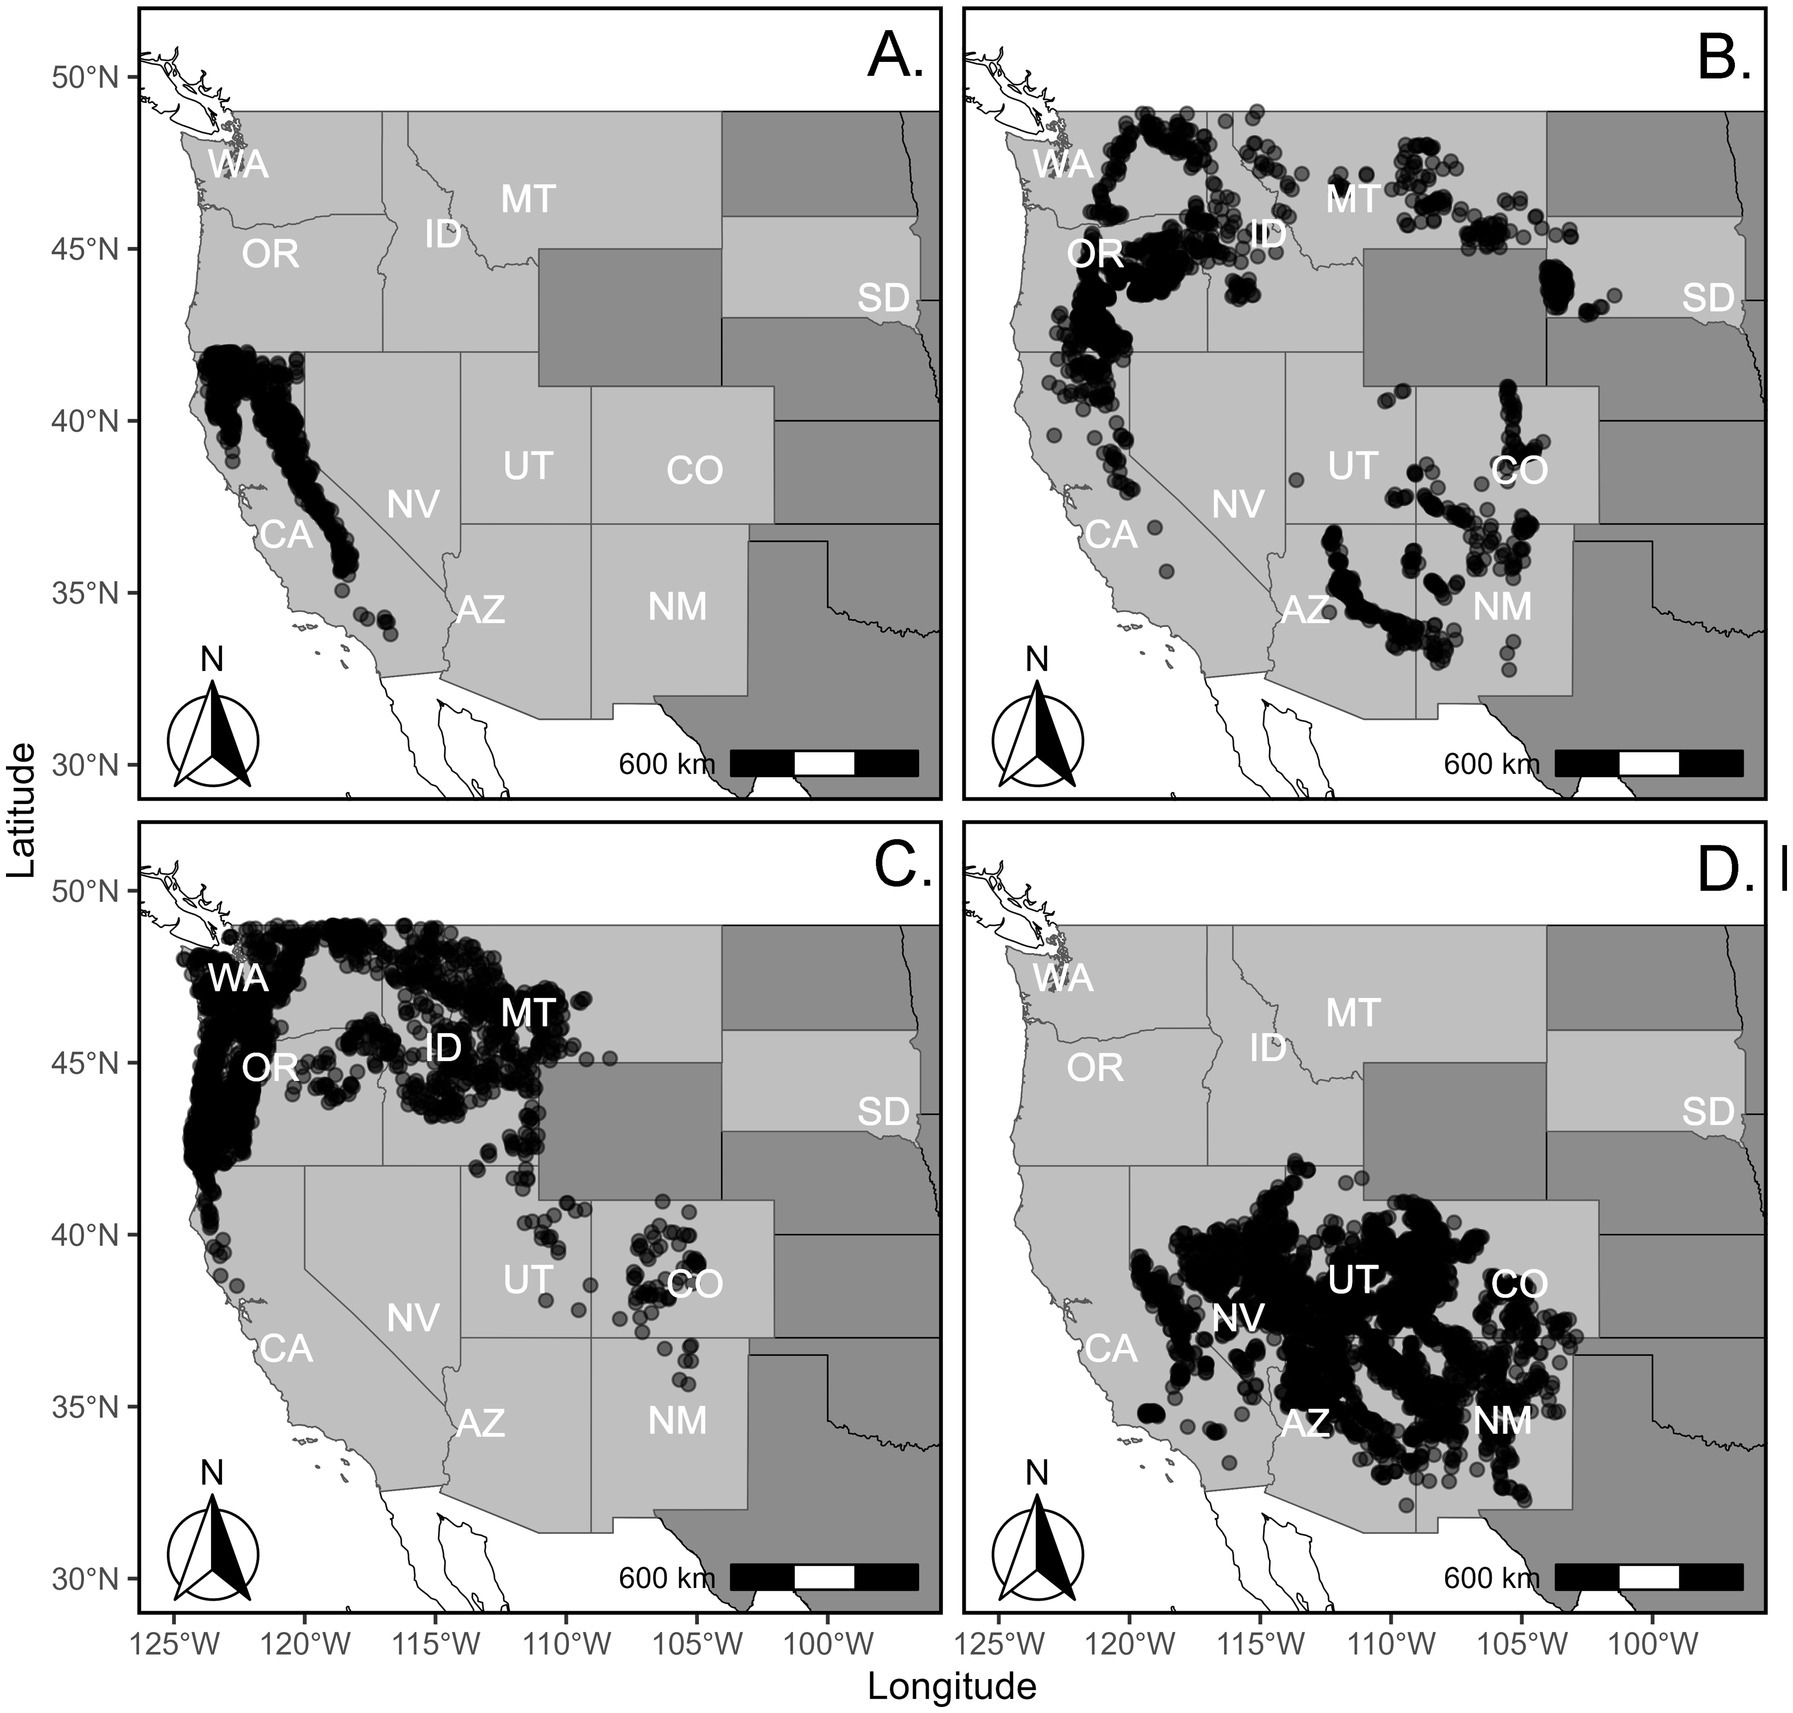
Figure 1. Map of forest inventory and analysis plot locations for four forest types across the contiguous western United States. (A) California mixed-conifer. (B) Ponderosa pine. (C) Douglas-fir. (D) Pinyon-juniper.
On each FIA plot, trees and saplings are assessed within 4 nested, circular subplots. Plots are not relocated based on abrupt boundaries in structure and composition, so plots may sample forest edge or multiple forest “conditions” (i.e., stands). Saplings >2.54 < 12.7 cm diameter at breast height (DBH) are monitored on 4 × 0.0013 ha microplots. Trees ≥12.7cm DBH are monitored on 4 × 0.016 ha subplots, except in the Pacific Northwest and California, where large trees >60.1 cm DBH (California, and eastern Oregon and Washington) or > 76.2 cm DBH (western Oregon and Washington) are monitored on 4 × 0.101 ha macroplots and trees 60.1 cm ≤ DBH ≥ 12.7cm on 4 × 0.016 ha subplots. Parameters including slope, aspect, stand age, treatment, and disturbance are assessed at the stand level. Trees and saplings are assessed for species, DBH, height, crown condition, growth, cull, damaging agents, growth, and ingrowth status.
We used the FIESTA package (Frescino et al., 2023) for R (R Core Team, 2022) to query tree, condition, plot, and the growth, removals, and mortality (GRM) component tables in February 2024. We omitted the state of Wyoming for lack of available change data due to the later implementation of the FIA annual inventory there (Goeking, 2015). We queried the most recent measurement for each condition (range = 2010–2022) such that these data are not temporally dependent. Rather than plots, we analyzed conditions, which we hereafter refer to as stands.
We focused on four common forest types from across the western United States: California mixed-conifer (FIA forest type 371), ponderosa pine (Pinus ponderosa; FIA forest type 221), Douglas-fir (Pseudotsuga menziesii, FIA Forest Type 201), and Pinyon-Juniper (Pinus-Juniperus spp.) woodland (FIA forest type 185). These forest types, which are of wide ecological and economic importance to the region, range from maritime (Douglas-fir) to semiarid (pinyon-juniper) and from shade-intolerant (ponderosa pine) to shade-intermediate (California mixed-conifer and Douglas-fir). All four forest types are comprised of species sensitive to N deposition (Horn et al., 2018; Fenn et al., 2020) and aridity, a predisposing factor in recent drought and insect-driven mortality events (Fettig et al., 2019; Flake and Weisberg, 2019; Bennett et al., 2023). Table 1 summarizes stand structure and site information for each forest type.
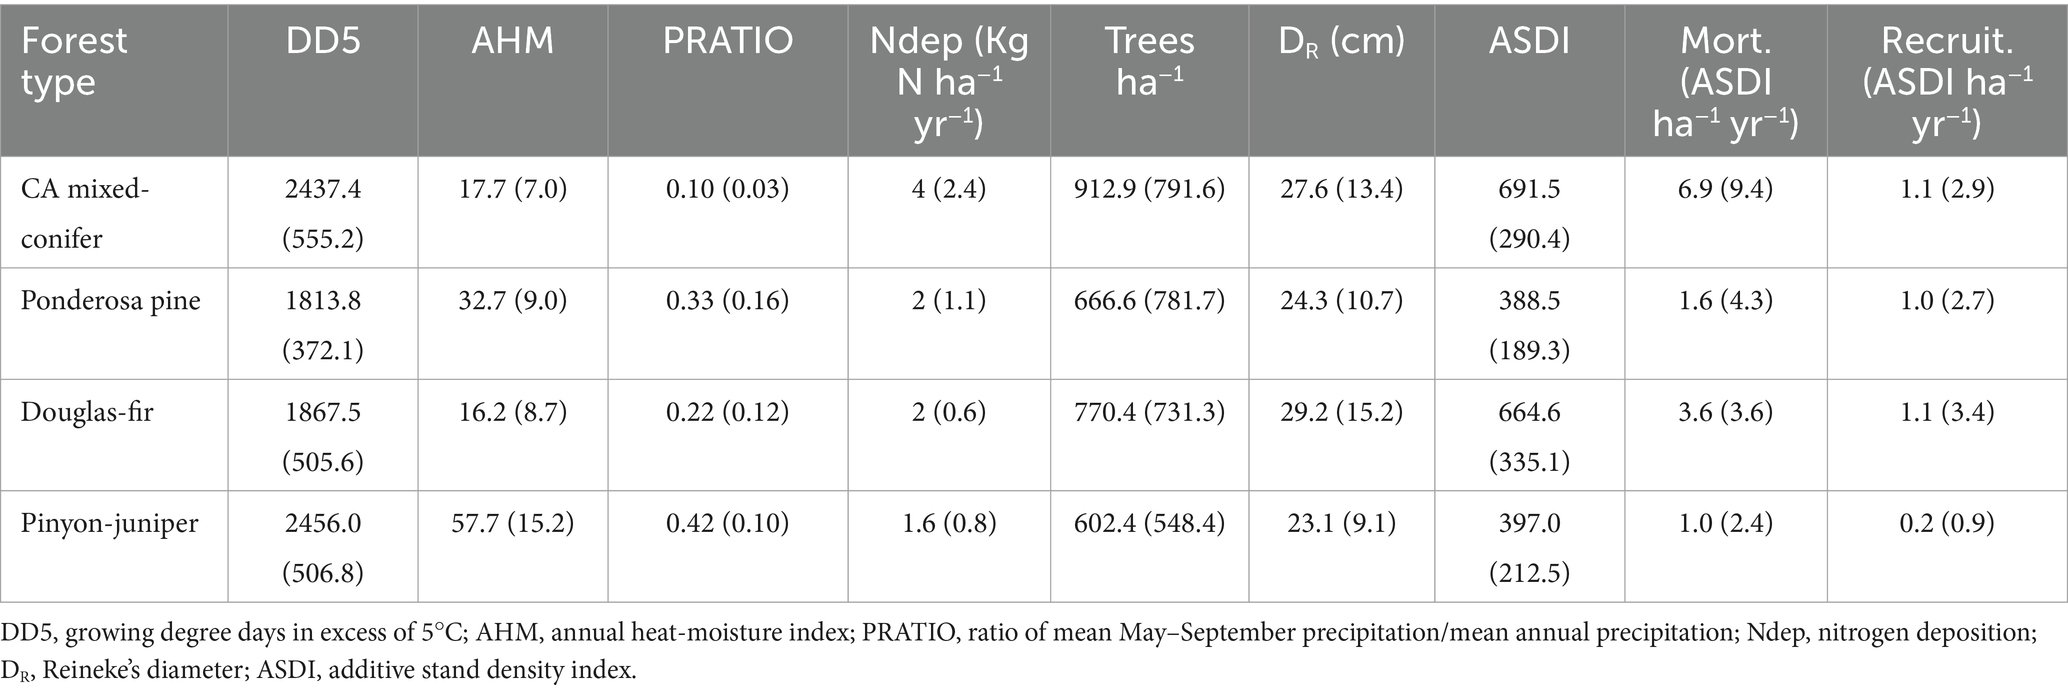
Table 1. Mean (± standard deviation) physical and stand structural conditions for selected FIA conditions of four forest types.
For purposes of this study, we calculated SDI using the additive method (ASDI) based on the contributions of individual trees (Shaw, 2000; Ducey and Larson, 2003). We dropped stands of forest types that were comprised of less than 80% relative ASDI of typical conifer species. We dropped stands with fewer than 60 trees ha−1, mean stand diameters (see definition below) < 5 cm, and stands covering less than 50 percent of plot area to avoid extreme estimates introduced by small sampled areas (Shaw and Long, 2007). We also dropped cases where the proportion of microplots overlap with the stand was less than 0.5, given the importance of microplots on trees ha−1 estimates. We dropped recently treated stands but did not drop naturally disturbed stands. We did not drop stands based on lack of evidence of self-thinning (e.g., Andrews et al., 2018), as this could have filtered out slow-growing older stands of interest to this study. We dropped three outlier stands of California mixed conifer with mean stand diameters (see definition below) < 6 cm or > 80cm. Selected stands numbered 832 for California mixed conifer, 1,843 for ponderosa pine, 2,735 for Douglas-fir, and 3,729 for pinyon-juniper. Please see Supplementary material S5 for data preparation workflow.
Based on conventional model forms (but see Zhang et al., 2013), we set TPH as our response variable for Q1 modeling of the MSDB. Please see Table 2 for a description of response and predictor variables organized by research question. To address Q2, we defined mortality as saplings and trees that were either previously sampled and died since the last since the last measurement, or crossed plot measurement size thresholds and died by the time of first measurement (Burrill et al., 2024). The inclusion of saplings in our mortality definition allowed us to examine recruitment and mortality across the entire range of stand diameter. We defined recruitment as live stems that were not detected on microplots in the previous inventory and crossed the sapling-size threshold by the latest plot measurement. Our focus on saplings let us discern on how near-term stand structure affected recent regeneration and growth. We calculated annualized per-area ASDI change estimates (ΔASDI) of mortality and recruitment for each stand, assuming forest change calculated with ASDI would be more closely aligned with the MSDB vs. absolute density metrics. While density management studies of even-aged monocultures have commonly used quadratic mean diameter (QMD) to represent mean tree size, QMD may overestimate mean tree size in irregular stands (Shaw, 2000; Ducey and Larson, 2003). Instead, we followed the example of previous studies of diverse forests in the eastern U.S. (Andrews et al., 2018; Yang and Brandeis, 2022) and calculated SDI using Zeide’s (1983) Reineke’s Diameter (DR):
Where N is the total number of trees per unit area, d is the diameter of tree i, and b is the absolute value of the ln-TPH vs. ln-DR slope coefficient of the maximum size-density relationship. We used Reineke’s traditional value of −1.605 for b to simplify interpretation across forest types with potentially curvilinear MSDBs. Calculating SDI with DR is equivalent to ASDI (Shaw, 2000; Ducey and Larson, 2003).
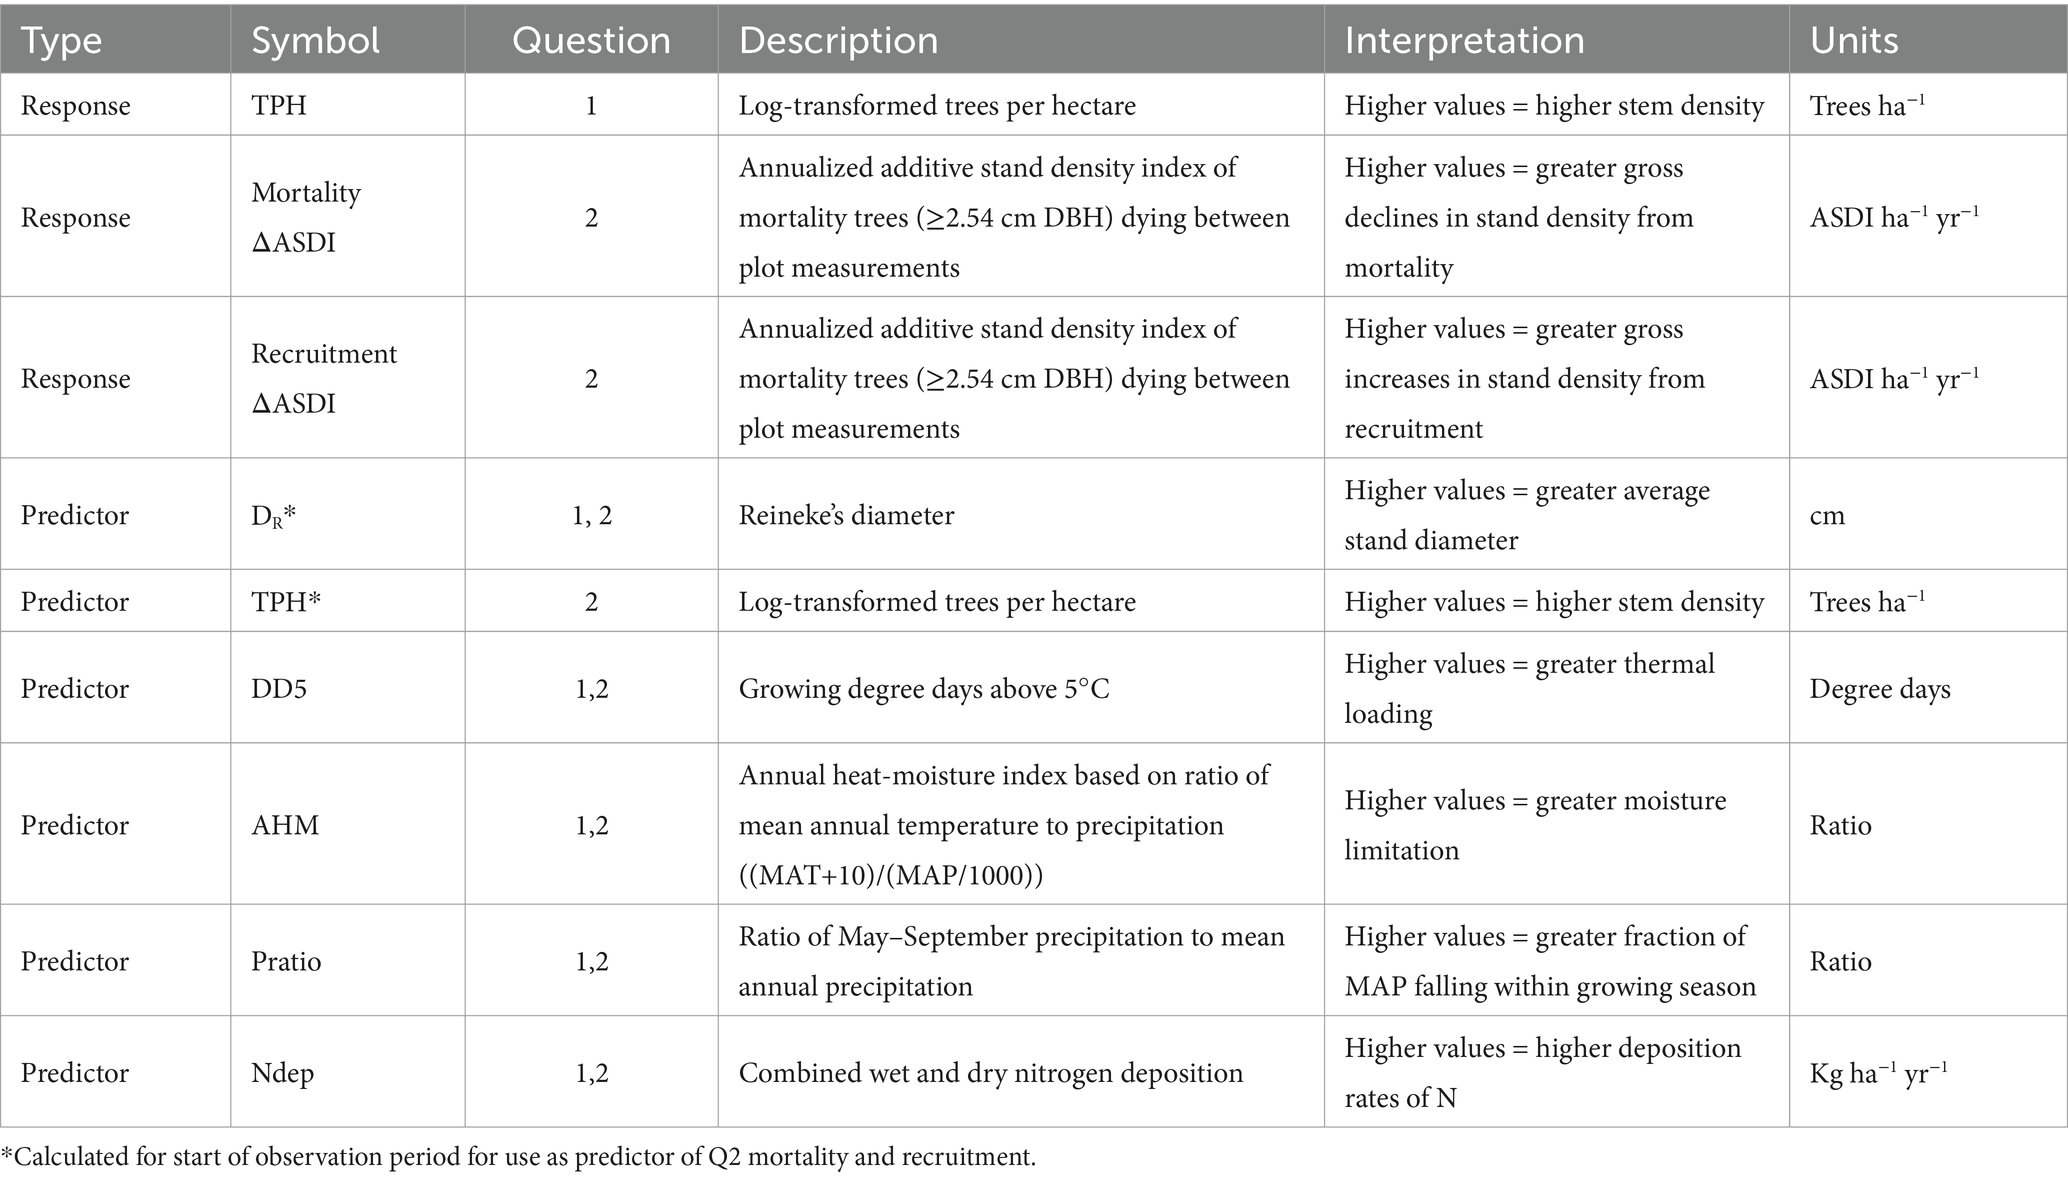
Table 2. Response and predictor variables used in Q1 and Q2 analyses.
To compile a set of climate variables (Table 2), we extracted historical climate norms (1991–2020) by plot coordinate and elevation using downscaled, 4km-resolution, gridded climate data (ClimateNA) (Wang et al., 2016). We used publicly available plot coordinates, which are fuzzed by ~800m with approximately 20% of private land coordinates “swapped” with nearby similar plots for confidentiality (Burrill et al., 2024). Although we did not have access to exact plot coordinates for comparison purposes, using publicly available coordinates has minimal effects in the Western U.S. where ownership is primarily public (Gibson et al., 2014).
Previous studies have identified thermal loading, aridity, and seasonality of precipitation as important predictors of maximum SDI (Ducey et al., 2017; Andrews et al., 2018; Kimsey et al., 2019). To represent these aspects of climate, we chose growing degree days in excess of 5°C (DD5), annual heat-moisture index (AHM; (MAT+10)/(MAP/1000)), and the ratio of May–September to mean annual precipitation (PRATIO). We selected these variables based on a principal components analysis of climate norms which identified three climatic gradients (Supplementary material S1). Each selected variable was strongly associated with one gradient, reflected important predictors of maximum SDI in the literature (Andrews et al., 2018; Kimsey et al., 2019; Kweon and Comeau, 2021), and did not have strong correlations with the other selected climate variables (r < 0.6).
We also compiled a set of variables to quantify N deposition. We used historical (2000–2020) maps of estimated total (wet and dry) N deposition for the United States (Schwede and Lear, 2014). The mapped 4 km-resolution, gridded data estimate wet deposition based on analyses of rainfall chemistry and estimated MAP, while dry deposition estimates are based on air quality monitoring stations (Schwede and Lear, 2014). We extracted mean annual N deposition for each FIA plot location using bilinear interpolation in the raster package (Hijmans et al., 2020) for R (R Core Team, 2022).
To address Q1, our first analysis modeled the MSDB to determine whether the boundary was linear or curvilinear, as potentially modified by climate and N deposition covariates. Three contemporary quantitative techniques, quantile regression (QR) (Koenker and Bassett, 1978), stochastic frontier analysis (SFA) (Aigner et al., 1977), and linear quantile mixed modeling (LQMM) (Koenker, 2004) are commonly used to quantitatively determine the MSDB (Chivhenge et al., 2024). We selected QR as best suited to our goals of comparing MSDB across forest types and identifying key stand size-density thresholds. SFA created a potential barrier to interpreting patterns among forest types given that the effects of site covariates are quantile-dependent (Tian et al., 2021), while LQMM’s use of a random plot effect to account for variation in site and stand history (Chivhenge et al., 2024) risked masking important stand development signals (See Supplementary material S2 for parallel SFA and LQMM analyses). We modeled the 0.95 quantile of TPH as QR results become increasingly quantile and outlier-dependent at quantiles greater than this value (Tian et al., 2021).
We built a series of competing QR hypothesis models (Table 3). The null hypothesis for each forest type was that TPH varied with a linear DR effect. Our overall hypothesis testing approach was to identify the primary aspect of climate (thermal loading, aridity, or seasonality) that influenced the MSDB while simultaneously evaluating the effect of Ndep. Hypothesis models 1–4 sequentially tested the main effects of DD5, AHM, PRATIO, or Ndep, respectively. Hypothesis models 5–8 sequentially tested the main effects of DD5, AHM, PRATIO, or Ndep, along with each covariate’s interaction with DR. Hypotheses 9–11 simultaneously tested the main effects of DD5 and Ndep, AHM and Ndep, or PRATIO and NDEP. Hypotheses 12–17 tested the main effect of each climate parameter and NDEP, as well as either the interaction of the climate term (H12–14) or Ndep (H15–17) with DR. Hypothesis models included both linear- DR and polynomial quadratic- DR variants to test for the presence of curvilinear MSDBs.
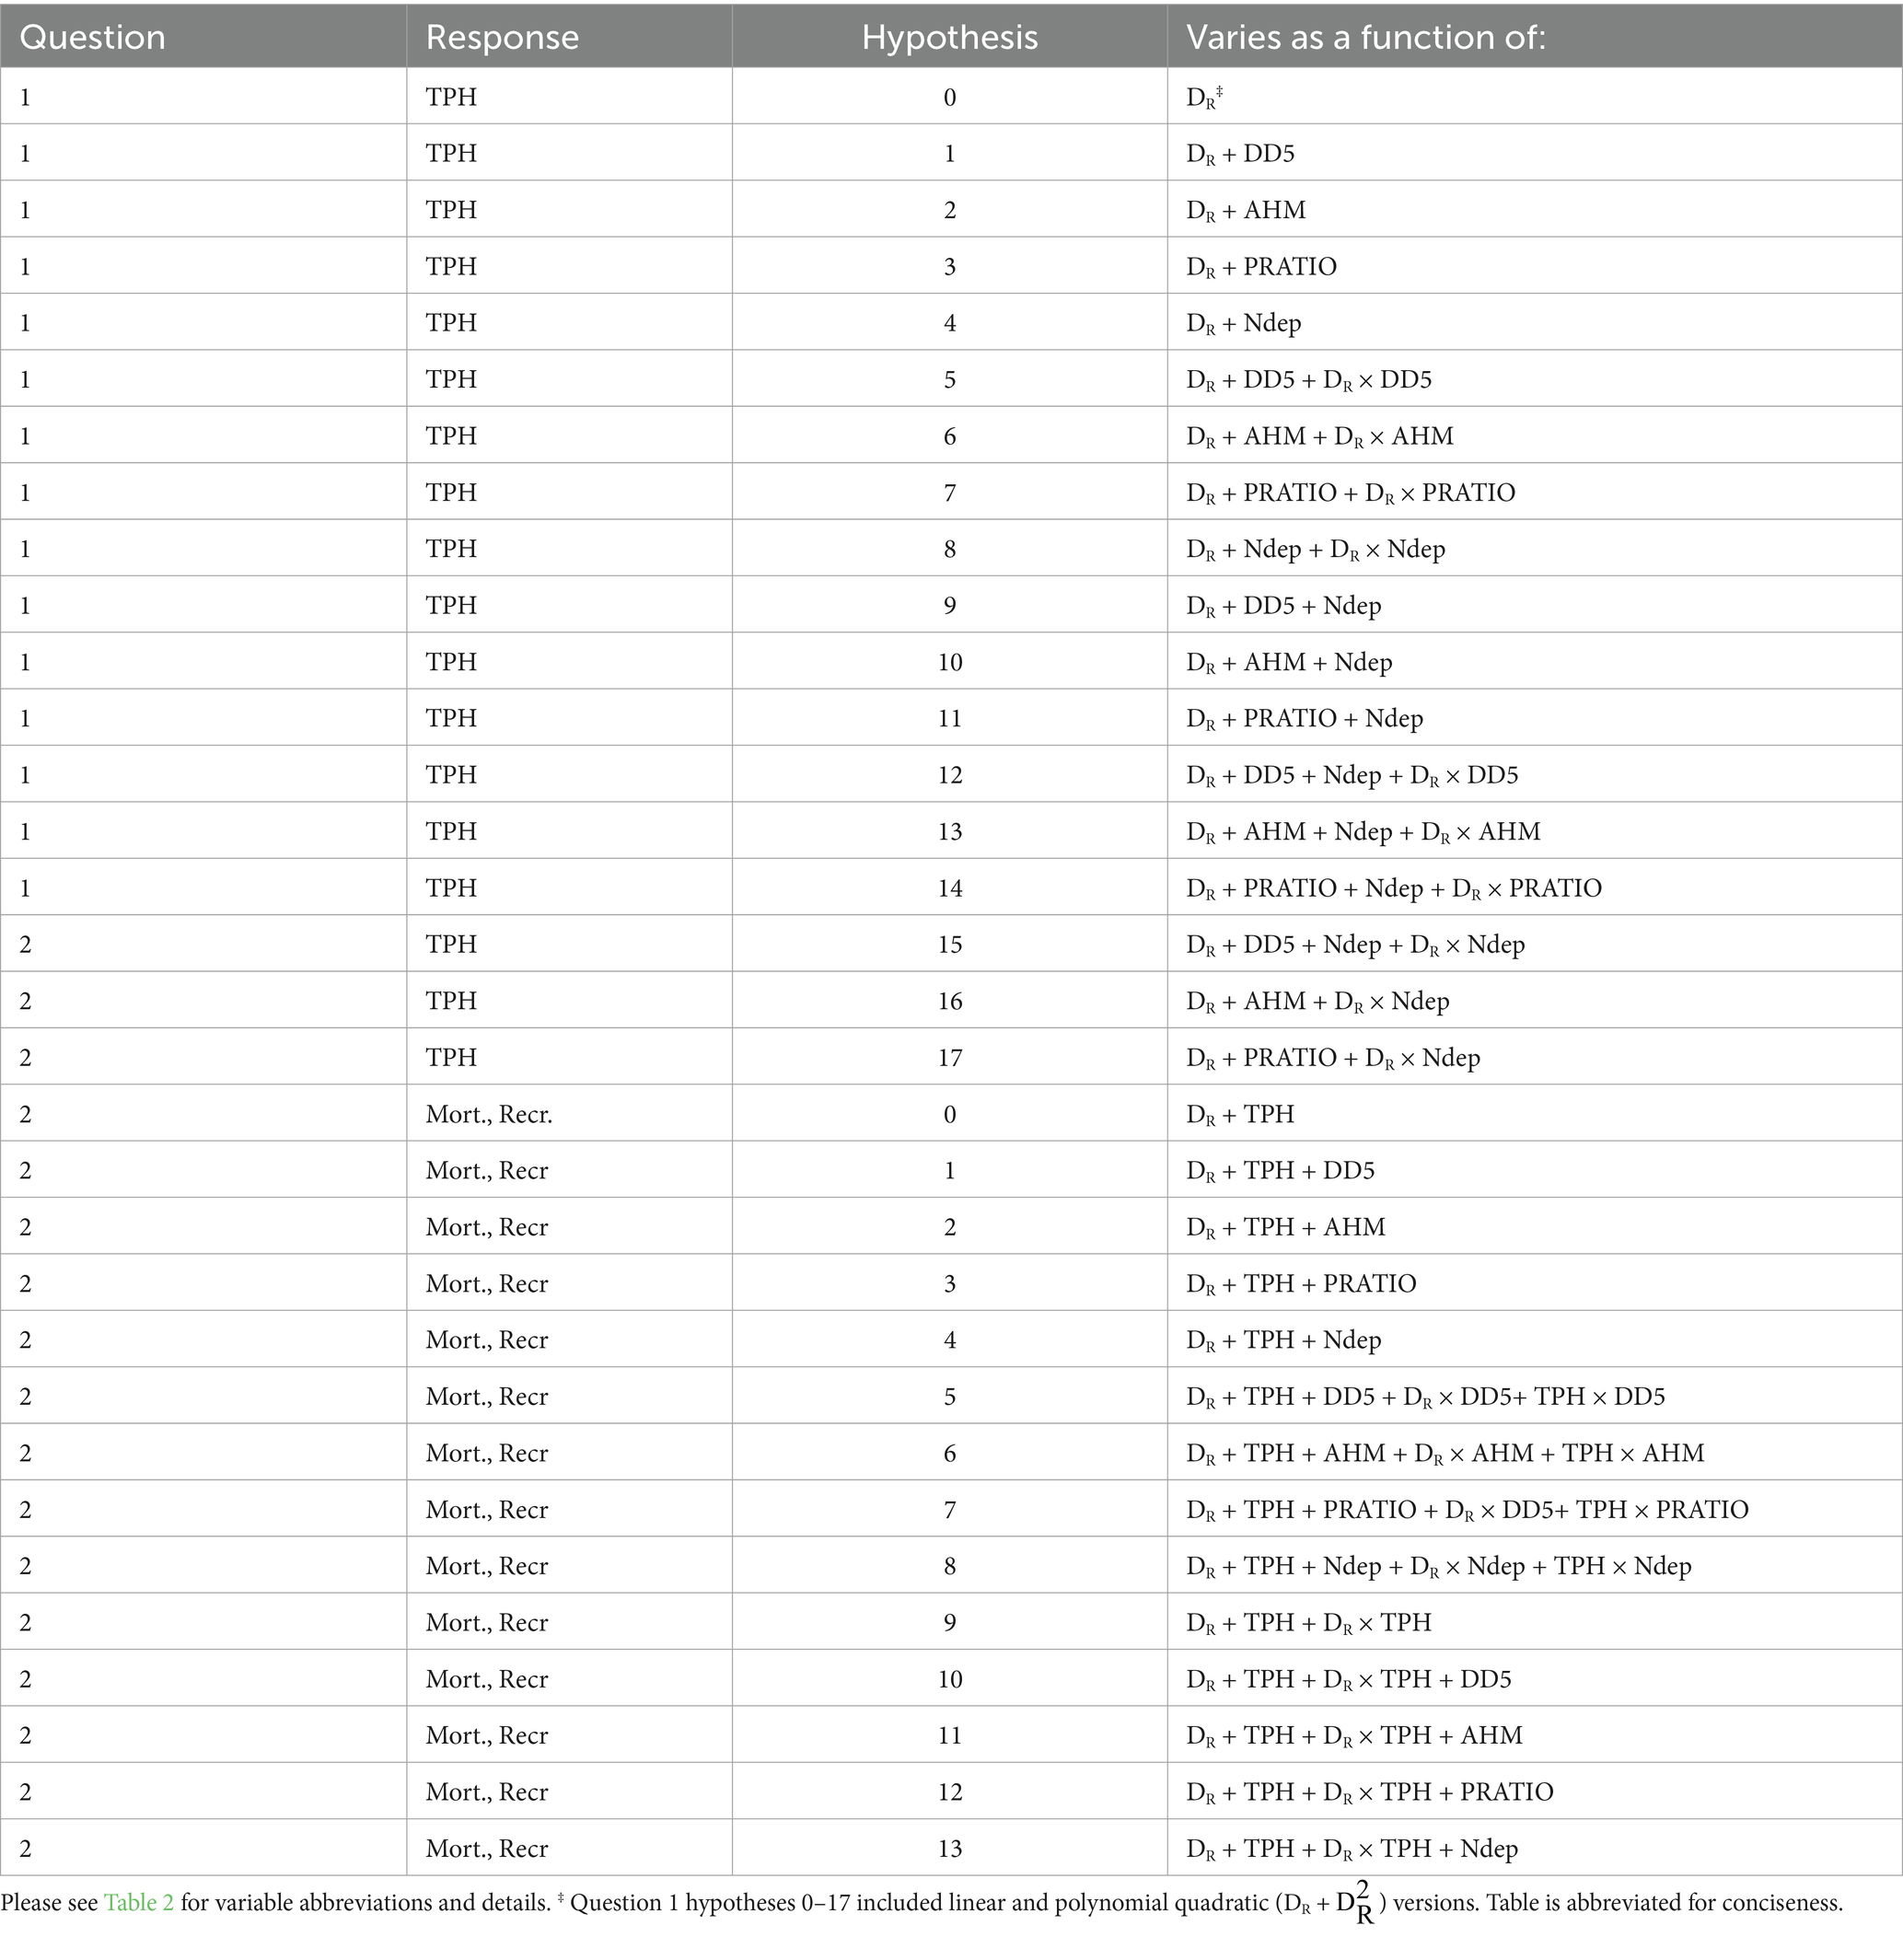
Table 3. Hypothesis models by research question and response variable.
To address Q2, we used generalized linear modeling to examine how mortality or recruitment ΔSDI varied across DR and TPH space, with or without the presence of abiotic stressors. The purpose of this analysis was to quantify and visualize recruitment and mortality trends to evaluate whether these were plausible drivers of curvilinear MSDBs in mature and old-growth stands large-diameter stands. We calculated initial (previous plot measurement) DR and TPH to use as predictors. Our null hypothesis was that mortality or recruitment varied with the main effects of DR and TPH (Table 3). Hypotheses 1–4 sequentially evaluated the added main effects of DD5, AHM, PRATIO, and NDEP. Hypothesis model 5–8 sequentially evaluated the main effects and interactions of site covariates with DR and TPH, allowing mortality or recruitment to vary with site covaries depending on position in size-density space. Hypothesis model 9 assumed that mortality or recruitment varied with the main effects and interactions of TPH and DR. Hypotheses 10–13 sequentially evaluated the main effects of DD5, AHM, PRATIO, and NDEP in the presence of the main effects and interaction between TPH and DR.
Hypothesis model sets for each species were evaluated using the information theoretic approach (Burnham and Anderson, 2002) to determine the relative evidence for each hypothesis. We used Akaike’s (1974) corrected information criterion (Sugiura, 1978). We considered models within 6 units of the best-supported model to be plausible and warrant inclusion in inference (Richards, 2008). We dropped models where the addition of each extra parameter did not reduce AIC by ≥2 or increased the log-likelihood relative to simpler, nested alternatives in order to avoid retaining uninformative lurking variables (Burnham and Anderson, 2002; Richards, 2008).
We used the quantreg package (Koenker et al., 2018) for all QR modeling. We centered and scaled independent variables to make effect sizes comparable, reduce collinearity, and facilitate convergence. We visualized QR models by plotting predicted values over size-density scatterplots. In the event of support for the presence of an interaction, we plotted predicted values at the 10th and 90th percentiles of the covariate involved. We acknowledge these percentiles border on extremes but found them necessary for clear presentation purposes. We used the glmmTMB package (Magnusson et al., 2018) in R for modeling recruitment and mortality. We modeled these data with a Tweedie error distribution to accommodate right-skewedness and abundant zero values (Foster and Bravington, 2013). We constructed two-dimensional heatmaps displaying predicted values of mortality or recruitment in log-transformed TPH- DR space, adjusting for site covariates where appropriate. We calculated pseudo-R2 (Nakagawa and Schielzeth, 2013) for GLMs for descriptive purposes but relied on AICc for inference.
Quantile regression is robust against non-normally distributed residuals and heteroscedasticity (Hao and Naiman, 2007) but noted that QR residuals were left-skewed. We also noted that linearity occasionally improved when regressing residuals against quadratic TPH vs. linear TPH terms, but relied on model selection for selecting QR model forms. We evaluated Tweedie mortality and recruitment model assumptions of normally distributed residuals, homoscedasticity, and linearity (Zuur et al., 2009) using simulated residuals plots (Hartig, 2018). Based on these diagnostics, we log-transformed Ndep in addition to TPH and DR to address non-linearity in mortality and recruitment models (Zuur et al., 2009). We assessed collinearity for all model types by calculating variance inflation factors (VIF) for model parameters using the performance package (Lüdecke et al., 2021). We considered VIF ≥ 5 to signal serious collinearity problems (James et al., 2013). No models exceeded this threshold.
We found a single plausible model for ponderosa pine and pinyon-juniper (ΔAICc ≤6 vs. best-approximating model, with added parameters reducing AICc≥2 vs. simpler nested alternatives), and two plausible models each for California mixed-conifer and Douglas-fir. The plausible models for all forest types included polynomial quadratic TPH-DR relationships (Table 4). Please see Supplementary material S3 for a full list of QR model comparisons.
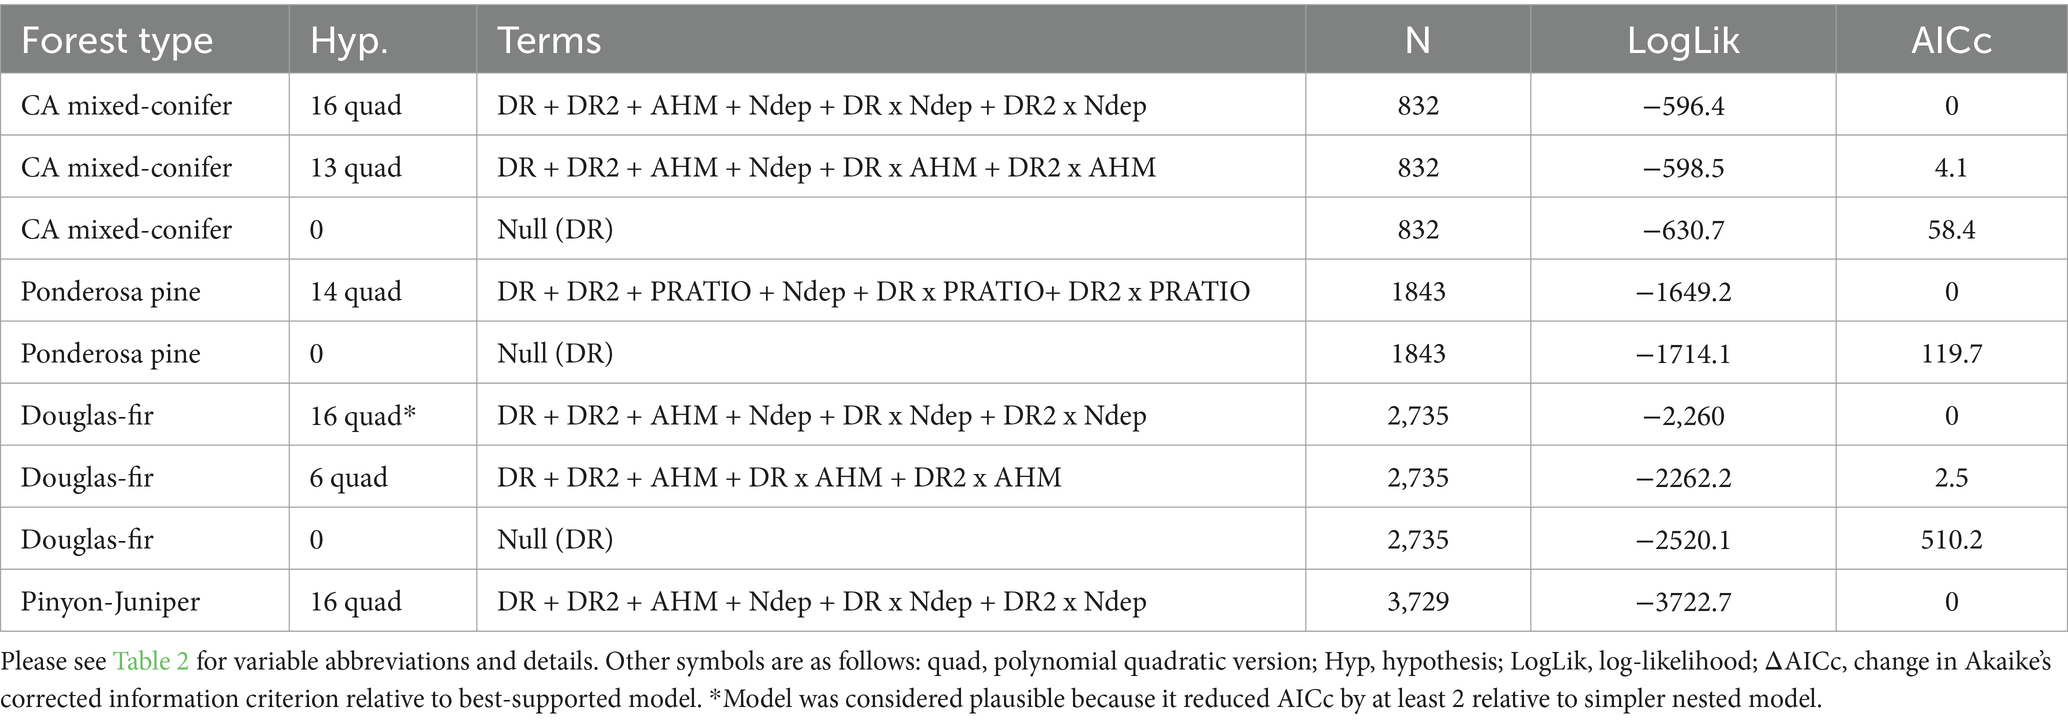
Table 4. Summary of plausible and null hypothesis quantile regression models of TPH for four forest types.
We found evidence that climate factors modified MSDBs, either as a main effect or in more complex interactions altering curvature. AHM influenced the MSDB in plausible models for California mixed-conifer, Douglas-fir, and pinyon-juniper (Hyp. H16 quadratic). In the best-supported model for California mixed conifer, predicted maximum ASDI declined 14.4% when the main effect of AHM increased from the 10th to 90th percentile value, holding Ndep and DR constant at their means (Figure 2A). In the second plausible model for California mixed-conifer (Hyp. H13 quadratic, ΔAICc = 4.1), AHM interacted with DR, such that predicted maximum ASDI was similar for low and high-AHM conditions for stands less than about 20cm DBH, above which high-AHM stands supported lower maximum ASDI (Figure 2B). At the 10th percentile of DR, moving from the 10th to 90th percentile of AHM reduced maximum ASDI by 2%. At the 90th percentile of DR, moving from the 10th to 90th percentile of AHM reduced maximum ASDI by 29%. In the best-supported model for Douglas-fir, AHM had a simple main effect in which moving from the 10th to 90th percentile reduced predicted ASDI by 33% (Figure 2D). In the second plausible model for Douglas-fir (Hyp. H6 quadratic, ΔAICc = 2.5), which omitted the Ndep main effect and interaction and so was less complex than the first, the MSDB was roughly linear under high AHM and became curvilinear under low AHM, with predicted ASDI increasing steeply below DR = 10cm (Figure 2E). The relative differences in ASDI between low and high-AHM plots was otherwise stable between the 10th and 90th percentile of DR. At the 10th percentile of DR., predicted maximum ASDI declined by 31% when AHM increased from the 10th to 90th percentile. At the 90th percentile of DR., predicted maximum ASDI declined by 33% when AHM increased from the 10th to 90th percentile. For pinyon-juniper, predicted maximum ASDI declined 26% when the main effect of AHM increased from the 10th to the 90th percentile (Figure 2F).
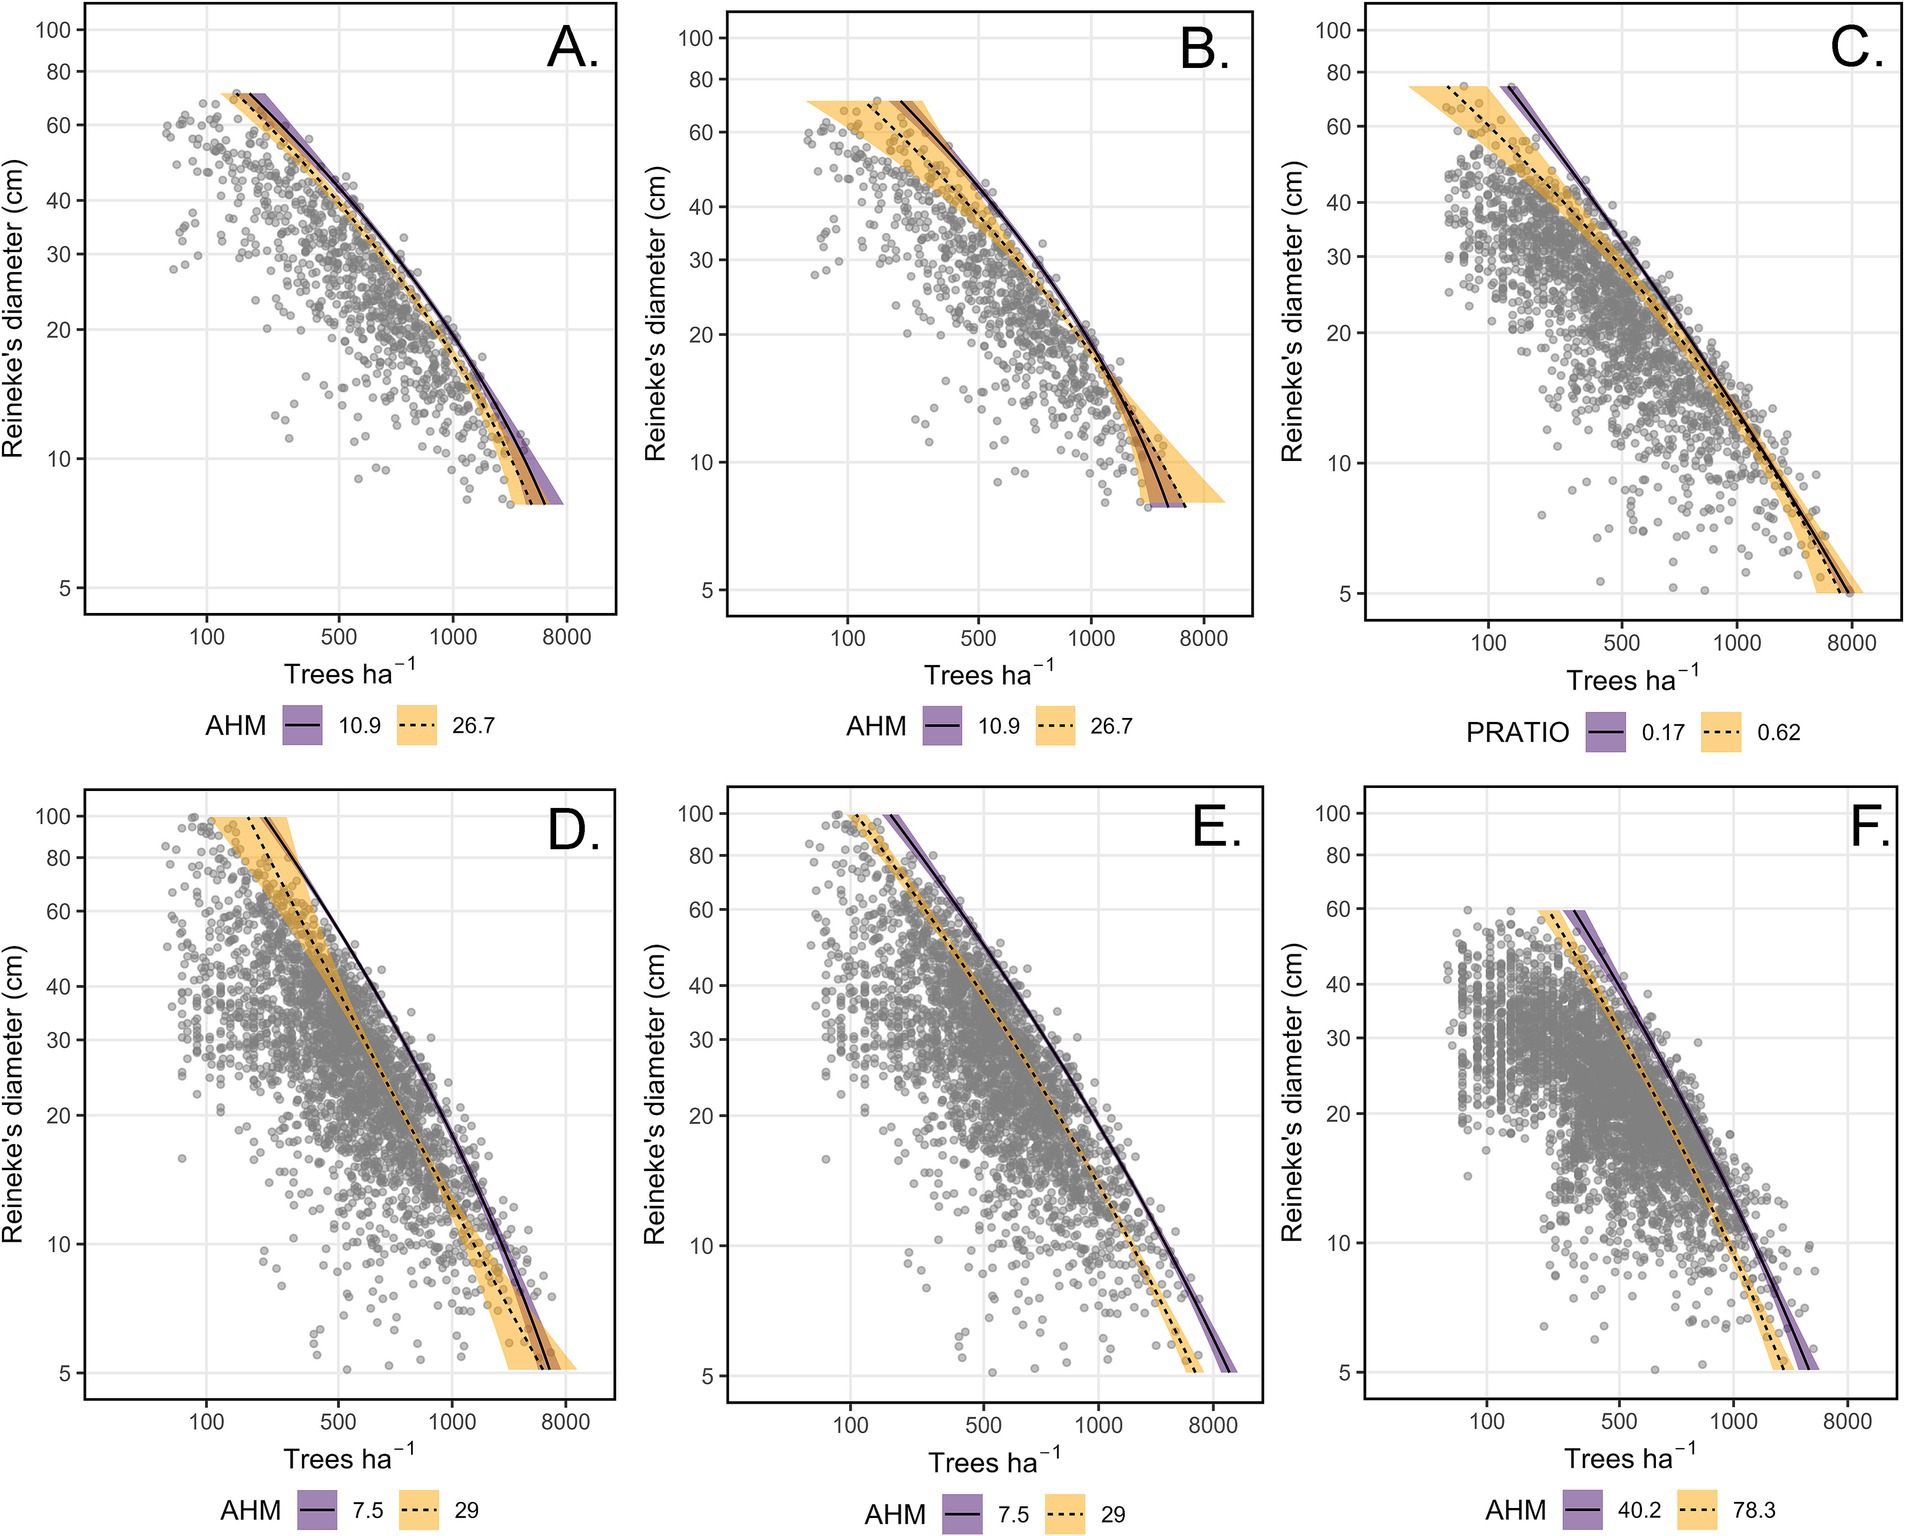
Figure 2. Plots of the tree density (trees ha−1)-size (Reineke’s diameter, cm)-relationship under the influence of climate, based on plausible models for four forest types. (A) California mixed-conifer annual heat-moisture index (AHM) main effect. (B) California mixed-conifer AHM interaction (alt. model). (C) Ponderosa pine proportion of May–September to total mean annual precipitation (PRATIO) interaction. (D) Douglas-fir AHM interaction. (E) Douglas-fir AHM main effect (alt. model). (F) Pinyon-juniper AHM main effect. Note that trees ha−1 was analyzed as the response variable and axes are flipped for convention. Inventory plots are depicted as gray dots. Lines and error ribbons (95% confidence interval) represent the predicted maximum size-density boundaries of plausible models for each forest type. Predictions are provided for the 10th (solid line and purple fill) and 90th (dashed line and orange fill) quantile of the climate covariate involved.
In ponderosa pine, PRATIO interacted with DR to influence the curvilinearity of the MSDB (Hyp. H14 quadratic). Under this interaction, PRATIO increased the curvilinearity of the MSDB in ponderosa pine, reducing maximum ASDI in stands with moderate-to-high mean stand diameters (Figure 2C). Moving from the 10th to 90th percentile of PRATIO, the predicted maximum ASDI increased by only 3% at the 10th percentile value of DR. Moving from the 10th and 90th percentiles of PRATIO, predicted maximum ASDI declined by 30% at the 90th percentile of DR.
N deposition altered the MSDB in the best-supported models for all four forest types. In the best-supported model for California mixed-conifer, Douglas-fir, and pinyon pine, higher Ndep increased the curvilinearity of the maximum-size-density line (Hyp. H16 quadratic). California mixed-conifer maximum ASDI was similar among small-diameter (DR < 10 cm) and marginally lower for large-diameter mixed-conifer stands (DR > 25cm, Figure 3A). Setting DR. to the 10th percentile, predicted-maximum ASDI increased by 5% when Ndep increased from the 10th to 90th percentile. At the 90th percentile of DR, moving from the 10th to 90th percentile of Ndep reduced predicted California mixed-conifer maximum ASDI by 9%. For Douglas-fir, Ndep lowered maximum ASDI below approximately DR = 15cm while not substantially altering the MSDB in larger DR stands (Figure 3C). At the 10th percentile value of DR, shifting from the 10th to 90th percentile value of Ndep reduced predicted maximum Douglas-fir ASDI by 9.5%. At the 90th percentile value of DR, shifting from the 10th to 90th percentile value of Ndep increased predicted ASDI by 3%. In pinyon-juniper, stands growing under low N deposition exhibited a nearly linear MSDB (Figure 3D). The effect of Ndep on predicted maximum ASDI was minor for small-diameter stands. At the 10th percentile of DR, moving from the 10th to 90th percentile of Ndep lead to a 3.4% increase predicted maximum ASDI. As DR increased above approximately 25 cm, pinyon-juniper exhibited increasingly lower maximum predicted ASDI relative to low Ndep stands. At the 90th percentile of DR, a shift from the 10th to 90th percentile of Ndep translated to an 11% decline in predicted maximum ASDI. However, these distinctions were equivocal as there was limited separation and higher variability in MSDBs at both extremes of DR. For ponderosa pine, Ndep acted as a simple main effect where, when holding DR and AHM constant at their means, moving from the 10th to 90th percentile value of Ndep increased predicted maximum ASDI by 26% (Hyp. H14 quadratic, Figure 3B).
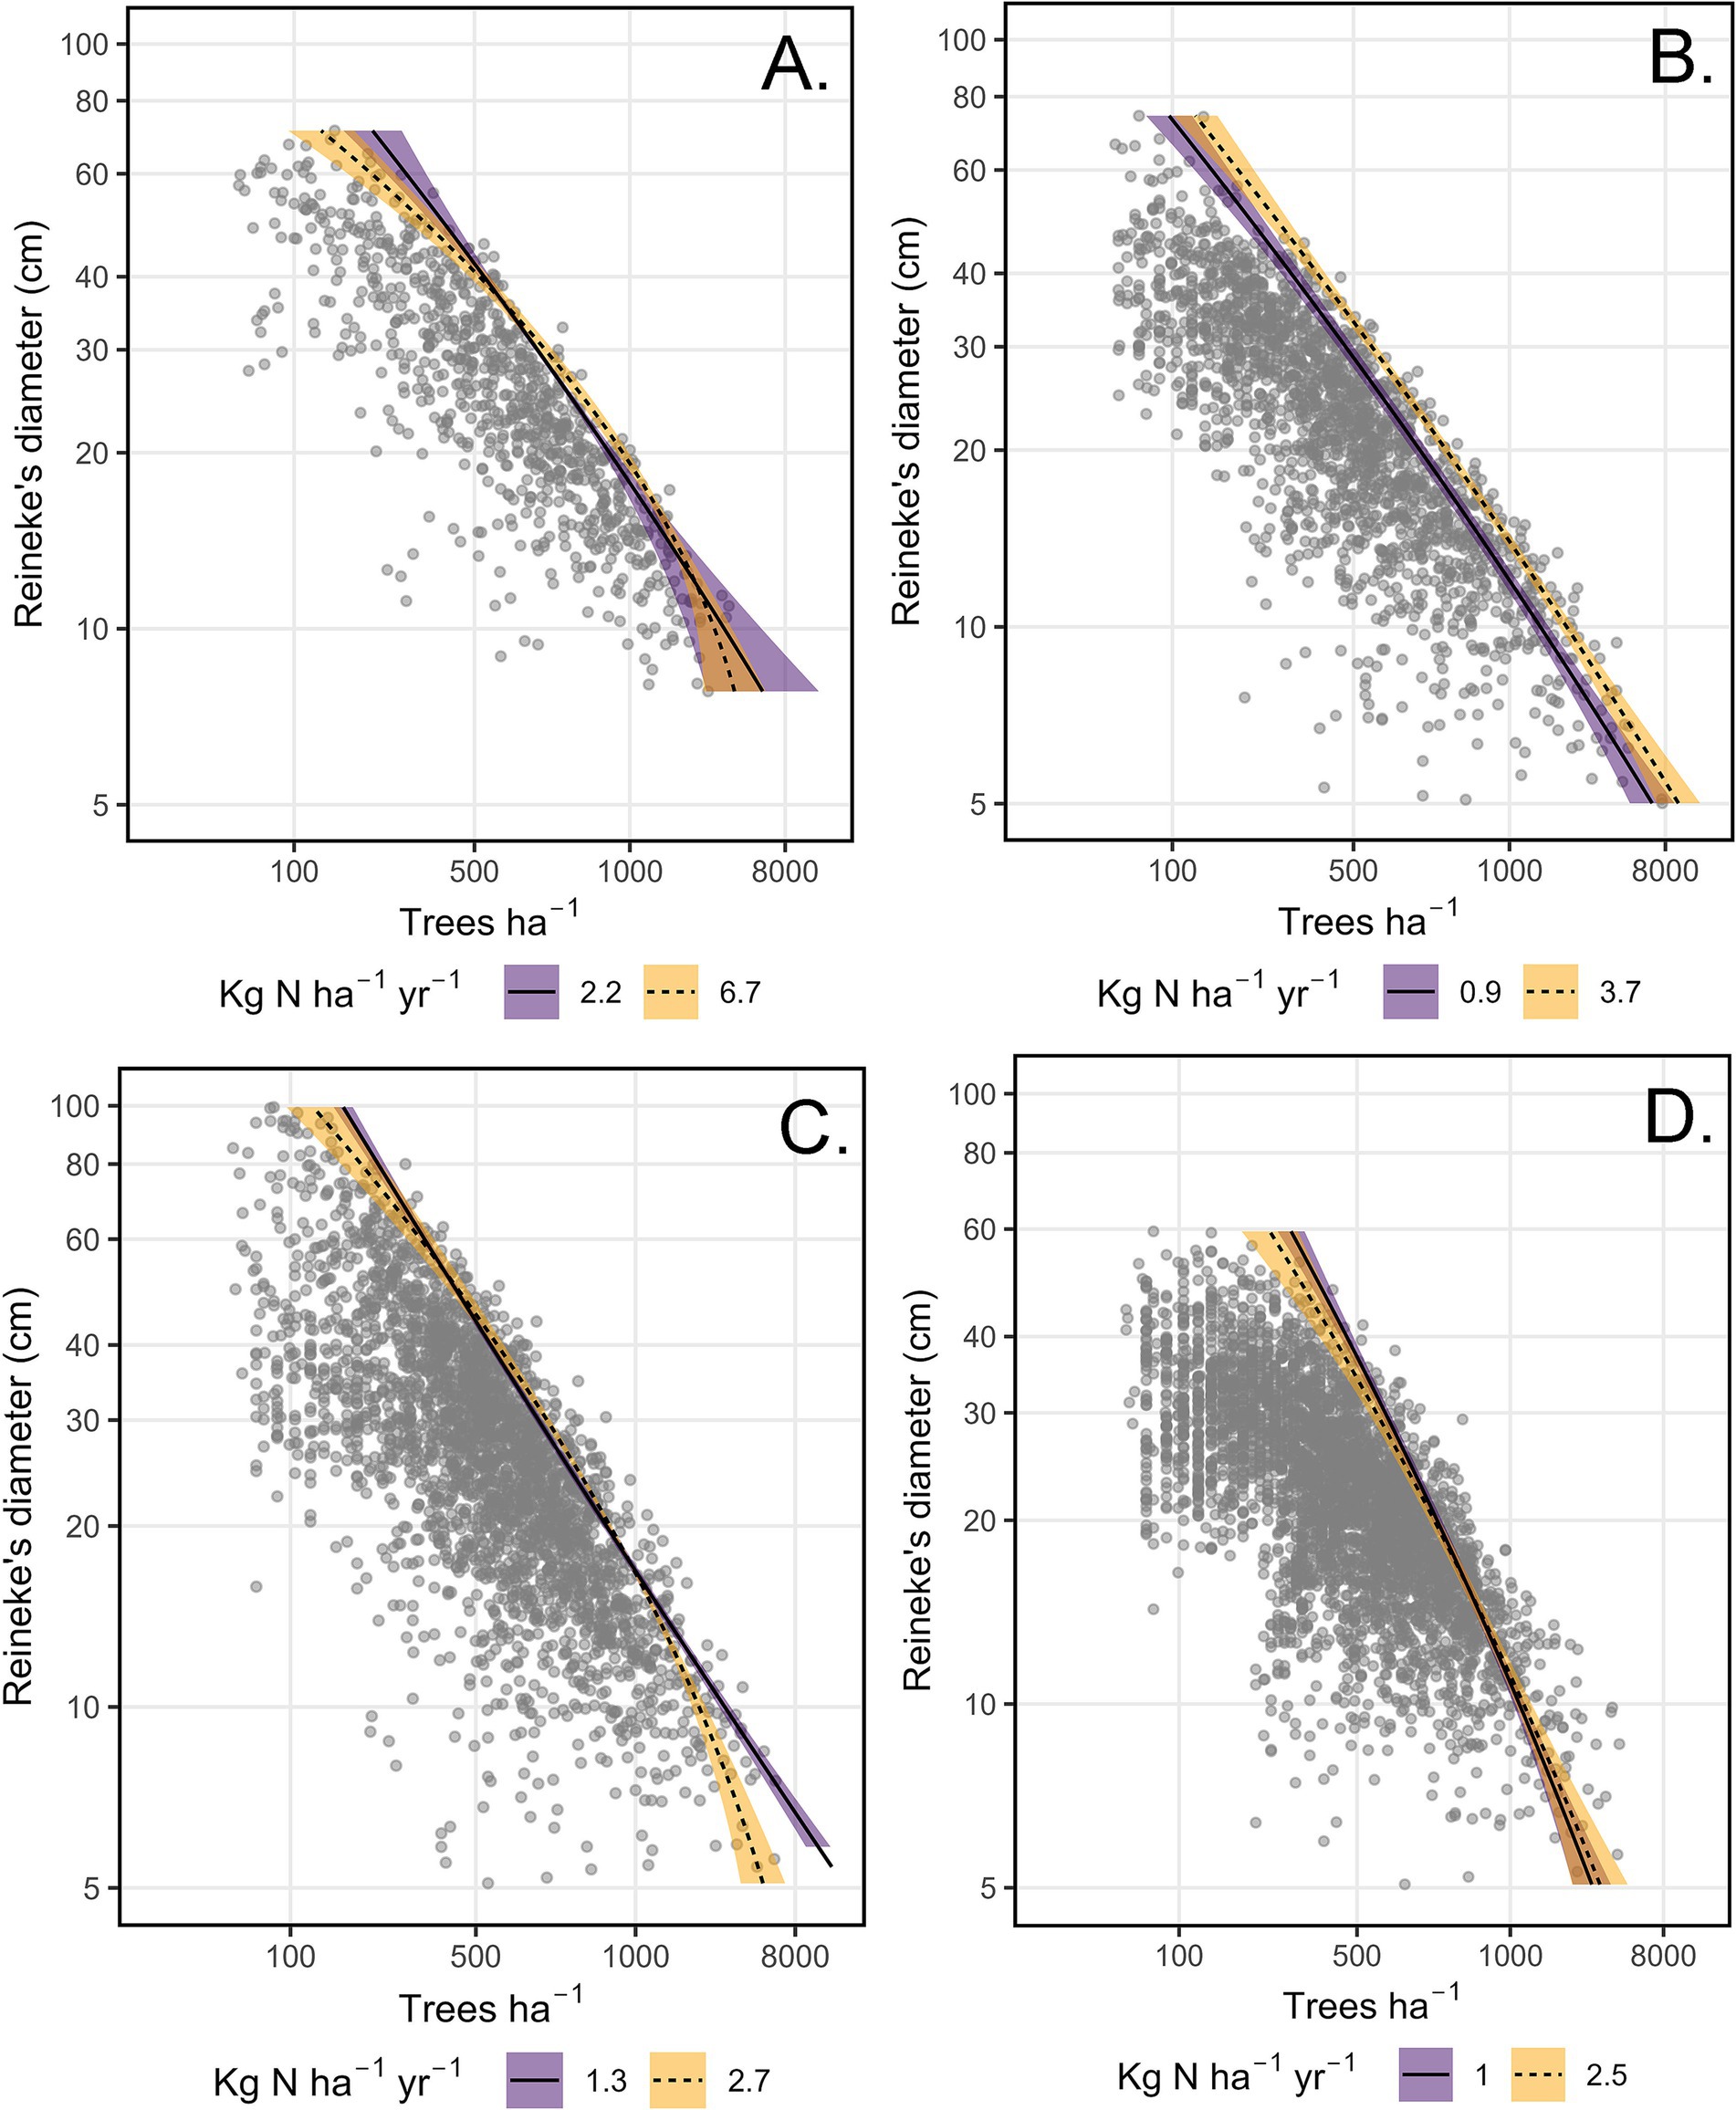
Figure 3. Plots of the tree density (trees ha−1)-size (Reineke’s diameter, cm)-relationship under the influence of N deposition (Ndep), based on plausible models for four forest types. Note that for Douglas-fir, the best-supported model did not include Ndep effects. (A) California mixed-conifer. (B) Ponderosa pine. (C) Douglas-fir. (D) Pinyon-juniper. Note that trees ha−1 was analyzed as the response variable and axes are flipped for reasons of convention. Inventory plots are depicted as gray dots. Lines and error ribbons (95% confidence interval) represent the predicted maximum size-density boundaries of plausible models for each forest type. Predictions are provided for the 10th (solid line and purple fill) and 90th (dashed line and orange fill) quantile of N deposition.
The best-supported model for California mixed-conifer mortality ΔASDI included the main effects of TPH, DR, Ndep, and interactions of Ndep with TPH and DR (Hyp. H8, Table 5). Mortality increased more strongly with DR than TPH so that, while generally elevated along the MSDB, mortality was concentrated at higher values of DR (Figure 4A). Ndep interacted with structure. Holding DR constant at its mean, moving from the 10th to 90th percentile of Ndep increased mortality ΔASDI by 43% at the 10th percentile of TPH while reducing mortality 5% at the 90th percentile of TPH. Moving from the 10th to 90th percentile of Ndep increased mortality ΔASDI by 212% at the 10th percentile of DR while relative mortality declined by 25% at the 90th percentile of DR. No other model was plausible for this forest type. Please see Supplementary material S4 for a full list of mortality and recruitment model comparisons.
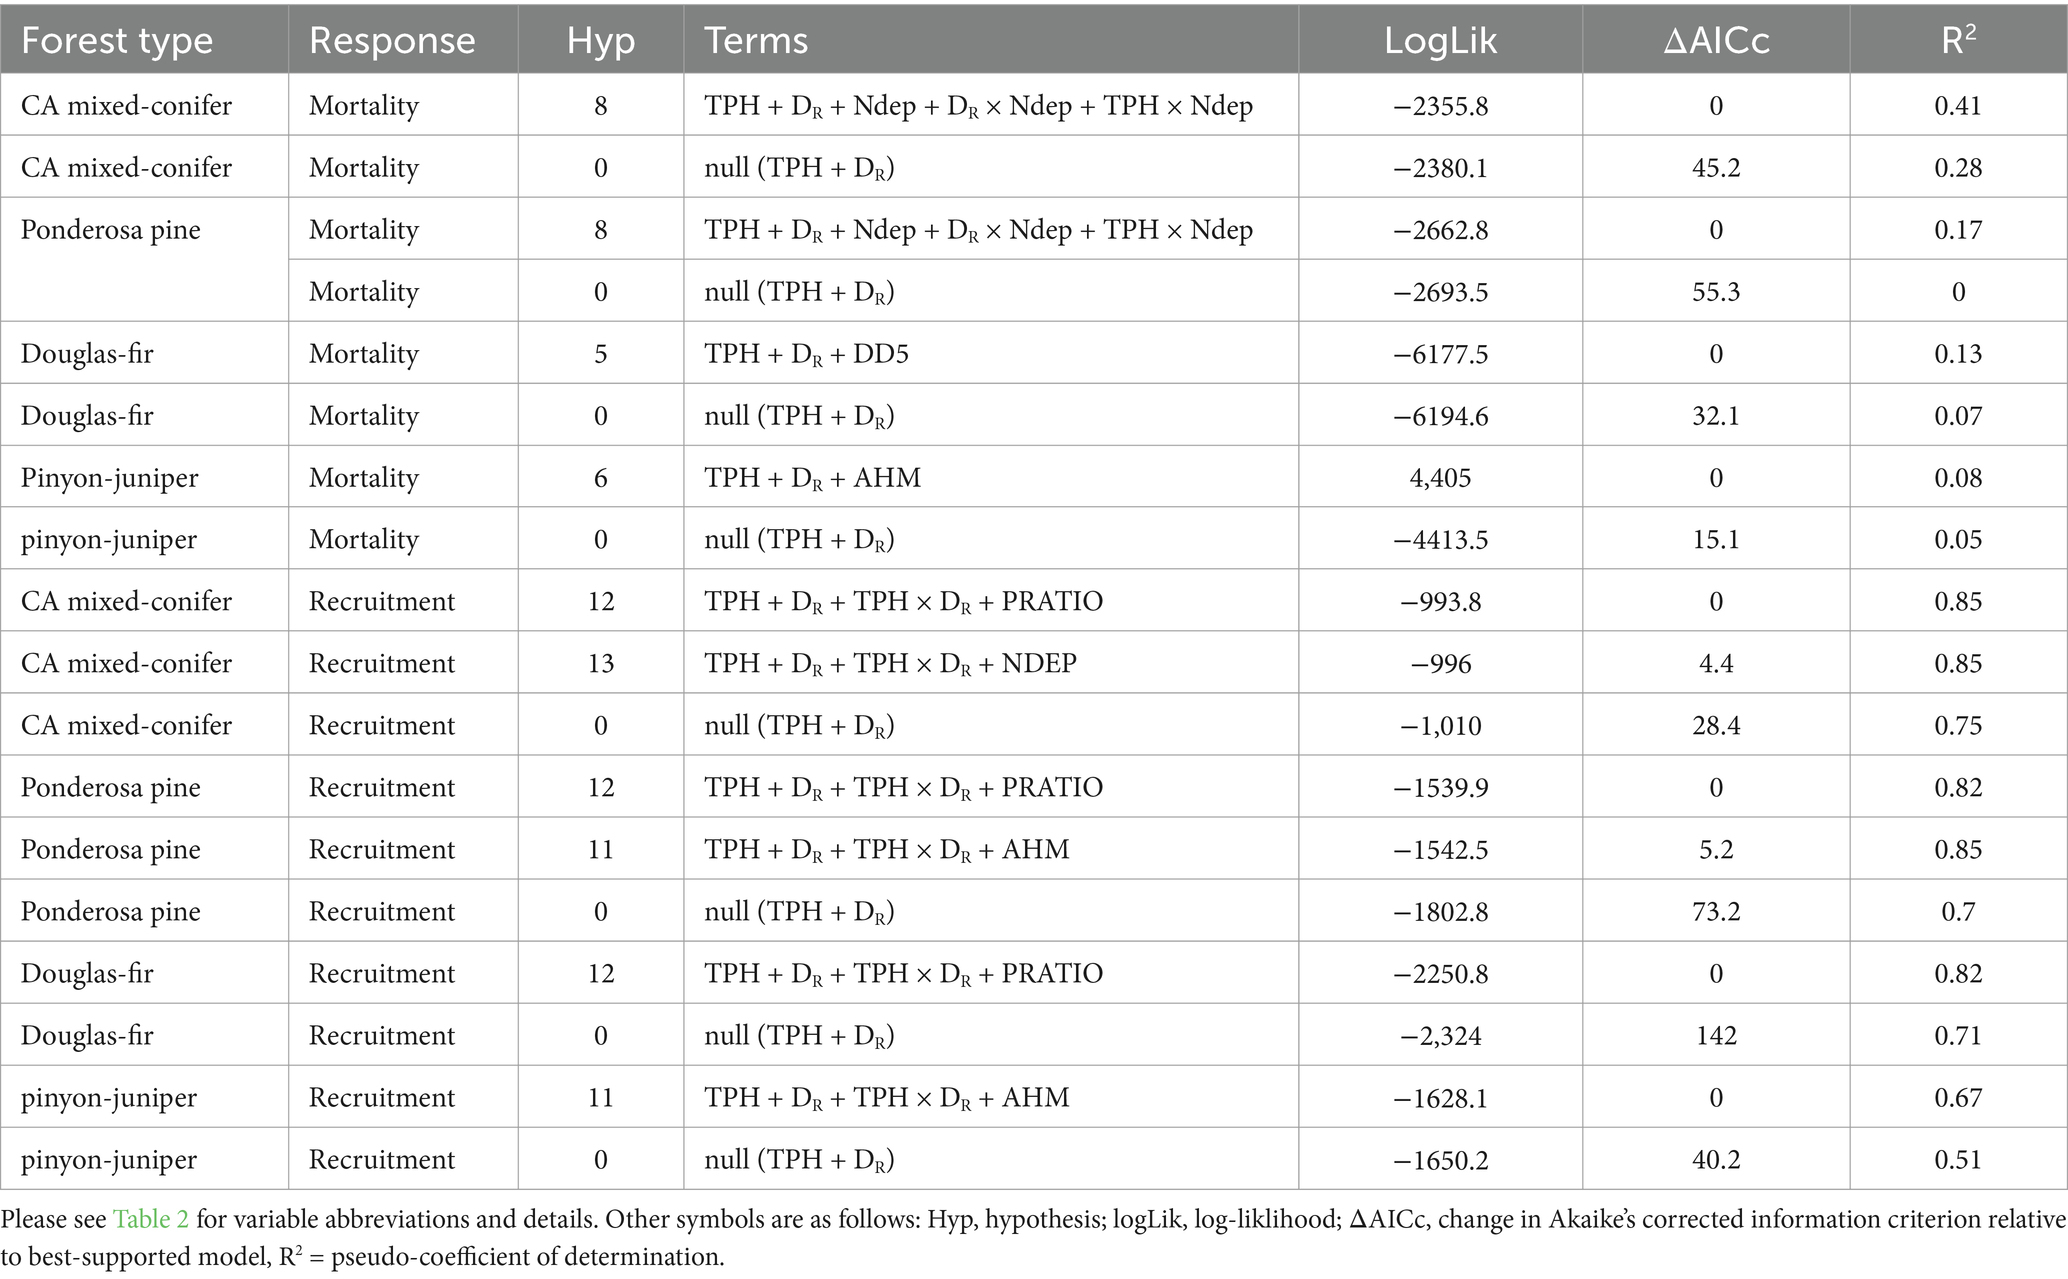
Table 5. Plausible and null hypothesis models of annual ASDI of mortality and recruitment for four forest types.
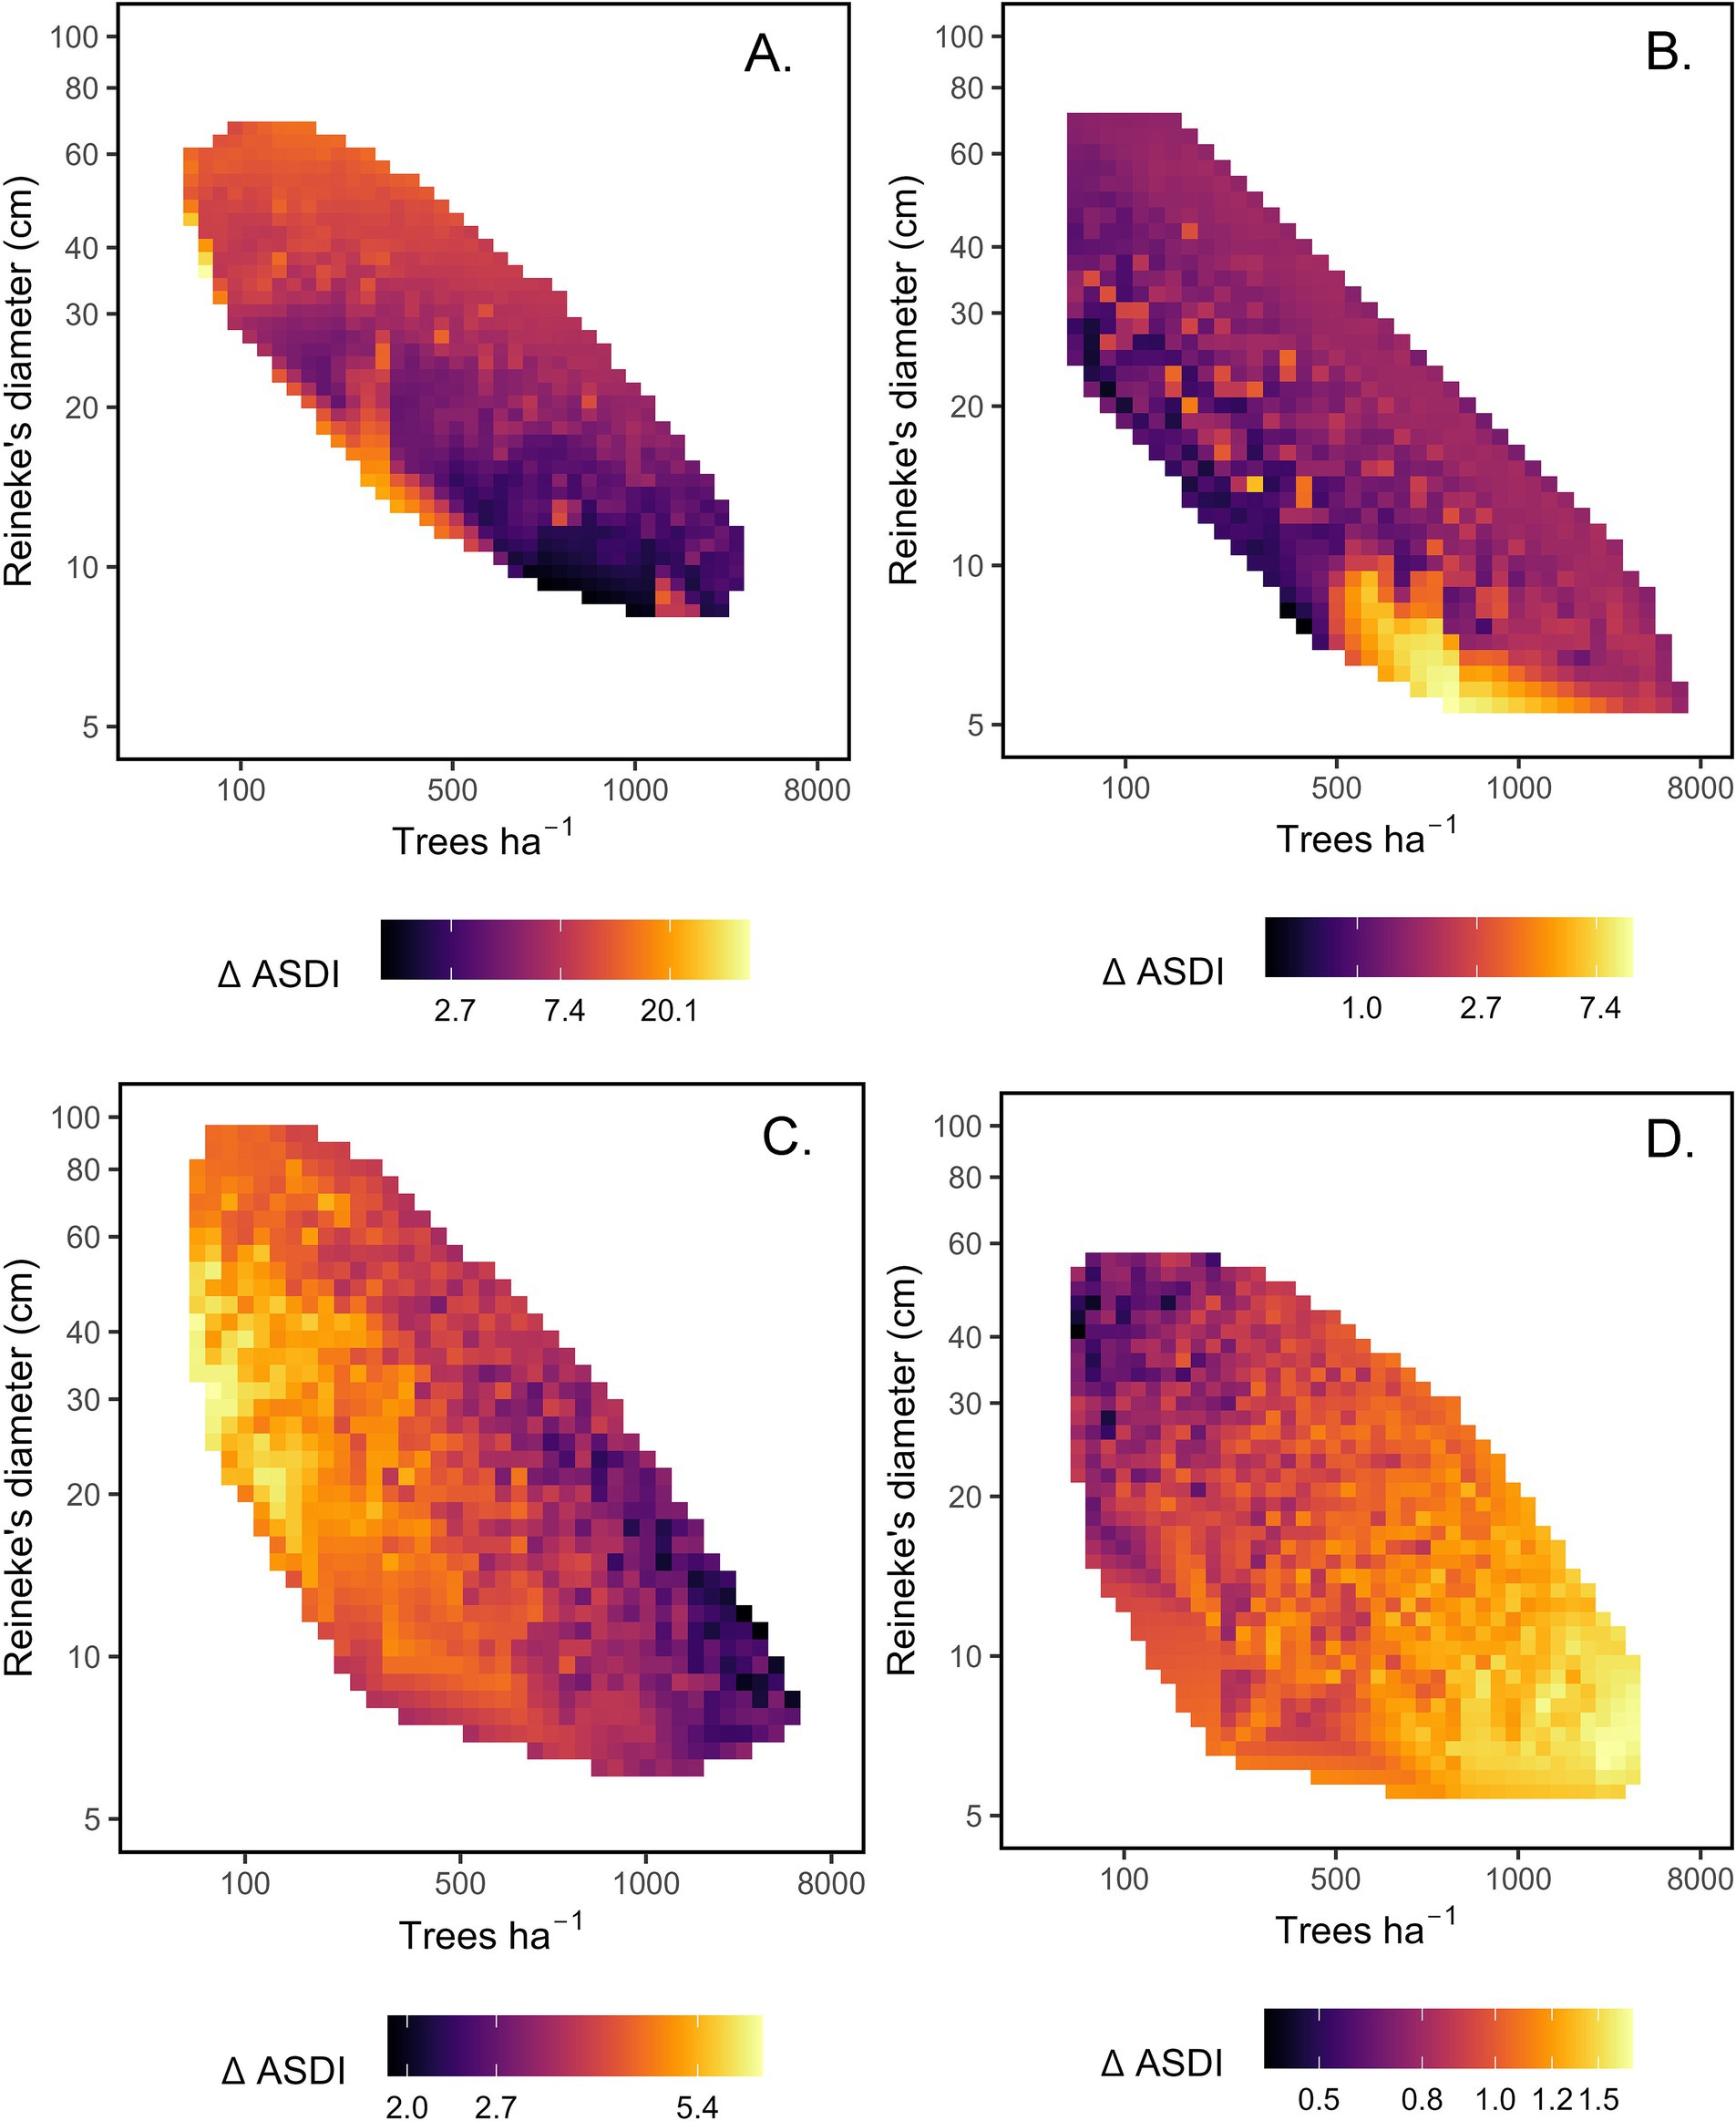
Figure 4. Heat maps of predicted tree mortality (Additive stand density index ha−1 yr−1, ΔASDI) based on plausible models for four forest types. Panels depict predicted mortality within tree density (trees ha−1)-size (Reineke’s diameter, cm) space, adjusting for the effects of climate or N deposition covariates. (A) California mixed-conifer, adjusted for nitrogen deposition (Ndep) main effects and interactions. (B) Ponderosa pine, adjusted for Ndep main effects and interactions (C) Douglas-fir, adjusted for growing degree days (DD5) main effect. (D) Pinyon-juniper, adjusted for annual heat-moisture index (AHM) main effect. Please note that density and size are log-transformed and reflect initial (t1) conditions. The color ramp for mortality is log-transformed and scaled by forest type for visibility, with large differences in scale among forest types.
For ponderosa pine mortality ΔASDI, the best-supported model contained the main effects of TPH, DR, Ndep, and interactions of Ndep with TPH and DR (Hyp. H8). Mortality was consistently elevated along the MSDB. N deposition interacted with structure (Figure 4B). Holding DR constant at its mean, moving from the 10th to 90th percentile of Ndep increased mortality ΔASDI by 667% at the 10th percentile of TPH while reducing mortality by just 51% at the 90th percentile of TPH. Holding TPH constant at its mean, moving from the 10th to 90th percentile of Ndep increased mortality ΔASDI by 708% at the 10th percentile of DR while reducing mortality by 34% at the 90th percentile of DR. No other model was plausible for this forest type.
For Douglas-fir mortality ΔASDI, the best-supported model contained the main effects of TPH, DR, and DD5 (Hyp. H5). Mortality ΔASDI varied little with DR but declined with TPH, with mortality concentrated in large-diameter stands that were not closely associated with the MSDB (Figure 4C). At the 10th percentile of TPH, mortality increased by only 3% when DR shifted from its 10th to 90th percentile. A the 90th percentile of TPH, mortality declined by 67% when DR shifted from its 10th to 90th percentile. The DD5 main effect translated to a 37% decline in mortality when DD5 shifted from the 10th to 90th percentile. No other mortality model was plausible for Douglas-fir.
The best-supported pinyon-juniper mortality ΔASDI model contained the main effects of TPH, DR, and AHM (Hyp. H6). However, pinyon-juniper models were the weakest of all forest types examined (pseudo-R2 = 8%). Mortality ΔASDI increased with TPH but not DR, rendering a band of elevated morality along the MSDB that was unevenly concentrated in small-diameter stands (Figure 4D). Holding DR and AHM constant at their means, a change in TPH from the 10th to 90th percentile corresponded with a 29% increase in predicted mortality. Holding TPH and AHM constant at their means, moving from the 10th to 90th percentile of DR resulted in a 34% decrease in predicted mortality. Mortality increased with the main effect of AHM, such that moving from the 10th to 90th percentile of AHM decreased mortality rates by 33%. No other mortality model was plausible for pinyon-juniper.
The best-supported models for California mixed-conifer, ponderosa pine, and Douglas-fir recruitment ΔASDI included the main effects of TPH, DR, PRATIO, and interactions of TPH with DR (Hyp. H12). Given the shifting ranges of TPH and DR in size-density space, we describe broad trends rather than effect sizes for this interaction. Under the TPH x DR interaction and holding PRATIO constant at its mean, predicted recruitment was higher in low-DR stands and increased more slowly with TPH relative to high- DR stands (Figure 5). Recruitment was lowest in stands that had both high DR and low TPH. Under the main effect of PRATIO, California mixed-conifer (Figure 5A), ponderosa pine (Figure 5C), and Douglas-fir (Figure 5E) recruitment declined by approximately 31, 47, and 71%, respectively, when PRATIO moved from the 10th to 90th percentile for each forest type. Given the limited gamut of PRATIO for California mixed-conifer, the PRATIO effect was proportionately strongest for this forest type. A second plausible California mixed-conifer recruitment model had a similar interaction between TPH and DR, but included the main effect of Ndep (Hyp. H13). Under this model, shifting Ndep from its 10th to 90th percentile increased recruitment ΔASDI by 35% (Figure 5B). A second plausible ponderosa pine model indicated that AHM acted as a main effect to influence recruitment (Hyp. H11). Moving from the 10th to 90th percentile of AHM reduced ponderosa pine recruitment by 44% (Figure 5D). No other models were plausible for California mixed-conifer and ponderosa pine.
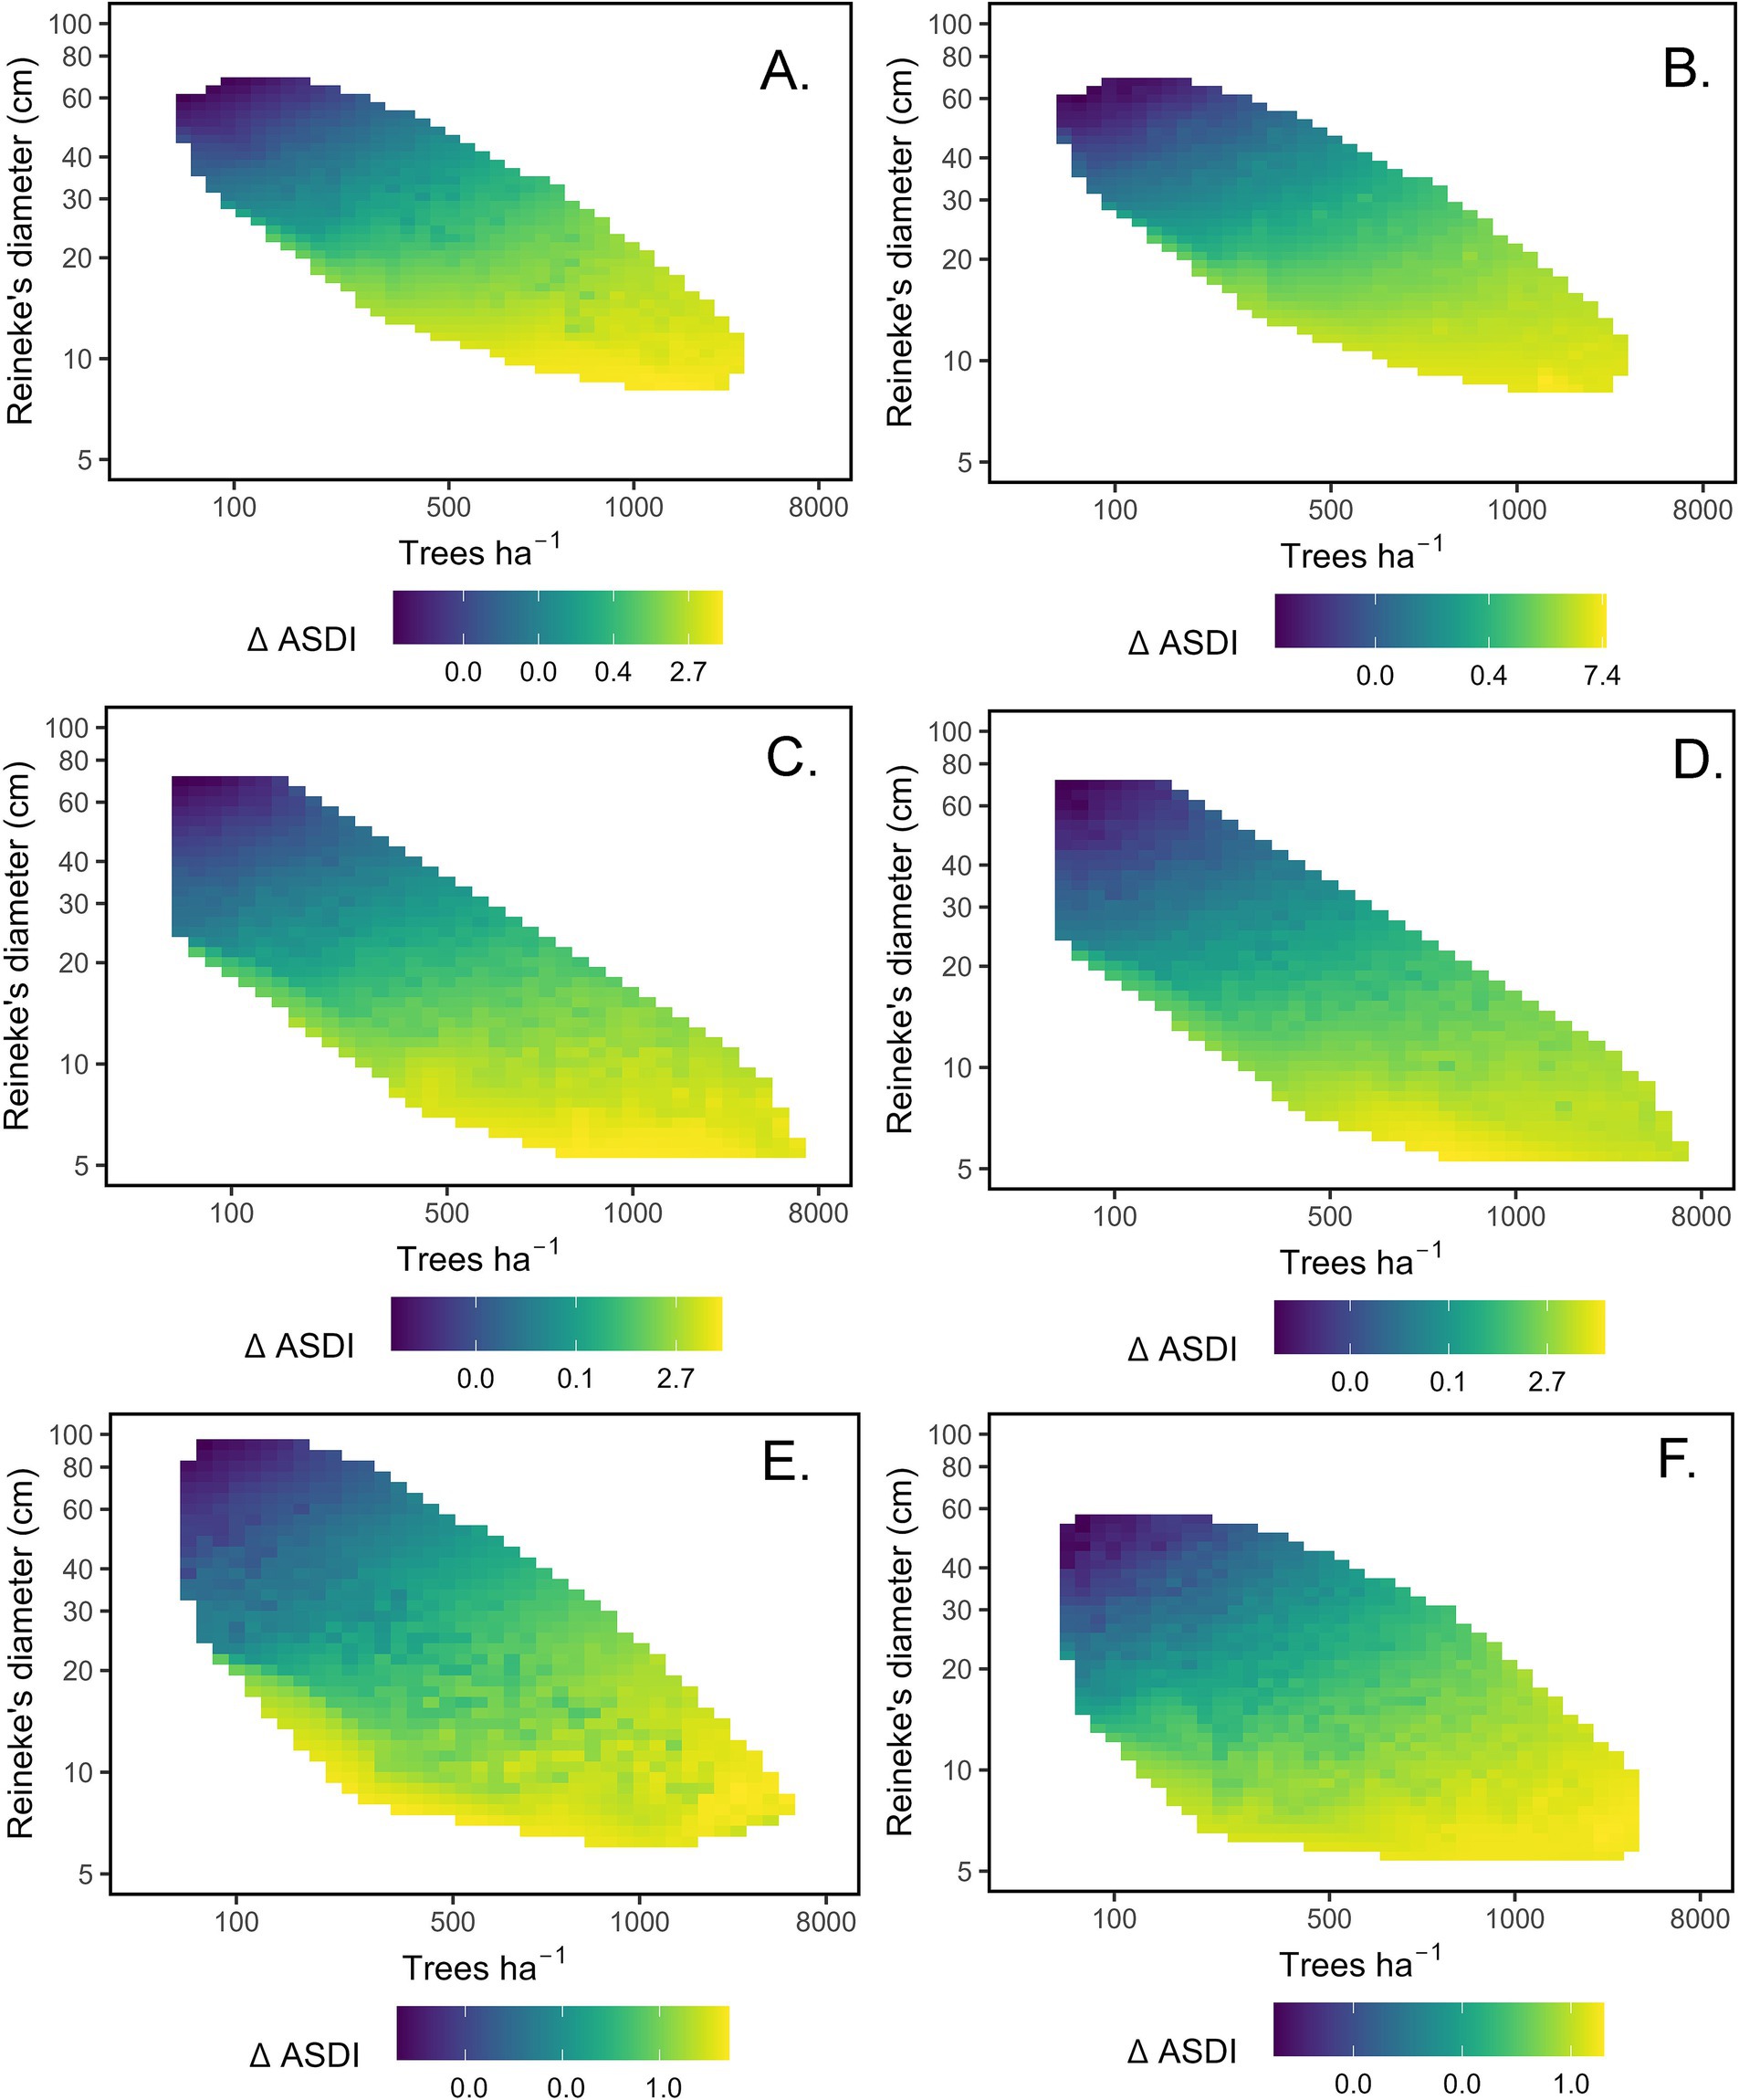
Figure 5. Heat maps of predicted sapling recruitment (Additive stand density index ha−1 yr−1, ΔASDI) based on plausible models for four forest types. Panels depict predicted recruitment within tree density (trees ha−1)-size (Reineke’s diameter, cm) space, adjusting for the effects of climate or N deposition covariates. (A) California mixed-conifer, adjusted for nitrogen deposition (Ndep) main effect. (B) California mixed-conifer, (alt. model) adjusted for Ndep main effect. (C) Ponderosa pine, adjusted for the ratio of May–September to mean annual precipitation (PRATIO) main effect. (D) Ponderosa pine (alt model), adjusted for the annual heat-moisture index main (AHM) effect. (E) Douglas-fir, adjusted for the PRATIO main effect. (F) Pinyon-juniper, adjusted for the AHM main effect. Please note that density and size are log-transformed and reflect initial (t1) conditions. The color ramp for recruitment is log-transformed and scaled by forest type for visibility, with large absolute differences in scale among forest types.
For Pinyon-juniper recruitment ΔASDI, the best-support model contained the main effects of TPH, DR, the TPH x DR interaction, and AHM (Hyp. H11). ΔASDI increased more rapidly with TPH in high vs. low DR stands. Recruitment decreased with AHM, such that moving from the 10th to 90th percentile of AHM decreased recruitment rates by 50% (Figure 5F). No other mortality model was plausible for pinyon-juniper.
Previous studies have established that the slope or intercept of MSDBs varies with climate (Ducey et al., 2017; Pretzsch and Biber, 2022), but have not considered whether climate has more nuanced effects on the curvilinearity of the MSDB. We found that curvilinear MSDBs were present in all forest types but were contingent on climate factors in Ponderosa pine and Douglas-fir. PRATIO substantially altered the curvilinearity of the MSDB in ponderosa pine, with large-diameter stands subject to higher PRATIO exhibiting a shallower slope and lower maximum ASDI. Conifers use summer precipitation to a lesser extent compared to winter moisture that infiltrates soils to greater depths (Guo et al., 2018). Higher stand densities can increase interception and lower the retention of snowpack moisture important to sustaining large, deeply rooted ponderosa pine in the continental interior of its range (Gleason et al., 2017; Kerhoulas et al., 2023). Beyond ecohydrological hypotheses, PRATIO effects could reflect broad regional differences in productivity. Observed and modeled forest productivity is higher along the Pacific Coast states compared to the continental interior, reflecting a combination of summer moisture demand and milder winter temperatures (Weiskittel et al., 2011). Ponderosa pine stands subject to low PRATIO support higher site index and maximum SDI (Zhang et al., 2020), which could reflect rain shadow effects in settings such as the eastern Sierra-Cascades and Rocky Mountains (Harris and Taylor, 2020).
Our findings are in agreement with previous studies establishing the importance of site moisture to determining local maximum SDI, including both semi-arid (Kimsey et al., 2019) and temperate forests (Andrews et al., 2018; Pretzsch and Biber, 2022). For the mixed-species forest types, California mixed-conifer and pinyon-juniper, AHM effects could correspond with shifts in species composition. Arid conditions typically favor juniper over pinyon pine (Miller et al., 2019), and monospecific stands of juniper support lower maximum SDI compared to mixed pinyon-juniper stands (Schuler and Smith, 1988). For Douglas-fir, greater site moisture has been correlated with faster tree ring and carbon growth (Griesbauer et al., 2011; Roach et al., 2021). Locally steeper slopes in humid, small-diameter stands under the AHM x DR interaction in plausible alternative models for California mixed-conifer and Douglas-fir confirmed findings that higher site quality can steepen slopes by reducing self-thinning (Kweon and Comeau, 2021). Disproportionate impacts of AHM on maximum stocking in large-diameter stands of California mixed-conifer support findings that large-pine mortality odds were higher on more arid plots during the 2010s Sierra Nevada tree mortality event (Koontz et al., 2021).
To our knowledge, our study is the first to link variation in the MSDB to N deposition. A previous experimental study found no long-term shifts in Norway spruce MSDB under fertilization (Pretzsch and Biber, 2022). Our examination of nonlinear N deposition effects over a wide range of stand structures may have allowed us to detect subtle trends not discernable in even-aged stands alone. For all four forest types, quadratic Ndep effects on curvilinearity were evident once controlling for aridity, as indicated by AHM (H16). In California mixed-conifer and Douglas-fir, Ndep slightly reduced the tradeoff between tree size and number in small-diameter stands. This behavior is in agreement with findings of steeper MSDB slopes with increasing site quality and rapid young-stand growth (Kweon and Comeau, 2021). Lower abiotic stress is expected to steepen self-thinning lines as competition shifts from size-symmetric for soil resources to size-asymmetric for light (Zhang et al., 2017). Meanwhile, more biologically mature stands of California mixed-conifer and pinyon-juniper showed marginally more restrictive size-density tradeoffs under heavier N deposition. This finding for mature stands may reflect the disproportionate benefits of higher resource availability to large-tree growth and accelerated self-thinning in smaller trees (Pretzsch and Dieler, 2010; Looney et al., 2021). Mature and old-growth stands may also be more sensitive to deleterious N deposition effects due to lower ecosystem demand (Latty et al., 2003). Meanwhile, our finding that N deposition raised overall stocking (increased the MSDB intercept) in ponderosa pine agrees with previous research finding a positive effect of site index on ponderosa pine maximum stocking (Zhang et al., 2020). Ponderosa pine forests in southern California have declined under extreme N deposition (Takemoto et al., 2001), but comparatively low rates of N deposition may have mild fertilization effects across the broader range of this species.
Our findings of MSDBs that were curvilinear depending on site conditions do not necessarily mean that self-thinning drove these relationships. Generational changes in overall carrying capacity, as indicated by increased slope coefficients, may drive apparent differences in MSDB slope. Yang and Brandeis (2022) noted that historical productivity gains through intensive forest management may distort loblolly pine (Pinus taeda) size-density space. Structural complexity might also mediate abiotic stress effects on MSDBs. Stands with more complex tree size distributions have weaker self-thinning (steeper MSDB slopes) compared to uniform stands (Pretzsch et al., 2024). Heavier N deposition is associated with disproportionately rapid large-tree growth in forests of the U.S. west coast, a growth pattern which can reinforce initially high structural complexity (Looney et al., 2021). Structural complexity could thereby conceivably mediate N deposition effects by promoting further vertical differentiation in tree size and reducing the intensity of self-thinning in already complex stands. Finally, tree interactions could have potentially shifted from competition to facilitation under both N deposition and climate. Facilitation is expected to strengthen under abiotic stress (Maestre et al., 2009) and paradoxically accelerate self-thinning (Zhang et al., 2017).
The MSDB is traditionally assessed for even-aged stands dominated by self-thinning (e.g., Charru et al., 2012). Our examination of mortality across a wide gradient may therefore provide insights into whether competition consistently shapes the MSDB or whether it follows stand development models, where external disturbances replace self-thinning as the primary mortality agents affecting mature and old-growth stands (Oliver and Larson, 1996; Larson et al., 2015). We found that for all forest types, mortality ΔASDI varied with the main effects of TPH and DR but that these two aspects of stand structure did not interact (Hypothesis models 5, 7, and 8). The distribution of mortality in size-density space therefore represented the balance of density and mean stand diameter effects, as opposed to the inherent strength of the stand density effect changing as stands matured biologically.
Our analyses of mortality ΔASDI in size-density space revealed that mortality was consistently elevated along the MSDB for ponderosa pine, providing little evidence for large tree mortality (Zeide, 2010) as an explanation of curvilinear MSDBs in this forest type. While N deposition interacted with structure to reduce mortality in dense, large-diameter stands, N deposition had no apparent effect on the curvilinearity of the ponderosa pine MSDB. Relationships between N deposition and tree mortality are complex, with N deposition stimulating higher leaf areas and self-thinning while rendering mature trees more vulnerable to other stressors (Ibáñez et al., 2016; Fenn et al., 2020). Yet low rates of N deposition may be beneficial to survival (Horn et al., 2018). High stand density in fire-excluded western conifer stands can also create N limitation (Marshall et al., 2019) while promoting N throughfall (De Schrijver et al., 2007).
In California mixed-conifer, mortality was elevated along the MSDB but increased in large-diameter stands. This forest type therefore presented a case where mortality may have contributed to curvilinearity in the MSDB. California mixed-conifer stands experienced dramatic mortality in the 2010s, with the combined effects of drought and bark beetle outbreaks heavily impacting large ponderosa and sugar pine in dense stands (Fettig et al., 2019; Koontz et al., 2021). N deposition interacted with stand structure to influence mortality, but not in a way consistent with observed N effects on the MSDB. N deposition mitigated, rather than aggravated mortality in dense stands of large trees. Reduced mortality under N deposition may instead reflect N-driven compositional shifts. Declines in N-sensitive species could have favored white fir (Abies concolor) and incense-cedar (Calocedrus decurrens) (Takemoto et al., 2001), which were less susceptible to the 2010s regional tree mortality event (Fettig et al., 2019).
Mortality in Douglas-fir and pinyon-juniper presented reduced many stands below the MSDB, but did not clearly define its curvilinearity. Douglas-fir and pinyon pine showed elevated mortality concentrated at extremes of size-density space, but not closely corresponding with either the MSDB. Meanwhile structure did not interact with climate factors or N deposition. Douglas-fir demonstrated excessive mortality in open stands of large trees. Meanwhile, DD5 was negatively correlated with mortality. Higher degree days are associated with elevated productivity in coastal Douglas-fir, although high temperatures can lead to direct physiological stress and insect and disease issues (Agne et al., 2018). Pinyon pine models had weak explanatory power (Pseudo-R2 = ≤0.08), with mortality concentrated in dense stands of small trees. Heavy losses of large trees in 2000s pinyon-juniper mortality events (Negrón and Wilson, 2003; Mueller et al., 2005) may have lowered subsequent mortality risk in mature and old-growth stands (Flake and Weisberg, 2019).
Shaw and Long (2007) hypothesized that the inability of recruitment to recapture growing space was a driver of curvilinear MSDBs. Our analysis of recruitment found support for this hypothesis in all four forest types, with consistently lower overall recruitment in large-diameter stands, particularly under low TPH. Furthermore, in contrast to mortality, TPH commonly interacted with DR (Hypothesis models 11–13) indicating that density effects were contingent on biological maturity. Regeneration commonly shows a tradeoff between seed tree availability and stand density, with a combination of mature trees that can serve as productive seed sources and moderate stand density promoting high regeneration in empirical models of natural regeneration (Vandendriesche, 2010; Puhlick et al., 2012). Accumulations of litter in older, dense stands can also reduce regeneration success (Stein and Kimberling, 2003). Forest management could sustain biologically mature stands through practices such as group selection harvesting, which could provide an opportunity to bolster adaptation to global change and fire (Muller et al., 2019; York et al., 2021).
Climate factors and N deposition affected recruitment, but did not interact with forest structure. Our findings that ponderosa pine and Douglas-fir recruitment declined with increasing aridity, as indicated by AHM, are in agreement with previous studies of western U.S. forest regeneration in post-fire settings (Stevens-Rumann and Morgan, 2019). N deposition could increase California mixed-conifer seedling and sapling growth (Fenn et al., 2020). Our finding that recruitment varied with PRATIO was surprising given that the regeneration and growth of both Douglas-fir and ponderosa pine increase with summer moisture (Hankin et al., 2019). As with maximum SDI, rain shadow effects east of Maritime and Mediterranean coastal forests (Harris and Taylor, 2020) could also account for our recruitment results by limiting sapling growth rates.
Our findings have implications for commonly used silvicultural planning tools. Density management diagrams assume that stands fall into different density management zones representing consistent thresholds of the onset of competition, optimal potential growth, and density-dependent mortality (Ray et al., 2023). Our findings challenged this assumption. Mortality was inconsistent across size-density space for all forest types besides ponderosa pine. Recent major disturbance events, such as southern Sierra Nevada and southwestern Pinyon-juniper mortality (Mueller et al., 2005; Fettig et al., 2019), may be leading to fundamental reorganizations of growing space for these forest types. When designing thinning treatments to capture mortality, mature stands of forest types such as California mixed-conifer may warrant prioritization and more severe treatment relative to juvenile stands. Meanwhile, the MSDB may provide an imperfect guide to anticipating contemporary mortality in Douglas-fir and pinyon-juniper. More sophisticated growth and yield models such as the Forest Vegetation Simulator often rely on maximum SDI to predict mortality (Crookston and Dixon, 2005). The use of maximum SDI developed for even-aged stands could also lead to erroneous mortality predictions for mature stands under global change.
The MSDB deviated from linear in every forest type examined, with the degree of curvilinearity always contingent on either climate factors or N deposition. While the −3/2 log self-thinning “rule” (Yoda, 1963) has been historically useful (Long et al., 2004), our findings suggest that allowing for greater nuance in the study of tree competition dynamics could advance both forest ecology and density management. Although ours is the first study to quantify curvilinearity in the MSDB for these forest types within their native range, Charru et al. (2012) found evidence that European stands of Douglas-fir also exhibited a curvilinear MSDB. In addition to being contingent on abiotic covariates, curvilinear MSDBs were generally gradual and did not show abrupt thresholds resembling the MSBs of previous studies of even-aged stands (Shaw and Long, 2007; Vacchiano et al., 2013). The MSB may, therefore, not be a regular feature of the transition between Oliver and Larson’s (1996) Understory Reinitiation and Old Growth stages of stand development. Compared to studies focusing on even-aged stands which found abrupt MSBs, our findings were similar to those of Charru et al. (2012), who found evidence of gentler curvilinear MSDBs in several forest types when examining both even-aged and irregular stands.
A limitation of our study was that we were limited to interpreting results in terms of a continuous gradient of biological maturity as indicated by mean stand diameter. While using the MSDB to define the thresholds of the mature and old-growth stages was beyond the scope of our paper, this approach would be overly simplistic for classifying discrete stand development stages. For example, new age classes or cohorts of trees emerging in Oliver and Larson’s (Oliver and Larson, 1996) Understory Reinitiation or Old-growth phases would be expected to reduce mean stand diameter. In any case, the lack of well-defined MSBs independent of site quality suggests the concept of the MSB alone has limited potential to consistently define the thresholds of mature or old-growth conditions. Future studies seeking to refine mature and old-growth classifications might integrate MSDBs, mortality, and structurally-based indices of mature and old-growth stands, such as the Forest Inventory Growth Stage System developed for the FIA dataset (Woodall et al., 2023).
Our findings shed light on the nature of the MSDB when extended from its traditional focus on relatively young, even-aged stands to encompass mature and old-growth stands. Rather than a mature stand boundary being a regular feature of stand development, we found that the curvilinearity of the MSDB could encompass the full range of stand diameters or be most evident in biologically young stands. Climate and N deposition also had previously unappreciated interactions with mean stand diameter altering the curvilinearity of the MSDB. Instead of these site factors consistently altering local maximum SDI for a given forest type, we found that climate and N deposition commonly restricted local maximum SDI depending on the stage of stand development. While the precise mechanisms at play remain unresolved, our results suggested how site factors alter the processes of self-thinning, recruitment, growth, and disturbance susceptibility that ultimately shape the limits of tree size and density across the landscape. Our results caution against assuming self-thinning is consistently the primary stand dynamic structuring the MSDB, as has been implied through the interchangeable use of these terms in the literature. More importantly, accurately understanding the limits of feasible stand structures is critical to forest management. Our work can help avoid overly optimistic silvicultural planning for mature stands that may arise from extrapolating existing principles and models from simpler, even-aged systems, particularly on sites representing extremes of climate or N deposition.
The raw datasets analyzed for this study are publicly available from https://research.fs.usda.gov/products/dataandtools/tools/fia-datamart, https://gaftp.epa.gov/castnet/tdep/CURRENT_grids/, and https://climatena.ca/. The R script used to generate the derived data used for analysis is available as Supplementary material S5. The authors will also provide derived datasets used with this script upon request.
CL: Conceptualization, Data curation, Formal analysis, Methodology, Visualization, Writing – original draft, Writing – review & editing. JS: Conceptualization, Methodology, Writing – original draft, Writing – review & editing.
The author(s) declare that financial support was received for the research and/or publication of this article. Funding was provided by the USDA Forest Service as part of CEL and JDS's official salaried time.
We thank Chris Woodall for suggestions on initial study background and scope. Thanks to Nels Johnson for consulting on statistical analysis options. We thank Jeremy Fried and Andy Gray for advice on computing expansion factors and forest demographics with FIA data. Thanks to the PSW Research Station and attendees of the 2024 Society of American Foresters National Convention for presentation feedback and encouragement in completing this project. We thank two peer reviewers for comments that substantially improved this manuscript. The findings and conclusions in this publication are those of the authors and should not be construed to represent any official USDA or U.S. Government determination or policy.
The authors declare that the research was conducted in the absence of any commercial or financial relationships that could be construed as potential conflicts of interest.
The author(s) declare that no Gen AI was used in the creation of this manuscript.
All claims expressed in this article are solely those of the authors and do not necessarily represent those of their affiliated organizations, or those of the publisher, the editors and the reviewers. Any product that may be evaluated in this article, or claim that may be made by its manufacturer, is not guaranteed or endorsed by the publisher.
The Supplementary material for this article can be found online at: https://www.frontiersin.org/articles/10.3389/ffgc.2025.1566459/full#supplementary-material
Agne, M. C., Beedlow, P. A., Shaw, D. C., Woodruff, D. R., Lee, E. H., Cline, S. P., et al. (2018). Interactions of predominant insects and diseases with climate change in Douglas-fir forests of western Oregon and Washington, U.S.A. For. Ecol. Manag. 409, 317–332. doi: 10.1016/j.foreco.2017.11.004
Aigner, D., Lovell, C. A. K., and Schmidt, P. (1977). Formulation and estimation of stochastic frontier production function models. J. Econ. 6, 21–37. doi: 10.1016/0304-4076(77)90052-5
Akaike, H. (1974). A new look at the statistical model identification. IEEE Trans. Autom. Control 19, 716–723. doi: 10.1109/TAC.1974.1100705
Andrews, C., Weiskittel, A., D’Amato, A. W., and Simons-Legaard, E. (2018). Variation in the maximum stand density index and its linkage to climate in mixed species forests of the North American Acadian region. For. Ecol. Manag. 417, 90–102. doi: 10.1016/j.foreco.2018.02.038
Bechtold, W. A., and Patterson, P. L. (2005). The enhanced forest inventory and analysis program - national sampling design and estimation procedures. Ashville, NC: U.S. Department of Agriculture.
Bennett, M., Shaw, D. C., and Lowrey, L. (2023). Recent Douglas-fir mortality in the Klamath Mountains ecoregion of Oregon: evidence for a decline spiral. J. For. 121, 246–261. doi: 10.1093/jofore/fvad007
Bobbink, R., Hicks, K., Galloway, J., Spranger, T., Alkemade, R., Ashmore, M., et al. (2010). Global assessment of nitrogen deposition effects on terrestrial plant diversity: a synthesis. Ecol. Appl. 20, 30–59. doi: 10.1890/08-1140.1
Bowman, W. D., Cleveland, C. C., Halada, Ĺ., Hreško, J., and Baron, J. S. (2008). Negative impact of nitrogen deposition on soil buffering capacity. Nat. Geosci. 1, 767–770. doi: 10.1038/ngeo339
Burnham, K. P., and Anderson, D. R. (2002). Model selection and multimodel inference: A practical information-theoretic approach. 2nd Edn. New York: Springer-Verlag. [Online]. Available at: https://www.fs.usda.gov/research/products/dataandtools/datasets/fia-datamart
Burrill, E., DiTommaso, A. M., Turner, J. A., Pugh, S. A., Christensen, G., Perry, C. J., et al. (2024). The Forest inventory and analysis database, FIADB user guides, volume database description (version 9.2), nationwide forest inventory (NFI) : Department of Agriculture Forest Service.
Charru, M., Seynave, I., Morneau, F., Rivoire, M., and Bontemps, J.-D. (2012). Significant differences and curvilinearity in the self-thinning relationships of 11 temperate tree species assessed from forest inventory data. Ann. For. Sci. 69, 195–205. doi: 10.1007/s13595-011-0149-0
Chivhenge, E., Ray, D. G., Weiskittel, A. R., Woodall, C. W., and D’Amato, A. W. (2024). Evaluating the development and application of stand density index for the management of complex and adaptive forests. Curr. For. Rep. 10, 133–152. doi: 10.1007/s40725-024-00212-w
Clark, C. M., Richkus, J., Jones, P. W., Phelan, J., Burns, D. A., de Vries, W., et al. (2019). A synthesis of ecosystem management strategies for forests in the face of chronic nitrogen deposition. Environ. Pollut. 248, 1046–1058. doi: 10.1016/j.envpol.2019.02.006
Crookston, N. L., and Dixon, G. E. (2005). The forest vegetation simulator: a review of its structure, content, and applications. Comput. Electron. Agric. 49, 60–80. doi: 10.1016/j.compag.2005.02.003
De Schrijver, A., Geudens, G., Augusto, L., Staelens, J., Mertens, J., Wuyts, K., et al. (2007). The effect of forest type on throughfall deposition and seepage flux: a review. Oecologia 153, 663–674. doi: 10.1007/s00442-007-0776-1
Drew, T. J., and Flewelling, J. W. (1979). Stand density management: an alternative approach and its application to Douglas-fir plantations. For. Sci. 25, 518–532. doi: 10.1093/forestscience/25.3.518
Ducey, M. J., and Larson, B. C. (2003). Is there a correct stand density index? An alternate interpretation. West. J. Appl. For. 18, 179–184. doi: 10.1093/wjaf/18.3.179
Ducey, M. J., Woodall, C. W., and Bravo-Oviedo, A. (2017). Climate and species functional traits influence maximum live tree stocking in the Lake states, USA. For. Ecol. Manag. 386, 51–61. doi: 10.1016/j.foreco.2016.12.007
Fenn, M. E., Preisler, H. K., Fried, J. S., Bytnerowicz, A., Schilling, S. L., Jovan, S., et al. (2020). Evaluating the effects of nitrogen and sulfur deposition and ozone on tree growth and mortality in California using a spatially comprehensive forest inventory. For. Ecol. Manag. 465:118084. doi: 10.1016/j.foreco.2020.118084
Fettig, C. J., Mortenson, L. A., Bulaon, B. M., and Foulk, P. B. (2019). Tree mortality following drought in the central and southern Sierra Nevada, California, U.S. For. Ecol. Manag. 432, 164–178. doi: 10.1016/j.foreco.2018.09.006
Finzi, A. C., Moore, D. J. P., DeLucia, E. H., Lichter, J., Hofmockel, K. S., Jackson, R. B., et al. (2006). Progressive nitrogen limitation of ecosystem processes under elevated co2 in a warm-temperate forest. Ecology 87, 15–25. doi: 10.1890/04-1748
Flake, S. W., and Weisberg, P. J. (2019). Fine-scale stand structure mediates drought-induced tree mortality in pinyon–juniper woodlands. Ecol. Appl. 29:e01831. doi: 10.1002/eap.1831
Foster, S. D., and Bravington, M. V. (2013). A Poisson–gamma model for analysis of ecological non-negative continuous data. Environ. Ecol. Stat. 20, 533–552. doi: 10.1007/s10651-012-0233-0
Frescino, T. S., Moisen, G. G., Patterson, P. L., Toney, C., and White, G. W. (2023). ‘FIESTA’: a forest inventory estimation and analysis R package. Ecography 2023:e06428. doi: 10.1111/ecog.06428
Gibson, J., Moisen, G., Frescino, T., and Edwards, T. C. (2014). Using publicly available Forest inventory data in climate-based models of tree species distribution: examining effects of true versus altered location coordinates. Ecosystems 17, 43–53. doi: 10.1007/s10021-013-9703-y
Gillespie, A. J. R. (1999). Rationale for a National Annual Forest Inventory Program. J. For. 97, 16–20. doi: 10.1093/jof/97.12.16
Gleason, K. E., Bradford, J. B., Bottero, A., D’Amato, A. W., Fraver, S., Palik, B. J., et al. (2017). Competition amplifies drought stress in forests across broad climatic and compositional gradients. Ecosphere 8:1849. doi: 10.1002/ecs2.1849
Goeking, S. A. (2015). Disentangling forest change from forest inventory change: a case study from the US interior west. J. For. 113, 475–483. doi: 10.5849/jof.14-088
Gorham, E., Vitousek, P. M., and Reiners, W. A. (1979). The regulation of chemical budgets over the course of terrestrial ecosystem succession. Annu. Rev. Ecol. Syst. 10, 53–84. doi: 10.1146/annurev.es.10.110179.000413
Griesbauer, H. P., Green, D. S., and O’Neill, G. A. (2011). Using a spatiotemporal climate model to assess population-level Douglas-fir growth sensitivity to climate change across large climatic gradients in British Columbia, Canada. For. Ecol. Manag. 261, 589–600. doi: 10.1016/j.foreco.2010.11.012
Guo, J. S., Hungate, B. A., Kolb, T. E., and Koch, G. W. (2018). Water source niche overlap increases with site moisture availability in woody perennials. Plant Ecol. 219, 719–735. doi: 10.1007/s11258-018-0829-z
Hankin, L. E., Higuera, P. E., Davis, K. T., and Dobrowski, S. Z. (2019). Impacts of growing-season climate on tree growth and post-fire regeneration in ponderosa pine and Douglas-fir forests. Ecosphere 10:e02679. doi: 10.1002/ecs2.2679
Harris, L. B., and Taylor, A. H. (2020). Rain-shadow forest margins resilient to low-severity fire and climate change but not high-severity fire. Ecosphere 11:e03258. doi: 10.1002/ecs2.3258
Hartig, F. (2018). DHARMa: residual diagnostics for hierarchical (multi-level/mixed) regression models. R package version 0.20. Available online at: https://cran.r-project.org/web/packages/DHARMa/index.html (Accessed July 28, 2018).
Hijmans, R. J., Etten, J.van, Sumner, M., Cheng, J., Baston, D., Bevan, A., et al. (2020). Raster: geographic data analysis and modeling. R package version 3. Available online at: https://CRAN.R-project.org/package=raster (Accessed February 9, 2021).
Horn, K. J., Thomas, R. Q., Clark, C. M., Pardo, L. H., Fenn, M. E., Lawrence, G. B., et al. (2018). Growth and survival relationships of 71 tree species with nitrogen and sulfur deposition across the conterminous U.S. PLoS One 13:e0205296. doi: 10.1371/journal.pone.0205296
Ibáñez, I., Zak, D. R., Burton, A. J., and Pregitzer, K. S. (2016). Chronic nitrogen deposition alters tree allometric relationships: implications for biomass production and carbon storage. Ecol. Appl. 26, 913–925. doi: 10.1890/15-0883
Ibáñez, I., Zak, D. R., Burton, A. J., and Pregitzer, K. S. (2018). Anthropogenic nitrogen deposition ameliorates the decline in tree growth caused by a drier climate. Ecology 99, 411–420. doi: 10.1002/ecy.2095
Jack, S. B., and Long, J. N. (1996). Linkages between silviculture and ecology: an analysis of density management diagrams. For. Ecol. Manag. 86, 205–220. doi: 10.1016/S0378-1127(96)03770-X
James, G., Witten, D., Hastie, T., and Tibshirani, R. (2013). An introduction to statistical learning: With applications in R. New York: Springer-Verlag.
Kerhoulas, L. P., Umstattd, N., and Koch, G. W. (2023). Seasonal water source patterns in a northern Arizona pine forest. Front. For. Glob. Change 6:1150413. doi: 10.3389/ffgc.2023.1150413
Kimsey, M. J., Shaw, T. M., and Coleman, M. D. (2019). Site sensitive maximum stand density index models for mixed conifer stands across the inland northwest, USA. For. Ecol. Manag. 433, 396–404. doi: 10.1016/j.foreco.2018.11.013
Koenker, R. (2004). Quantile regression for longitudinal data. J. Multivar. Anal. 91, 74–89. doi: 10.1016/j.jmva.2004.05.006
Koenker, R., and Bassett, G. (1978). Regression Quantiles. Econometrica 46, 33–50. doi: 10.2307/1913643
Koenker, R., Portnoy, S., Ng, P. T., Zeileis, A., Grosjean, P., and Ripley, B. D. (2018). Package ‘quantreg.’ Reference manual available at R-CRAN. Available online at: https://cran.rproject.org/web/packages/quantreg/quantreg.pdf (Accessed March 5, 2024).
Koontz, M. J., Latimer, A. M., Mortenson, L. A., Fettig, C. J., and North, M. P. (2021). Cross-scale interaction of host tree size and climatic water deficit governs bark beetle-induced tree mortality. Nat. Commun. 12:129. doi: 10.1038/s41467-020-20455-y
Kubiske, M. E., Woodall, C. W., and Kern, C. C. (2019). Increasing atmospheric CO2 concentration stand development in trembling Aspen forests: are outdated density management guidelines in need of revision for all species? J. For. 117, 38–45. doi: 10.1093/jofore/fvy058
Kweon, D., and Comeau, P. G. (2021). Climate, site conditions, and stand characteristics influence maximum size-density relationships in Korean red pine (Pinus densiflora) and Mongolian oak (Quercus mongolica) stands, South Korea. For. Ecol. Manag. 502:119727. doi: 10.1016/j.foreco.2021.119727
Larson, A. J., Lutz, J. A., Donato, D. C., Freund, J. A., Swanson, M. E., HilleRisLambers, J., et al. (2015). Spatial aspects of tree mortality strongly differ between young and old-growth forests. Ecology 96, 2855–2861. doi: 10.1890/15-0628.1
Latty, E. F., Canham, C. D., and Marks, P. L. (2003). Beech bark disease in northern hardwood forests: the importance of nitrogen dynamics and forest history for disease severity. Can. J. For. Res. 33, 257–268. doi: 10.1139/x02-183
Long, J. N., Dean, T. J., and Roberts, S. D. (2004). Linkages between silviculture and ecology: examination of several important conceptual models. For. Ecol. Manag. 200, 249–261. doi: 10.1016/j.foreco.2004.07.005
Looney, C. E., D’Amato, A. W., and Jovan, S. (2021). Investigating linkages between the size-growth relationship and drought, nitrogen deposition, and structural complexity in western U.S Forests. Forest Ecol. Manag. 497:119494. doi: 10.1016/j.foreco.2021.119494
Lüdecke, D., Ben-Shachar, M. S., Patil, I., Waggoner, P., and Makowski, D. (2021). Performance: an R package for assessment, comparison and testing of statistical models. J. Open Source Softw. 6:139. doi: 10.21105/joss.03139
Maestre, F. T., Callaway, R. M., Valladares, F., and Lortie, C. J. (2009). Refining the stress-gradient hypothesis for competition and facilitation in plant communities. J. Ecol. 97, 199–205. doi: 10.1111/j.1365-2745.2008.01476.x
Magnusson, A., Skaug, H., Berg, C., Kristensen, M., van Bentham, K., Bolker, B., et al. (2018). glmmTMB: generalized linear mixed models using template model builder. R package version 0.2.2.0. Available online at: https://cran.r-project.org/web/packages/glmmTMB/index.html (Accessed March 5, 2024).
Marshall, L. A., Falk, D. A., and McDowell, N. G. (2019). Nitrogen can limit Overstory tree growth following extreme stand density increase in a ponderosa pine Forest. Tree Ring Res. 75, 49–60. doi: 10.3959/1536-1098-75.1.49
Miller, R. F., Chambers, J. C., Evers, L., Williams, C. J., Snyder, K. A., Roundy, B. A., et al. (2019). The ecology, history, ecohydrology, and management of pinyon and juniper woodlands in the Great Basin and northern Colorado plateau of the western United States. Fort Collins, CO: U.S. Department of Agriculture, Forest Service, Rocky Mountain Research Station.
Mueller, R. C., Scudder, C. M., Porter, M. E., T. T. IiiGehring, C. A., and Whitham, T. G. (2005). Differential tree mortality in response to severe drought: evidence for long-term vegetation shifts. J. Ecol. 93, 1085–1093. doi: 10.1111/j.1365-2745.2005.01042.x
Muller, J. J., Nagel, L. M., and Palik, B. J. (2019). Forest adaptation strategies aimed at climate change: assessing the performance of future climate-adapted tree species in a northern Minnesota pine ecosystem. For. Ecol. Manag. 451:117539. doi: 10.1016/j.foreco.2019.117539
Nakagawa, S., and Schielzeth, H. (2013). A general and simple method for obtaining R2 from generalized linear mixed-effects models. Methods Ecol. Evol. 4, 133–142. doi: 10.1111/j.2041-210x.2012.00261.x
Negrón, J. F., and Wilson, J. L. (2003). Attributes associated with probability of infestation by the Piñon Ips, Ips confusus (coleoptera: Scolytidae), in Piñon pine, Pinus edulis. Western North Am. Natural. 63, 440–451.
Oliver, C. D., and Larson, B. C. (1996). Forest stand dynamics. New York, NY: John Wiley & Sons, Inc.
Pelz, K. A., Hayward, G., Gray, A. N., Berryman, E. M., Woodall, C. W., Nathanson, A., et al. (2023). Quantifying old-growth forest of United States Forest Service public lands. For. Ecol. Manag. 549:121437. doi: 10.1016/j.foreco.2023.121437
Powers, R. F. (1999). On the sustainable productivity of planted forests. New For. 17, 263–306. doi: 10.1023/A:1006555219130
Pretzsch, H. (2009). “Stand density and growth” in Forest dynamics, growth and yield: From measurement to model. ed. H. Pretzsch (Berlin, Heidelberg: Springer), 411–412.
Pretzsch, H., and Biber, P. (2022). Fertilization modifies forest stand growth but not stand density: consequences for modelling stand dynamics in a changing climate. Forestry 95, 187–200. doi: 10.1093/forestry/cpab036
Pretzsch, H., and Dieler, J. (2010). The dependency of the size-growth relationship of Norway spruce (Picea abies [L.] karst.) and European beech (Fagus sylvatica [L.]) in forest stands on long-term site conditions, drought events, and ozone stress. Trees 25, 355–369. doi: 10.1007/s00468-010-0510-1
Pretzsch, H., Hilmers, T., and del Río, M. (2024). The effect of structural diversity on the self-thinning line, yield level, and density-growth relationship in even-aged stands of Norway spruce. For. Ecol. Manag. 556:121736. doi: 10.1016/j.foreco.2024.121736
Puhlick, J. J., Laughlin, D. C., and Moore, M. M. (2012). Factors influencing ponderosa pine regeneration in the southwestern USA. For. Ecol. Manag. 264, 10–19. doi: 10.1016/j.foreco.2011.10.002
R Core Team (2022). R: A language and environment for statistical computing. Vienna, Austria: R Foundation for Statistical Computing.
Ray, D., Seymour, R., Fraver, S., Berrill, J.-P., Kenefic, L., Rogers, N., et al. (2023). Relative density as a standardizing metric for the development of size-density management charts. J. For. 121, 443–456. doi: 10.1093/jofore/fvad029
Reineke, L. H. (1933). Perfecting a stand-density index for even-aged forests. J. Agric. Res. 46, 627–638.
Richards, S. A. (2008). Dealing with overdispersed count data in applied ecology. J. Appl. Ecol. 45, 218–227. doi: 10.1111/j.1365-2664.2007.01377.x
Roach, W. J., Simard, S. W., Defrenne, C. E., Pickles, B. J., Lavkulich, L. M., and Ryan, T. L. (2021). Tree diversity, site index, and carbon storage decrease with aridity in Douglas-fir forests in Western Canada. Front. For. Glob. Change 4:682076. doi: 10.3389/ffgc.2021.682076
Schuler, T. M., and Smith, F. W. (1988). Effect of species mix on size/density and leaf-area relations in southwest pinyon/juniper woodlands. For. Ecol. Manag. 25, 211–220. doi: 10.1016/0378-1127(88)90088-6
Schwede, D. B., and Lear, G. G. (2014). A novel hybrid approach for estimating total deposition in the United States. Atmos. Environ. 92, 207–220. doi: 10.1016/j.atmosenv.2014.04.008
Shaw, J. D. (2000). Application of stand density index to irregularly structured stands. West. J. Appl. For. 15, 40–42. doi: 10.1093/wjaf/15.1.40
Shaw, J. D. (2006). Reineke’s stand density index: where are we and where do we go from here? In: proceedings: Society of American Foresters 2005 National Convention; October 19-23, 2005, Fort Worth, Texas, [CD-ROM]. Bethesda, MD: Society of American Foresters: [1]-13. Available online at: https://research.fs.usda.gov/treesearch/25003 (Accessed July 12, 2024).
Shaw, J. D., and Long, J. N. (2007). A density management diagram for longleaf pine stands with application to red-cockaded woodpecker habitat. South. J. Appl. For. 31, 28–38. doi: 10.1093/sjaf/31.1.28
Stein, S. J., and Kimberling, D. N. (2003). Germination, establishment, and mortality of naturally seeded southwestern ponderosa pine. West. J. Appl. For. 18, 109–114. doi: 10.1093/wjaf/18.2.109
Stevens-Rumann, C. S., and Morgan, P. (2019). Tree regeneration following wildfires in the western US: a review. Fire Ecol. 15:15. doi: 10.1186/s42408-019-0032-1
Sugiura, N. (1978). Further analysts of the data by Akaike’s information criterion and the finite corrections. Commun. Stat. Theory Methods 7, 13–26. doi: 10.1080/03610927808827599
Takemoto, B. K., Bytnerowicz, A., and Fenn, M. E. (2001). Current and future effects of ozone and atmospheric nitrogen deposition on California’s mixed conifer forests. For. Ecol. Manag. 144, 159–173. doi: 10.1016/S0378-1127(00)00368-6
Tian, D., Bi, H., Jin, X., and Li, F. (2021). Stochastic frontiers or regression quantiles for estimating the self-thinning surface in higher dimensions? J. For. Res. 32, 1515–1533. doi: 10.1007/s11676-020-01196-6
Vacchiano, G., Derose, R. J., Shaw, J. D., Svoboda, M., and Motta, R. (2013). A density management diagram for Norway spruce in the temperate European montane region. Eur. J. Forest Res. 132, 535–549. doi: 10.1007/s10342-013-0694-1
Vandendriesche, D. (2010). An empirical approach for estimating natural regeneration for the forest vegetation simulator., in Integrated management of carbon sequestration and biomass utilization opportunities in a changing climate: Proceedings of the 2009 National Silviculture Workshop, (Citeseer), 307–320.
Walker, J. T., Beachley, G., Amos, H. M., Baron, J. S., Bash, J., Baumgardner, R., et al. (2019). Toward the improvement of total nitrogen deposition budgets in the United States. Sci. Total Environ. 691, 1328–1352. doi: 10.1016/j.scitotenv.2019.07.058
Wang, T., Hamann, A., Spittlehouse, D., and Carroll, C. (2016). Locally downscaled and spatially customizable climate data for historical and future periods for North America. PLoS One 11:e0156720. doi: 10.1371/journal.pone.0156720
Weiskittel, A. R., Crookston, N. L., and Radtke, P. J. (2011). Linking climate, gross primary productivity, and site index across forests of the western United States. Can. J. For. Res. 41, 1710–1721. doi: 10.1139/x11-086
Weiskittel, A. R., and Kuehne, C. (2019). Evaluating and modeling variation in site-level maximum carrying capacity of mixed-species forest stands in the Acadian region of northeastern North America. For. Chron. 95, 171–182. doi: 10.5558/tfc2019-026
Woodall, C. W., Kamoske, A. G., Hayward, G. D., Schuler, T. M., Hiemstra, C. A., Palmer, M., et al. (2023). Classifying mature federal forests in the United States: the forest inventory growth stage system. For. Ecol. Manag. 546:121361. doi: 10.1016/j.foreco.2023.121361
Yang, S.-I., and Brandeis, T. J. (2022). Estimating maximum stand density for mixed-hardwood forests among various physiographic zones in the eastern US. For. Ecol. Manag. 521:120420. doi: 10.1016/j.foreco.2022.120420
Yoda, K. (1963). Self-thinning in overcrowded pure stands under cultivated and natural conditions (intraspecific competition among higher plants XI.). J. Biol. Osaka City Univ. 14, 107–129.
York, R. A., Noble, H., Quinn-Davidson, L. N., and Battles, J. J. (2021). Pyrosilviculture: combining prescribed fire with gap-based silviculture in mixed-conifer forests of the Sierra Nevada. Can. J. For. Res. 51, 781–791. doi: 10.1139/cjfr-2020-0337
Zeide, B. (1983). The mean diameter for stand density index. Can. J. For. Res. 13, 1023–1024. doi: 10.1139/x83-135
Zeide, B. (2010). Comparison of self-thinning models: an exercise in reasoning. Trees 24, 1117–1126. doi: 10.1007/s00468-010-0484-z
Zhang, W.-P., Jia, X., and Wang, G.-X. (2017). Facilitation among plants can accelerate density-dependent mortality and steepen self-thinning lines in stressful environments. Oikos 126, 1197–1207. doi: 10.1111/oik.03983
Zhang, J., Oliver, W., Graham, R., and Moser, W. K. (2020). The level-of-growing-stock (LOGS) study on thinning ponderosa pine forests in the US west: a long-term collaborative experiment in density management. J. For. Sci. 66, 393–406. doi: 10.17221/72/2020-JFS
Zhang, J., Ritchie, M. W., Maguire, D. A., and Oliver, W. W. (2013). Thinning ponderosa pine (Pinus ponderosa) stands reduces mortality while maintaining stand productivity. Can. J. For. Res. 43, 311–320. doi: 10.1139/cjfr-2012-0411
Keywords: self-thinning boundary line, stand density index, mature and old-growth forest, mortality and recruitment, nitrogen deposition, quantile regression, ponderosa pine, Douglas-fir
Citation: Looney CE and Shaw JD (2025) Climate and nitrogen deposition constrain the maximum size-density boundary for mature and old-growth stands. Front. For. Glob. Change. 8:1566459. doi: 10.3389/ffgc.2025.1566459
Edited by:
Romà Ogaya, Ecological and Forestry Applications Research Center (CREAF), SpainReviewed by:
Emmerson Chivhenge, University of Maine, United StatesCopyright © 2025 Looney and Shaw. This is an open-access article distributed under the terms of the Creative Commons Attribution License (CC BY). The use, distribution or reproduction in other forums is permitted, provided the original author(s) and the copyright owner(s) are credited and that the original publication in this journal is cited, in accordance with accepted academic practice. No use, distribution or reproduction is permitted which does not comply with these terms.
*Correspondence: Christopher E. Looney, Q2hyaXN0b3BoZXIubG9vbmV5QHVzZGEuZ292
Disclaimer: All claims expressed in this article are solely those of the authors and do not necessarily represent those of their affiliated organizations, or those of the publisher, the editors and the reviewers. Any product that may be evaluated in this article or claim that may be made by its manufacturer is not guaranteed or endorsed by the publisher.
Research integrity at Frontiers
Learn more about the work of our research integrity team to safeguard the quality of each article we publish.