
94% of researchers rate our articles as excellent or good
Learn more about the work of our research integrity team to safeguard the quality of each article we publish.
Find out more
ORIGINAL RESEARCH article
Front. For. Glob. Change , 27 February 2025
Sec. Pests, Pathogens and Invasions
Volume 8 - 2025 | https://doi.org/10.3389/ffgc.2025.1532954
 Aurora Bozzini1*
 Langning Huo2
 Stefano Brugnaro3
 Giuseppe Morgante1Henrik Jan Persson2
 Valerio Finozzi4
 Andrea Battisti1
 Massimo Faccoli1
Introduction: European forests face increasing threats from climate change-induced stressors, which create favorable conditions for bark beetle outbreaks. The most critical spruce forest pest in Europe is the European Spruce Bark Beetle (Ips typographus L.). Effective forest management of this beetles’ outbreaks necessitates timely detection of recently attacked spruce trees, which is challenging given the difficulty in identifying symptoms on infested tree crowns, especially over large areas. This study assessed the detectability of infested trees over large spruce dominated areas (20–60 ha) using high-resolution drone multispectral imagery.
Methods: A multispectral sensor mounted on an Unmanned Aerial Vehicle (UAV) was used to capture images of the investigated spruce stands weekly during June 2023. These were used to compute the reflectance of all single trees, derive vegetation indices, and then compare these between bark beetle infested trees and healthy ones.
Results: The results showed that it was possible to separate the spectral features of recently infested trees from the healthy trees during the final developmental stage of the first beetles’ generation, despite the limitations due to difficulties in image processing over large areas. The best performing vegetation indices included NDRE (Normalized Difference Red Edge index) and GNDVI (Green Normalized Difference Vegetation Index), which allowed the earlier separation between infested and healthy trees.
Discussion: The study shows that the use of UAV high-resolution imagery can present some limitations when performing early detection over larger areas. The integration of sensors focused on narrower spectral windows around the Red-Edge and Green bands and other remote sensing methods (e.g., satellite imagery) could help overcome these limitations and improve early-detection over large forest areas. The proposed early-detection approach will increase the understanding of which factors to consider when performing early detection with remote sensing techniques. In particular, it will add insights when upscaling to larger spatial scales, providing useful guidance for the management of areas suffering pest outbreaks.
The European spruce bark beetle, Ips typographus (L.; Coleoptera: Curculionidae, Scolytinae), is the most important pest affecting European forests, attacking and killing Norway spruce (Picea abies Karsten). Outbreaks of I. typographus in European forests are triggered by extreme weather events, such as high temperatures, droughts and violent storms (Wichmann and Ravn, 2001; Candotti et al., 2022; Nardi et al., 2022a; Netherer et al., 2022), which in the last decades have been increasing in frequency and intensity due to global climate change (Fischer and Knutti, 2015). In the Southern Alps, a violent windstorm that occurred at the end of 2018 (“Vaia” storm) triggered an extensive bark beetle outbreak (Nardi et al., 2022b; Dalponte et al., 2023). During such events, the beetles first colonize weakened and damaged trees, and then spread to healthy ones when their number overwhelms the trees’ defenses (Wermelinger, 2004; Faccoli, 2009; Mezei et al., 2014).
In recent times, many efforts have been made to perform timely early detection of trees susceptible to bark beetles infestations or recently infested, which is a crucial action for effective control of outbreak expansion. In fact, symptoms are mainly visible at the latest stage of infestation, when the hosts are usually already abandoned by the beetles and it is too late for management. Instead, in the early stage of infestation the beetles are undergoing development under the bark, and symptoms are hardly visible (Luo et al., 2023). Detection of trees at the early stage of infestation allows to locate trees that need to be removed in order to remove the beetles before they swarm and find new hosts, thereby limiting further damage. Yet, these techniques may be less sensitive to the earliest and most subtle symptoms of infestation, particularly when the images have coarser spatial resolution. Field work and “proximal sensing” methods (Majdák et al., 2021; Bárta et al., 2022; Nardi et al., 2023; Vošvrdová et al., 2023; Stříbrská et al., 2024) enable highly precise detection of trees infested by bark beetles. However, they are limited in their ability to comprehensively cover large areas quickly and at low cost. In contrast, “remote sensing” approaches (Abdullah et al., 2018a; Bárta et al., 2021; Hellwig et al., 2021; Minařík et al., 2021; Huo et al., 2022; Kautz et al., 2024; Klouček et al., 2024; Persson et al., 2024; Trubin et al., 2024) allow for the monitoring of vast areas. Yet, these techniques may be less sensitive to the earliest and most subtle symptoms of infestation, particularly when the images have coarser spatial resolution. The effective performance of this task on large forest areas remains a challenge, and investigating factors that can affect infestation symptoms development and can enable healthy trees to be separated from trees at the early-stage of infestation is extremely important for effective management of epidemic populations.
Various works focused on the possibility to distinguish healthy trees from recently infested trees using remote sensing methods (Abdullah et al., 2018b; Bárta et al., 2021; Huo et al., 2021; Marvasti-Zadeh et al., 2022; Bozzini et al., 2024; Kautz et al., 2024; Klouček et al., 2024). Since bark beetle tree colonization causes water and nitrogen deficiency resulting in chlorophyll degradation, tree crowns’ reflectance changes in certain bands of the light spectrum that are affected by such physiological modifications (such as red and green in the visible spectrum, but also red-edge and near infrared, i.e., NIR) can provide information on tree stress conditions due to bark beetle infestation (Abdullah et al., 2019; Andresini et al., 2024; Kautz et al., 2024). Differences between the spectral profiles of healthy and recently infested tree crowns can be assessed at different scales, from the spectral analysis of needles in the laboratory (Abdullah et al., 2018b; Abdullah et al., 2019), that can highlight differences even at very early infestation stages, to remote sensing acquisitions that can be less sensitive to subtle spectral changes but allow large forest areas to be covered (Marvasti-Zadeh et al., 2022; Kautz et al., 2024). Unmanned Aerial Vehicles (UAV, e.g., drones) are often used to acquire spectral information at a very high spatial resolution, to be able to isolate trees and observe the spectral changes at single tree level (Hellwig et al., 2021; Minařík et al., 2021; Bijou et al., 2023; Huo et al., 2023; Klouček et al., 2024). Normalized vegetation indices that combine multiple spectral bands that can be sensitive to vegetation stress, like Normalized Difference Vegetation Index (NDVI) or Normalized Difference Red-Edge Index (NDRE), are often used as indicators of stress due to bark beetle infestations (Abdullah et al., 2019; Abdullah et al., 2018a; Klouček et al., 2024; Trubin et al., 2024).
Many studies which employ UAV imagery focus on small areas and small groups of infested trees (Näsi et al., 2018; Klouček et al., 2019; Honkavaara et al., 2020; Hellwig et al., 2021; Minařík et al., 2021; Huo et al., 2023; Turkulainen et al., 2023; Bozzini et al., 2024). To our knowledge, the only work to attempt early detection at the single tree level using multispectral images acquired by drone on a large area was by Klouček et al. (2024), who operated on a spruce covered forest area of 250 ha in the Czech Republic. The authors focused on hotspots of infestation in the study area, finding a total of only 84 infested trees to use for the spectral analyses.
The objective of the present study was to demonstrate early detection of I. typographus infestations by analyzing vegetation indices derived from high-resolution UAV multispectral images (high detail, single tree level analysis) and assessing the performance on large forest areas. In fact, although focusing on areas ranging from 20.49 ha to 58.45 ha, in the present study thousands of trees (15,505 spruce trees, of which 1,637 infested) were analyzed, therefore adding information about the potential of using this remote sensing technique over large forest areas.
This work was conceptualized as a follow up to a previous study by Bozzini et al. (2024), in which drone flights were carried out to acquire a time-series of multispectral imagery in small experimental areas (average of 1.7 ha and a total of 742 spruce trees) with varying bark beetle population densities. The findings suggested that early detection would be more feasible in epidemic sites, where the beetle population density was high and infestation symptoms appeared more rapidly, compared to endemic sites, where the population density remained stable and infestations developed more slowly. This highlighted the potential of UAV images to perform early detection on limited areas. In the present study, observations were carried out on larger experimental areas highly susceptible to I. typographus infestations and in epidemic condition, to check if the results obtained in Bozzini et al. (2024) would be consistent in similar conditions when trying to upscale (transfer detection methods from small areas, i.e., higher detail, to larger areas). The difference in the early-detection performance between small and larger areas, if any, could provide valuable insights on the potential of UAV multispectral images for the management of bark beetles outbreaks over large forest areas.
The study was conducted in 2023 in three areas of the northern part of the Veneto region (North-Eastern Italy; Figure 1). The experimental areas were characterized by gentle slopes, vicinity to areas previously affected by I. typographus attacks, and located in areas at high risk of new I. typographus outbreaks. The study areas (area A—municipality of Rocca Pietore, 46.4250°N 11.9135°E; area M—municipality of Enego, 45.9390°N 11.6080°E; area S—municipality of Santo Stefano di Cadore, 46.6160°N 12.6410°E) are characterized by alpine and pre-alpine ecoregions (Blasi et al., 2014). All the study areas showed epidemic populations of I. typographus [more than 10,000 captures per trap per year, according to Faccoli and Stergulc (2006)], especially in localities M and S where the population abundance in 2022 was about twice that of area A according to the trap statistics (Supplementary Table 1). In these regions of the South-Eastern Alps, I. typographus populations are generally bivoltine (Baier et al., 2007; Faccoli and Bernardinelli, 2011).
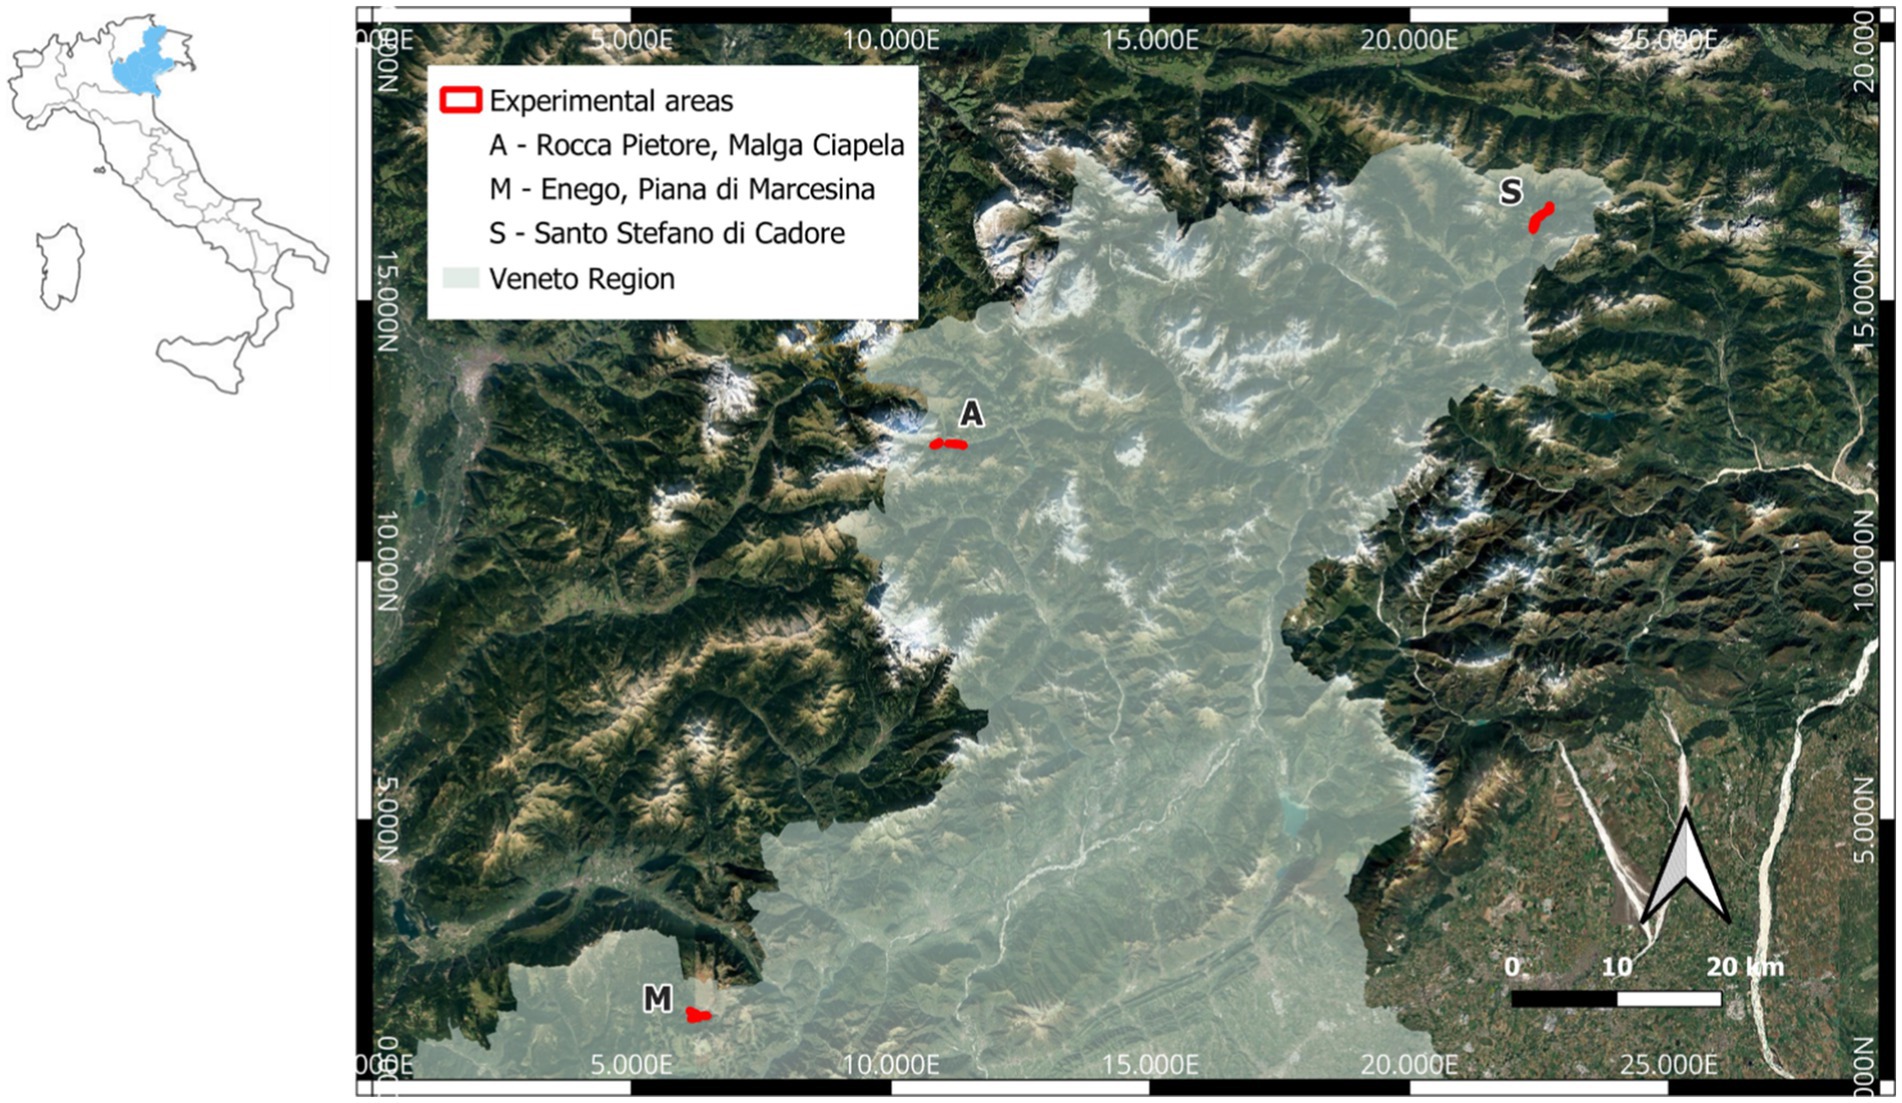
Figure 1. Location of the study areas in the three localities in the northern part of the Veneto region, NE Italy.
Six experimental sites (1–6) were established—two per study area (Supplementary Figure 1). The topographical features of each study area and experimental site are listed in Table 1. The stands consisted of young timber (31–40 cm diameter) and medium timber (41–50 cm) trees. Picea abies was the dominant species in the stands, but there were also Abies alba (Miller), Fagus sylvatica (L.), especially in sites 3 and 4, and Larix decidua (Miller), especially in sites 1 and 2.
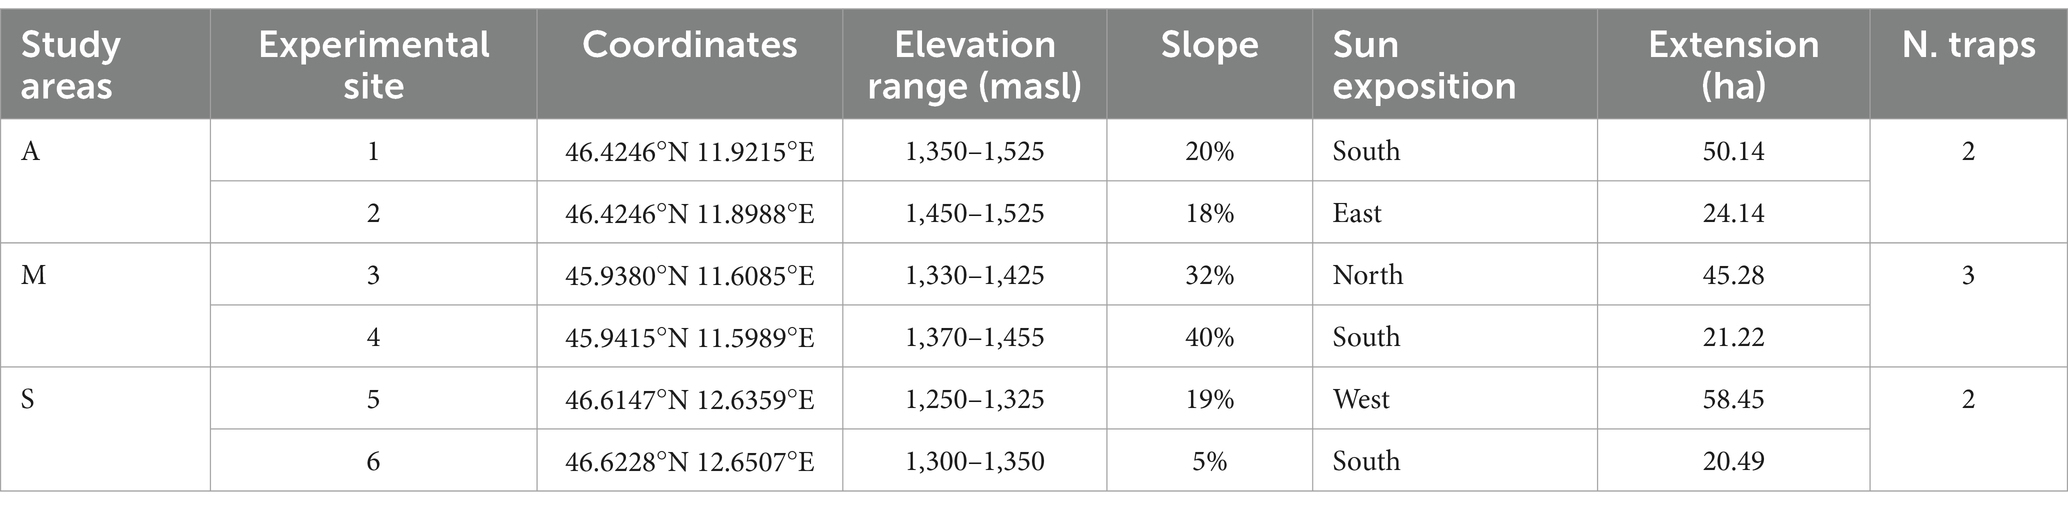
Table 1. Coordinates and topographical features of the study areas and experimental sites.
Bark beetle capture data were gathered from pheromone traps close to the experimental sites (deployed by the phytosanitary service of the Veneto Region) to retrieve information about beetles voltinism and their development. Trap captures can show swarming times, but also provide information about beetles developmental stage when checking the timing between swarming events. Two traps were located in area A (BL-15 and BL-16, average distance of 4.6 km from the experimental sites 1 and 2), two traps in area S (BL-32 and BL-33, average distance of 1.3 km from the experimental sites 5 and 6), three traps in area M (VI-02, VI-03 and VI-05, average distance of 5.1 km from the experimental sites 3 and 4). The positions of the pheromone traps relative to the experimental sites are shown in Supplementary Figure 2. The captures are considered from April to July 2023. Meteorological data (temperature and precipitation) for both years were retrieved to check possible effects on symptoms emergence and detectability and to gain information about bark beetle infestation progress. Different temperature and precipitation levels than the year before (year of study of Bozzini et al., 2024) could affect early-detection performance. In fact, higher temperatures and/or lower precipitation rates could anticipate bark beetle swarmings and infestation symptoms in the hosts, or vice-versa. The meteorological data (temperature and precipitation) for 2023 were provided by three meteorological stations of the local agency for environmental protection (ARPAV).1 The stations (AG-11, AS-248, CO-61) were located within 3 km from the experimental sites, as shown in Supplementary Figure 1. Temperature data referred to the average air temperature (°C) at 2 m above ground level (AGL), while precipitation data referred to the total daily rainfall (mm) and number of rainy days. The same ARPAV meteorological stations were used to retrieve temperature and precipitations related to the previous year (2022), to compare the meteorological conditions of the experimental sites in the 2 years.
The drone flights were performed with the same drone used in a previous study by Bozzini et al. (2024), a Phantom 4 RTK MS DJI equipped with an RGB camera, and a multispectral sensor with a filter for five separate spectral bands (center wavelength ± bandwidth /2): Blue (B): 450 nm ± 16 nm, Green (G): 560 nm ± 16 nm, Red (R): 650 nm ± 16 nm, Red-Edge (RE): 730 nm ± 16 nm, and Near Infrared (NIR): 840 nm ± 26 nm. The drone was used with an RTK (Real-Time Kinematic) module, which operates automatic georeferencing corrections when connected to the local GNSS network through the internet. The images can therefore be collected with a spatial accuracy of between 2.5 and 4 cm horizontally. The height of the drone AGL was set at 100 m, while the lateral overlap (percentage of image overlapping sideways to the flight direction) and longitudinal overlap (percentage of image overlapping along the flight direction) were set at 85 and 82%, respectively. An automatic radiometric correction through a white balancing function was performed at the beginning of every flight. The flights were carried out over every experimental site on a weekly basis, when weather conditions allowed flying. The survey schedule is described in Supplementary Table 2. Bozzini et al. (2024) suggested that the May–August period was critical for detecting the first differences in spectral signals between infested and healthy trees. We chose to shorten our study period from the second week of June to the second week of July 2023 and to increase the frequency of observations from bi-weekly to weekly. Some of the surveys were conducted more than a week after the previous survey because of adverse weather conditions. The third survey in area A (sites 1 and 2) is missing for the same reason.
The flights were carried out at the same time (from 10:00 am to 12 am) for the experimental sites to minimize the light differences. This is the reason why not all the surveys could be conducted in all the sites on the same date, because of the distance between different localities. One image was also acquired in the spring and autumn respectively, for each experimental site, to gain information about the presence of infested trees before and after the study period. In study area A, the autumn acquisition was not possible due to adverse conditions, so PlanetScope imagery (spatial resolution 3 m) was used to locate patches of dead trees after the study period. The images were retrieved from the Planet Explorer platform (Planet Labs PBC)2 and covered area A entirely (sites 1 and 2). Specifically, four cloud free images were downloaded, selecting PlanetScope Scenes (Super Dove (PSB.SD) instrument) between 02/09/2023 and 13/10/2023. Similarly to Bozzini et al. (2024), the single images collected by the drone were processed with the software Agisoft Metashape [Agisoft Metashape Professional 1.7.1 (RRID: SCR_018119), Agisoft LLC] to generate orthomosaics, i.e., geometrically corrected composite images containing georeferencing information, for each multispectral band and for the RGB images.
Spectral information related to the entire crown of individual trees was considered, following methods used in similar studies with drone-acquired images (Natesan et al., 2020; Huo et al., 2023). The individual tree segmentation was conducted using the reflectance from the green band. The local maxima in the images were detected and used for a marker controlled watershed segmentation using the SegmentTrees tool in the Lidar Toolbox in MATLAB R2024a [MathWorks, Inc., 2021 (RRID:SCR_001622)]. Then the segments were classified into:
• A. objects other than trees, e.g., ground and rocks, determined according to a Digital Surface model (DSM) generated from the drone images.
• B. dead trees and deciduous trees, determined by the Green Leaf Index (GLI, Eq. 1) [Eq. 1 (2*G-R-B) / (2*G+R+B) where G, R and B are the green, red and blue bands respectively] value smaller than a threshold in the images from April (leaf-off season).
• C. healthy coniferous trees, including spruce, larch, and a small amount of silver fir occurring in the study sites, determined by the GLI value and height values from DSM.
Then we matched the segments from April and September. Segments classified as healthy coniferous trees (class A) in April and dead trees (class B) in September were assigned as infested trees. Healthy spruce trees were manually selected from the segments classified as healthy (class A) in both April and September.
To exclude canopy gaps and ground from the tree crown segments (class C), we considered only pixels > Thgreen reflectance in the green band as tree crowns, masking out the rest (Thgreen = 0.14). This segmentation method with these parameters applied in a previous study showed 86–98% detection rates (Huo et al., 2023). Undersegmentation and oversegmentation were manually corrected for spruces. Only segments corresponding to spruce trees were kept, manually excluding polygons belonging to other tree species. An example of the segmentation result can be seen in Figure 2. The segments were exported as polygons in shapefile format, and the final product consisted of polygons corresponding to the individual tree crowns. Every polygon was assigned an identification number (tree identity).
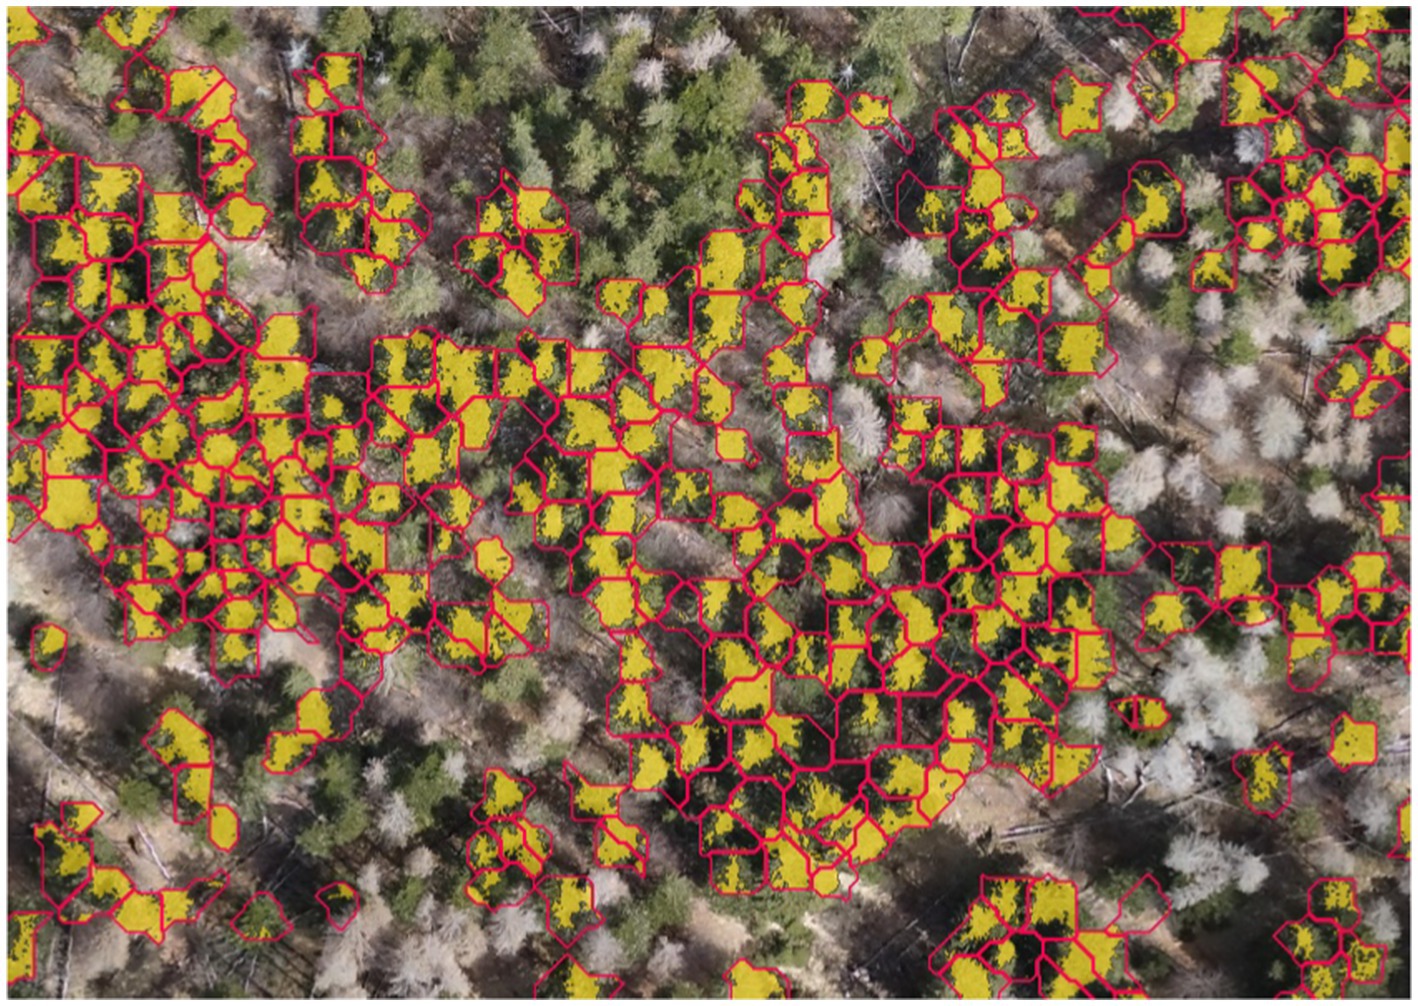
Figure 2. A drone image from one experimental site (4). The red-bordered polygons correspond to the segments from the marker controlled watershed segmentation. The yellow polygons correspond to the pixels of the tree crowns, defined as pixels > Thgreen reflectance in the green band (Thgreen = 0.14). Trees that were already dead before the study period, non-spruce trees and trees that were not consistently present in the images during the study period (e.g., cut trees) were not considered.
To assess the temporal spectral variation of the infested and healthy trees, a set of vegetation indices (VIs) were calculated for each orthomosaic, using the Raster Calculator function in QGIS. The tested VIs were considered the best performing ones in a previous study (Bozzini et al., 2024), and are listed in Table 2.
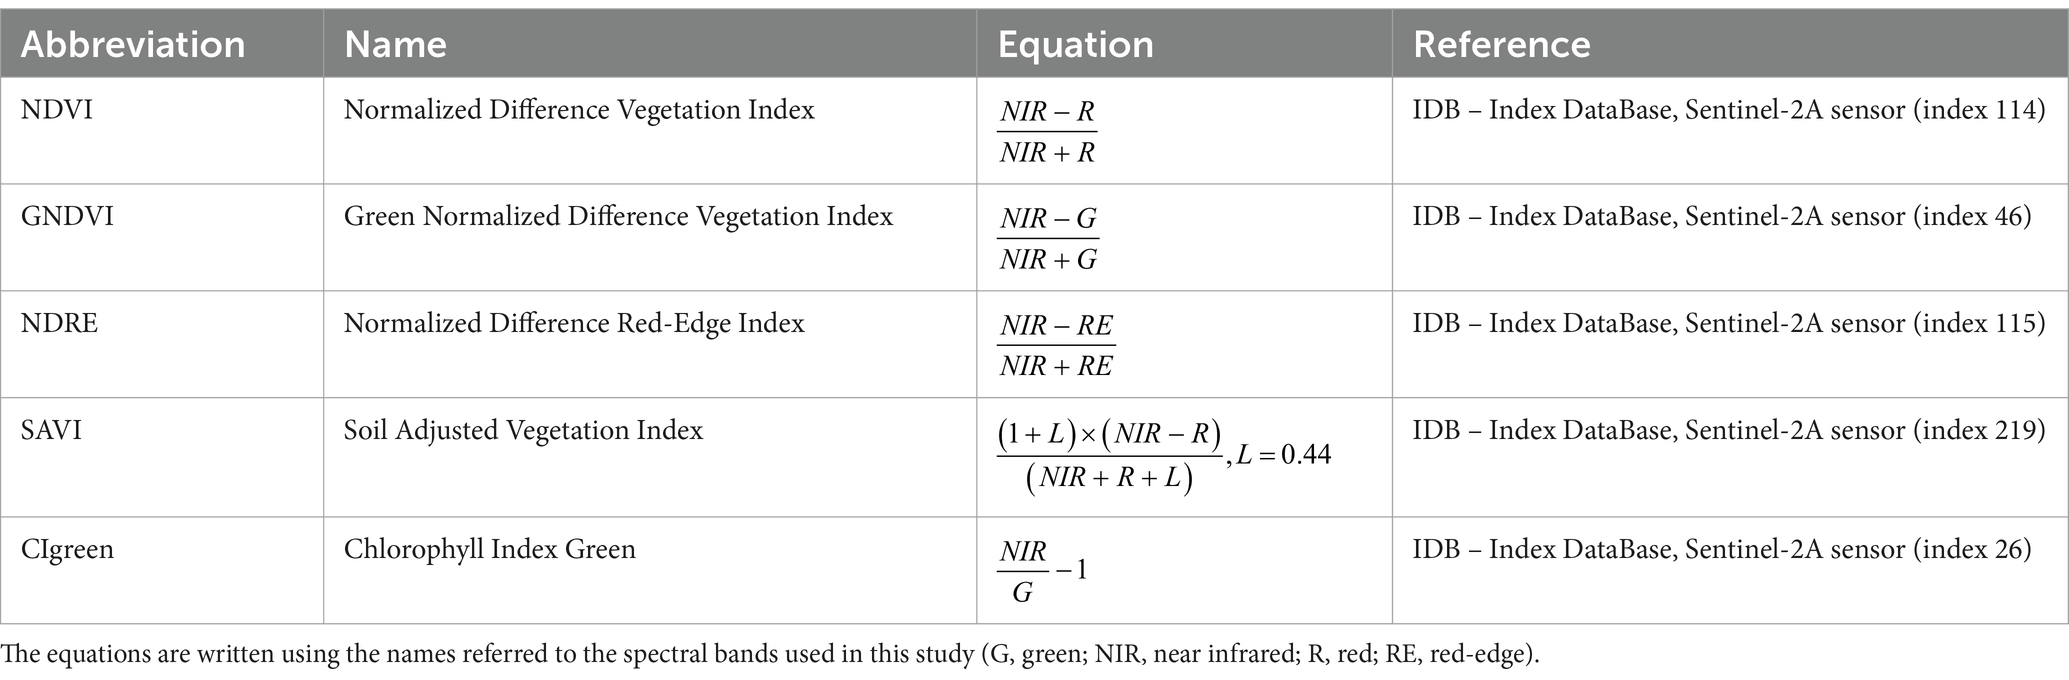
Table 2. List of vegetation indices (VIs).
The vegetation indices NDVI (Normalized Difference Vegetation Index), GNDVI (Green Normalized Difference Vegetation Index), NDRE (Normalized Difference Red-Edge Index), SAVI (Soil Adjust Vegetation Index), and CIgreen (Chlorophyll Index Green) are commonly used indices to assess vegetation health, photosynthetic activity and stress (Abdullah et al., 2019; Dalponte et al., 2023).
Generalized linear mixed models with a Gaussian distribution were built and validated to identify the date corresponding to a significant deviation in VIs of infested trees from healthy ones, as in the previous study by Bozzini et al. (2024). The use of a generalized linear mixed-effects model was chosen to allow for modeling of the random effects due to geographic areas and trees, which is crucial given the hierarchical nature of the data, belonging to specific geographic sites and specific tree crowns. The response variable was the value of the respective VI for each tree crown in the images, calculated as a mean of the values of all the pixels included in the single tree crowns. The categorical explanatory variables were tree class (infested vs. healthy), survey date and their interaction. Site identity (1–6) was included as a random factor that was nested in Area (that represents the study areas A, M and S, for some models), and tree identity was nested within site identity as an additional random factor, acknowledging that trees within the same site share common environmental conditions. For each generalized linear mixed model, pairwise comparisons of VIs values between infested and healthy trees for each survey date were run using Tukey correction of p-values. A contrast comparison matrix was used to visualize the differences between healthy and infested trees within each sampling date, to be consistent with Bozzini et al. (2024). The earliest detection date was defined as the first date in which values of infested trees significantly deviated from values of healthy trees (p-value <0.05) and continued to deviate consistently and significantly on the following detection dates. Significant deviation may be recorded at an early date, but may be followed by no deviation on the following detection dates. The values corresponding to the earliest detection date are given in Supplementary Table 3.
The analyses were conducted considering the six sites together and separately. For each linear mixed model, an effect size analysis (to measure the magnitude of an effect in statistics), through estimates of the differences between groups as defined by Nakagawa and Cuthill (2007) was carried out to compare healthy and infested trees at the earliest detection date. All the analyses were performed in R software version 4.2.2 (R Core Team, 2022). The models were fitted using the “lme4” package [Bates et al., 2021 (RRID:SCR_015654)], and checked for residual distribution and residual autocorrelation using the “DHARMa” package [Hartig, 2022 (RRID:SCR_022136)]. Pairwise comparisons and effect size analyses were run using the “emmeans” package [Lenth, 2022 (RRID:SCR_018734)]. Visualization of the results was obtained using the Statistic and Machine Learning Toolbox in MATLAB R2024a.
Moreover, the detection rates of the infested trees (DR) by each VI on each survey date were computed for every experimental site and for all the sites combined (total dataset). Detection rates are represented as the percentage of infested trees detected with a certain index at a certain moment, defined as the VIs values of infested trees that fall outside the 5 and 95 percentiles of the healthy trees’ VIs values. The detection rates were computed using the Statistic and Machine Learning Toolbox in MATLAB R2024a.
The first bark beetle captures were registered during the first days of May, but the onset of infestation (YDinf) was registered as YDinf = 23/05/2023 for area A, YDinf = 25/05/2023 for area S and YDinf = 28/05/2023 for area M, corresponding to the first peaks of the swarming curves from the pheromone trap captures data (Supplementary Figure 3). The last peak, corresponding to emergence of the sister broods adults (EMsb) was registered as EMsb = 23/08/2023 for area A, EMsb = 25/08/2023 for area S and EMsb = 24/08/2023 for area M (Supplementary Figure 3). According to these data, the end of the first generation, the almost complete development of the sister broods and the onset and start of development of the second generation took place during the study period (13/06/2023 to 20/07/2023) in all the experimental areas.
The meteorological variables showed no substantial differences between the three areas during the study period (June–July of 2023), neither for the temperature (14.0°C ± 0.1°C) nor for rainfall (199 ± 19 mm and 16 ± 1 rainy days) as shown in Supplementary Figure 4. Instead, there were substantial differences in temperature between the period of June–July of 2022 and the study period of 2023 (Supplementary Table 4). Temperature was higher on average in the summer of 2022 (15.2 ± 0.1°C in 2022), while average cumulative rainfall was lower (130 ± 16 mm and 12 ± 0 rainy days) compared to 2023.
The segmentation process identified a total of 15,505 spruce trees, including 1,637 infested trees (as of the images retrieved in October) and 13,868 healthy trees. In total, 2,773 tree crowns were segmented for area A (14 infested and 1,536 healthy in site 1, 120 infested and 1,237 healthy in site 2), 4,708 for area M (331 infested and 3,280 healthy in site 3, 19 infested and 1,428 healthy in site 4), and 8,024 for area S (682 infested and 5,780 healthy in site 5, 471 infested and 2,244 healthy in site 6).
Among the tested VIs, NDRE gave the most consistent results. When considering the experimental areas combined (total dataset, Supplementary Figure 5) NDRE consistently separated the spectral profiles of infested and healthy trees from the first survey date (13/06/2023) to the end of the study period.
For the single experimental sites, it could separate infested from healthy trees as early as the second survey date (20/06/2023, Supplementary Table 3) at site 5, corresponding to maturation feeding of the first-generation filial beetles and preimaginal development of the sister broods. At the latest, NDRE effectively separated infested and healthy trees on the fifth survey date (20/07/2023, Supplementary Table 3) at site 1, corresponding to the final days of maturation feeding of the first-generation beetles and the end of preimaginal development of sister broods. In fact, in site 1 NDRE was the only VI indicating a significant interaction between the infested-healthy class and the time factor (survey dates) on the last survey date (p value <0.001), while in site 2 NDRE and GNDVI showed a significant result on the fourth survey date (05/07/2023, Supplementary Table 3). In these two sites in area A, an intermediate survey date between the second date (20/06/2023) and fourth date was missing. In sites 3 and 4 (area M) the interaction between the infested-healthy class and the time factor (survey dates) was not significant, but the NDRE values showed good separability between infested and healthy trees at all times, especially in site 4 (Figure 3). In site 5, where NDRE showed separation between infested and healthy trees early on the second survey date, CIgreen and GNDVI were the next best VIs showing a separation on the third and fourth dates, respectively (Supplementary Table 3). This was also the case in site 6, where NDRE showed separation later on the fourth survey date together with GNDVI and CIgreen. Apart from NDRE, the profiles of healthy and infested trees were not always consistent (i.e., values of the VIs systemically higher in healthy trees compared to infested trees, or at least similar). For this reason, whenever a significant divergence between infested and healthy trees was not maintained on all the following dates, it was not considered as early detection date. Significant but not consistent divergence between values of infested and healthy trees could be due to specific reflectance conditions during a certain survey date. SAVI and NDVI indices presented anomalies in the spectral profiles of infested and healthy trees in sites 2, 3, 5 and 6, especially on the first three dates where the healthy trees values appeared to be significantly lower than the infested trees (Supplementary Figure 6). In site 3, this was also the case for GNDVI. The spectral profile of healthy trees for each VIs is similar in all the experimental sites, with a slight increase in time. A few anomalies (different profiles, as shown in Supplementary Figure 6) can be spotted in sites 3 (CIgreen and GNDVI showed a pronounced increase at the latest survey date, compared to the other sites) and 4 (NDRE showed a pronounced increase at the latest survey date compared to the other sites, and NDVI showed a drop at the third date). In general, NDRE shows the narrowest range of variability compared to the other VIs, both for infested and healthy trees, while CIgreen shows the highest variability. Overall, sites 4 and 5 were the sites where the highest separation between infested and healthy trees could be obtained.
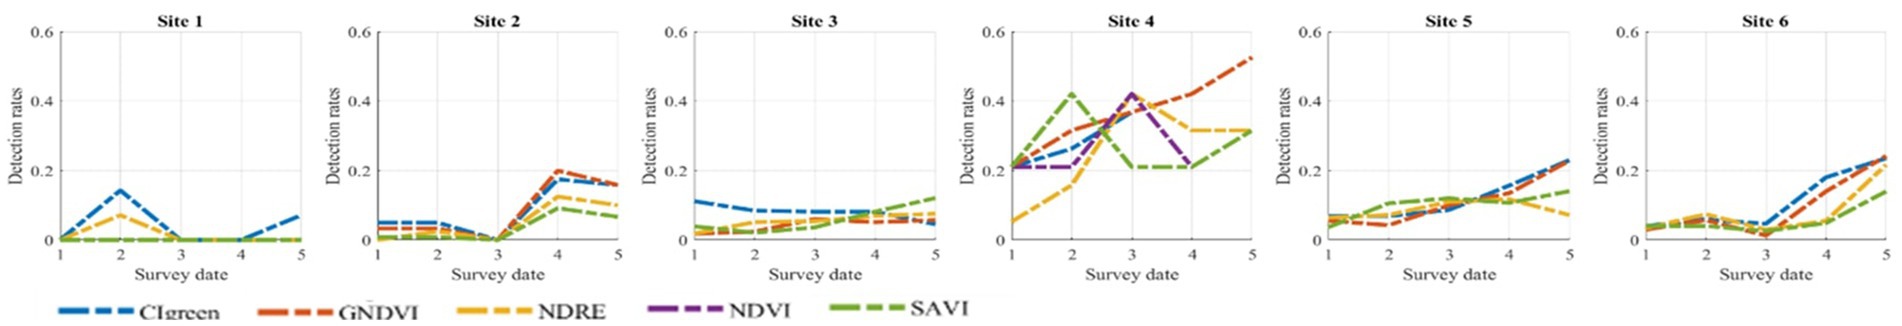
Figure 3. Detection rates curves at each survey date (1–5) for each experimental site.
As for DRs, the highest detection rates were obtained with the indices containing the green band (i.e., GNDVI and CIgreen), as shown in Figure 3. The higher DRs were obtained for site 4, where all VIs showed rates higher than 20% after the second survey date (maturation feeding of the first generation filial beetles and to preimaginal development of the sister broods), reaching a maximum of 53% for CIgreen and GNDVI (Supplementary Table 5). In site 3, DR were much lower, not reaching 13% even on the last survey date. The DRs were quite low also in sites 1 and 2, with the highest DR of 20% using GNDVI on the fourth survey date in site 2 and an average detection rate of 2% in site 1. The DR in sites 5 and 6 were similar, increasing in time toward the last survey date and reaching a maximum of 23% in site 5 and of 24% in site 6 with GNDVI and CIgreen. In the case of the total dataset (Supplementary Figure 5) NDRE was the VIs with highest DR on the last survey date (17%).
Generally, NDRE was the index most consistent in separating healthy from infested trees, followed by GNDVI, as previously found in studies using satellite imagery (Abdullah et al., 2018b; Abdullah et al., 2019; Candotti et al., 2022). As for drone-based studies, NDRE appeared promising in the work by Bozzini et al. (2024), and highlighted the possibility of distinguishing infested trees before complete development of the first filial generation adults. NDRE was the only index in this study to contain the Red-Edge band (730 nm ± 16 nm), which showed sensitivity in distinguishing infested trees (Abdullah et al., 2019; Hellwig et al., 2021; Bijou et al., 2023; Huo et al., 2023). Klouček et al. (2024) did not find NDRE to be the best performing index, but found the best separation results with NDVI. Nonetheless, the quadratic discriminant analysis (QDA) used in their study, applied on the individual VIs at the time of offspring development, returned an overall accuracy of 0.81 for NDRE, suggesting its relevance for early detection. NDRE is also the index that presented the smallest range of values for infested and healthy trees in the present study, which suggests a high precision when observing tree health status. This can also be an indication of NDRE being more stable in variable light conditions. A limitation of drone-use is that every acquisition can bring variability to the same scene, even if the flights are conducted in close proximity, so finding a parameter that is less sensitive to this variability is important. The Green band (560 nm ± 16 nm) can also be feasible to differentiate between the healthy and infested trees (Huo et al., 2024), as shown by the sensitivity of GNDVI to the healthy and infested classes. Klouček et al. (2024) found an overall accuracy of 0.81 for GNDVI, the same as NDRE, in their study, while Klouček et al. (2019) observed that GNDVI differed significantly between healthy and infested trees as early as in the first period of observation (beginning of the outbreak) for 21% using Relative Treatment Effect values (Mann–Whitney test). Huo et al. (2024) investigated the DR of early infestation symptoms using different VIs, proposing new indices that exploit the green shoulder region (wavelengths 490–560 nm) as highly sensitive to change due to bark beetles infestation. Together with GNDVI, CIgreen also contains the green band, but it is not a normalized index so it presented a high variability in the range of values in the present work. Despite NDRE being the most consistent index in separating infested from healthy trees, GNDVI and CIgreen presented higher DR values than NDRE. Focusing on the Green and Red-Edge bands, e.g., by using sensors sensitive to narrower windows around the Green and Red-Edge spectra, could be helpful to enhance detection results. Individual tree reflectance values may be affected by the presence of bigger tree crowns, i.e., bigger and/or higher trees. The presence of big trees, usually preferred by bark beetles (Sproull et al., 2015), among the mature spruce trees in the experimental sites could also have affected the spectral development in the infested trees. This could explain why the values of NDVI and SAVI indices were higher for infested trees than healthy trees on the first survey dates, shifting toward lower values for infested trees at the end of the study period, supporting the fact that the biggest trees (having higher VIs values) were preferred by the beetles. However, in this study there was no detailed information about the size of the infested trees in the areas that were covered by the flights, so this factor should be further investigated. Seasonal growth could also affect the spectral development of the trees, aiding the separation of healthy trees (that continue to grow) from infested trees (that stop growing). Nonetheless, this effect could add variability to the healthy trees spectral profile. Hovi et al. (2017) found that the NIR reflectance of current year needles increased, and that the NIR reflectance of previous year needles decreased from June to September in their study on spruce trees in Slovenia. The different spectral behaviors of current year and previous year needles were also observed by Lukeš et al. (2013). Moreover, the lower parts of the tree crown could be partially shaded (Hovi et al., 2017; Hellwig et al., 2021), masking the reflectance effects of bark beetles infestation symptoms in the needles.
The general lower and later separability between infested and healthy trees observed in this study with respect to the separability obtained by Bozzini et al. (2024) could depend on the different meteorological conditions during the years of study, since in 2022 it rained less and the temperature was higher compared to 2023. The higher water availability and lower average temperature of 2023 could have affected the symptoms development in the infested trees (Kautz et al., 2023), slowing the infestation signs down.
Overall, in the acquisition and image elaboration conditions of the present study (segmentation method of individual tree crowns over large areas), NDRE and GNDVI proved to be the most sensitive in detecting change between healthy and recently infested trees. The detection performance, however, differed in the experimental sites. Sites 1 and 2 did not present great separation between the vegetation indices values of healthy trees and infested trees during the study period. The smaller population abundance in these sites could have an impact on the speed of symptom development on the infested trees, that were also fewer with respect to the other sites (with 14 infested trees in site 1 and 120 in site 2, in contrast with 331, 682 and 471 in sites 3, 5 and 6 respectively). Also site 3 did not show great spectral separation between healthy and infested trees, presenting high variability in the ranges of VIs values for both conditions. This site was wide (45.28 ha) and contained several isolated trees, which could have been represented incorrectly during the image elaboration (i.e., confusion between pixels belonging to the tree crown and those belonging to the ground) and the following segmentation process. On the other hand, site 4 presented the greater separation between infested and healthy trees. This site was smaller than site 3 (21.22 ha) and was characterized by a mixed forest. For this reason, it went through a thorough control of the segmentation result to maintain all the trees that were considered useful to the spectral analysis, i.e., not previously damaged spruce trees. Even though there were fewer infested trees in site 3 compared to site 4 (19 versus 331), the analysis showed higher potential for separation between the two conditions in site 3. This site was also placed on a 40% south exposed slope, while site 4 was on a 32% north exposed slope. The aspect of the slopes may have affected the reflectance conditions in the two sites of area M. Site 5 was the second site, following site 4, presenting a more defined separation of the healthy-infested conditions, and similar results were obtained for site 6. In sites 5 and 6 smaller spruce trees were also present, which could have been included in the segmentation results within the healthy trees category and might have widened the variability of VIs values. Anyway, in these sites more spruce trees were present, and also the majority of infested trees were registered. This could have increased the spectral information on the infested class, improving separability. Site 5 was the site containing more trees (58.45 ha with 5,780 trees), showing the potential of separating infested and healthy trees even in very large areas using optical sensors at high spatial resolution.
Detection of early symptoms of bark beetle’s infestations is a critical operation for any effective control of an outbreak’s expansion. Remote sensing methods prove to have great potential to detect damage and map infestations over large areas using optical sensors. However, many challenges occur regarding the magnitude of the separability between healthy trees and infested trees early symptoms when trying to transfer detection methods from small to larger spatial scales.
The use of UAV high resolution imagery is promising when performing early detection over limited forest areas (Klouček et al., 2019; Honkavaara et al., 2020; Hellwig et al., 2021; Huo et al., 2023; Turkulainen et al., 2023; Bozzini et al., 2024). However, the present work highlighted some limitations of UAV imagery when applied over larger areas. In fact, the possibly different light conditions during the drone flights (limited time for acquisition within a day and variable conditions between different flights) and the lack of detailed information from the field may limit the full reliability of this tool. The segmentation method, if not correctly applied over a large areas, could bring further errors and variability into the spectral data. For instance, spruce was the dominant species in all sites, but silver fir trees were also present in our study areas. A detailed inventory of the species and size of the trees could increase the possibility of separating infested and healthy trees and should be considered even if hardly applicable on large scale. Sensors able to acquire information in the short-wave infrared band (SWIR, 1,300–2,500 nm) could also be employed to differentiate between different species, as was shown by Hovi et al. (2017) to enhance spectral differences between species in conifers.
Nonetheless, even despite these limitations, a separation between healthy and infested trees was possible during the maturation feeding of the first generation and preimaginal development of the sister brood in three large experimental areas characterized by epidemic bark beetle populations. Therefore, the use of this early detection approach over large areas deserves to be further developed and improved. In this effort, the integration of sensors focused on narrower spectral windows around the Red-Edge and Green bands could be used to enhance the power of the vegetation indices to detect the first changes in canopies of recently infested trees, as NDRE and GNDVI proved to be the most useful indices in the present work. This early detection approach presented the most helpful indices to separate the spectral profiles of healthy and recently infested trees, and highlighted the challenges of UAV imagery use over very large forest areas. This will contribute to increase the knowledge and understanding of which factors to consider when performing early detection with remote sensing techniques when upscaling to larger spatial scales.
The datasets presented in this study can be found in online repositories. The name of the repository can be found at: https://figshare.com/articles/dataset/Dataset_UAV_EarlyDetection_upscaling/27605163?file=50184846Figshare.
AuB: Conceptualization, Data curation, Formal analysis, Investigation, Methodology, Visualization, Writing – original draft, Writing – review & editing. LH: Formal analysis, Methodology, Resources, Software, Writing – review & editing. SB: Conceptualization, Data curation, Investigation, Methodology, Software, Writing – review & editing. GM: Investigation, Writing – review & editing. HP: Resources, Supervision, Writing – review & editing. VF: Writing – review & editing. AnB: Funding acquisition, Supervision, Writing – review & editing. MF: Funding acquisition, Supervision, Writing – review & editing.
The author(s) declare that financial support was received for the research, authorship, and/or publication of this article. This work was carried out within a grant of the Regione del Veneto decree 1691–29/11/2021 and a grant from DAFNAE DOR2344584 UNIPD. The work is framed within the Agritech National Research Center that received funding from the European Union Next-GenerationEU (PIANO NAZIONALE DI RIPRESA E RESILIENZA (PNRR)-MISSIONE 4 COMPONENTE 2, INVESTIMENTO 1.4-DD. 1032 17/06/2022, CN00000022). Partial funding was provided by The Foundation Blanceflor and the Horizon project RESDINET (Grant agreement ID: 101078970, doi: https://doi.org/10.3030/101078970). The funders had no role in the design of the study; in the collection, analyses, or interpretation of data; in the writing of the manuscript; or in the decision to publish the results.
We would like to thank Veneto Agricoltura for providing pheromone trap surveillance. We would also like to thank Alison Garside for linguistic proofreading the manuscript.
The authors declare that the research was conducted in the absence of any commercial or financial relationships that could be construed as a potential conflict of interest.
The authors declare that no Gen AI was used in the creation of this manuscript.
All claims expressed in this article are solely those of the authors and do not necessarily represent those of their affiliated organizations, or those of the publisher, the editors and the reviewers. Any product that may be evaluated in this article, or claim that may be made by its manufacturer, is not guaranteed or endorsed by the publisher.
This manuscript reflects only the authors’ views and opinions, neither the European Union nor the European Commission can be considered responsible for them.
The Supplementary material for this article can be found online at: https://www.frontiersin.org/articles/10.3389/ffgc.2025.1532954/full#supplementary-material
Abdullah, H., Darvishzadeh, R., Skidmore, A. K., Groen, T. A., and Heurich, M. (2018a). European spruce bark beetle (Ips typographus L.) green attack affects foliar reflectance and biochemical properties. Int. J. Appl. Earth Obs. Geoinf. 64, 199–209. doi: 10.1016/J.JAG.2017.09.009
Abdullah, H., Skidmore, A. K., Darvishzadeh, R., and Heurich, M. (2018b). Sentinel-2 accurately maps green-attack stage of European spruce bark beetle (Ips typographus L.) compared with Landsat-8. Remote Sens. Ecol. Conservation 5, 87–106. doi: 10.1002/rse2.93
Abdullah, H., Skidmore, A. K., Darvishzadeh, R., and Heurich, M. (2019). Timing of red-edge and shortwave infrared reflectance critical for early stress detection induced by bark beetle (Ips typographus L.) attack. Int. J. Appl. Earth Obs. Geoinf. 82:101900. doi: 10.1016/J.JAG.2019.101900
Andresini, G., Appice, A., and Malerba, D. (2024). “Leveraging Sentinel-2 time series for bark beetle-induced forest dieback inventory” in Proceedings of the 39th ACM/SIGAPP Symposium on Applied Computing (SAC ‘24). Association for Computing Machinery, New York, NY, USA, 875–882. doi: 10.1145/3605098.3635908
Baier, P., Pennerstorfer, J., and Schopf, A. (2007). PHENIPS—A comprehensive phenology model of Ips typographus (L.) (Col., Scolytinae) as a tool for hazard rating of bark beetle infestation. For. Ecol. Manag. 249, 171–186. doi: 10.1016/J.FORECO.2007.05.020
Bárta, V., Hanuš, J., Dobrovolný, L., and Homolová, L. (2022). Comparison of field survey and remote sensing techniques for detection of bark beetle-infested trees. For. Ecol. Manag. 506:119984. doi: 10.1016/j.foreco.2021.119984
Bárta, V., Lukeš, P., and Homolová, L. (2021). Early detection of bark beetle infestation in Norway spruce forests of Central Europe using Sentinel-2. Int. J. Appl. Earth Obs. Geoinf. 100:102335. doi: 10.1016/J.JAG.2021.102335
Bates, D., Maechler, M., Bolker, B., and Walker, S. (2021). Linear mixed-effects models using ‘Eigen’ and S4. R package ‘lme4’, version 1.1-27.1.
Bijou, S., Kupková, L., Potůčková, M., Červená, L., and Lysák, J. (2023). Evaluation of the bark beetle green attack detectability in spruce forest from multitemporal multispectral UAV imagery. ISPRS Annals of the photogrammetry, remote sensing and spatial. Inf. Sci. 2023, 1033–1040. doi: 10.5194/ISPRS-ANNALS-X-1-W1-2023-1033-2023
Blasi, C., Capotorti, G., Copiz, R., Guida, D., Mollo, B., Smiraglia, D., et al. (2014). Classification and mapping of the ecoregions of Italy. Plant Biosyst. 148, 1255–1345. doi: 10.1080/11263504.2014.985756
Bozzini, A., Brugnaro, S., Morgante, G., Santoiemma, G., Deganutti, L., Finozzi, V., et al. (2024). Drone-based early detection of bark beetle infested spruce trees differs in endemic and epidemic populations. Front. Forests and Global Change 7, 1–14. doi: 10.3389/ffgc.2024.1385687
Candotti, A., De Giglio, M., Dubbini, M., and Tomelleri, E. (2022). A Sentinel-2 based multi-temporal monitoring framework for wind and bark beetle detection and damage mapping. Remote Sens. 14:6105. doi: 10.3390/RS14236105
Dalponte, M., Cetto, R., Marinelli, D., Andreatta, D., Salvadori, C., Pirotti, F., et al. (2023). Spectral separability of bark beetle infestation stages: a single-tree time-series analysis using planet imagery. Ecol. Indic. 153:110349. doi: 10.1016/J.ECOLIND.2023.110349
Faccoli, M. (2009). Effect of weather on Ips typographus (Coleoptera Curculionidae): phenology, voltinism, and associated spruce mortality in the southeastern Alps. Environ. Entomol. 38, 307–316. doi: 10.1603/022.038.0202
Faccoli, M., and Bernardinelli, I. (2011). Breeding performance of the second generation in some bivoltine populations of Ips typographus (Coleoptera Curculionidae) in the South-Eastern Alps. J. Pest. Sci. 84, 15–23. doi: 10.1007/s10340-010-0320-7
Faccoli, M., and Stergulc, F. (2006). A practical method for predicting the short-time trend of bivoltine populations of Ips typographus (L.) (Col., Scolytidae). J. Appl. Entomol. 130, 61–66. doi: 10.1111/j.1439-0418.2005.01019.x
Fischer, E. M., and Knutti, R. (2015). Anthropogenic contribution to global occurrence of heavy-precipitation and high-temperature extremes. Nat. Clim. Chang. 5, 560–564. doi: 10.1038/nclimate2617
Hartig, F. (2022). Residual diagnostics for hierarchical (multi-level/mixed) regression models. R package ‘DHARMa’, version 0.4.6. RRID:SCR_022136.
Hellwig, F. M., Stelmaszczuk-Górska, M. A., Dubois, C., Wolsza, M., Truckenbrodt, S. C., Sagichewski, H., et al. (2021). Mapping European spruce bark beetle infestation at its early phase using gyrocopter-mounted hyperspectral data and field measurements. Remote Sens. 13:4659. doi: 10.3390/RS13224659
Honkavaara, E., Näsi, R., Oliveira, R., Viljanen, N., Suomalainen, J., Khoramshahi, E., et al. (2020). Using multitemporal hyper- and multispectral Uav imaging for detecting bark beetle infestation on Norway spruce. Int. Arch. Photogramm. Remote. Sens. Spat. Inf. Sci. XLIII-B3-2020, 429–434. doi: 10.5194/isprs-archives-XLIII-B3-2020-429-2020
Hovi, A., Raitio, P., and Rautiainen, M. (2017). A spectral analysis of 25 boreal tree species. Silva Fennica 51, 1–16. doi: 10.14214/SF.7753
Huo, L., Koivumäki, N., Oliveira, R. A., Hakala, T., Markelin, L., Näsi, R., et al. (2024). Bark beetle pre-emergence detection using multi-temporal hyperspectral drone images: green shoulder indices can indicate subtle tree vitality decline. ISPRS J. Photogramm. Remote Sens. 216, 200–216. doi: 10.1016/j.isprsjprs.2024.07.027
Huo, L., Lindberg, E., Bohlin, J., and Persson, H. J. (2023). Assessing the detectability of European spruce bark beetle green attack in multispectral drone images with high spatial-and temporal resolutions. Remote Sens. Environ. 287:113484. doi: 10.1016/j.rse.2023.113484
Huo, L., Lindberg, E., Fransson, J. E. S., and Persson, H. J. (2022). “Comparing spectral differences between healthy and early infested spruce forests caused by bark beetle attacks using satellite images.” International geoscience and remote sensing symposium (IGARSS), Kuala Lumpur, Malaysia, 2022-July, 7709–7712.
Huo, L., Persson, H. J., and Lindberg, E. (2021). “Early detection of forest stress from European spruce bark beetle attack, and a new vegetation index: Normalized distance red & SWIR (NDRS)”. Remote Sens. Environ, 255:112240. doi: 10.1016/j.rse.2020.112240
Kautz, M., Feurer, J., and Adler, P. (2024). Early detection of bark beetle (Ips typographus) infestations by remote sensing – a critical review of recent research. For. Ecol. Manag. 556:121595. doi: 10.1016/J.FORECO.2023.121595
Kautz, M., Peter, F. J., Harms, L., Kammen, S., and Delb, H. (2023). Patterns, drivers and detectability of infestation symptoms following attacks by the European spruce bark beetle. J. Pest. Sci. 96, 403–414. doi: 10.1007/s10340-022-01490-8
Klouček, T., Komárek, J., Surový, P., Hrach, K., Janata, P., and Vašíček, B. (2019). The use of UAV mounted sensors for precise detection of bark beetle infestation. Remote Sens. 11:1561. doi: 10.3390/RS11131561
Klouček, T., Modlinger, R., Zikmundová, M., Kycko, M., and Komárek, J. (2024). Early detection of bark beetle infestation using UAV-borne multispectral imagery: a case study on the spruce forest in the Czech Republic. Front. Forests and Global Change 7:1215734. doi: 10.3389/FFGC.2024.1215734
Lenth, R. V. (2022). Estimated marginal means, aka least-squares means. R package ‘emmeans’, version 1.8.3. RRID:SCR_018734.
Lukeš, P., Stenberg, P., Rautiainen, M., Mõttus, M., and Vanhatalo, K. M. (2013). Optical properties of leaves and needles for boreal tree species in Europe. Remote Sens. Lett. 4, 667–676. doi: 10.1080/2150704X.2013.782112
Luo, Y., Huang, H., and Roques, A. (2023). Early monitoring of forest wood-boring pests with remote sensing. Annu. Rev. Entomol. 68, 277–298. doi: 10.1146/annurev-ento-120220-125410
Majdák, A., Jakuš, R., and Blaženec, M. (2021). Determination of differences in temperature regimes on healthy and bark-beetle colonised spruce trees using a handheld thermal camera. IForest-Biogeosci. Forestry 14, 203–211. doi: 10.3832/IFOR3531-014
Marvasti-Zadeh, S. M., Goodsman, D., Ray, N., and Erbilgin, N. (2022). Early detection of bark beetle attack using remote sensing and machine learning: a review. ACM Comput. Surv. 56, 1–40. doi: 10.1145/3625387
Mezei, P., Grodzki, W., Blaženec, M., Škvarenina, J., Brandysova, V., and Jakuš, R. (2014). Host and site factors affecting tree mortality caused by the spruce bark beetle (Ips typographus) in mountainous conditions. For. Ecol. Manag. 331, 196–207. doi: 10.1016/J.FORECO.2014.07.031
Minařík, R., Langhammer, J., and Lendzioch, T. (2021). Detection of bark beetle disturbance at tree level using UAS multispectral imagery and deep learning. Remote Sens. 13:4768. doi: 10.3390/RS13234768
Nakagawa, S., and Cuthill, I. C. (2007). Effect size, confidence interval and statistical significance: a practical guide for biologists. Biol. Rev. 82, 591–605. doi: 10.1111/j.1469-185X.2007.00027.x
Nardi, D., Bozzini, A., Morgante, G., Gaccione, A., Finozzi, V., and Battisti, A. (2023). Participatory ground data are complementary to satellite bark beetle detection. Ann. For. Sci. 80, 1–12. doi: 10.1186/S13595-023-01216-5/FIGURES/7
Nardi, D., Finozzi, V., and Battisti, A. (2022b). Massive windfalls boost an ongoing spruce bark beetle outbreak in the southern Alps. Italian J. Forest and Mountain Environ. 77, 23–34. doi: 10.36253/ifm-1617
Nardi, D., Jactel, H., Pagot, E., Samalens, J.-C., and Marini, L. (2022a). Drought and stand susceptibility to attacks by the European spruce bark beetle: a remote sensing approach. Agric. For. Entomol. 25, 119–129. doi: 10.1111/AFE.12536
Näsi, R., Honkavaara, E., Blomqvist, M., Lyytikäinen-Saarenmaa, P., Hakala, T., Viljanen, N., et al. (2018). Remote sensing of bark beetle damage in urban forests at individual tree level using a novel hyperspectral camera from UAV and aircraft. Urban For. Urban Green. 30, 72–83. doi: 10.1016/j.ufug.2018.01.010
Natesan, S., Armenakis, C., and Vepakomma, U. (2020). Individual tree species identification using dense convolutional network (Densenet) on multitemporal RGB images from UAV. J. Unmanned Vehicle Syst. 8, 310–333. doi: 10.1139/juvs-2020-0014
Netherer, S., Schebeck, M., Morgante, G., Rentsch, V., and Kirisits, T. (2022). European spruce bark beetle, Ips typographus (L.) males are attracted to bark cores of drought-stressed Norway spruce trees with impaired defenses in petri dish choice experiments. Forests 13:537. doi: 10.3390/F13040537
Persson, H. J., Kärvemo, S., Lindberg, E., and Huo, L. (2024). Large-scale wall-to-wall mapping of bark beetle damage and forest practices using the distance red swir index and operational harvester data. Ecol. Indic. 162:112036. doi: 10.1016/j.ecolind.2024.112036
R Core Team (2022). R: A language and environment for statistical computing. Vienna: R Foundation for Statistical Computing.
Sproull, G. J., Adamus, M., Bukowski, M., Krzyżanowski, T., Szewczyk, J., Statwick, J., et al. (2015). Tree and stand-level patterns and predictors of Norway spruce mortality caused by bark beetle infestation in the Tatra Mountains. For. Ecol. Manag. 354, 261–271. doi: 10.1016/j.foreco.2015.06.006
Stříbrská, B., Moliterno, A. A. C., Hüttnerová, T., Leiner, M., Surový, P., and Jirošová, A. (2024). Pilot study of 3D spatial distribution of α-Pinene emitted by Norway spruce Picea abies (L.) Karst recently infested by Ips typographus (L. 1758) (Coleoptera: Scolytinae). Forests 15:10. doi: 10.3390/F15010010/S1
Trubin, A., Kozhoridze, G., Zabihi, K., Modlinger, R., Singh, V. V., Surový, P., et al. (2024). Detection of green attack and bark beetle susceptibility in Norway spruce: utilizing planet scope multispectral imagery for tri-stage spectral separability analysis. For. Ecol. Manag. 560:121838. doi: 10.1016/J.FORECO.2024.121838
Turkulainen, E., Honkavaara, E., Näsi, R., Oliveira, R. A., Hakala, T., Junttila, S., et al. (2023). Comparison of deep neural networks in the classification of bark beetle-induced spruce damage using UAS images. Remote Sens. 15:4928. doi: 10.3390/RS15204928
Vošvrdová, N., Johansson, A., Turčáni, M., Jakuš, R., Tyšer, D., Schlyter, F., et al. (2023). Dogs trained to recognise a bark beetle pheromone locate recently attacked spruces better than human experts. For. Ecol. Manag. 528:120626. doi: 10.1016/J.FORECO.2022.120626
Wermelinger, B. (2004). Ecology and management of the spruce bark beetle Ips typographus - a review of recent research. For. Ecol. Manag. 202, 67–82. doi: 10.1016/j.foreco.2004.07.018
Keywords: European spruce bark beetle, remote sensing, early warning, early symptoms, upscaling, IPS typographus
Citation: Bozzini A, Huo L, Brugnaro S, Morgante G, Persson HJ, Finozzi V, Battisti A and Faccoli M (2025) Multispectral drone images for the early detection of bark beetle infestations: assessment over large forest areas in the Italian South-Eastern Alps. Front. For. Glob. Change. 8:1532954. doi: 10.3389/ffgc.2025.1532954
Edited by:
Benoit Marçais, INRA Centre Nancy-Lorraine, FranceReviewed by:
Dimitrios N. Avtzis, Hellenic Agricultural Organization, GreeceCopyright © 2025 Bozzini, Huo, Brugnaro, Morgante, Persson, Finozzi, Battisti and Faccoli. This is an open-access article distributed under the terms of the Creative Commons Attribution License (CC BY). The use, distribution or reproduction in other forums is permitted, provided the original author(s) and the copyright owner(s) are credited and that the original publication in this journal is cited, in accordance with accepted academic practice. No use, distribution or reproduction is permitted which does not comply with these terms.
*Correspondence: Aurora Bozzini, YXVyb3JhLmJvenppbmlAcGhkLnVuaXBkLml0
Disclaimer: All claims expressed in this article are solely those of the authors and do not necessarily represent those of their affiliated organizations, or those of the publisher, the editors and the reviewers. Any product that may be evaluated in this article or claim that may be made by its manufacturer is not guaranteed or endorsed by the publisher.
Research integrity at Frontiers
Learn more about the work of our research integrity team to safeguard the quality of each article we publish.