 Qi Liu
 Shuheng Li
 Jiachuan Wang
 Yijie Han1,2
94% of researchers rate our articles as excellent or good
Learn more about the work of our research integrity team to safeguard the quality of each article we publish.
Find out more
ORIGINAL RESEARCH article
Front. For. Glob. Change, 26 March 2025
Sec. Forest Management
Volume 8 - 2025 | https://doi.org/10.3389/ffgc.2025.1529552
The reconstruction of climate factor fields is essential for understanding large-scale climate change. We collected 30 tree-ring width chronologies and 29 meteorological stations data, conducted spatial correlation analysis between tree-ring width chronologies and temperature of meteorological stations, selected the timelines with high correlation (r > 0.6), and conducted correlation analysis between these tree-ring width chronologies and climate data in North China. The correlation results showed that there was a significant correlation between the chronologies and the maximum temperature in July (p < 0.05). Based on this, the summer temperature series was reconstructed by Point-by-Point Regression (PPR). The results show that there are two warm periods (1856-1970, 1883-1952) and two cold periods (1871-1882, 1953-1996) in North China from 1845 to 2002. Morlet wavelet analysis shows that the reconstructed sequences have four periodic changes: 1-3a, 2-6a, 7-11a and 13-18a. Cross wavelet analysis shows that he El Niño-Southern Oscillation (ENSO), Sunspot, and the Pacific Decadal Oscillation (PDO) are the factors affecting the temperature change in the study area. In addition, we also analyzed the spatial distribution pattern of the maximum temperature in North China in July by Empirical Orthogonal Function (EOF) and Rotational Empirical Orthogonal Function (REOF). The results show that there are four distribution patterns of the maximum temperature in North China in July: the west, the east, the south and the north, and the west is the main distribution pattern.
Global warming and a series of extreme climatic events have profound implications not only for human living conditions and lifestyles but also for natural ecosystems, resulting in significant ecological losses (Cai et al., 2020; Wang K. Y. et al., 2021). Trees play a crucial role within forest ecosystems, with their growth and development being directly influenced by climatic variables such as temperature and precipitation. Among the various biological proxies utilized to assess climate change, tree rings are favored in paleoclimatology due to their high precision, ease of collection, and capacity to generate large sample sizes (Alba et al., 2021; Fritts, 1976; Szymański et al., 2025; Xaybouangeun et al., 2024). Investigating the relationship between tree radial growth and climatic factors, as well as reconstructing historical climate variations, is essential for understanding the characteristics of regional climate change (Gaire et al., 2023; Yin et al., 2023).
Climate reconstruction research is a vital approach for elucidating historical climate patterns, relying on existing climatic data and the constraints imposed by various climatic factors on tree growth to recreate past climatic conditions (Li et al., 2014; Shao et al., 2010). Studies indicate that during periods of drought stress, tree rings can reflect regional precipitation changes (Adam et al., 2024; Peng et al., 2024; Zhang et al., 2024); conversely, when precipitation is adequate but sunlight is limited, temperature becomes a significant determinant of tree growth, with temperature fluctuations being recorded in tree rings (Asad et al., 2024; Matskovsky et al., 2022; Yue et al., 2024). These findings underscore that tree growth is influenced by different climatic factors to varying extents under diverse site conditions, and the climate information captured is contingent upon these factors, suggesting that climate reconstruction necessitates uniform characteristics of regional climate changes.
North China is located north of the Qinling-Huaihe Line (Xue et al., 2024) and is characterized by a diverse range of climate types, alongside a rapidly advancing field of dendroclimatology (Ma et al., 2011; Cao et al., 2021). However, the disparities in climate change across different regions impose limitations on climate reconstructions, which often focus on isolated points or small geographical units, thereby lacking comprehensive large-scale climate change sequences. This situation hampers the analysis of overarching climate change trends and characteristics within the region (Bao et al., 2011; Jiang et al., 2012; Guo et al., 2015; Wei et al., 2023).
To address this issue, the present study builds upon existing dendroclimatology research in North China and employs climate factor field reconstruction as a methodological approach. This reconstruction technique offers insights into both temporal and spatial dimensions, thereby enhancing the understanding of the temporal variations and spatial distribution of climate factors, while also minimizing low-frequency variation errors (Mann et al., 2005). Utilizing Empirical Orthogonal Function (EOF) and Rotational Empirical Orthogonal Function (REOF) spatial analysis methods, the study identifies the spatial distribution patterns of climate factors in North China (Wu et al., 2023; Liu et al., 2023). These two methods can break down the climate data into two components: temporal and spatial. The spatial component elucidates the distribution characteristics of climate variables across various geographical regions, the region with high load value is the center of temperature change, while the temporal component delineates the changes in these spatial distribution characteristics over time (Bi et al., 2021; Liu et al., 2020). The Point-by-Point Regression (PPR) reconstruction method is applied to retrieve chronologies. The temperature reconstruction methodology utilized in this study capitalizes on the correlation between climate records gathered from various meteorological stations within the specified area and tree-ring chronologies. This method enables the reconstruction of climate records for each individual meteorological station. Following this, the reconstructed climate sequences from each station are integrated into a cohesive regional climate sequence, thereby enhancing the preservation of climatic change characteristics across different regions. Similar climate reconstruction methodologies have been employed in various contexts, including the reconstruction of the Palmer Drought Severity Index (PDSI) in the western United States (Cook et al., 1999), drought reconstructions across North America (Meko et al., 1993), paleoclimate reconstructions in the Mediterranean region (Cook et al., 2015), precipitation sequence reconstructions in Northwest China (Fang, 2010), and early spring temperature change reconstructions in the Qinling area (Hou et al., 2017). The findings of these studies suggest that the reconstruction of regional climate sequences utilizing the PPR method is indeed feasible. Consequently, this paper seeks to reconstruct the large-scale climatic characteristics of the North China region through the application of the PPR method. This endeavor aims to enhance the understanding of climate evolution patterns in North China and to offer valuable insights for local environmental protection and the management of forest resources.
The research area is located within the mid to high latitudes, specifically between 36°43′N–47°4′N, and 109°15′E–126°04′E, encompassing regions of Shanxi, Inner Mongolia, Hebei, and Beijing (Figure 1). This area is predominantly landlocked to the north, west, and south, while its eastern boundary is adjacent to the Bohai Sea and the Yellow Sea. The distinctive topographical features of the region significantly amplify the impact of the summer monsoon on its climatic conditions, resulting in a pronounced continental monsoon climate characterized by simultaneous rainfall and elevated temperatures. Precipitation is primarily concentrated during the summer months, peaking in July with a peak occurring in July, where it reaches an average of 123.44 mm, in stark contrast to a minimal average of 2.33 mm during drier periods (Shi et al., 2017). The interplay of latitude and topographical elements leads to notable spatial variations in temperature and precipitation; specifically, from the eastern to the western interior, there is a gradual decline in precipitation. The combined effects of temperature and precipitation facilitate the transition from forest to desert vegetation in the interior regions, thereby contributing to a fragile ecological environment (Guo et al., 2013).
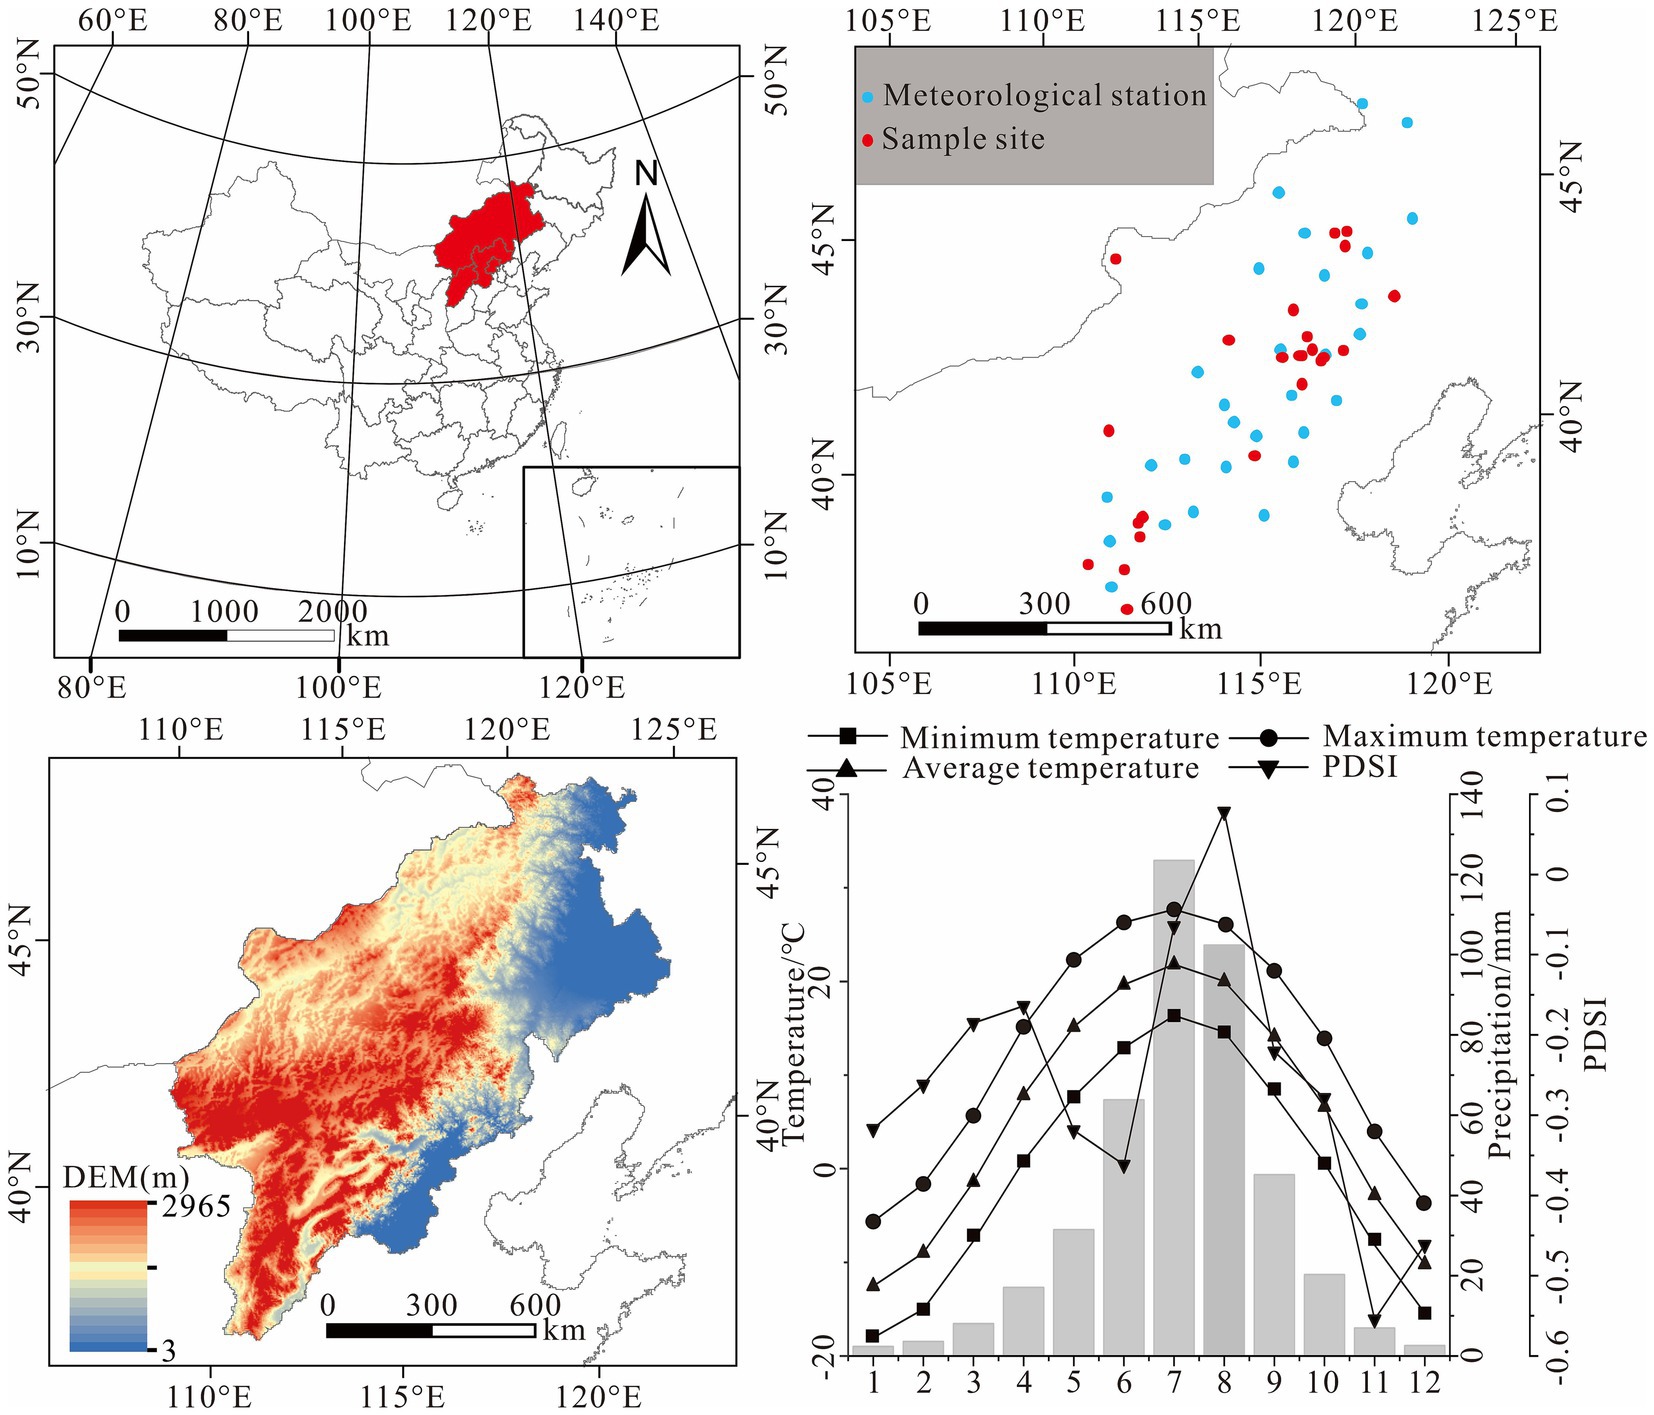
Figure 1. Overview of the study area (terrain, meteorological stations and sample sites) and average temperature, maximum temperature, minimum temperature, precipitation and PDSI in the study area during 1960–2002.
Climate data were collected from 29 meteorological stations located in Shanxi, Hebei, Beijing, and Inner Mongolia, covering the period from 1959 to 2002. The climate indicators obtained from each station included monthly average temperature, monthly minimum temperature, monthly maximum temperature, monthly average precipitation1 and PDSI,2 among which PDSI is obtained by tailoring the study location boundary.
Most of the meteorological stations provided continuous observational data; for a limited number of stations with missing data, the average values of climate indicators from other stations within the same year were used as replacements. Furthermore, the CRU climate grid dataset, which has a resolution of 0.5° × 0.5° (Ian et al., 2020), was employed to enhance the understanding of the spatial representative of the climate reconstruction series. The tree-ring chronologies examined in this study were all derived from published literature and research team obtained, totaling 30 chronologies, with comprehensive data presented in Table 1. The chronologies used in this study are derived from well-established tree species commonly employed in dendroclimatological research, including Larix principis-rupprechtii, Ulmus pumila, and Pinus tabuliformis. These chronologies are evenly distributed throughout the study area and encompass a significant amount of climatic signals, thereby enabling an accurate representation of regional climate change data. The years selected for the analysis of these chronologies correspond to the common years across all datasets, concluding in 2002.
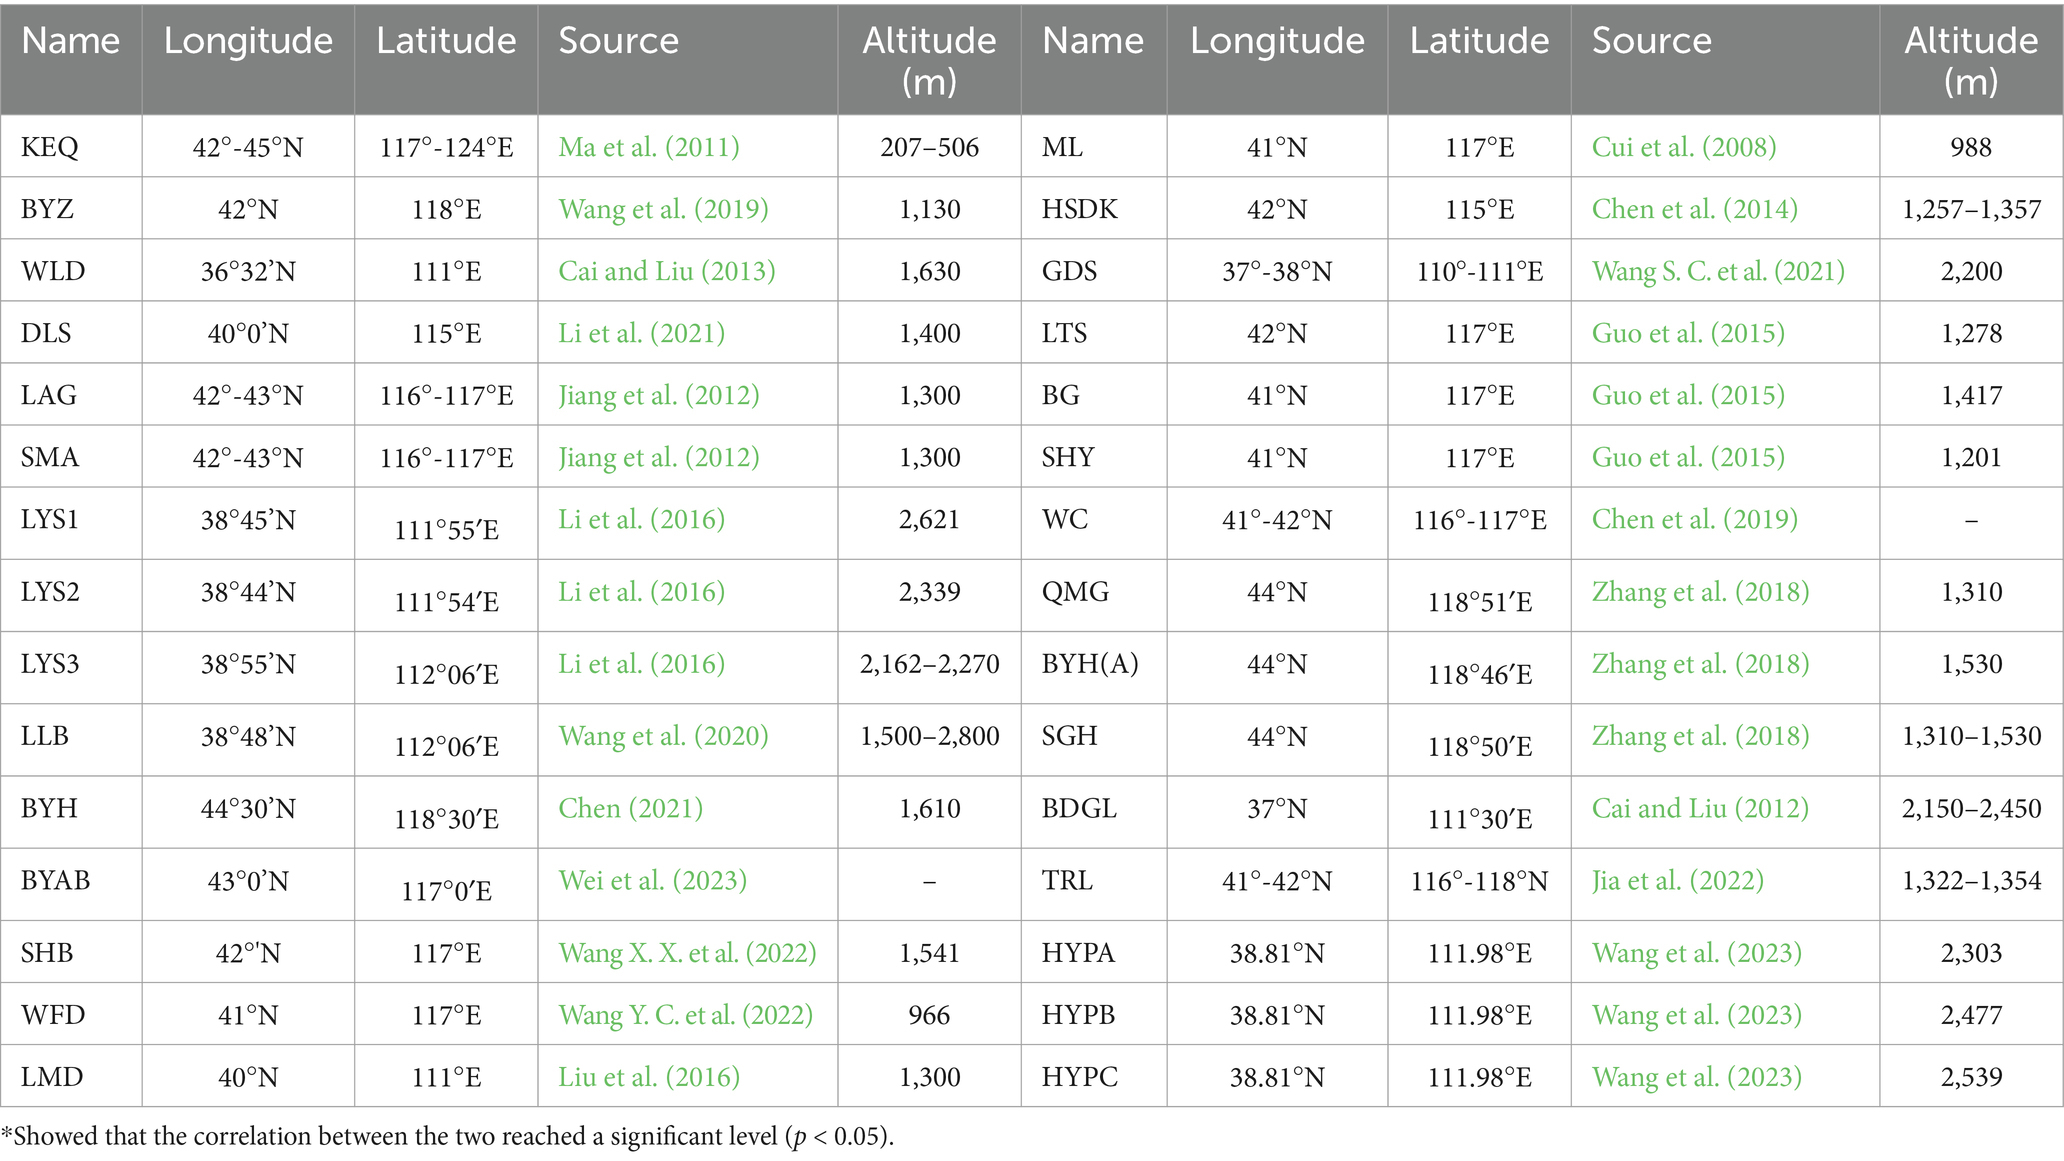
Table 1. Coordinates and sources of tree-ring width chronologies.
The spatial distribution characteristics of climate in the North China region are analyzed using EOF and REOF methodologies (Song et al., 2024). The significance of various spatial distribution characteristics is assessed through the North test (North et al., 1982; Hannachi et al., 2007). This study ultimately examines the similarities and differences in climate change across distinct regions, with the findings from the EOF and REOF analyses spatially represented using the Kriging interpolation technique. Furthermore, regional climate reconstruction is performed using an enhanced version of the PPR method.
The conventional PPR method retrieves chronologies based on a specified radius surrounding each meteorological station (Cook et al., 1999; Cook et al., 2015; Meko et al., 1993). However, as previously noted, the influence of meteorological factors on tree radial growth is affected by site-specific conditions and other variables. Consequently, relying on distance for selecting chronologies may inadequately account for regional climate disparities, making the traditional PPR more applicable in areas characterized by relatively uniform spatial climate distributions (Fang, 2010).
In light of the limitations inherent in the traditional PPR and the variability of spatial climate factors, this study adopts a methodology that retrieves chronologies based on spatial correlation coefficients rather than traditional distance metrics. This adjustment ensures a robust spatial correlation between each station and the corresponding chronologies. Given that prior research in the region has identified a significant correlation between tree radial growth and temperature, temperature is selected as the primary climate factor for the spatial correlation analysis. The operational procedure involves conducting spatial correlation analyses between climate data from each station and the CRU TS4.08 (0.5° × 0.5°) temperature grid data, with tree-ring width chronologies exhibiting correlation coefficients of 0.6 or higher being selected for climate reconstruction at each station. To validate the reliability of the reconstruction outcomes, a correlation analysis is performed between the selected chronologies and the corresponding climate data from the meteorological stations. Chronologies demonstrating significant correlations are utilized to establish linear regression equations for each station and merge into a regional climate sequence.
To investigate the underlying factors contributing to these regional temperature variations, Morlet wavelet analysis was employed to determine the periodicity of temperature fluctuations. This analytical approach effectively highlights geophysical signals and is advantageous for detecting periodic variations within such signals (Perone et al., 2016). Furthermore, cross-wavelet analysis was utilized to examine the correlation between temperature changes and the dynamic variations associated with ENSO, solar activity, and PDO. The data pertaining to ENSO and PDO were derived from existing literature (Fang et al., 2019), while the solar activity index was obtained from an observational website,3 facilitating the identification of factors influencing temperature changes across different temporal intervals.
Given the delayed response of tree radial growth to climatic variables, the climate data used for correlation analysis includes average temperature, maximum temperature, minimum temperature, precipitation and PDSI from September of the previous year to September of the current year. A total of 14 tree-ring chronologies were selected by spatial correlation coefficients. The findings from the Pearson correlation analysis (Figure 2) indicate that the relationship between tree ring width chronology and temperature is most pronounced, particularly during the summer months of May, June, and July, where this correlation is notably negative. Conversely, the analysis reveals that the strongest positive correlations between the chronology and both precipitation and PDSI occur in July. These results suggest that elevated summer temperatures, combined with drought stress resulting from the interaction of temperature and moisture, are the primary factors limiting the radial growth of trees in the North China region.
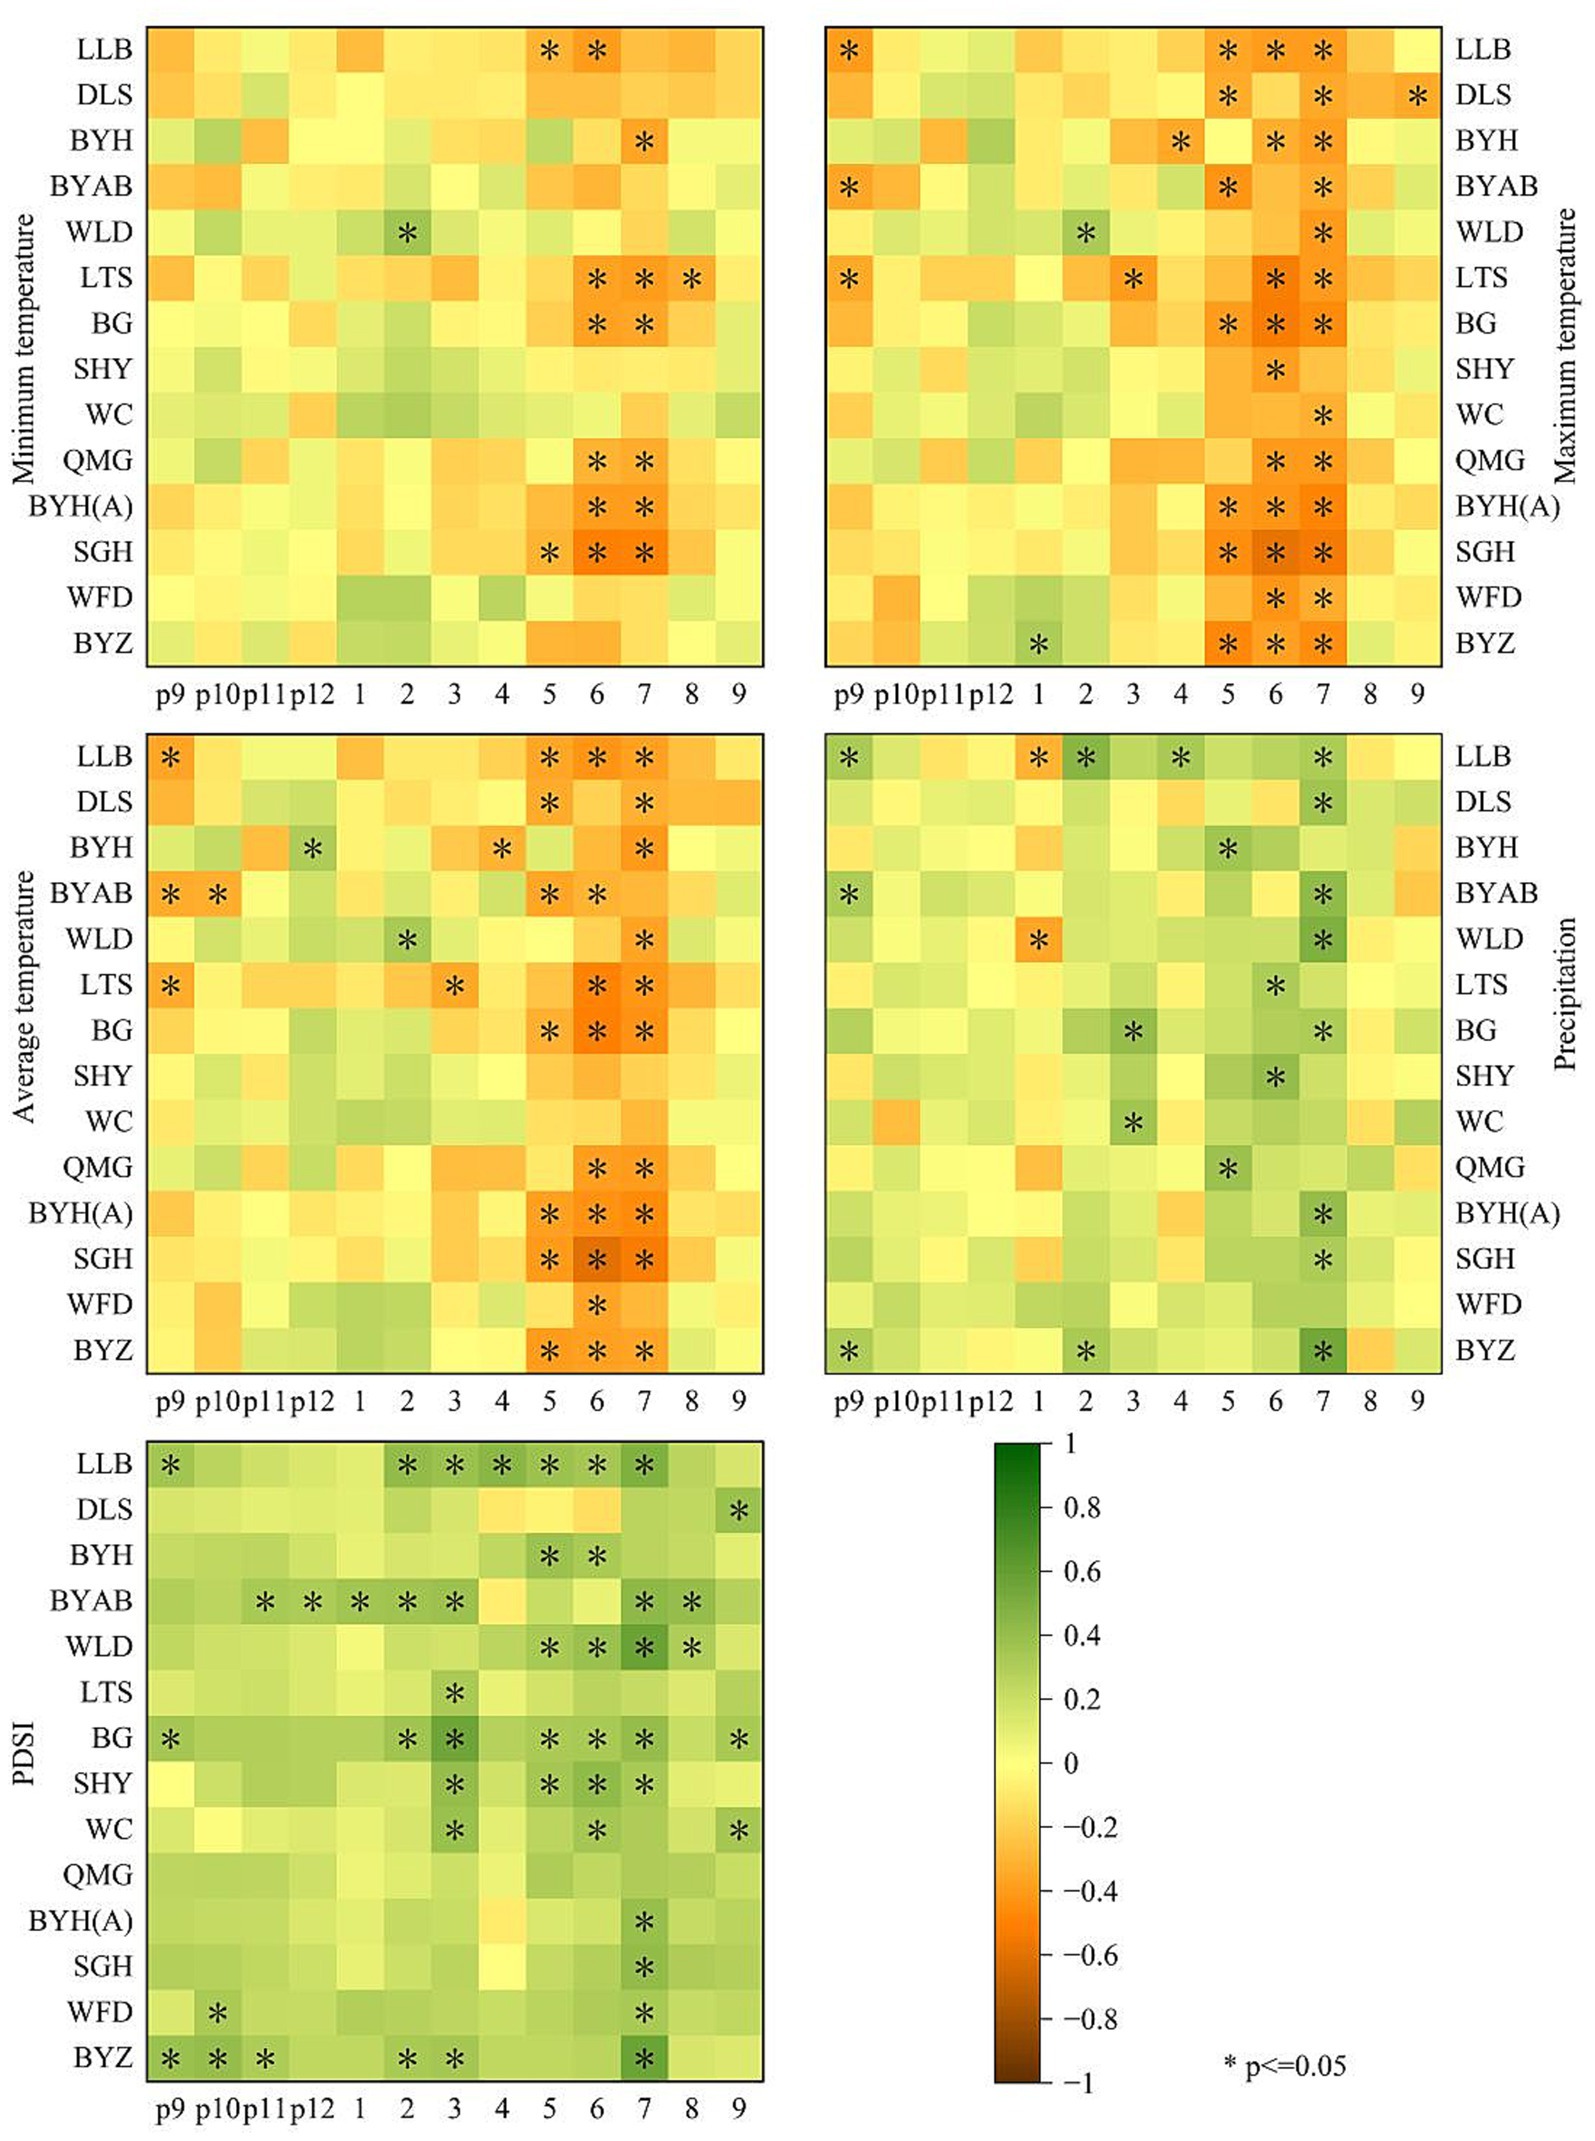
Figure 2. Relationship between tree-ring width chronologies and various climatic factors, including minimum temperature, maximum temperature, average temperature, precipitation and PDSI.
In examining the relationship between the maximum temperature recorded in July and tree-ring chronologies, a moving correlation analysis was conducted to assess the stability of tree growth responses to July’s maximum temperature from 1960 to 2002 (Table 2). This analysis utilized a sliding window of 30 years. The results indicate that the chronologies exhibiting significant correlations with July’s maximum temperature maintain a degree of stability in their correlation coefficients throughout the analysis period. In contrast, chronologies with weaker correlations demonstrated a gradual strengthening of their response to July’s maximum temperature. Finally, the maximum temperature in July is selected as the index of climate reconstruction, and the time table with poor time stability is excluded.
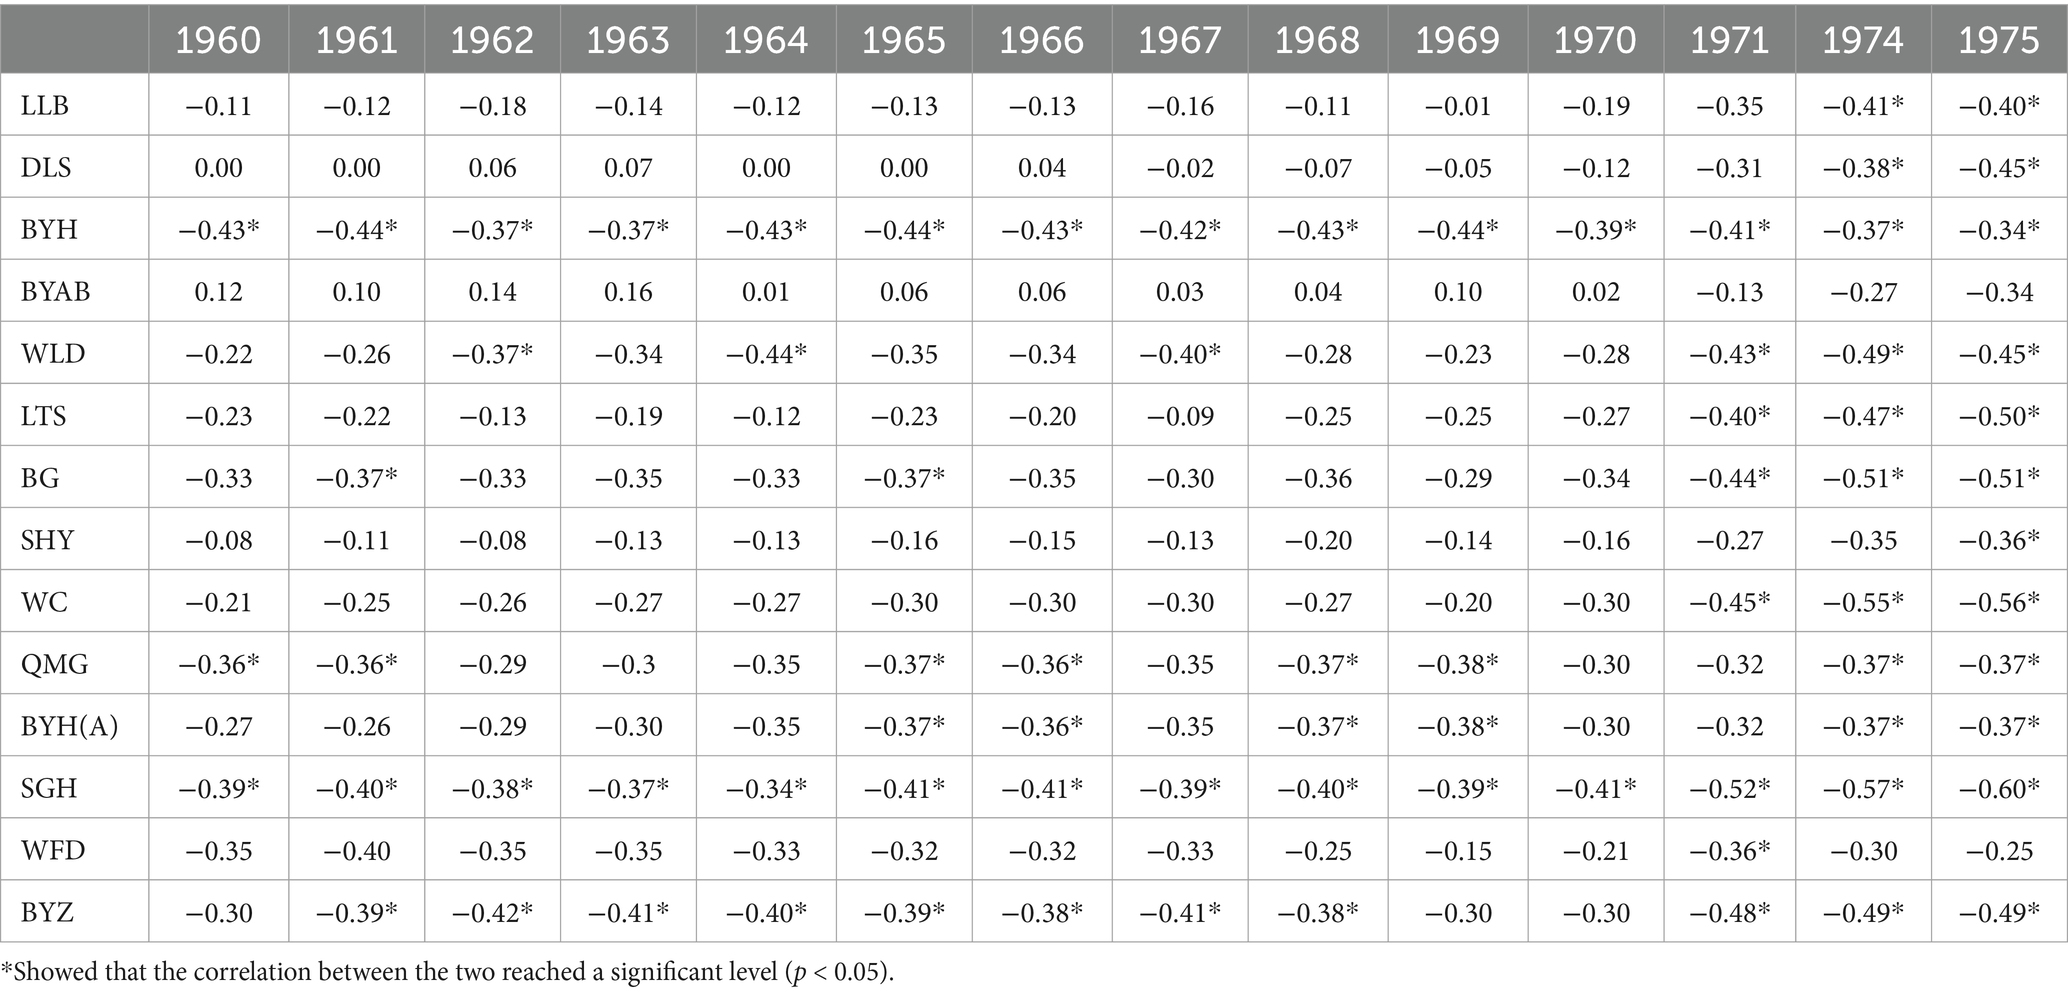
Table 2. Sliding correlation analysis of tree ring width chronology and maximum temperature in July (sliding interval 30a).
The maximum July temperatures from multiple stations spanning the years 1960 to 2002 were aggregated for EOF and REOF analyses. The first four modes of EOF successfully passed the North test, with the corresponding indicators for each mode presented in Table 3.
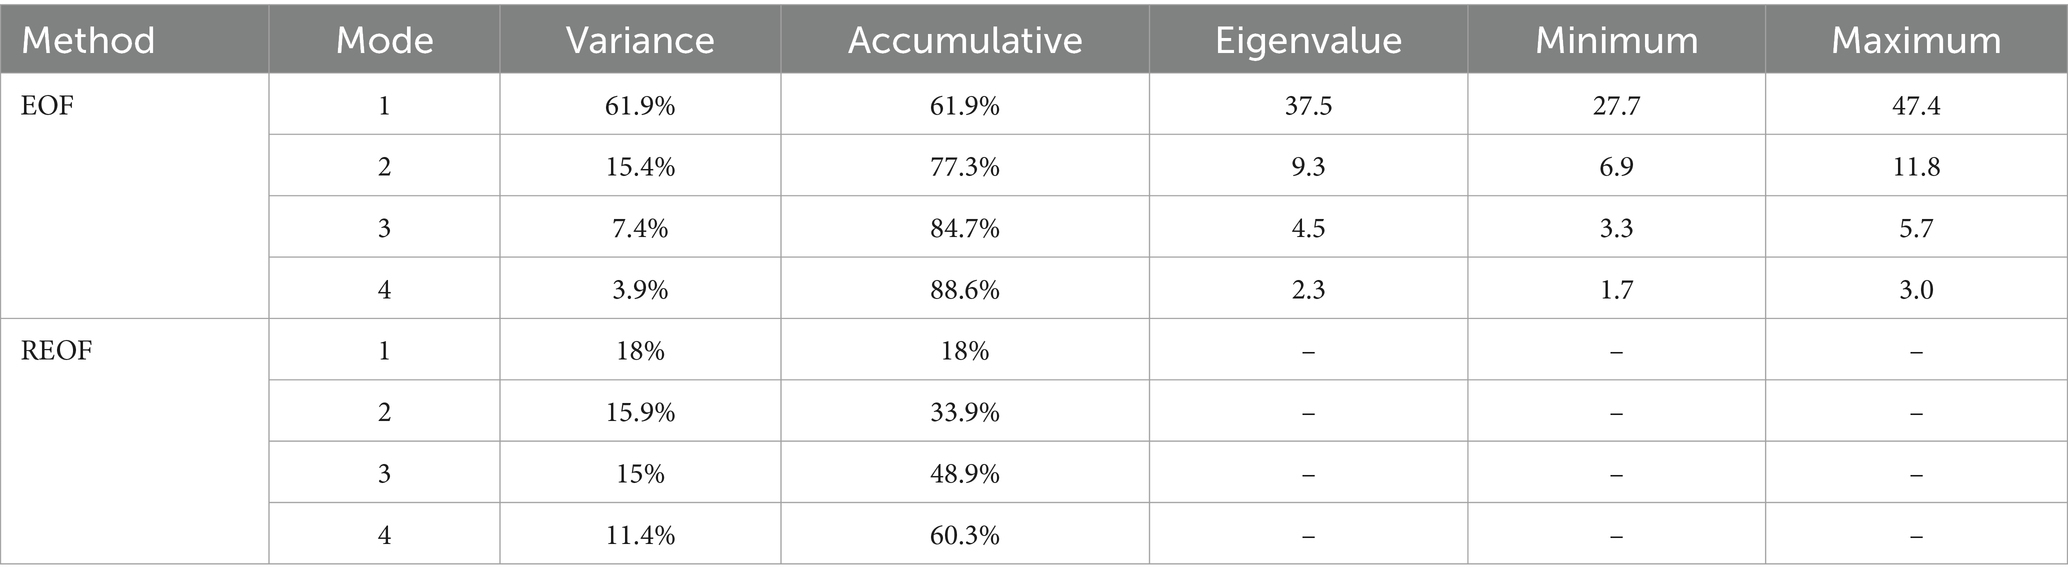
Table 3. EOF and REOF indicators (variance contribution rate, cumulative variance contribution rate, eigenvalue, upper limit of eigenvalue, lower limit of eigenvalue).
The analysis presented in Table 3 reveals that the variance contribution rates for each mode in REOF results exhibit a more uniform distribution compared to those derived from EOF analysis. Specifically, the cumulative variance contribution rate for the first four EOF modes is 88.65%, whereas the corresponding rate for the first four REOF modes is significantly lower at 60.3%. Within the REOF analysis, the first mode accounts for the highest variance contribution at 18%, indicating that it explains 18% of the spatial variation in regional maximum temperatures, which represents the predominant form of spatial variation in maximum temperatures observed in July. The variance contributions of the second, third, and fourth modes are 15.9, 15, and 11.4%, respectively, demonstrating a gradual decline.
To visually represent the disparities in July maximum temperature variations across different regions, the Kriging interpolation method was employed to interpolate the modal data for each station within the study area. Given that the REOF results facilitate a more concentrated distribution of high load values compared to EOF, the modal data utilized for interpolation at each station were exclusively derived from the REOF analysis. The interpolation outcomes, as illustrated in Figure 3, reveal the presence of both positive and negative regions for the load values of the first four modes within the study area, indicating notable differences in July maximum temperature variations across various regions for each mode.
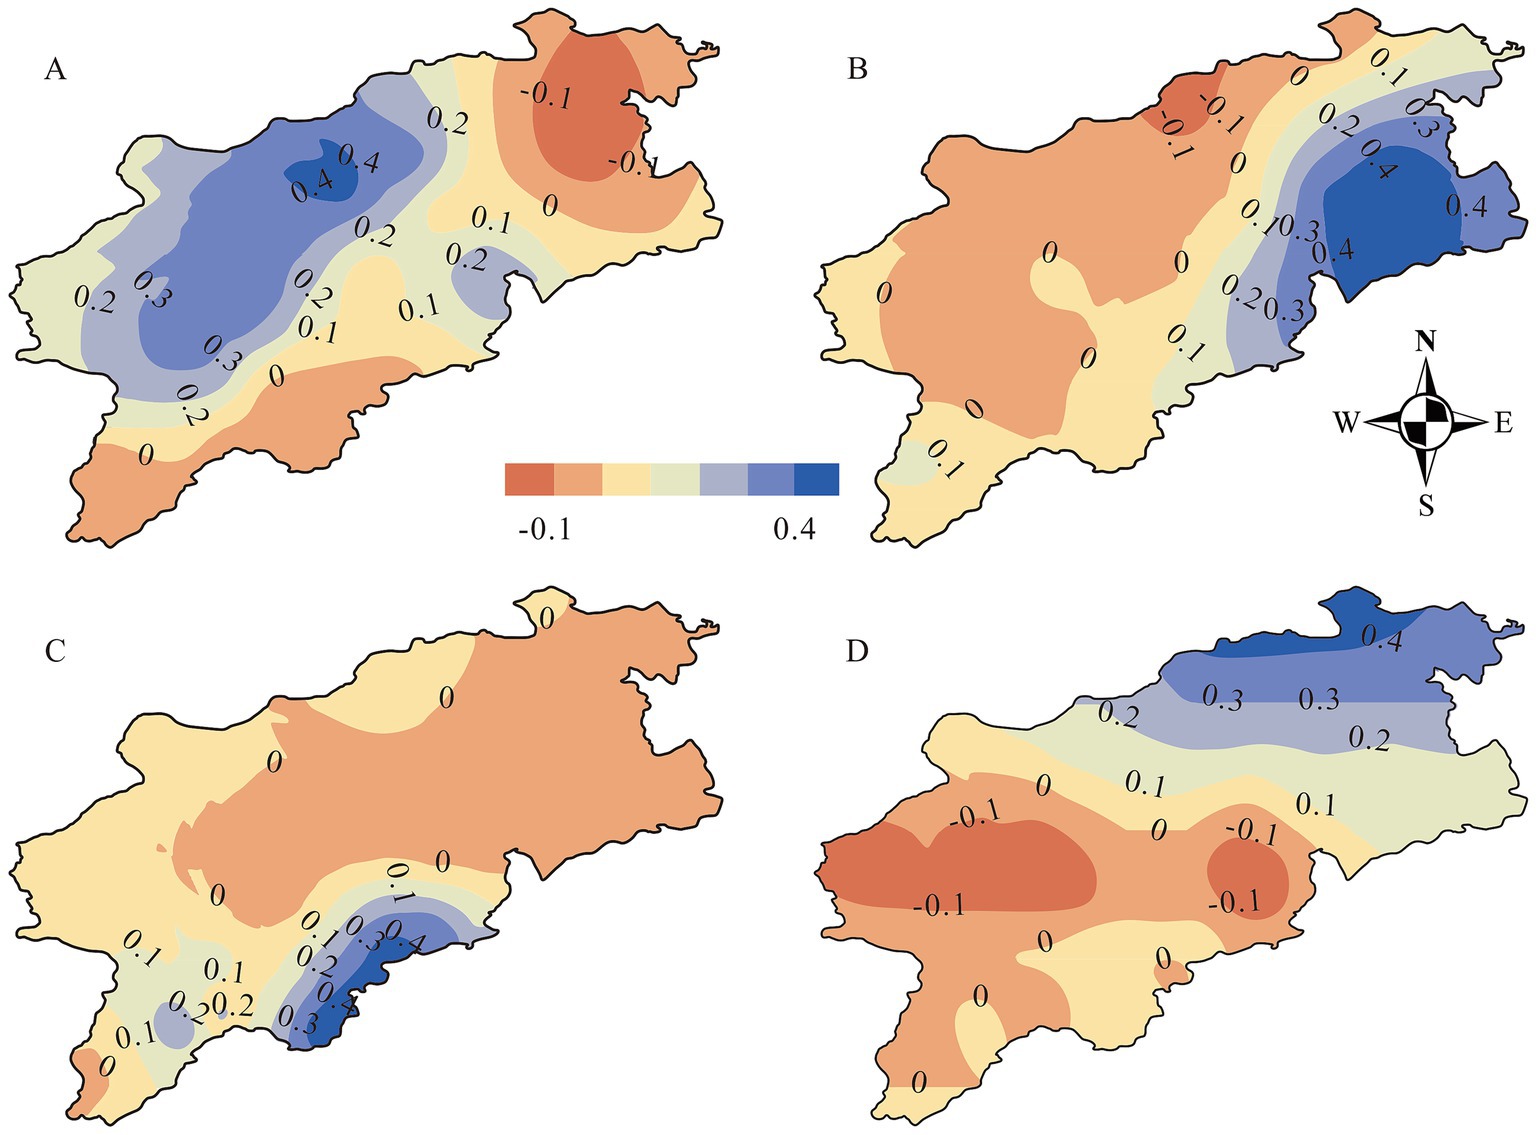
Figure 3. The analysis of maximum temperatures in July for the region, based on REOF, reveals four primary modes. (A) Suggests that when temperatures rise in the west there is a decrease in the north. (B) Indicates that when temperatures rise in the east, there is a decrease in the west. (C) Highlights that temperature variations within the study area exhibit consistent patterns. Lastly, (D) demonstrates that when temperatures rise in the north, there is a decrease in the south.
The high load value region for the first mode is predominantly situated in the western part of the study area, encompassing most of Inner Mongolia, suggesting that the variation in July maximum temperatures is primarily influenced by this western region (Figure 3A). Conversely, the high load value region for the second mode is located in the eastern part of the study area, which includes portions of Hebei and Inner Mongolia (Figure 3B). The third mode’s high load value region is found in the southern part of the study area, specifically in areas of Beijing, Hebei, and Shanxi (Figure 3C), while the fourth mode’s high load value region is concentrated in the northern part of the study area, particularly in Tongliao and the Xingan League (Figure 3D).
Based on the distribution of high load values across the four modes, the variations in July maximum temperatures within the study area can be categorized into four distinct regions: eastern, western, southern, and northern (Figure 4). This categorization facilitates a more nuanced discussion regarding the differences in temperature variations across these subdivisions.
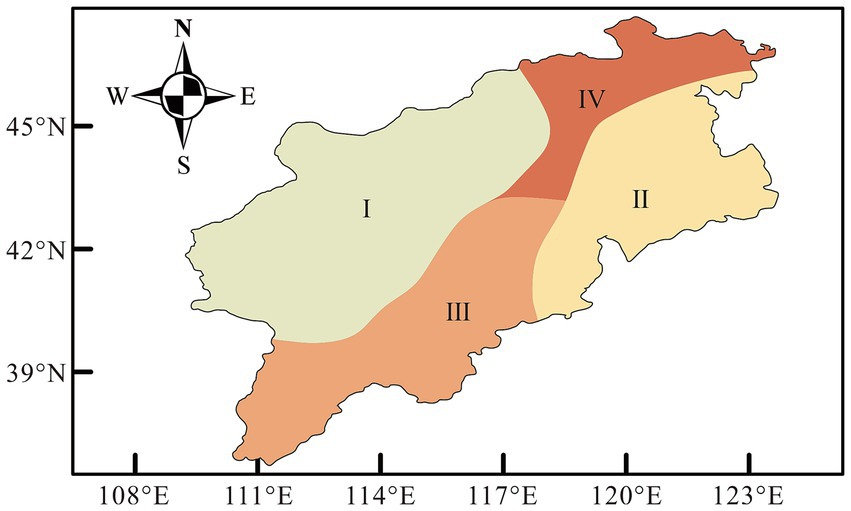
Figure 4. According to the distribution area of REOF high load value, the study area is divided into different temperature variation areas: east, south, west and north.
A linear equation was developed using tree-ring chronologies as the independent variable and maximum July temperatures recorded at various weather stations as the dependent variable, employing stepwise regression analysis. The chronologies used for reconstructing July maximum temperatures at each station spanned the period from 1845 to 2002. As indicated in Table 4, the reconstruction outcomes for all stations, with the exception of WTS, were satisfactory. Consequently, the temperature reconstruction series for WTS was excluded, and the reconstruction series for the remaining 28 weather stations were aggregated to create a regional series of July maximum temperatures for the years 1845 to 2002, and the results of the sign test further confirmed the reliability of the reconstruction (30+/132−, p < 0.05).
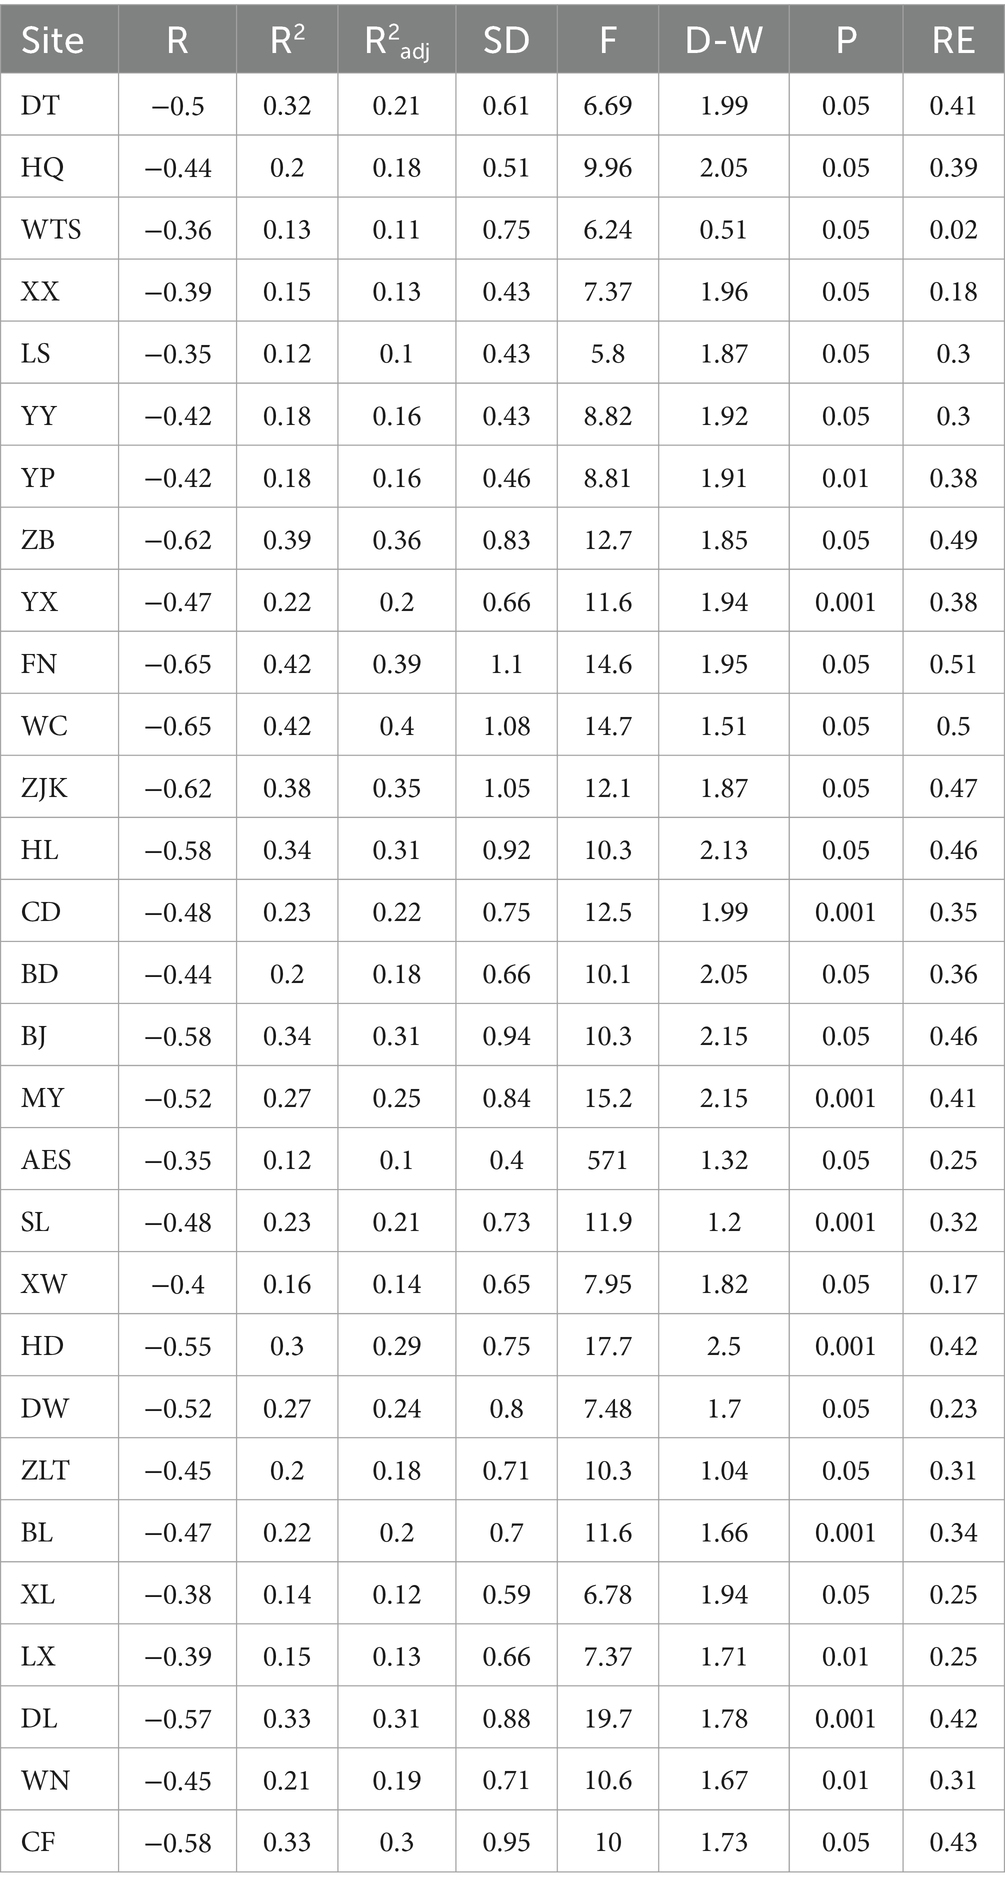
Table 4. Indexes of the maximum temperature reconstruction equation for different meteorological stations in July.
To investigate the disparities in the spatial distribution patterns of maximum temperatures in July between the reconstructed series and the observed series, a REOF analysis was conducted on the reconstructed dataset spanning from 1845 to 2002, accompanied by spatial interpolation (Figure 5). The results from the North test indicate that the first two modes of the reconstructed series are statistically significant. A comparative analysis reveals that the spatial distribution patterns of July maximum temperatures during both the observed and reconstructed periods exhibit notable similarities. Specifically, the regions of high values in the first mode loading of the reconstructed series closely correspond to those found in the second and fourth modes of the observed period; however, the range of high values in the reconstructed period is more extensive, with these regions extending further south within the study area. Furthermore, the second mode of the reconstructed series shows some resemblance to the first and third modes of the observed period, particularly regarding the high-value region located in the central area, which is reflected in the second mode of the reconstructed dataset.
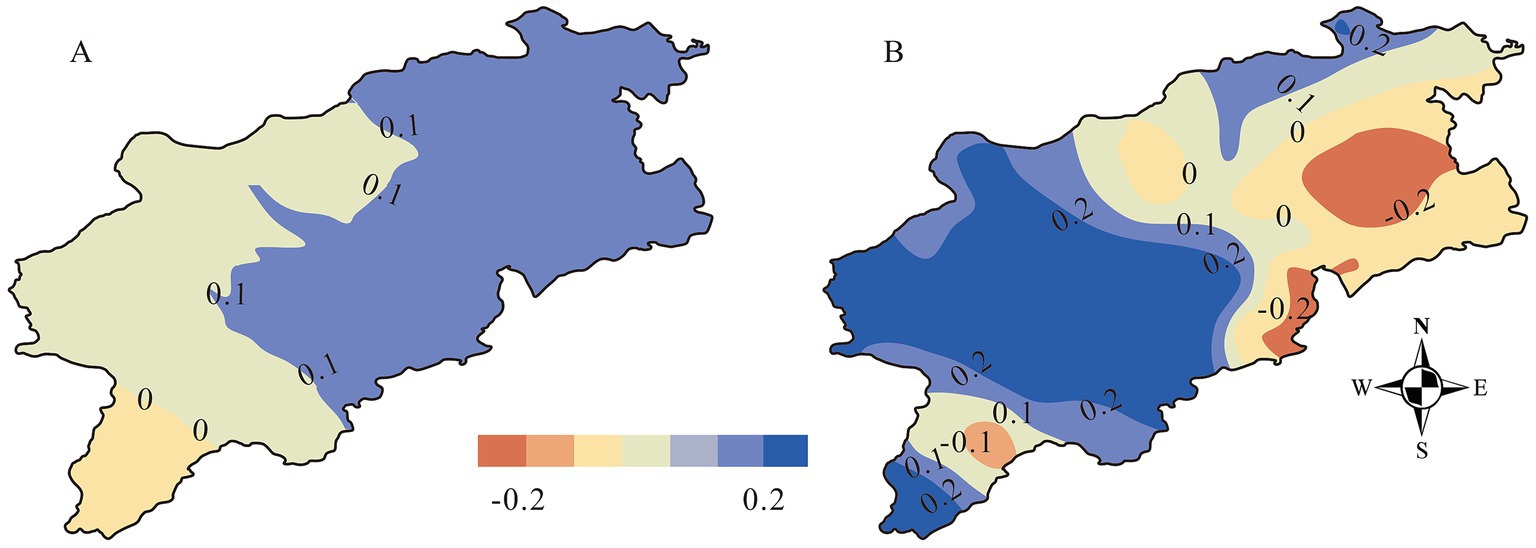
Figure 5. Based on the reconstructed temperature sequence, REOF is used to decompose it into two modes, where (A) indicates that the regional temperature changes are consistent, and the temperature rise in the northern region is the most significant. (B) Means that when the north heats up, the south cools to a certain extent.
The primary reason for the observed discrepancy lies in the temporal scales utilized in the two studies to assess spatial variations in temperature. Specifically, the observation period for the spatial distribution of maximum temperatures in July spans from 1960 to 2002, whereas the reconstruction period extends from 1845 to 2002. The results of REOF analysis in both studies reveal significant modes of spatial temperature distribution that correspond to the conditions prevalent within their respective temporal frameworks. The differences identified between the two studies suggest that the predominant patterns of temperature change in the study area are influenced by the varying time scales employed. This variation is not attributable to a diminished reliability in temperature reconstructions; rather, it reflects the nuanced differences in the dominant patterns of temperature change and the geographical areas examined across different temporal scales. This is further illustrated by the fact that, while both studies indicate a prevailing warming trend within their respective time frames, the intensity of warming exhibits slight regional variations both before and after the measurement period.
The reconstructed temperature series reveals significant fluctuations in the maximum July temperatures within the study area from the mid-19th century to the mid-20th century, culminating in a gradual increase by the end of the 20th century. The average maximum temperature recorded in July throughout the reconstruction period was 28.2°C, with a peak of 29.4°C and a trough of 26.9°C, resulting in a temperature variability range of 2.5°C. To analyze the inter annual variations of the reconstructed series, the mean temperature and standard deviation were employed to categorize years into warm, cold, and normal classifications based on annual temperature levels. Specifically, a year was classified as warm if T > Tmean + σ, as cold if T < Tmean - σ, and as normal for all other instances (Bao et al., 2011; Zhang et al., 2013). The findings indicate that between 1845 and 2002, there were 27 warm years and 28 cold years, representing 17.1 and 17.7% of the total years, respectively, suggesting a relatively balanced occurrence of warm and cold years. Normal years constituted 65.2% of the reconstruction period, indicating a degree of stability in the maximum July temperatures.
Furthermore, to evaluate the incidence of extreme temperatures, thresholds were established whereby T > Tmean +1.5σ was designated as an extreme warm year, and T < Tmean - 1.5σ as an extreme cold year. The analysis identified 10 extreme warm years and 9 extreme cold years, accounting for 37 and 32.1% of the warm and cold years, respectively, as illustrated in Figure 6. Notably, extreme high temperatures were predominantly observed in the 20th century, whereas extreme low temperatures were primarily recorded in the 19th century, indicating a trend of gradual temperature increase. The 11-year moving average of the reconstructed series highlights two distinct cold periods and two warm periods throughout the reconstruction timeline, characterized by alternating distributions of temperature extremes. The warm periods occurred from 1856 to 1870 and from 1883 to 1952, while the cold periods spanned from 1871 to 1882 and from 1953 to 1996. The duration of warm periods exceeded that of cold periods, with the longest warm period lasting 70 years and averaging 28.38°C, in contrast to the longest cold period, which lasted 44 years with an average temperature of 28.05°C. Within each identified cold and warm period, fluctuations in temperature were observed, reflecting phases of both increase and decrease.
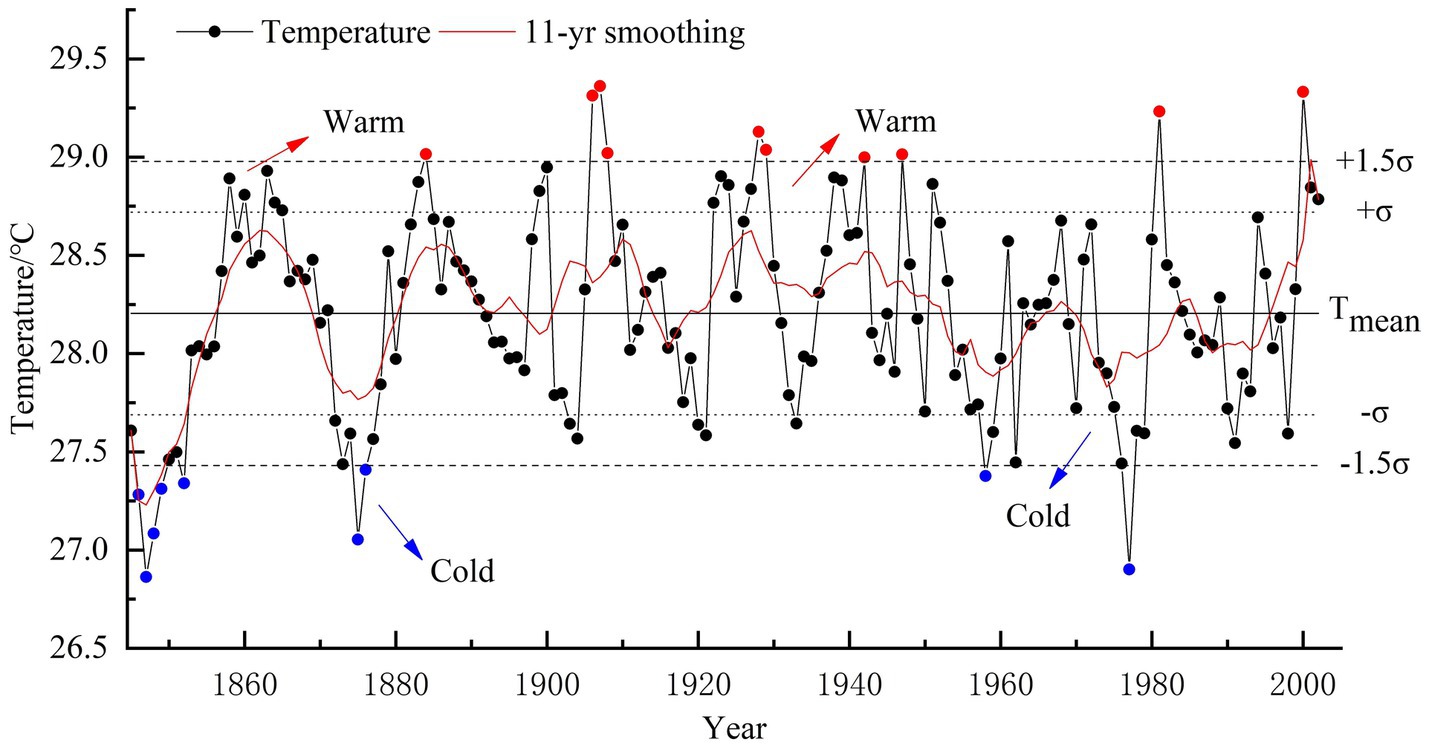
Figure 6. Extreme warm years and extremely cold years based on temperature mean and standard deviation, where red represents extremely warm years and blue represents extremely cold years.
Given the variability in the spatial distribution of average July temperatures within the study area, the reconstructed temperature series from various meteorological stations were categorized based on the previously mentioned zoning results, the temperature reconstruction series for distinct regions were computed independently. As illustrated in Figure 7, the fourth area, located in the northern part of the study area, exhibits the lowest temperature values, followed by the first area. The second and third areas demonstrate comparable maximum temperatures, both exceeding 31°C. If 31°C is regarded as the threshold for extreme high temperatures, instances of such extremes were recorded once in the second area and twice in the third area. Furthermore, the annual average temperatures for the second and third area were determined, revealing that the third area’s annual average temperature (29.67°C) surpasses that of the second area (28.75°C). The observed temperature discrepancies across the areas can be attributed to variations in elevation and latitude.
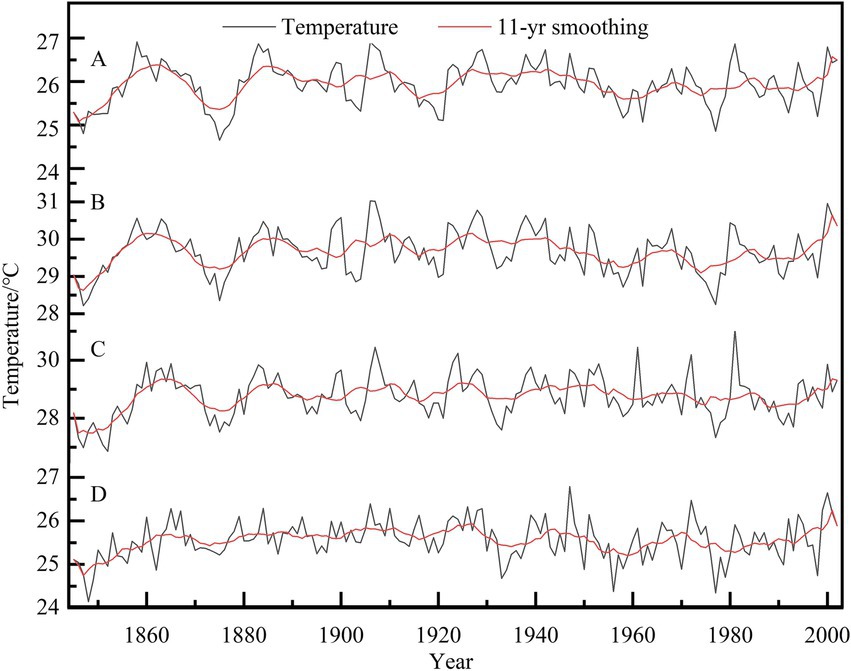
Figure 7. Temperature series of four regions based on REOF partitioning results, where A is the first area, B is the second area, C is the third area, and D is the fourth area.
From a latitudinal perspective, the fourth area, situated in the northern part of the study area, possesses higher latitude than the other three areas, resulting in reduced total solar radiation and consequently lower temperatures. In contrast, the southern part, characterized by lower latitude, receives greater solar radiation, leading to relatively elevated temperatures. Figure 7 further illustrates a notable temperature disparity between the first and second areas, with the latter exhibiting significantly higher temperatures. When latitude is held constant, elevation plays a critical role in influencing temperature. The first area, located in the eastern part of the study area, encompasses the Taihang Mountains and the Greater Khingan Range, whereas the second area is positioned in a flat coastal region. The elevation gradient contributes to the temperature differential, resulting in lower temperatures in the first area compared to the second area. Regarding temperature variation and trends, with the exception of the second area, the temperature fluctuations in the remaining three areas are relatively similar, with maximum and minimum temperature differences ranging from 2.26°C to 2.81°C. Various regions exhibit analogous temperature variation trends in localized areas. From the years 1850, 1875, 1920, and into the period following 1995, the temperature reconstruction series across all four areas indicates a discernible upward trend. Notably, the temperature increase in the western, eastern, and southern regions of the study area is markedly greater than that observed in the northern region. However, around 1930, the temperature decline in the northern region was more pronounced than in the other three areas, suggesting that the overall temperature change trend in the region aligns with that of the preceding three areas. This finding implies that, relative to warming, the cooling effect in the northern part of the study area is more significant, while the other three areas display comparable intensities of warming and cooling in the short term, with temperature changes in the region predominantly influenced by the first three areas. Long-term temperature trends indicate a general increase across different areas, with the second area exhibiting the most substantial upward trend, quantified at 0.02°C/10a.
This study utilizes CRU grid point data to assess the spatial representative of the reconstructed maximum temperature sequence within the designated study area. The grid point data employed is CRU TS 4.08 (Land), characterized by a resolution of 0.5° × 0.5°. The analysis encompasses the common temporal span of both measured and reconstructed data. As illustrated in Figure 8, the spatial correlation outcomes of the reconstructed sequence closely align with those derived from the measured data, indicating that both datasets effectively capture the temperature variation characteristics prevalent in North China. Notably, the spatial correlation coefficient associated with the measured data exceeds that of the reconstructed data, and the range of spatial correlation is more extensive. Furthermore, the high-value regions of the spatial correlation coefficient for the reconstructed sequence adequately encompass the study area and extend northward into Mongolia, reflecting the temperature variation conditions in certain regions of southern Mongolia. This finding suggests that the reconstructed sequence possesses substantial spatial representative, thereby affirming the reliability of the reconstruction results.
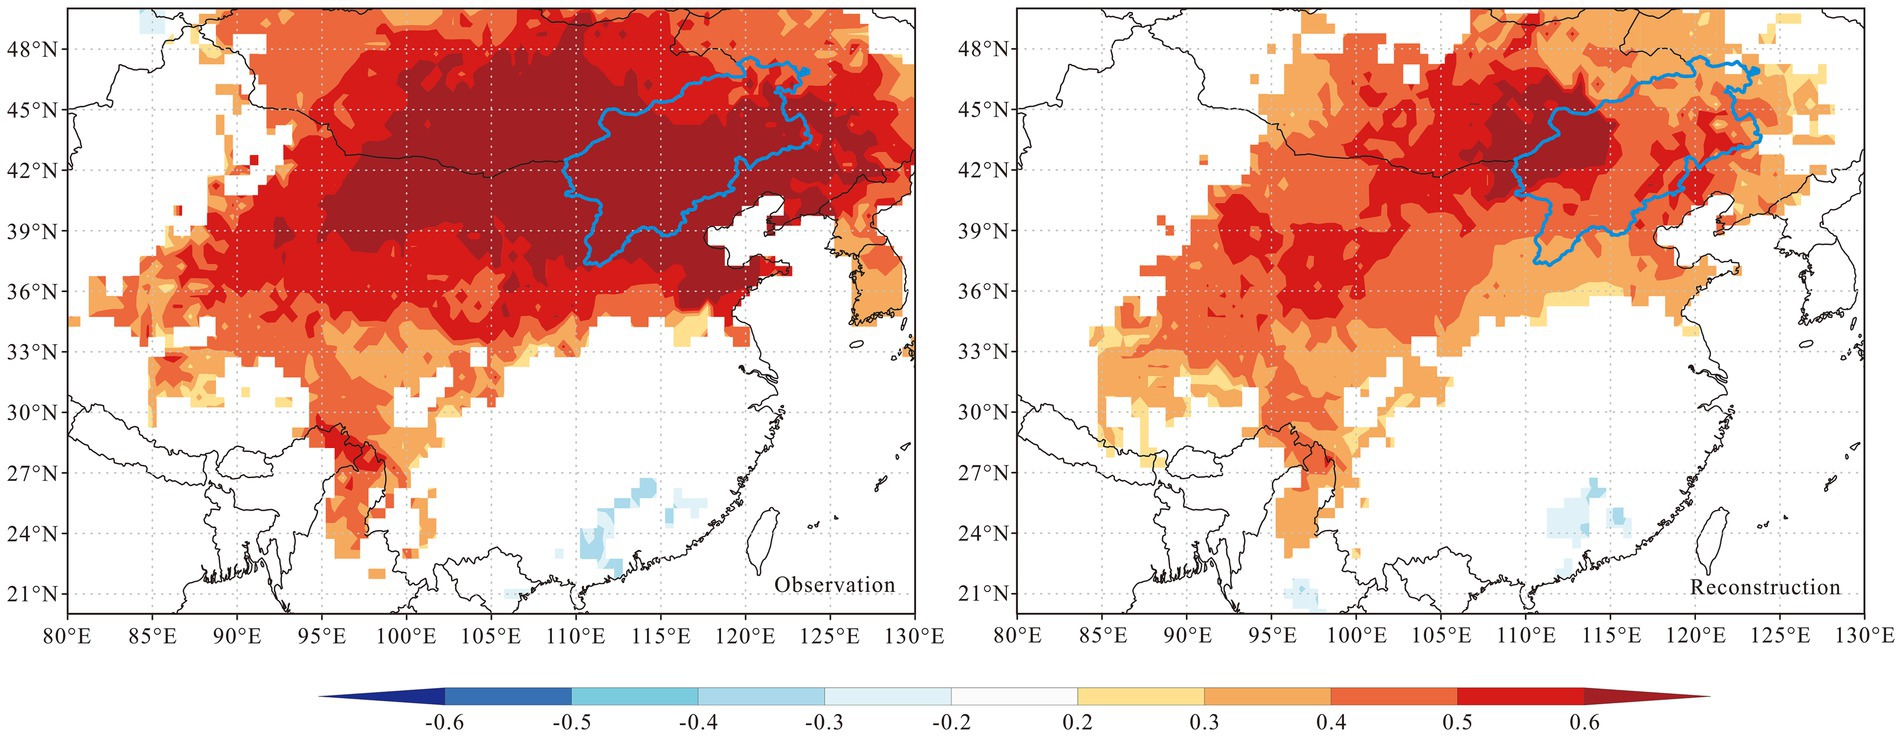
Figure 8. Spatial correlation analysis between the observed maximum temperature in July and the reconstructed maximum temperature in July and CRU TS 4.08 grid data.
In order to investigate the periodicity of the reconstructed maximum temperature series, a Morlet wavelet analysis was performed (Figure 9). The results of wavelet analysis show that the maximum temperature reconstruction series has a quasi-periodic change of 1–3a, 2–6a, 7–11a and 13–18a. Notably, the 1–3 year quasi-periodic variations are observed during the periods of 1944–1946 and 1961–1963, while the 2–6 year variations are evident from 1945 to 1955. The 7–11 year quasi-periodic variations predominantly occur between 1890 and 1917, and the 13–18 year variations are identified within the time frame of 1920 to 1944.
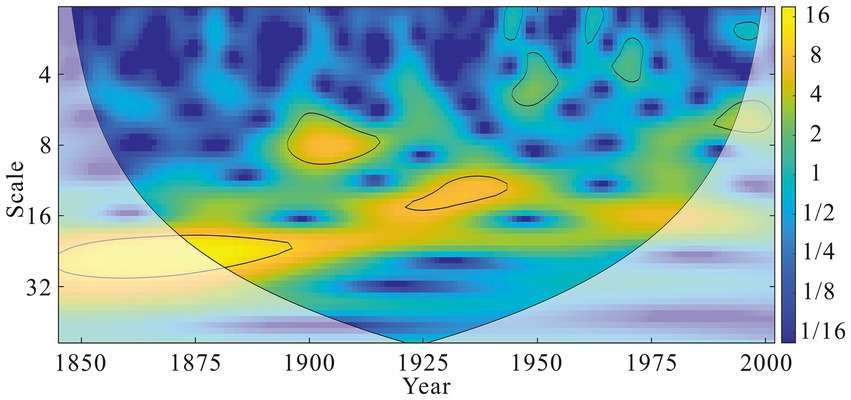
Figure 9. Wavelet analysis of the reconstructed series of maximum temperature in July and Wavelet Variance of reconstructed sequence (1845–2002).
Accurate representation of historical temperature fluctuations in the study area is contingent upon the reliability of reconstructed sequences. The analysis of various indicators derived from the reconstruction equations of the aforementioned meteorological stations reveals that, with the exception of the WTS meteorological station, the reconstruction equations for all other stations demonstrate reliability. Furthermore, the results of the sign test indicate that the regional temperature change series, synthesized from the temperature reconstruction sequences of each station, successfully passed the significance test.
To investigate the relationship between the reconstructed sequences and the instrumental measurement sequences, a comparative analysis was conducted for the overlapping time period of 1960–2002 (Figure 10). Correlation analysis revealed a highly significant positive correlation between the temperature reconstruction sequence and the instrumental measurement sequence (p < 0.05), with a correlation coefficient of 0.65. This finding suggests a consistent pattern in their variations, as evidenced by the alignment of years exhibiting extreme maximum and minimum temperatures in both sequences. Additionally, linear fitting analyses were performed on both the temperature reconstruction sequence and the instrumental measurement sequence to assess the similarities and differences in their trends throughout the entire time frame. The results of these analyses indicate that both sequences exhibit a discernible trend of increasing temperatures during the same period. In conclusion, based on a comprehensive evaluation of various indicators, it is determined that the regional temperature change series, derived from the temperature reconstruction sequences of each station, is reliable and effectively reflects regional temperature variations.
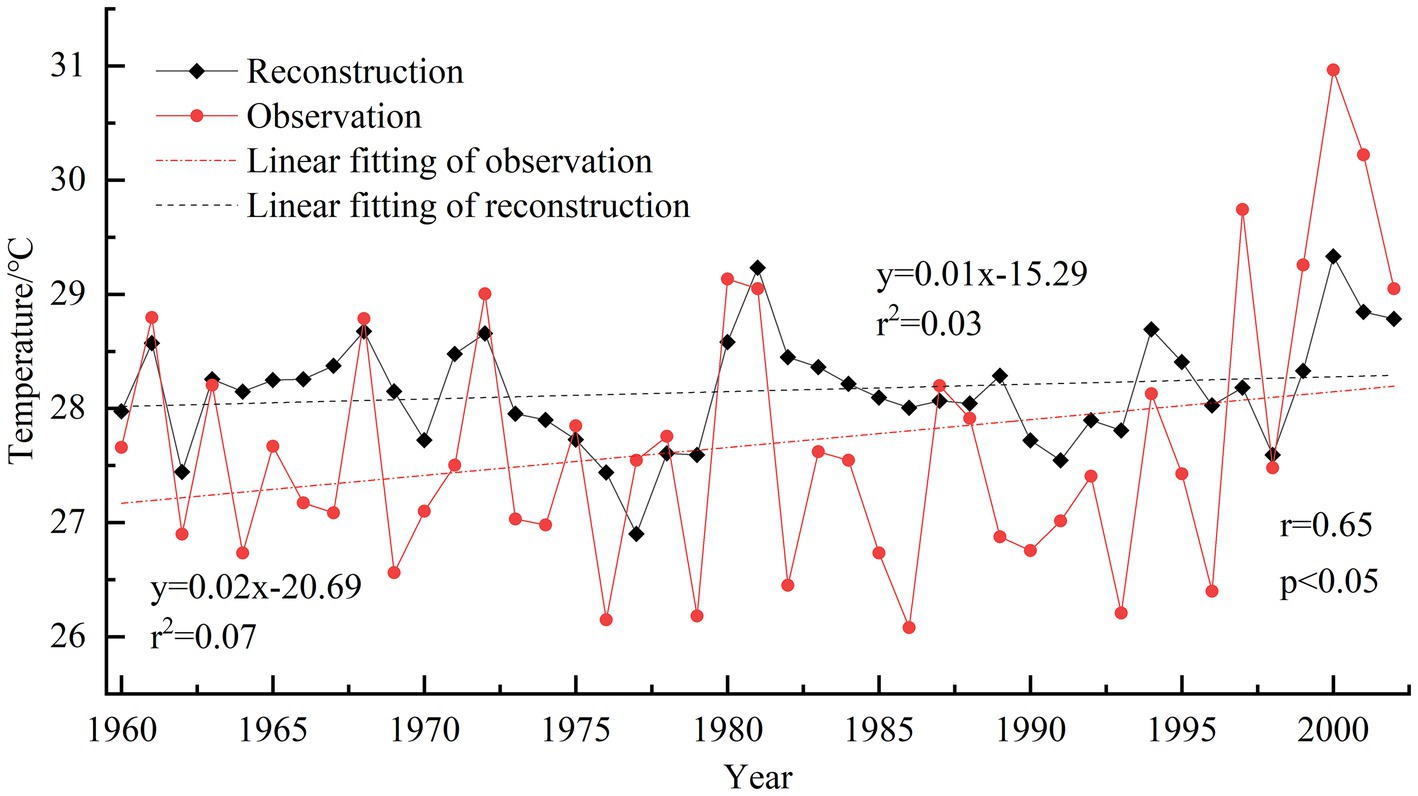
Figure 10. The comparison of annual temperatures between the reconstructed maximum temperature sequence and the July temperature data from 1960 to 2002, along with their linear fitting results.
In the preceding analysis of the relationship between tree ring width and climatic variables, the tree ring chronologies demonstrated a significant correlation with temperature readings from various meteorological stations. Specifically, a negative correlation was observed with the average, maximum, and minimum temperatures recorded from May to July, with the most pronounced negative correlation occurring with the maximum temperature in July. The relationship between tree ring width chronologies and precipitation shows a relatively weak correlation, marked by a slight positive association with precipitation during certain summer months. The tree ring width chronology shows a highly significant positive correlation with the PDSI, especially concerning summer conditions. This correlation reaches its peak in July of the corresponding year. This finding suggests that elevated summer temperatures are the primary factor constraining the radial growth of trees in North China (Tian et al., 2009; Cai et al., 2010), an increase in precipitation may serve to partially mitigate the moisture deficit resulting from elevated temperatures, Reduce soil dryness, thereby promoting tree growth (Hou et al., 2024; Wang et al., 2024). This conclusion diverges from earlier research regarding the determinants of tree growth in the region (Liu et al., 2005), which posited that tree radial growth is positively correlated with both precipitation and temperature, particularly during the summer months when favorable temperatures and adequate precipitation facilitate growth (Fang et al., 2012; He et al., 2023).
This result is the same as the correlation with precipitation in this paper, while the correlation with temperature is different. It is essential to recognize that the influence of temperature on the radial growth of trees is multifaceted, with its effects on the development of growth rings differing across various climatic and temperature contexts (Büntgen and Esper, 2024), On the one hand, the growth and survival of any plant species are governed by the principle of ecological amplitude, which indicates that there exists an optimal range of temperatures conducive to tree growth, with both excessively high and low temperatures serving as impediments (Shikangalah et al., 2022). The detrimental effects of extreme temperatures on tree growth are primarily evident in scenarios of elevated temperatures, which can lead to increased respiration rates, stomatal closure, diminished photosynthesis, and reduced carbohydrate reserves, all of which adversely affect radial growth (Huang et al., 2010; Zhang et al., 2010; Zhang et al., 2013). Meanwhile, excessively low temperatures fail to fulfill the thermal requirements necessary for tree growth, thereby also inhibiting development. On the other hand, temperature influences not only tree growth directly but also affects the availability of water to plants by altering soil moisture levels, which can subsequently diminish organic matter storage.
From a physiological standpoint, existing literature has indicated that elevated temperatures can impair plant growth through the mechanism of drought stress (Charlotte et al., 2021). The incidence and intensity of drought are influenced by both temperature and precipitation levels. In scenarios where precipitation is adequate, a significant increase in temperature can lead to heightened evaporation rates, reduced soil moisture, and exacerbated drought conditions. Conversely, in conditions of insufficient precipitation, drought stress exerts a more pronounced effect on tree growth. During the period from May to July, prior to the onset of the rainy season in North China, trees are in their active growth phase and exhibit a heightened demand for water. As temperatures progressively rise from late spring to early summer, there is an increase in water evaporation and plant transpiration. By July, temperatures peak, resulting in the most severe drought stress for plants, which correlates with the most significant negative relationship between tree ring width chronologies and temperature (Zeng et al., 2019).
In light of the distribution and variability characteristics of warm and cold periods in North China, the reconstructed temperature series were analyzed in comparison to temperature series from other regions of China to assess the spatial representative of the reconstructed data. The findings reveal that the temperature series in North China exhibit similar variability patterns to those reconstructed from tree ring width and phenological data in Central China (Bao et al., 2011; Zheng et al., 2015). Notably, both regions experienced a brief cold period during the 1860s; however, the onset of this cold period in Central China occurred earlier and persisted for a longer duration than in North China.
Phenological data from Central China suggest that following the conclusion of the cold period, temperatures gradually rose, resulting in an extended warm phase that continued until the mid-1940s. This observation aligns with the longest warm period identified in this study’s reconstruction, which spans from 1883 to 1952. Additionally, temperature reconstructions from the Southwest region (Peng et al., 2023) and the Qinling area in the Northwest region (Hou et al., 2017) also indicate a relatively cold phase during the mid to late 20th century, corroborating the findings from North and Central China. This evidence suggests the existence of a low-temperature phase across China in the mid-20th century, during which temperature fluctuations in various regions may have been influenced by similar factors. Furthermore, short-term temperature variations indicate a periodic increase in temperature during the cold period in North China from 1953 to 1996, which is reflected in the brief warming observed in the 1970s in the Qinling area. This suggests that the high-temperature reconstruction series exhibits a strong correlation with the temperature reconstruction series from adjacent regions.
ENSO cycle has a duration ranging from 2–7a, with an average length of 3–4 years. This duration aligns with the periodic fluctuations of 1–3a and 2–6a observed in the reconstructed temperature series (Rasmusson et al., 1990). Notably, the pronounced warm phase associated with ENSO anomalies during 1982–1983 corresponds to the rapid temperature increase documented post-1982 in this study (Rittenour et al., 2000). This finding underscores the significance of ENSO as a determinant of temperature variations in the examined region, corroborated by similar observations in the Qinling Mountains (Wang S. J. et al., 2022), Yunnan (Zhao et al., 2021), Northeast China (Yu et al., 2018), and South China (Zhao et al., 2017).
Cross-wavelet analysis of ENSO (Fang et al., 2019) reveals a notable correlation around the year 1900, consistent with the outcomes of wavelet analysis (Figure 11). Additionally, the solar cycle, characterized by sunspot activity, spans approximately 11 years, while the reconstructed series demonstrates quasi-periodic variations of 7–11a, indicating that sunspot activity may influence maximum temperature fluctuations in the study area (Xiao et al., 2015). Cross-wavelet analysis further reveals a significant correlation between the reconstructed series and the sunspot index (see text footnote 3) post-1900, suggesting that solar activity constitutes another critical factor affecting temperature changes in the region. Given the indirect influence of sea surface temperature on terrestrial temperature, PDO index was incorporated into the cross-wavelet analysis with the temperature reconstruction series (Fang et al., 2019). The PDO index exhibits a cycle of approximately 20 years, which aligns with the quasi-periods of 13–18a, identified in prior wavelet analyses, indicating that the PDO may also play a role in influencing temperature changes in the study area (Li et al., 2024; Cai et al., 2024).
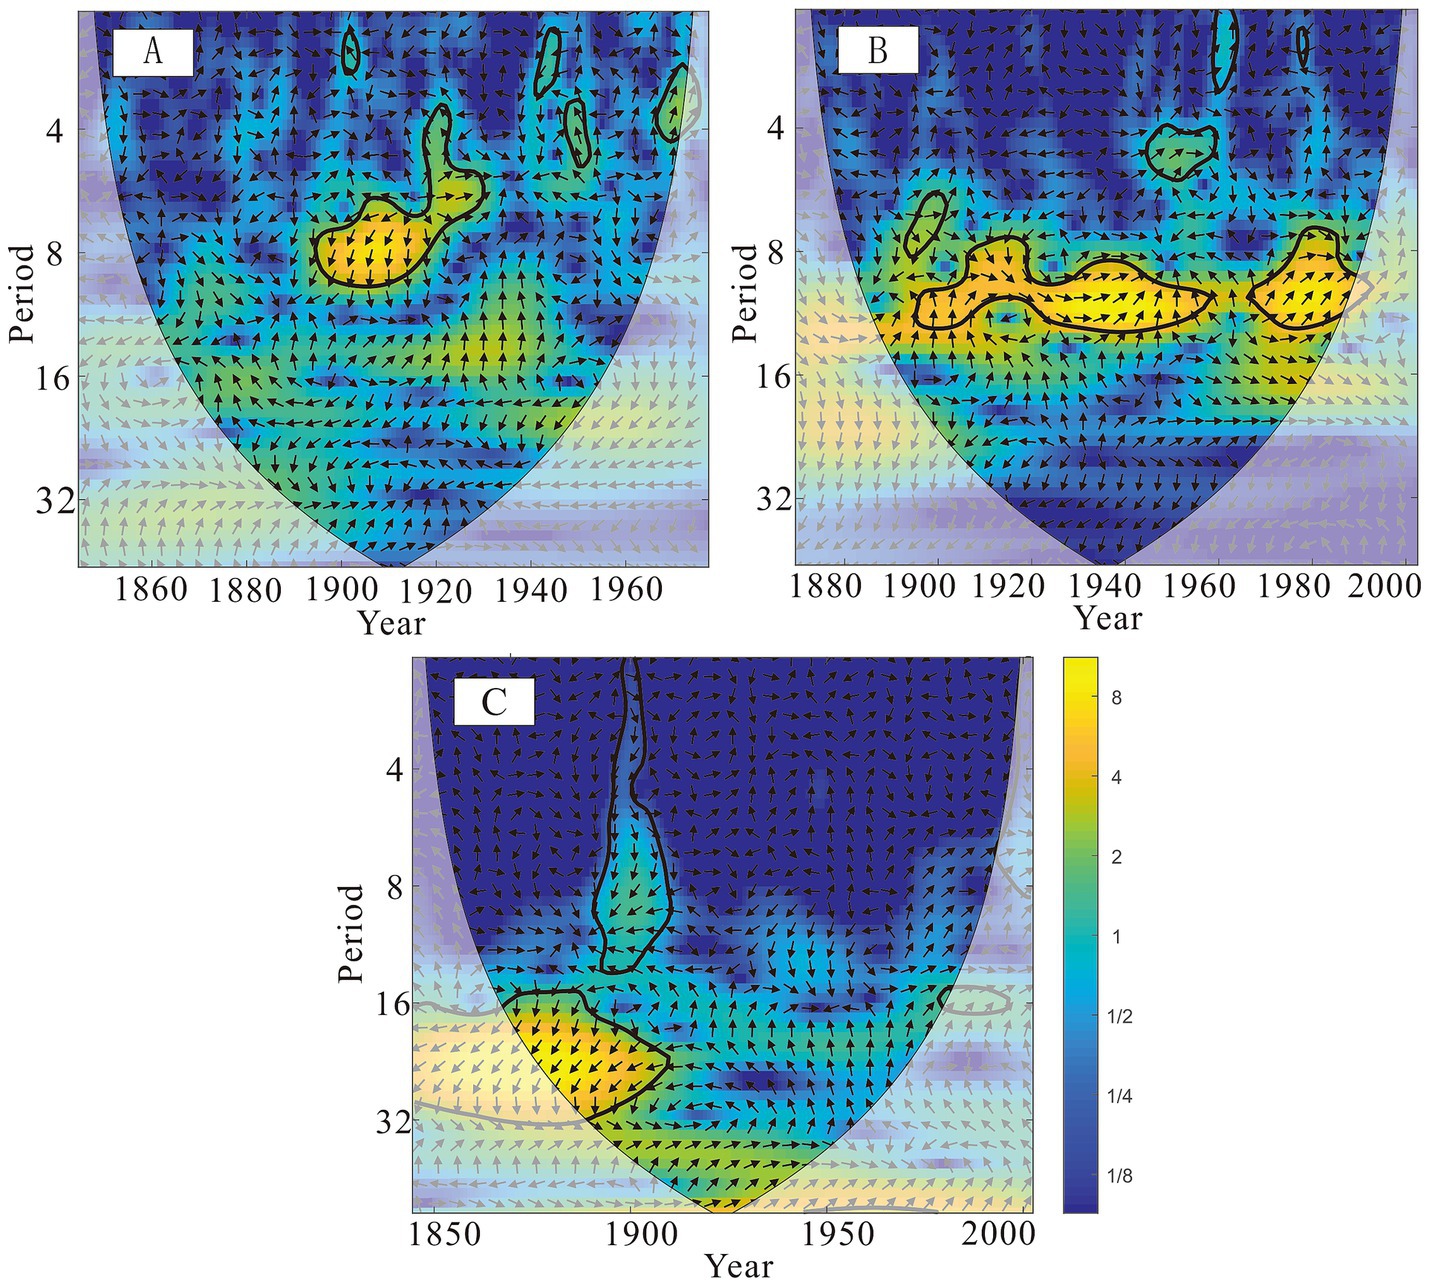
Figure 11. Cross wavelet analysis of temperature reconstruction sequence with ENSO (A), Sunspot (B) and PDO (C).
Correlation analysis indicates that the radial growth of trees in North China is primarily limited by summer temperatures, showing a weaker correlation with precipitation levels. Using these correlations, a spatial distribution of maximum temperatures for July in North China was delineated and reconstructed, revealing regional disparities in temperature fluctuations within the area, despite the observation of similar long-term temperature trends across various regions. The reconstructed temperature sequence in North China shows that in the past 158 years, there were 27 warm years and 28 cold years, and the temperature changes showed a gradual trend. Furthermore, the quasi-periodic fluctuations observed in the temperature reconstruction series during intervals of 1–3a, 2–6a, 7–11a, and 13–18a suggest that phenomena such as ENSO, Sunspot, and PDO exert an indirect influence on regional temperature dynamics.
The raw data supporting the conclusions of this article will be made available by the authors, without undue reservation.
QL: Data curation, Methodology, Visualization, Writing – original draft, Writing – review & editing. SL: Funding acquisition, Methodology, Supervision, Writing – review & editing. JW: Methodology, Resources, Software, Writing – review & editing. YH: Formal analysis, Software, Supervision, Writing – review & editing. YG: Methodology, Supervision, Writing – review & editing. YZ: Methodology, Software, Writing – review & editing. SZ: Investigation, Software, Writing – review & editing. MD: Software, Writing – review & editing.
The author(s) declare that financial support was received for the research and/or publication of this article. This research was supported by the National Natural Science Foundation of China (project approval number: 42371072) under the title: Alpine timberline fluctuations and the response to climate change at centennial to millennial time scales in the Qinling Mountains.
The authors declare that the research was conducted in the absence of any commercial or financial relationships that could be construed as a potential conflict of interest.
The authors declare that no Gen AI was used in the creation of this manuscript.
All claims expressed in this article are solely those of the authors and do not necessarily represent those of their affiliated organizations, or those of the publisher, the editors and the reviewers. Any product that may be evaluated in this article, or claim that may be made by its manufacturer, is not guaranteed or endorsed by the publisher.
Adam, K., Chen, F., Zhang, H. L., Sidra, S., Ali, H. E., Yue, W. P., et al. (2024). A warm-season drought reconstruction in Central-Northern Pakistan inferred from tree rings since 1670 CE and its possible climatic mechanism. Clim. Chang. 177:33. doi: 10.1007/s10584-024-03688-4
Alba, S. V., Julio, C. J., Enrique, M. T., Antonio, G., Michele, C., Esteban, A., et al. (2021). Snow dynamics influence tree growth by controlling soil temperature in mountain pine forests. Agric. For. Meteorol. 296:108205. doi: 10.1016/j.agrformet.2020.108205
Asad, F., Adil, M., Zhu, H. F., Büntgen, U., Hamayun, M., Alrefaei, A. F., et al. (2024). A tree ring-based spring temperature reconstruction for the Hindu Kush region in northern Pakistan. Trees Forests People 16:100541. doi: 10.1016/j.tfp.2024.100541
Bao, G., Liu, Y., and Hans, W. L. (2011). April–September mean maximum temperature inferred from Hailar pine (Pinus sylvestris var. mongolica) tree rings in the Hulunbuir region, Inner Mongolia, back to 1868AD. Palaeogeogr. Palaeoclimatol. Palaeoecol. 314, 162–172. doi: 10.1016/j.palaeo.2011.10.017
Bi, S. B., Qiu, X. K., Wang, G. J., Gong, Y. C., Wang, L. Y., and Xu, M. Y. (2021). Spatial distribution characteristics of drought disasters in Hunan Province of China from 1644 to 1911 based on EOF and REOF methods. Environ. Earth Sci. 80:16. doi: 10.1007/S12665-021-09867-1
Büntgen, U., and Esper, J. (2024). Physiological meaning of bimodal tree growth-climate response patterns. Int. J. Biometeorol. 68, 1897–1902. doi: 10.1007/s00484-024-02706-5
Cai, Q. F., and Liu, Y. (2012). Climatic response of three tree species growing at different elevations in the Lüliang Mountains of northern China. Dendrochronologia 31, 311–317. doi: 10.1016/j.dendro.2012.07.003
Cai, Q. F., and Liu, Y. (2013). The development of a tree-ring width chronology and the may-June mean temperature variability in Wulu Mountain, Shanxi province of North-China. Quaternary Sci. 33, 511–517. doi: 10.3969/j.issn.1001-7410.2013.03.11
Cai, Q. F., Liu, Y., Bao, G., Lei, Y., and Sun, B. (2010). Tree-ring-based may–July mean temperature history for Lüliang Mountains, China, since 1836. Chin. Sci. Bull. 55, 3008–3014. doi: 10.1007/s11434-010-3235-z
Cai, Q. F., Liu, Y., Zhang, H. Y., Song, H. M., Li, Q., Sun, C. F., et al. (2020). Evolution of the dry-wet variations since 1834 CE in the Lüliang Mountains, North China and its relationship with the Asian summer monsoon. Ecol. Indic. 121:107089. doi: 10.1016/j.ecolind.2020.107089
Cai, Q. F., Xie, M., Liu, Y., Fang, C. X., Hao, Z. X., Ren, M., et al. (2024). The influence of North Atlantic Sea surface temperature fluctuations on the climate of the Qinling-Bashan Mountains, China based on a 250 year tree-ring record. Palaeogeogr. Palaeoclimatol. Palaeoecol. 649:112320. doi: 10.1016/j.palaeo.2024.112320
Cao, H. H., Zhao, X. E., Chen, F., Wang, S. J., and Liu, X. H. (2021). Reconstructing January-June precipitation in southeastern Shanxi over the past 296 years inferred from tree-ring records of Pinus tabuliformis. Chin. J. Appl. Ecol. 32, 3618–3626. doi: 10.13287/j.1001-9332.202110.018
Charlotte, G., Blumröder, J. S., Douglas, S., and Ibisch, P. L. (2021). Quantifying the mitigation of temperature extremes by forests and wetlands in a temperate landscape. Eco. Inform. 66:101442. doi: 10.1016/j.ecoinf.2021.101442
Chen, P. (2021). Tree-ring records of dry and wet changes in Southeast Inner Mongolia in the past 150 years. Fujian Normal Univ. 438, 133–123. doi: 10.27019/d.cnki.gfjsu.2021.000221
Chen, J. J., Huang, R. F., Li, G. T., Hou, X. Y., Qin, Y., Zhang, G. S., et al. (2014). Radial growth characteristics of Ulmus pumila var. sabulosa in Otindag sand land, northern China. J. Beijing Forestry Univ. 36, 41–47. doi: 10.13332/j.cnki.jbfu.2014.06.010
Chen, Z. Z., Shi, J. J., Jia, C., Li, Y. X., Liu, J. C., Jin, H., et al. (2019). Response of radial growth of natural larch North China to climate change. Forest Res. Manage. 2, 60–146. doi: 10.13466/j.cnki.lyzygl.2019.02.009
Cook, E. R., Meko, D. M., Stahle, D. W., and Cleaveland, K. (1999). Drought reconstructions for the continental United States. J. Clim. 12, 1145–1162. doi: 10.1175/1520-0442(1999)012<1145:DRFTCU>2.0.CO;2
Cook, E. R., Seager, R., Kushnir, Y., Briffa, K. R., Büntgen, U., Frank, D., et al. (2015). Old world megadroughts and pluvials during the common era. J. Climatol. 1, e1500561–e1500569. doi: 10.1126/sciadv.1500561
Cui, M. X., He, X. Y., Chen, W., Chen, Z. J., Zhou, C. H., and Wu, T. (2008). Dendrochronology of Chinese pine in Mulan-Weichang, Hebei Province: a primary study. Chin. J. Appl. Ecol. 19, 2339–2345. doi: 10.13287/j.1001-9332.2008.0429
Fang, K. Y. (2010). Tree-ring records of climate change in Northwest China during the last 400 years. Lanzhou: Lanzhou University.
Fang, K. Y., Chen, D. L., Liisa, I., Leena, P., Lasse, H., Heikki, S., et al. (2019). Oceanic and atmospheric modes in the Pacific and Atlantic oceans since the little ice age (LIA): towards a synthesis. Quat. Sci. Rev. 215, 293–307. doi: 10.1016/j.quascirev.2019.05.014
Fang, K. Y., Gou, X. H., Chen, F. H., Li, Y. J., Zhang, F., and Kazmer, M. (2012). Tree growth and its association with climate between individual tree-ring series at three mountain ranges in north Central China. Dendrochronologia 30, 113–119. doi: 10.1016/j.dendro.2011.04.003
Gaire, N. P., Shah, S. K., Sharma, B., Mehrotra, N., Thapa, U. K., Fan, Z. X., et al. (2023). Spatial minimum temperature reconstruction over the last three centuries for eastern Nepal Himalaya based on tree rings of Larix griffithiana. Theor. Appl. Climatol. 152, 895–910. doi: 10.1007/s00704-023-04432-1
Guo, J. L., Ding, X. G., Gong, J. X., and Liu, N. (2015). Relationship between the growth and climate factors of larch in Mulan forest area. Hebei J. Forestr. Orchard Res. 30, 21–25. doi: 10.13320/j.cnki.hjfor.2015.0006
Guo, W. L., Shi, H. B., Ma, J. J., Zhang, Y. J., Wang, J., Shu, W. J., et al. (2013). Basic features of climate change in North China during 1961–2010. Adv. Clim. Chang. Res. 4, 73–83. doi: 10.3724/SP.J.1248.2013.073
Hannachi, A., Jolliffe, I. T., and Stephensonet, D. B. (2007). Empirical orthogonal functions and related techniques in atmospheric science: a review. Int. J. Climatol. 27, 1119–1152. doi: 10.1002/joc.1499
He, Y., Yu, Q. H., Wang, G. F., Hao, M., Fan, S., Hu, D. M., et al. (2023). Tree ring width responses of Pinus densiflora and Robinia pseudoacaciato climate variation in the mount tai area of northern China. Forests 14:2087. doi: 10.3390/f14102087
Hou, L., Li, S. H., Chen, L., Shi, A. R., Bai, H. Y., and Wang, J. (2017). Reconstruction of the historical temperature from February to April of the Qinling Mountains in recent 200 years. Geogr. Res. 36, 1428–1442. doi: 10.11821/dlyj201708003
Hou, T. Y., Zhao, X. E., Chen, F., Chen, Q. M., Wang, S. J., Hu, M., et al. (2024). Tree-ring-based reconstruction of the precipitation variability in the middle Taihang Mountains (1608–2021). Int. J. Climatol. 44, 871–886. doi: 10.1002/joc.8362
Huang, J. G., Tardif, J. C., Bergeron, Y., Denneler, B., Berninger, F., and Girardin, M. P. (2010). Radial growth response of four dominant boreal tree species to climate along a latitudinal gradient in the eastern Canadian boreal forest. Glob. Chang. Biol. 16, 711–731. doi: 10.1111/j.1365-2486.2009.01990.x
Ian, H., Timothy, O., Phil, J., and David, L. (2020). Version 4 of the CRU TS monthly high-resolution gridded multivariate climate dataset. Sci. Data 7:109. doi: 10.1038/s41597-020-0453-3
Jia, C., Guo, M. M., Wang, Q., Cui, L. Z., Guo, J. L., Chen, Z. Z., et al. (2022). Response of the radial growth of Larix principis-rupprechtii plantations and natural forests to climate change. J. Central South Univ. Forestr. Technol. 42, 120–128. doi: 10.14067/j.cnki.1673-923x.2022.01.015
Jiang, Q. B., Gao, L. S., Wang, X. M., and Zhao, X. H. (2012). Correlations between Meteiorological factors and tree-ring width index of Chinese pine (Pinus tubulaeformis) in Hunshandake Sandy area, China. Chin. J. Appl. Environ. Biol. 18, 405–410. doi: 10.3724/SP.J.1145.2012.00405
Li, Z. S., Chen, W. L., Wei, J. S., Maierdan, K., Zhang, Y. X., Zhang, S., et al. (2021). Tree-ring growth responses of Liaodong oak (Quercus wutaishanica) to climate in the Beijing Dongling Mountain of China. Acta Ecol. Sin. 41, 27–37. doi: 10.5846/stxb201910212210
Li, J. K., Peng, K. Y., Wei, X. X., Liu, Y. M., Li, J. X., Peng, M., et al. (2024). May–June relative humidity variation recorded by tree ring widths of Pinus armandii Franch since 1863 in the Funiu Mountains, Central China. Quat. Int. 696, 38–49. doi: 10.1016/j.quaint.2024.04.004
Li, J. J., Shao, X. M., Li, Y. Y., and Qin, N. S. (2014). Annual temperature recorded in tree-ring from Songpan region. Chin. Sci. Bull. 59, 1446–1458. doi: 10.1360/972013-901
Li, J. Y., Wang, S. Y., Niu, J. J., Fang, K. Y., Li, X. L., Li, Y., et al. (2016). Response of tree-ring width chronology of Larix principis-rupprechtii in Luya Mountain to climatic factors. Acta Ecol. Sin. 36, 1608–1618. doi: 10.5846/stxb201408171625
Liu, Y., Cai, Q. F., Shi, J. F., Hughes, M. K., Kutzbach, J. E., Liu, Z. Y., et al. (2005). Seasonal precipitation in the south-central Helan Mountain region, China, reconstructed from tree-ring width for the past 224 years. Can. J. For. Res. 35, 2403–2412. doi: 10.1139/x05-168
Liu, H., Yu, Y., Xia, D. S., Zhao, S. P., Ma, X. Y., and Dong, L. X. (2023). Analysis of the relationship between dust aerosol and precipitation in spring over East Asia using EOF and SVD methods. Sci. Total Environ. 908:168437. doi: 10.1016/j.scitotenv.2023.168437
Liu, X. Q., Zhang, X. L., Liu, Y. S., Zhang, J., Zhao, X. Z., Rui, Y., et al. (2020). Spatial division of climate change and its evolution characteristics in Southwest China based on REOF-EEMD. Geogr. Res. 39, 1215–1232. doi: 10.11821/dlyj020190387
Liu, Y., Zhang, X. J., Song, H. M., Cai, Q. F., Li, Q., Zhao, B. Y., et al. (2016). Tree ring width based PDSI reconstruction for Central Inner Mongolia, China over the past 333 years. Clim. Dyn. 48, 867–879. doi: 10.1007/s00382-016-3115-6
Ma, L., Liu, T. X., Ji, H. L., Luo, Y. Y., Duan, L. M., and Yang, Y. (2011). Establishment of ring width chronology and rainfall reconstruction of Ulmus pumila L in Horqin sandy land since 1826. Quaternary Sci. 31, 360–369. doi: 10.3969/j.issn.1001-7410.2011.02.18
Mann, M. E., Rutherford, S., Wahl, E., and Ammann, C. (2005). Testing the Fidelity of methods used in proxy-based reconstructions of past climate. J. Clim. 18, 4097–4107. doi: 10.1175/JCLI3564.1
Matskovsky, V., Roig, F. A., Fuentes, M., Korneva, I., Araneo, D., Linderholm, H. W., et al. (2022). Summer temperature changes in Tierra del Fuego since AD 1765: atmospheric drivers and tree-ring reconstruction from the southernmost forests of the world. Clim. Dyn. 60, 1635–1649. doi: 10.1007/s00382-022-06384-0
Meko, D., Cook, E. R., Stahle, D. W., Stockton, C. W., and Hughes, M. K. (1993). Spatial patterns of tree-growth anomalies in the United States and southeastern Canada. J. Clim. 6, 1773–1786. doi: 10.1175/1520-0442(1993)006<1773:SPOTGA>2.0.CO;2
North, G. R., Bell, T. L., Cahalan, R. F., and Moeng, F. J. (1982). Sampling errors in the estimation of empirical orthogonal functions. Mon. Weather Rev. 110, 699–706. doi: 10.1175/1520-0493(1982)110<0699:seiteo>2.0.CO;2
Peng, J. F., Li, J. B., Li, J. R., and Li, T. (2023). A 250-year winter minimum temperature reconstruction based on tree rings from Luoji Mountain, Southwest China. Forests 14:1555. doi: 10.3390/f14081555
Peng, J. F., Peng, K. Y., Li, X., Peng, M., Li, J. K., Wei, X. X., et al. (2024). Tree-ring widths of Pinus tabulaeformis Carr reveal variability of winter half-year precipitation on the north-south transition zone in Central China over the past 220 years. Sci. Total Environ. 931:172719. doi: 10.1016/j.scitotenv.2024.172719
Perone, A., Lombardi, F., Marchetti, M., Tognetti, R., and Lasserre, B. (2016). Evidence of solar activity and El Niño signals in tree rings of Araucaria araucana and A. angustifolia in South America. Glob. Planet. Chang. 145, 1–10. doi: 10.1016/j.gloplacha.2016.08.004
Rasmusson, E. M., Wang, X. L., and Ropelewski, C. F. (1990). The biennial component of ENSO variability. J. Mar. Syst. 1, 71–96. doi: 10.1016/0924-7963(90)90153-2
Rittenour, T. M., Grette, J. B., and Mann, M. E. (2000). El Nino-like climate teleconnections in New England during the late Pleistocene. Science 288, 1039–1042. doi: 10.1126/science.288.5468.1039
Shao, X., Xu, Y., Yin, Z. Y., Liang, E., and Zhu, H. (2010). Climatic implications of a 3585-year tree-ring width chronology from the northeastern Qinghai-Tibetan plateau. Quat. Sci. Rev. 29, 2111–2122. doi: 10.1016/j.quascirev.2010.05.005
Shi, W. J., Liu, Y. T., and Shi, X. L. (2017). Development of quantitative methods for detecting climate contributions to boundary shifts in farming-pastoral ecotone of northern China. J. Geogr. Sci. 27, 1059–1071. doi: 10.1007/s11442-017-1421-5
Shikangalah, R., Benjamin, M., Issac, M., and Ulrike, H. (2022). Responsiveness of Dichrostachys cinerea to seasonal variations in temperature and rainfall in Central Namibia. Flora 286:151974. doi: 10.1016/j.flora.2021.151974
Song, R. X., Li, T., Song, L. F., Zhang, X. J., Zhang, X. Y., and Liu, Y. (2024). Spatial and temporal distribution characteristics of drought in Jilin Province based on SPEI. J. Nat. Sci. Educ. 1, 1–10. doi: 10.3390/su15119014
Szymański, N., Wilczyński, S., Kowalczyk, J., and Kowalkowski, W. (2025). The tree-ring width and interval trend values as indicators of sensitivity to temperature and precipitation in different provenances of European larch. Sci. Rep. 15:1656. doi: 10.1038/s41598-025-85652-5
Tian, Q. H., Liu, Y., Cai, Q. F., Bao, G., Wang, W. P., Xue, W. L., et al. (2009). The maximum temperature of may-July inferred from tree-ring in Funiu Mountain since 1874 AD. Acta Geograph. Sin. 64, 879–887. doi: 10.3321/j.issn:0375-5444.2009.07.012
Wang, S. C., Jiang, Y. X., and Guo, J. P. (2021). Study on the response of radial growth of larch North China to climatic factors in the mid-elevation valley of the Guandi Mountains. Shanxi Forestry Sci. Technol. 50, 12–14. doi: 10.3969/j.issn.1007-726X.2021.02.005
Wang, J. C., Li, S. H., Guo, Y. L., Han, Y. J., and Mao, Z. L. (2023). Dynamic response of radial growth of Larix principis-rupprechtii to temperature change in Guancen Mountain. Chin. J. Ecol. 42, 1568–1576. doi: 10.13292/j.1000-4890.202307.011
Wang, Z. W., Li, Q., Liu, Y., Yang, Y. K., Ren, M., and Cui, L. L. (2024). Reconstructing the temperature and precipitation changes in the northern part of the greater Khingan Mountains over the past 210 years using tree ring width data. Forests 15:1450. doi: 10.3390/f15081450
Wang, Z., Li, Q., Liu, Y., Yang, Y., Ren, M., Cui, L., et al. (2020). PDSI variations recorded by tree rings in the northern Luliang Mountains during the past 175 years. J. Earth Environ. 11, 72–80. doi: 10.7515/JEE102024
Wang, K. Y., Liu, X. H., Zeng, X. M., Xu, G. B., Zhang, L. L., and Li, C. Y. (2021). Progress and prospect of stable nitrogen isotope recording in tree ring. Acta Geograph. Sin. 76, 1193–1205. doi: 10.11821/dlxb202105011
Wang, Y. C., Liu, Y., Zhang, H. F., Wang, H., Guo, J. L., Zhang, E. I., et al. (2019). Temperature variability inferred from tree-ring records in Weichang region, China, and its teleconnection with large-scale climate forcing. Clim. Dyn. 52, 1533–1545. doi: 10.1007/s00382-018-4213-4
Wang, S. J., Man, W. M., Chen, F., Chen, Y. P., Yu, S. L., Cao, H. H., et al. (2022). Reconstructed springtime (march–June) precipitation tracked by tree rings dating back to 1760 CE in the Qinling-Bashan mountainous area. Palaeogeogr. Palaeoclimatol. Palaeoecol. 604:111211. doi: 10.1016/j.palaeo.2022.111211
Wang, X. X., Wang, H., Zhang, J. F., Feng, Z. J., An, L. W., and Guo, M. M. (2022). Response of radial growth of larch North China to climate change in Saihanba forest area. Forestry Ecol. Sci. 37, 192–197. doi: 10.13320/j.cnki.hjfor.2022.0028
Wang, Y. C., Zhang, H. F., Wang, H., Guo, J. L., Zhang, E. L., Wang, J., et al. (2022). Tree-ring-based drought reconstruction in northern North China over the past century. Atmos. 13:482. doi: 10.3390/atmos13030482
Wei, Y. N., Ma, L., Zhang, B. L., and Zhang, J. (2023). Reconstruction of historical runoff at the southern foot of the greater Khingan Mountains based on Picea koraiensis. Arid Land Geography 46, 1269–1278. doi: 10.12118/j.issn.1000-6060.2002.532
Wu, Q., Song, J. X., Sun, H. T., Huang, P., Jing, K. X., Xu, W. J., et al. (2023). Spatiotemporal variations of water conservation function based on EOF analysis at multi time scales under different ecosystems of Heihe River basin. J. Environ. Manag. 325:116532. doi: 10.1016/j.jenvman.2022.116532
Xaybouangeun, N., Zaw, Z., Yang, Q. R., Panthi, S., Gao, D. S., Paothor, V., et al. (2024). Reconstruction of hydroclimate variability in southern Laos from 1885 to 2019 based on Pinus latteri tree-ring data. Palaeogeogr. Palaeoclimatol. Palaeoecol. 656:112595. doi: 10.1016/j.palaeo.2024.112595
Xiao, D. M., Qin, N. S., Li, J. J., Li, Y. Y., and Mu, L. (2015). Change of mean temperature from July to September in northeast of Western Sichuan plateau based tree-ring. Plateau Meteorol. 34, 762–770. doi: 10.7522/j.issn.1000-0534.2013.00190
Xue, Z. Y., Chen, Y., Yin, Y. X., Chen, W. L., Jiao, Y., Deng, D., et al. (2024). Spatio-temporal characteristics and driving factors of flash drought in northern China from 1978 to 2020. Glob. Planet. Chang. 232:104326. doi: 10.1016/j.gloplacha.2023.104326
Yin, Y. L., Zaw, Z., Peng, X. H., Zhang, H., Fu, L. P., Wang, W. L., et al. (2023). Tree rings in Tsuga dumosa reveal increasing drought variability in subtropical Southwest China over the past two centuries. Palaeogeogr. Palaeoclimatol. Palaeoecol. 628:111757. doi: 10.1016/j.palaeo.2023.111757
Yu, J., Zhou, G., and Liu, Q. J. (2018). Tree-ring based summer temperature regime reconstruction in XiaoXing Anling Mountains, northeastern China since 1772 CE. Palaeogeogr. Palaeoclimatol. Palaeoecol. 495, 13–23. doi: 10.1016/j.palaeo.2017.11.046
Yue, W. P., Chen, F., Davi, N. K., Zhang, H., Chen, Y. P., Zhao, X. E., et al. (2024). Little ice age cooling in the Western Hengduan Mountains, China: a 600-year warm-season temperature reconstruction from tree rings. Clim. Dyn. 62, 773–790. doi: 10.1007/s00382-023-06932-2
Zeng, A. Y., Zhou, F. F., Li, W., Bai, Y. H., and Zeng, C. S. (2019). Tree-ring indicators of winter-spring temperature in Central China over the past 200 years. Dendrochronologia 58:125634. doi: 10.1016/j.dendro.2019.125634
Zhang, X. L., Cui, M. X., Ma, Y. J., Wu, T., Chen, Z. J., and Ding, W. H. (2010). Larix gmelinii tree-ring width chronology and its responses to climate change in Kuduer, great Xing’an mountains. Chin. J. Appl. Ecol. 21, 2501–2507. doi: 10.13287/j.1001-9332.2010.0353
Zhang, Y. R., Gou, X. H., Wang, T., Zhang, F., Wang, K., Yang, H. J., et al. (2024). Response of tree growth to drought variability in arid areas: local hydroclimate and large-scale precipitation. Environ. Res. 249:118417. doi: 10.1016/j.envres.2024.118417
Zhang, T. W., Yu, S. L., Yuan, Y. J., and Huang, L. P. (2018). Development of a Larix principis-rupprechtii tree-ring width chronology and its climatic signals for the southern greater Higgnan Mountains. Geochronometria 45, 1–9. doi: 10.1515/geoch-2015-0082
Zhang, T. W., Yuan, Y. J., Wei, W. S., Yu, S. L., Zhang, R. B., Shang, H. M., et al. (2013). Tree-ring-based temperature reconstruction for the northern greater Higgnan Mountains, China, since AD 1717. Int. J. Climatol. 33, 422–429. doi: 10.1002/joc.3433
Zhao, Y. J., Maierdang, K. M., Li, Z. S., Chen, Y. Z., Wei, J. S., Wang, X. C., et al. (2021). Summer mean temperature reconstruction during the past 285 years based on tree-ring in northern Gaoligong Mountains, northwestern Yunnan of China. Geogr. Ann. Ser. A Phys. Geogr. 103, 69–82. doi: 10.1080/04353676.2020.1854012
Zhao, Y. S., Shi, J. F., Shi, S. Y., Jian, Y., and Lu, H. Y. (2017). Tree-ring latewood width based July–august SPEI reconstruction in South China since 1888 and its possible connection with ENSO. J. Meteorol. Res. 31, 39–48. doi: 10.1007/s13351-017-6096-4
Keywords: tree-ring, historical temperature, EOF, PPR, North China
Citation: Liu Q, Li S, Wang J, Han Y, Guo Y, Zhao Y, Zhao S and Du M (2025) Reconstruction of July temperature based on tree-rings during 1845–2002 in North China. Front. For. Glob. Change. 8:1529552. doi: 10.3389/ffgc.2025.1529552
Edited by:
Ram P. Sharma, Tribhuvan University, NepalReviewed by:
Ouya Fang, Chinese Academy of Sciences (CAS), ChinaCopyright © 2025 Liu, Li, Wang, Han, Guo, Zhao, Zhao and Du. This is an open-access article distributed under the terms of the Creative Commons Attribution License (CC BY). The use, distribution or reproduction in other forums is permitted, provided the original author(s) and the copyright owner(s) are credited and that the original publication in this journal is cited, in accordance with accepted academic practice. No use, distribution or reproduction is permitted which does not comply with these terms.
*Correspondence: Shuheng Li, bGlzaEBud3UuZWR1LmNu
Disclaimer: All claims expressed in this article are solely those of the authors and do not necessarily represent those of their affiliated organizations, or those of the publisher, the editors and the reviewers. Any product that may be evaluated in this article or claim that may be made by its manufacturer is not guaranteed or endorsed by the publisher.
Research integrity at Frontiers
Learn more about the work of our research integrity team to safeguard the quality of each article we publish.