 Yuan Zhang
 Kai Li1
 Xiaoling Zhang
 Hong Li
94% of researchers rate our articles as excellent or good
Learn more about the work of our research integrity team to safeguard the quality of each article we publish.
Find out more
ORIGINAL RESEARCH article
Front. For. Glob. Change, 11 March 2025
Sec. Forest Growth
Volume 8 - 2025 | https://doi.org/10.3389/ffgc.2025.1526743
This article is part of the Research TopicForest Growth in a Changing Climate: Insights from Predictive Modeling and Adaptive StrategiesView all 6 articles
Introduction: Subtropical forests play an important role in the global carbon cycle, and their carbon balance response mechanism to climate change not only has important theoretical value, but also has practical reference significance for forest management and decision-making in response to climate change in similar ecosystems in the future.
Methods: Taking Zhejiang Province, China as an example, a series of relevant data were collected, including forest distribution, meteorological data, soil data, nitrogen deposition data, etc. The optimized InTEC model was used for simulation to predict the net ecosystem productivity of forests in Zhejiang Province under different climate scenarios at a hundred year scale in the future, and the temporal and spatial sequence changes were analyzed. Then, combined with the spatiotemporal variation characteristics of meteorological data, analyze the response mechanism of subtropical forest ecosystem carbon cycle to climate change. The age of the Result forest and climate change factors have a significant impact on the forest’s carbon sequestration capacity. In the past forest age stage, the climate factors that had the greatest impact on the net ecosystem productivity of forests were temperature, precipitation, and solar radiation, with correlation coefficients of 0.56, 0.84, and −0.79, respectively. After the forest matures, the correlation between net ecosystem productivity and temperature is the highest and negatively correlated under different climate scenarios. This indicates that there are significant differences in the response of forests to climate change at different times. The response of Discuss forests to climate change varies significantly at different stages, therefore different management measures should be taken according to forest age, especially in subtropical forests. This discovery is of great significance for understanding the influencing factors and driving mechanisms of forest carbon sink function, and also provides a reference for predicting future forest carbon cycle dynamics.
After the Industrial Revolution, humans converted carbon buried underground and not involved in the carbon cycle into carbon dioxide and emitted it into the atmosphere by burning fossil fuels, marking the beginning of global warming (Joachimski et al., 2022; Morten et al., 2023; Usman and Abdullah, 2023). Land ecosystems play an extremely important role in mitigating global warming. According to statistics from carbon dioxide observation stations at different latitudes around the world, although carbon dioxide concentration continues to rise, the pattern of increase at each station is different. The carbon dioxide concentration in the southern hemisphere and equatorial regions is steadily increasing (Aryavalli and Kumar, 2024). Subtropical forests have unique ecosystem characteristics, therefore they play an important role in regulating soil erosion, maintaining water, and providing ecotourism. Although subtropical forests have important ecological functions, they also face serious ecological crises. Excessive human activities and deforestation have caused damage to subtropical forest ecosystems in many regions. Therefore, protecting and restoring subtropical forest ecosystems is crucial for maintaining ecological balance, preserving biodiversity, and addressing climate change. How to reveal the response mechanism of subtropical forest carbon balance to climate change is significant for evaluating forest carbon sequestration capacity. Many scholars have conducted in-depth analysis and discussion on this issue. Goll et al. (2022) artificially solved the problem that the extent of impact of spatial redistribution of nutrients by atmospheric transport and sedimentation on forest carbon sink is still unclear. They used a terrestrial biosphere model to quantify the impact of changes in atmospheric nitrogen and phosphorus deposition on plant nutrition and biomass carbon sink in typical lowland forests in Central Africa since the 1980s. The results show that the carbon sink in the model has a more significant response to changes in phosphorus deposition, while a smaller response to changes in nitrogen deposition (Goll et al., 2022). Fernández-Martínez et al. (2023) investigated the relationship between increases in global terrestrial net carbon uptake or net biomass production and carbon sink stability using atmospheric inversion models and dynamic global vegetation models. The trend of terrestrial net carbon uptake and its controlling factors, temporal variability and autocorrelation from 1,981 to 2,018 were analyzed. The experimental results show that the global annual net biomass production and its interdecadal variability increase, while the time autocorrelation decreases (Fernández-Martínez et al., 2023). Xiong et al. (2020) conducted continuous field measurements of organic carbon and plant δ13C values for Masson Pine and monsoon evergreen broad-leaved forests for 15 years (2000–2015) using a mass balance based isotope mixing model to quantify the impact of vegetation on organic carbon storage and soil characteristics. The results show that compared with Masson Pine, monsoon evergreen broad-leaved forest has higher carbon input and more powerful carbon storage environment (Xiong et al., 2020).
Based on the above content, it can be seen that the current models used to explore the change of forest carbon sink are relatively simple, only considering the impact of forest biomass carbon sink or soil carbon sink. The Integrated Terrestrial Ecosystem Carbon Cycle Model (InTEC), which takes into account the spatio-temporal changes of forest carbon sink affected by stand age and forest disturbance, was innovatively proposed in this study. By introducing the change of stand age structure, the model can more accurately simulate the temporal and spatial changes of forest carbon sink, and provide a more scientific basis for the development of forest management strategies. In addition, high-resolution remote sensing data, forest disturbance monitoring and other technologies can more accurately assess the forest carbon sink increase potential and sink decline amplitude. In response to the above issues, the study takes Zhejiang Province as the research area. Firstly, an InTEC model is established. Then Carbon Cycle Spatiotemporal (CCS) is conducted to explore the response mechanism to climate change. The research aims to clarify the response mechanisms of carbon balance and climate change in subtropical forests at different Age stages, provide targeted management measures for forests in different climate scenarios and Age stages, and present reference for similar forest adaptation to climate change, ensuring high carbon sink capacity. There are two main innovative points in the research. The first is to explore the spatiotemporal evolution pattern of forest ecosystem carbon sources in the research area over the past and future centuries. The second point is to explore the relationship between Net Ecosystem Productivity (NEP) and meteorological factors in forests, and to analyze the response mechanism of subtropical forest carbon cycle to climate change in the study area. The research has four parts. The first part is a review of relevant research. The second designs the climate response mechanism method for CCS simulation based on the InTEC. The third part is to analyze the response mechanism of subtropical forest carbon balance to climate change. The last part is a summary of the research.
With the implementation of key forestry ecological projects, afforestation has achieved tremendous results. The quality of forests has been further improved, and the overall carbon sequestration capacity of forests has also been greatly enhanced. However, there is still serious low quality in forest management in China. The natural forest is severely damaged, and the sustainable management of artificial forests is insufficient. The potential of forest ecosystems to mitigate climate change through carbon balance monitoring and carbon sequestration is difficult to realize. Numerous scholars have conducted in-depth discussions on this topic. There is a conflict between forest bioenergy and forest carbon balance, as well as the protection of biodiversity. Therefore, Repo et al. (2020) designed a method to quantify the impact of harvesting forest residues to obtain bioenergy on forest carbon balance and biodiversity in northern forest landscapes. The forest development of four real watersheds was simulated. The results showed that rooting on tree stumps reduced forest carbon storage and dead wood volume at the landscape scale (Repo et al., 2020). Gouge et al. (2021) aimed to determine the effects of biomass extraction on regeneration density, and carbon balance in northern forests affected by spruce aphids. The research results indicated that the acquisition of biomass increased the density of forest regeneration and the quantity of planted microhabitats, while reducing cumulative carbon dioxide emissions. The inclusion of biomass in afforestation may act an active role in achieving carbon balance in forest management, while also contributing to mitigating climate change (Gouge et al., 2021). Gea-Izquierdo and Sanchez-Gonzalez (2022) found that factors such as drought and logging affected forest carbon balance and terrestrial carbon sinks, and caused uncertainty in forest mortality rates after disturbance. Therefore, combining the data of permanent re-sampling plots with biomass oriented ecological plots, the time series of annual woody biomass growth were estimated. The experimental results showed that the difference between tree ring estimation and simulated woody biomass growth was caused by changes not explained in allocation or errors in model calibration methods. Stronger interference intensity resulted in greater modifications to carbon distribution patterns (Gea-Izquierdo and Sanchez-Gonzalez, 2022). Liu et al. (2022) were unable to determine whether the relationship between climate and northern forest carbon flux was stable. Therefore, continuous vortex covariance and microclimate data from the century old northern poplar forest in central Saskatchewan were studied to evaluate the relationship between climate and ecosystem carbon and water flux. The temperature sensitivity of carbon flux decreased, indicating that forest structure may undergo changes, which was related to the overripe age of poplar forests (Liu et al., 2022).
The subtropical forest ecosystem is an important component of China’s forest carbon sink. Its carbon sequestration status and carbon sequestration potential have received widespread attention from many scholars. Jiang et al. (2022) conducted factor experiments in humid subtropical gaps to address the unclear importance and mechanism of ultraviolet radiation on litter decomposition in forest ecosystems. The experimental results showed that the increase in microbial degradation under ultraviolet radiation may be related to the increased degradation of lignin and cellulose. In subtropical forests, the direct photodegradation of ultraviolet radiation may be weak, but the promoting effect of ultraviolet radiation generated rapid carbon turnover in the system (Jiang et al., 2022). The soil priming effect of increased nitrogen deposition on subtropical forests is unclear. Therefore, Wang et al. (2023) cultured soil exposed to experimental nitrogen deposition for 9 years in subtropical evergreen broad-leaved forests and used two 13C labeled substrates with comparative bioavailability. The results indicated that expected changes in carbon quality affected the soil priming effects (Wang et al., 2023). Kumari et al. (2022) evaluated the carbon sequestration potential of different natural forests in the Biraspur region of the Indian state of Himachal. Non-destructive methods were used to analyze the aboveground and underground carbon storage of existing vegetation in six different locations of subtropical forests. The research results showed that the highest carbon storage at Site II was 131.95 tons of carbon per hectare, while the lowest at Site I was 70.34 tons of carbon per hectare. There were significant differences in tree density and carbon storage among these subtropical forests. Appropriate management strategies further increased the potential for carbon storage (Kumari et al., 2022). Richardson et al. (2022) found that the peatlands of subtropical forests along the southeastern coast of the United States were mainly caused by the Pokosin Swamp. To quantify the GHG emissions and storage of drainage and Pokosin Lake, eddy covariance technique was used in the study. The results showed that the net ecosystem exchange measurement of subtropical forests showed a loss of 21.2 m3 carbon dioxide (Richardson et al., 2022).
Based on the above content, it can be seen that the current research results mainly focus on carbon balance monitoring and carbon sequestration mitigation in subtropical forest systems at home and abroad. However, subtropical forest management still faces huge challenges, such as insufficient sustainable management of artificial forests, severe damage to natural forests, and unclear CCS climate change response mechanisms in subtropical forests. In the future, by strengthening forest management, optimizing afforestation strategies, and improving forest quality, the potential of forest ecosystems in carbon sequestration and addressing climate change can be fully realized. Therefore, taking Zhejiang Province as the research area, the InTEC model for CCS simulation is designed. It is expected to clarify the response mechanism of carbon cycling in subtropical forest areas to climate change.
To explore the response mechanism of regional climate change, the core process and driving data of the InTEC are first designed. Then a climate change response mechanism method based on CCS simulation is developed.
The InTEC is mainly used to study the spatiotemporal variation characteristics of carbon sinks or sources in forest ecosystems. It is the only model that considers the effects of stand age (Age) and forest disturbance, which is suitable for studying the impact of forest management measures on forest carbon absorption. The research mainly designs the InTEC from two aspects: core processes and driving data. In the core process section, firstly, the quantitative relationship between Net Primary Productivity (NPP) and Age of vegetation is initialized, as shown in equation (1).
In equation (1), A, b, c and d are all regression coefficients determined by the average annual temperature Ta. The relationship FNPP between normalized NPP and forest age can be calculated using equation (1). The InTEC obtains the interannual variation of NPP through the relationship between meteorological data and NPP-Age. The proportion of NPP and Gross Primary Productivity (GPP) remains consistent with the environmental change state, thus overestimating the impact of NPP on climate change (Chen et al., 2023; Fan et al., 2022; Yang et al., 2023). Therefore, it is modified to equation (2).
In equation (2), X(i) and Y(i) represent the changed proportion in GPP and maintenance respiratory Ra between the i-th and i-1-th years, respectively. α(i−1) is the proportion of Ra in GPP. The Ra is shown in equation (3).
In equation (3), CL, CS, CCR, CFR and RL,15, RS,15, RCR,15, RCR,15 correspond to the biomass carbon pools of leaves, stems, coarse heels, and fine heels of plants, as well as the annual respiration rate at an average annual temperature of 15°C. T(i) is the average temperature in year i. Q10 is Ra’s sensitivity to temperature. The InTEC uses a process-based biogeochemical cycling soil model in terrestrial ecosystems to estimate heterotrophic respiration. Soil is divided into nine carbon pools to simulate soil carbon dynamics, including surface litter carbon pool, surface microbial carbon pool, surface structural litter carbon pool, soil metabolic litter carbon pool, soil microbial carbon pool, soil structural litter carbon pool, chronic carbon pool, inert carbon pool, and woody litter carbon pool (He Y. et al., 2022; He et al., 2023). The expression for heterotrophic respiration is shown in equation (4).
In equation (4), Cj(i) and Kj,a(i) represent the scale of the j-th carbon pool and the rate of carbon dioxide release into the atmosphere, respectively. The biomass carbon pool is determined by the annual NPP and corresponding allocation coefficients. The differences in forest types result in differences in corresponding allocation coefficients. The expression for the annual biomass carbon pool update is shown in equation (5).
In equation (5), ΔCj(i) represents the change corresponding to the j-th carbon pool in the i-th year. The expression for vegetation carbon pool is shown in equation (6).
In equation (6), Fj represents the allocation coefficient of NPP to the j-th carbon pool. Kj represents the turnover rate of the j-th carbon pool. The soil carbon pool is shown in equation (7).
In equation (7), and are the decomposition coefficients corresponding to the j-th carbon pool, and carbon pool i to carbon pool j. The change in GPP is calculated, as displayed in equation (8).
In equation (8), U(i) represents meteorological factors, namely the overall impact of carbon dioxide, nitrogen, and soil moisture on photosynthesis. In the driving data section, it includes meteorological data, soil data, Leaf Area Index (LAI), Age, and annual NPP data to simulate carbon cycling on an annual scale. Taking 2015 as a node, meteorological data is divided into meteorological data from the past 1979–2015 and future 2016–2079. The meteorological data in the past came from the daily ground value data of Zhejiang Province from the National Meteorological Center. There is spatial correlation in meteorological data. Therefore, the study uses the inverse distance weighting method to perform differential analysis. The altitude correction of temperature data is carried out through digital elevation data, that is, for every 1 km increase in altitude, the temperature decreases by 6.5°C (Li et al., 2023; Yu et al., 2023b). Due to the limited number of radiation stations in the study area, the direct difference method may result in significant errors. Therefore, the study introduces sunshine hours to estimate radiation data, as expressed in equation (9).
In equation (9), Hsun and Hsun represent the total daily solar radiation and the total ground radiation on clear days, respectively. k and m are both empirical parameters. m represents sunshine hours. Ssun represents the duration of sunlight. The meteorological data from 2,016 to 2,079 are simulated using the global climate model of the Fifth International Coupled Model Comparison Program (CMIP5). Three scenarios are set: low emission (P1), medium emission (P2), and high emission (P3) (Na et al., 2022; Rao et al., 2023; Yu et al., 2022). In P1, the radiation intensity shows an initial increase followed by a decrease, achieving 2.6 W/m2 by 2,100. In P2 and P3, radiation intensity continues to increase until reaching 4.5 W/m2 and 8.5 W/m2, respectively by 2,100. The meteorological data obtained from the above scenario simulation includes monthly average temperature, monthly total precipitation, monthly relative humidity, etc. The data is simulated at a resolution of 1°. The linear interpolation is used to resample the data into 1 km × 1 km resolution data (Zandi et al., 2023). The soil temperature and moisture content in the InTEC model is influenced by soil parameters, such as bulk density, effective water holding capacity, soil depth, percentage of silt clay content, and wilting point, which in turn affect the heterotrophic respiration. The soil bulk density is calculated using the Brooks-Corey optimization model and the percentage of soil silt content. The wilting point is calculated through the percentage of soil silt and clay content, and other parameters are obtained from the global soil database (Guo et al., 2022; Yu et al., 2023a). LAI data directly affects the calculation of precipitation intercepted by the canopy, solar radiation, and plant transpiration, thereby affecting the calculation of vegetation photosynthesis, autotrophic respiration, and soil moisture content. Therefore, the locally adjusted cubic spline cap algorithm smooths the MODIS LAI data. Then, the Kalman filtering algorithm is used to assimilate the smoothed data. The high-precision LAI spatiotemporal data of the study area is obtained. The forest age data comes from the forest resource inventory team in Zhejiang Province, which includes forest age information from 1,425 sample plots. Then, the Kriging interpolation method can be used to obtain the spatial distribution data of forest age at a resolution of 1 km × 1 km. The carbon dioxide concentration data from 1,979 to 1,999 is sourced from the National Oceanic and Atmospheric Administration of the United States, while the remaining data comes from the RCP database. The parameter settings for different forest types and soil carbon are displayed in Table 1.
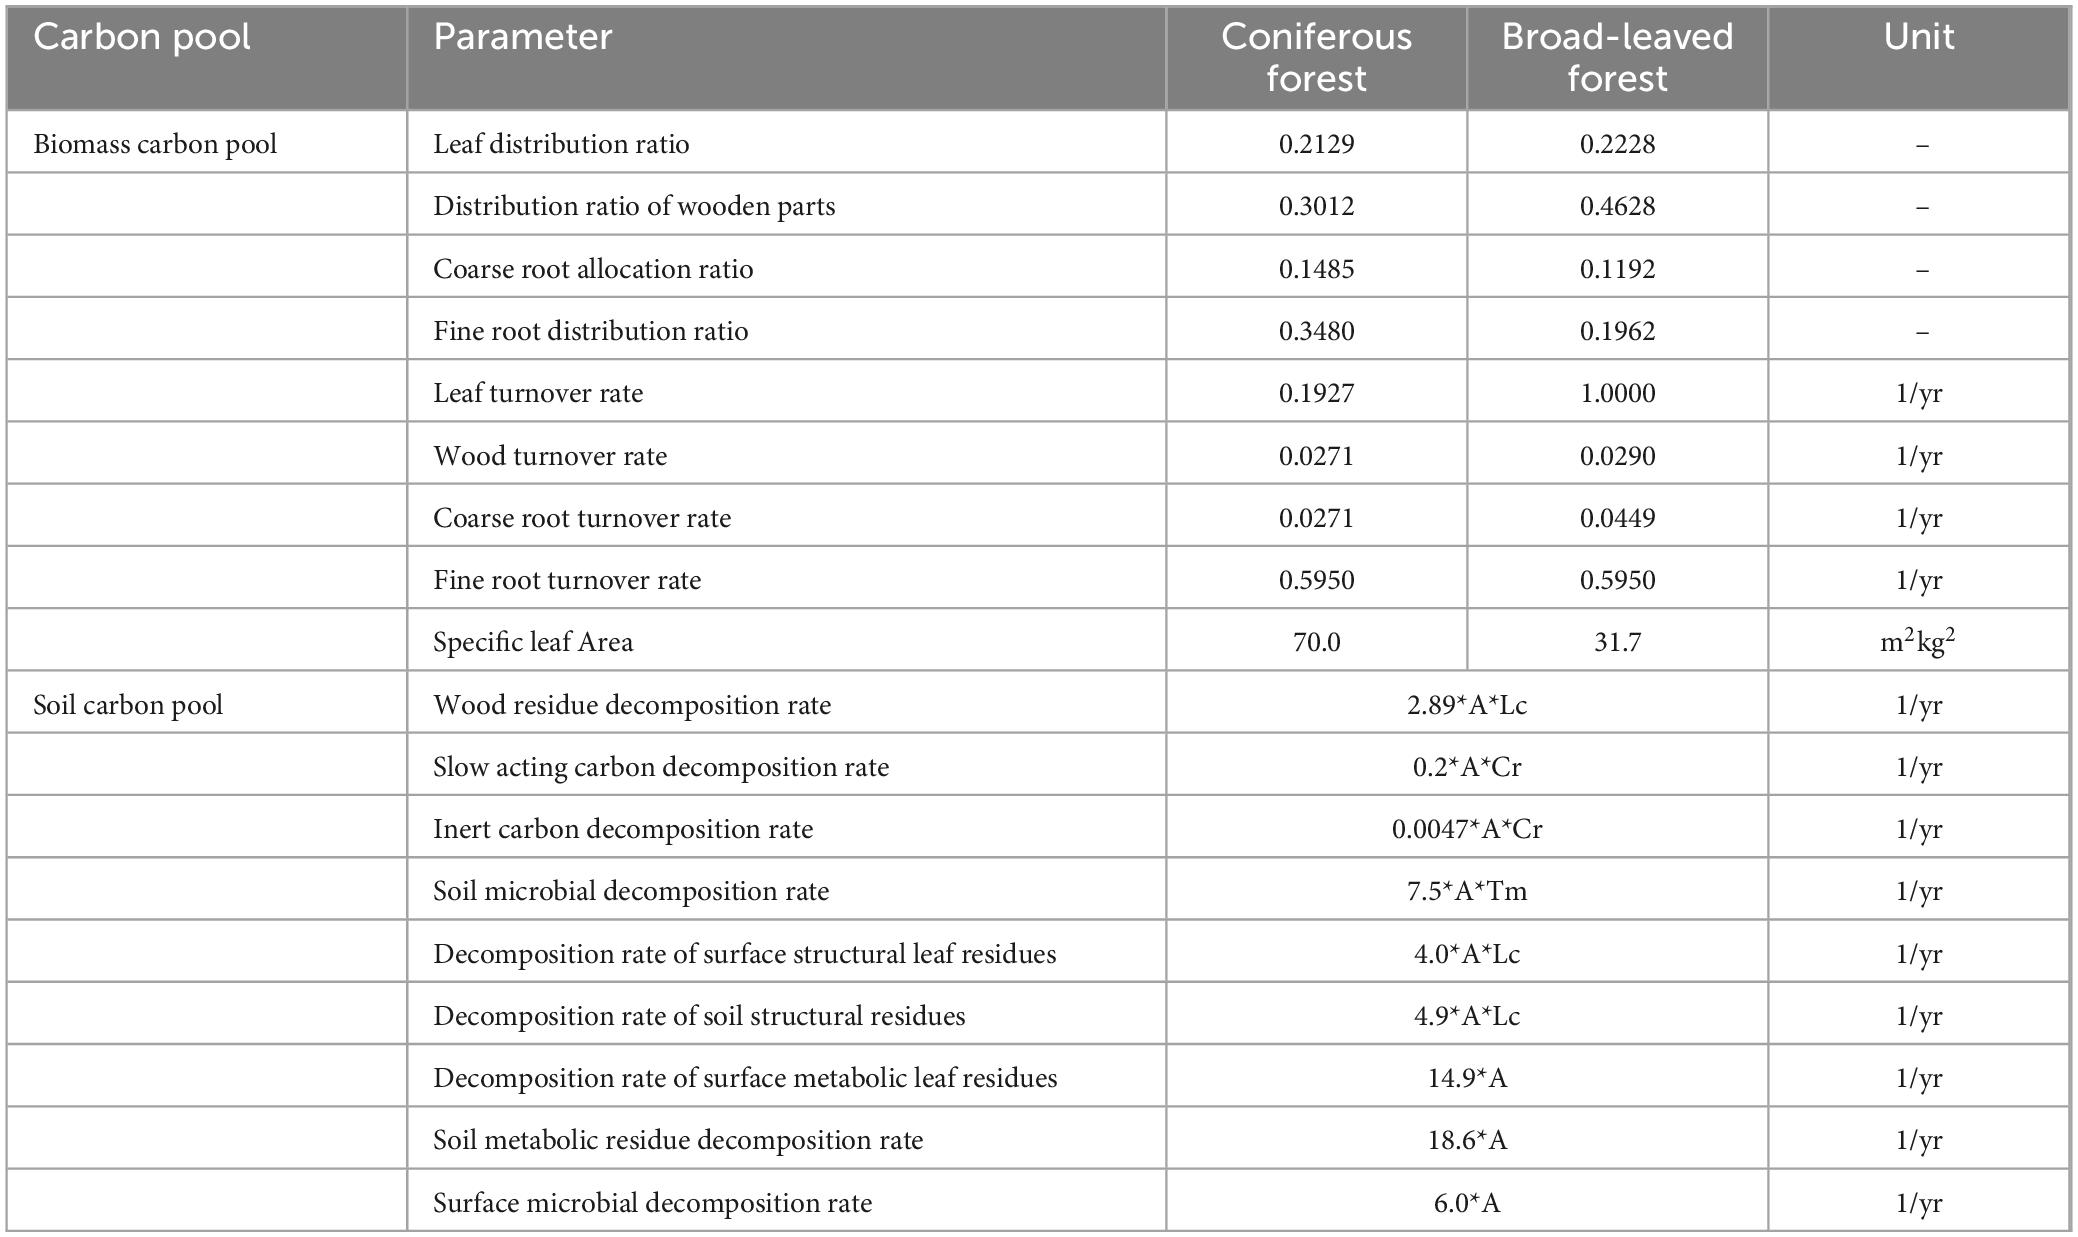
Table 1. Parameter setting of different forest types and soil carbon.
In Table 1, Lc represents the influence of structural lignin content on decomposition rate. A represents the influence of soil temperature and humidity on organic matter decomposition rate. Tm represents the influence of soil structure on the migration of active organic matter.
Before simulating the CCS of the study area, the geographical location, climate characteristics, and forest resources of the study area are analyzed. The research area is located on the southeast coast of China and the southern of the Yangtze River Delta, spanning 27°02′ -31°11′N and 118°01′ -123°10′E. It borders the Fujian to the south, East China Sea to the east, Shanghai and Jiangsu to the north, and Jiangxi and Anhui to the west, The land area of the research area is 105,500 square kilometers. It is a smaller province in China (He C. et al., 2022; Zhu et al., 2023). A schematic diagram of vegetation distribution in the study area is shown in Figure 1.
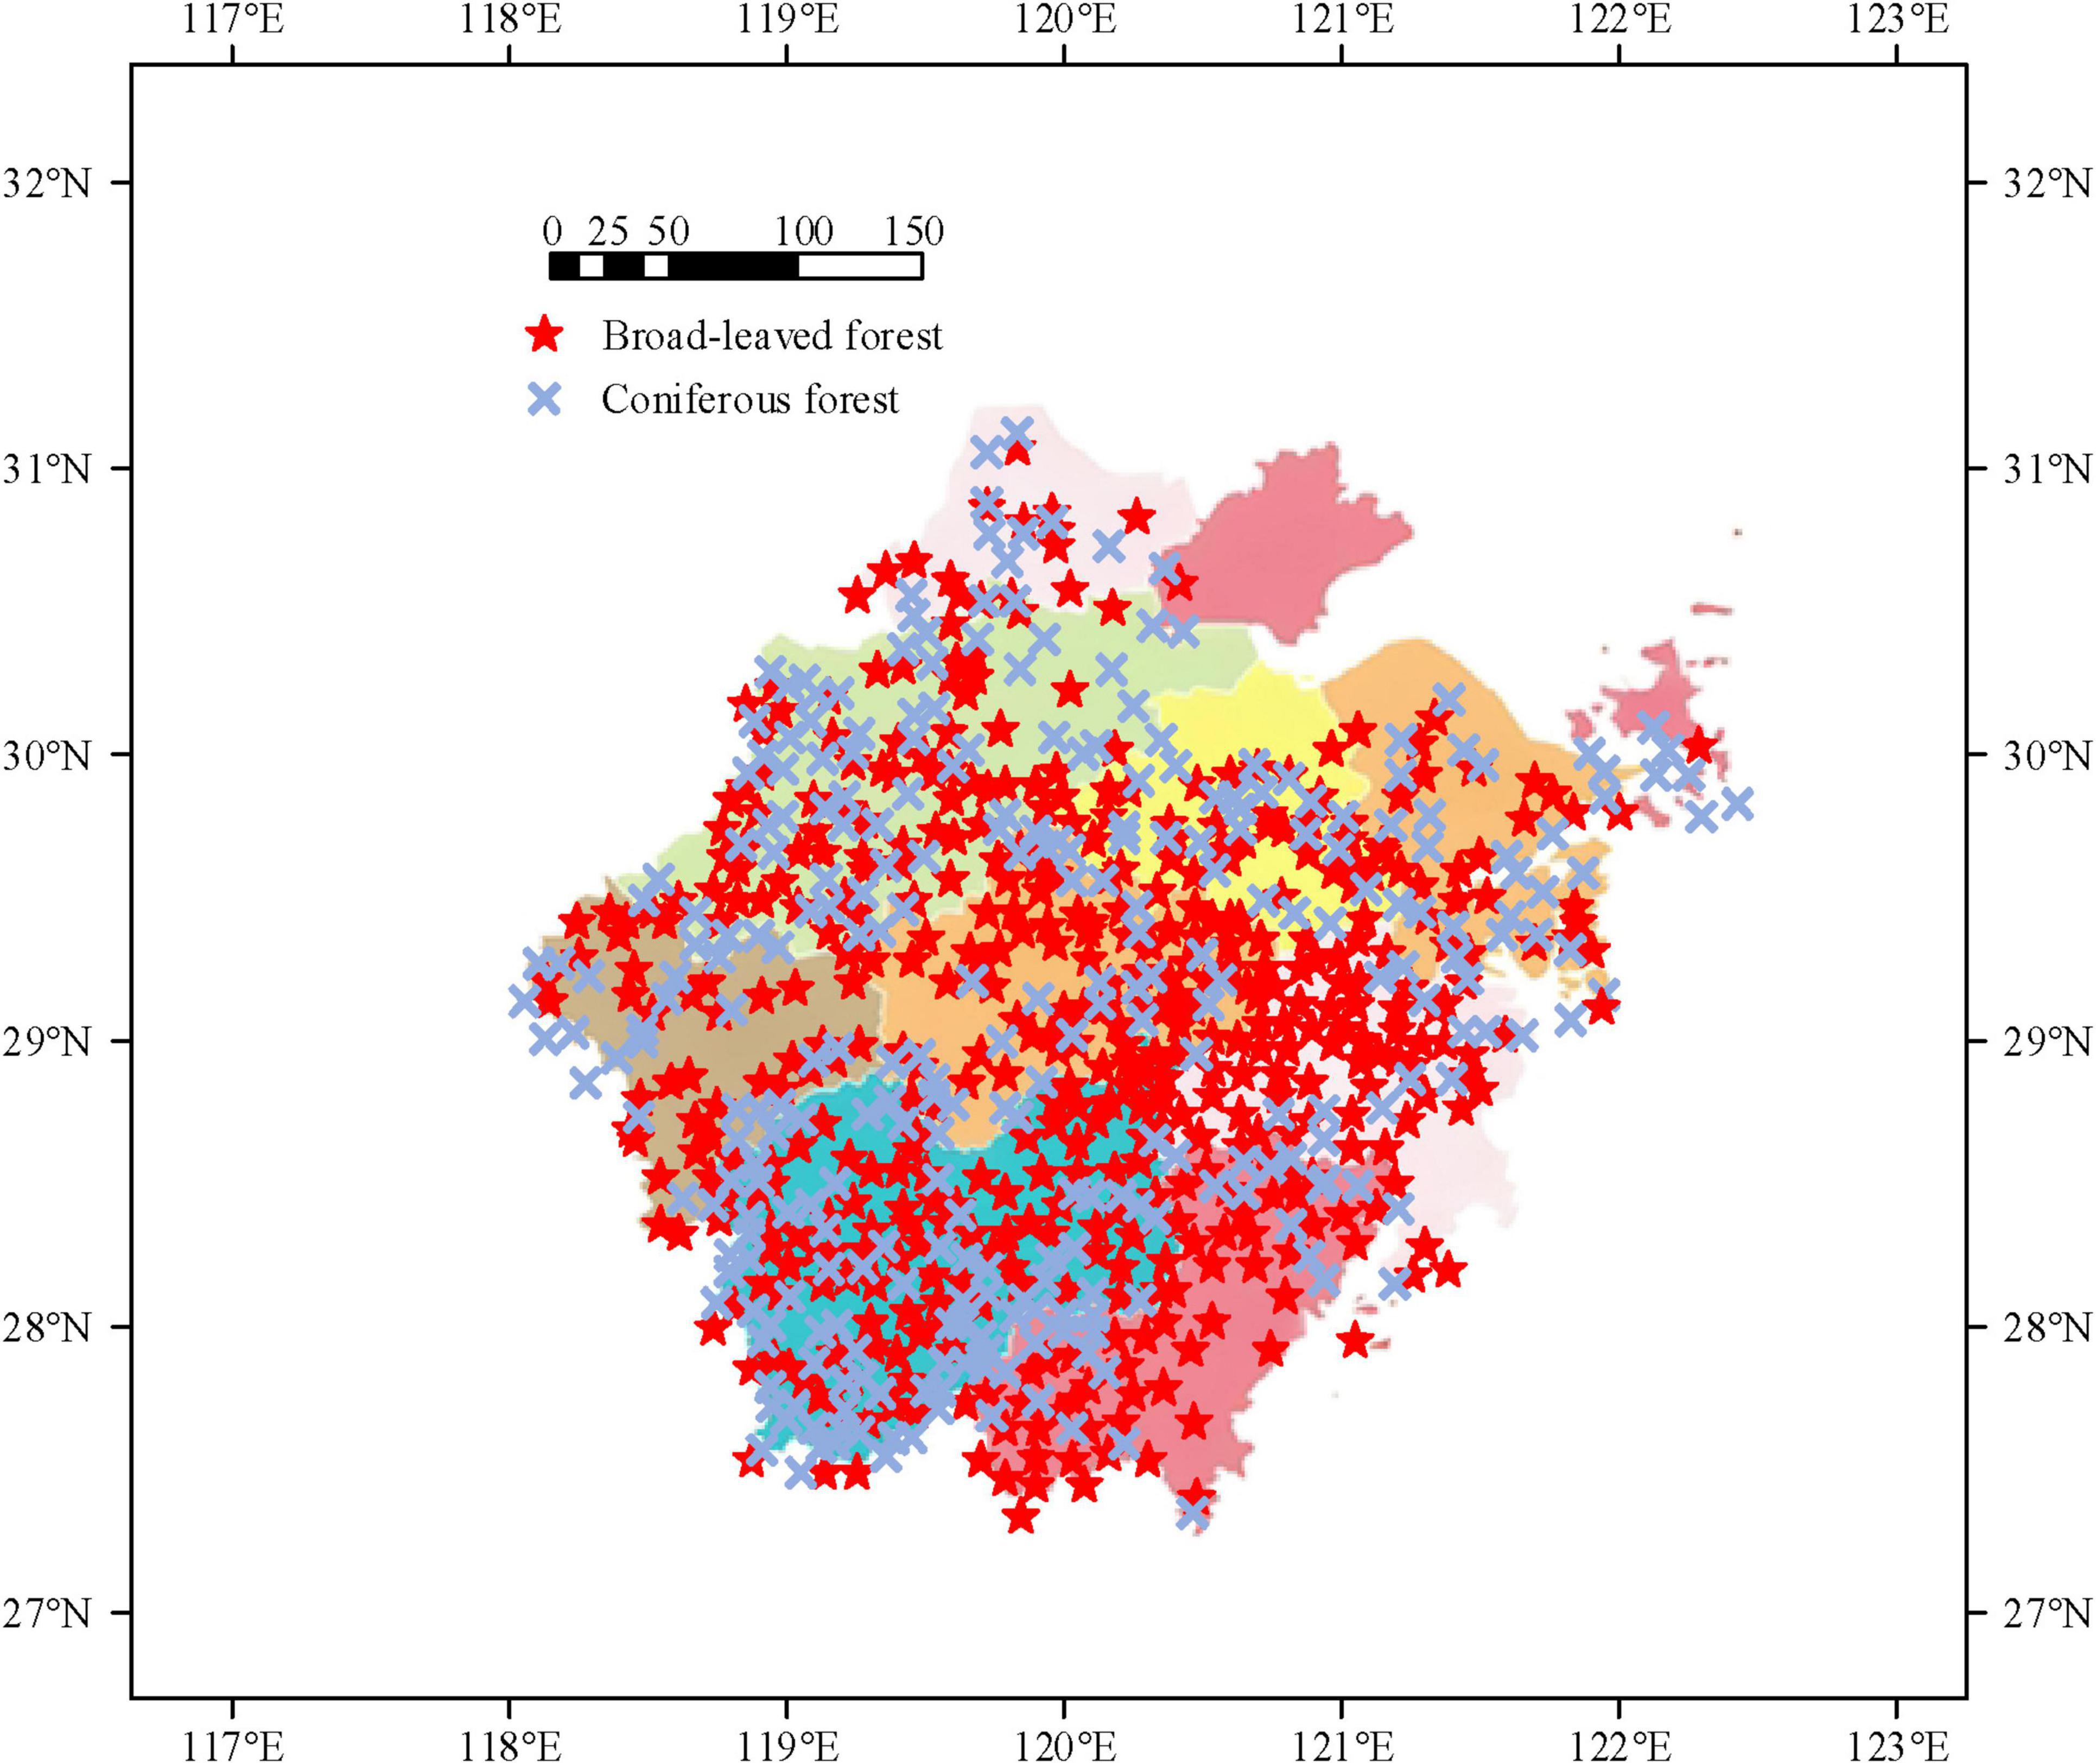
Figure 1. Schematic diagram of vegetation distribution in the study area.
From Figure 1, the sea area of the study area is 260,000 square kilometers, with the total length of the coastline ranking first in the country. The terrain slopes in a stepped manner from southwest to northeast, with mountains and hills mainly in the southwest. The eastern region of Zhejiang is mainly composed of coastal plains and hills, the central region of Zhejiang is a basin, the southwestern region of Zhejiang is hills and mountains, and Zhoushan City is an island landform with complete landforms. There are many mountains over a kilometer in the southwest. As of 2021, the region has 1.2905 million hectares of arable land, of which paddy and dry fields account for 82.36% and 17.64%, respectively. The soil in this area is mainly yellow soil and red soil, accounting for more than 70% of the total area, concentrated in hilly and mountainous areas. Plains and valleys are mostly filled with paddy soil. There are saline and desalinated soils distributed along the coast. The climatic conditions of the study area are as follows. The area is located in the middle of the subtropical zone, with a monsoon humid climate, distinct four seasons, sufficient sunlight and rainfall. The annual average temperature, annual sunshine hours, and annual precipitation range are 15°C–18°, 1,100 h–2,200 h, and 1,100 mm–200 mm, respectively. Affected by the ocean and Southeast Asian monsoon, there are significant changes in the prevailing wind direction during winter and summer in the study area, with significant seasonal variations in precipitation and diverse climate resources. The forest resources in the study area are as follows. The overall diversity of the local forest ecosystem is a medium to high level. Forest vegetation types, forest types, and age groups of trees are abundant. The forest coverage rate in the province reaches 61.24%. The health status of the forest is good, and the proportion of forest areas classified as healthy and sub healthy is 88.45% and 8.23%, respectively. In addition, the carbon sequestration capacity per unit area of local forests is the strongest. The carbon sink of forests accounts for approximately 53.98% of the total amount. The forest and standing timber reserves are 0.361 billion cubic meters and 0.401 billion m3, respectively. The total carbon storage of forest vegetation in the province is 280.7043 million tons.
After introducing the overview of the research area, the climate change response mechanism method based on CCS simulation can be carried out, which mainly includes three parts: observing forest carbon flux, verifying station accuracy, and simulating the process. In the first part, the study selects flux tower data from Tianmu Mountain (Site 1), Anji County (Site 2), and Qianyanzhou (Site 3) for testing the InTEC model, including temperature and humidity, precipitation, soil temperature, soil moisture content, wind speed and humidity, with sampling frequencies and periods of 10 Hz and 30 min, respectively. Then, the obtained flux observation data is processed through data correction and interpolation to obtain daily Net Ecosystem Carbon Exchange (NECE) and Total Ecosystem Respiration (TER). In data correction processing, first, the outliers of each flux observation data at 10 Hz are removed, and the periodic average is calculated. Secondly, the sampling period data is subjected to secondary coordinate rotation, virtual temperature correction, and WPL correction. Then, the NECE storage term is calculated using the carbon dioxide data from the profile system. If the data is lost, the time series of carbon dioxide concentration from the vorticity related observation system is used for calculation. Finally, the outliers of NECE are removed using the difference method. The time window, sensitivity, and threshold are located at 15 days, 5.5, and (−3, 3), respectively. Friction wind speed correction and nighttime negative values are also removed. In data interpolation processing, there are mainly two methods. One is to estimate daytime TER based on the respiratory equation and NECE of nighttime data, as expressed in equation (10).
In equation (10), Ta and Tr represent the air temperature and reference temperature, respectively. TERb and TERn are the reference temperature and TER corresponding to Tr. M0 represents temperature sensitivity. T0 is −46.02°C. Another method is to interpolate the missing NECE data during the day using the Mie light response curve model, as shown in equation (11).
In equation (11), TERd and NECEd correspond to TER and NECE during the day, respectively. γ represents the canopy light energy utilization efficiency. PAR represents photosynthetic effective radiation. χ represents the maximum rate of carbon dioxide absorption by vegetation canopy under light saturation conditions. If the missing data accounts for more than 20% of the total daily data volume, the daily data will be directly removed. On the contrary, by calculating the daily average values of NECE and TER, the corresponding daily values can be obtained. In the second part, the InTEC is tested using three different forest type flux sites. The carbon cycle of the forest ecosystem is simulated. The study selects correlation coefficient R and Root Mean Square Error (RMSE) to evaluate the model accuracy. The expression for R is shown in equation (12).
In equation (12), i represents the year. xi and are the simulated values and their means, respectively. yi and are the measured values and their mean, respectively. In the third part, two hypotheses are set. Firstly, on a 100 years scale, the forest in the study area only undergoes one logging. After logging, the forest will completely die. The forest restoration is not accompanied by human interference or changes in forest type. The second is to use fixed land cover type data for forest growth at the century scale.
To explore the response mechanism of carbon balance and climate change in subtropical forests in the research area, the optimization results of the InTEC model are first analyzed. The CCS simulation results are explored. Finally, the response mechanism of subtropical forest carbon cycle to climate change is analyzed.
To optimize the InTEC model, the optimization results of NPP-Age relationships and parameters for different forest types in the study area are first determined.
Figures 2a, b show the NPP-Age relationship results and parameter optimization results for different forest types, respectively. From Figure 2, the NPP of both forest types showed a rapid initial growth trend until reaching maturity. Subsequently, NPP decreased first with the increase of Age and eventually tended to stabilize. The NPP of coniferous forests in the final stage was slightly higher than that of broad-leaved forests. The above results are mainly due to the fact that carbon sequestration in young and middle-aged forests is mainly concentrated in stems, branches, and coarse roots. After maturity, the proportion of carbon distribution in the xylem decreased significantly, leading to a decrease in nitrogen utilization efficiency. In the parameter optimization results of the InTEC model for coniferous and broad-leaved forests, A, b, c, and d were 480.287, 2.931, 21.792, 0.702 and 352.284, 5.317, 14.063, and 0.889, respectively. In addition, other fixed experimental parameters were set as follows, k and m were 0.251 and 0.749, respectively. To further validate the accuracy of the InTEC model in processing different forest types, data from three flux stations were selected for analysis, and the results are shown in Figure 3.
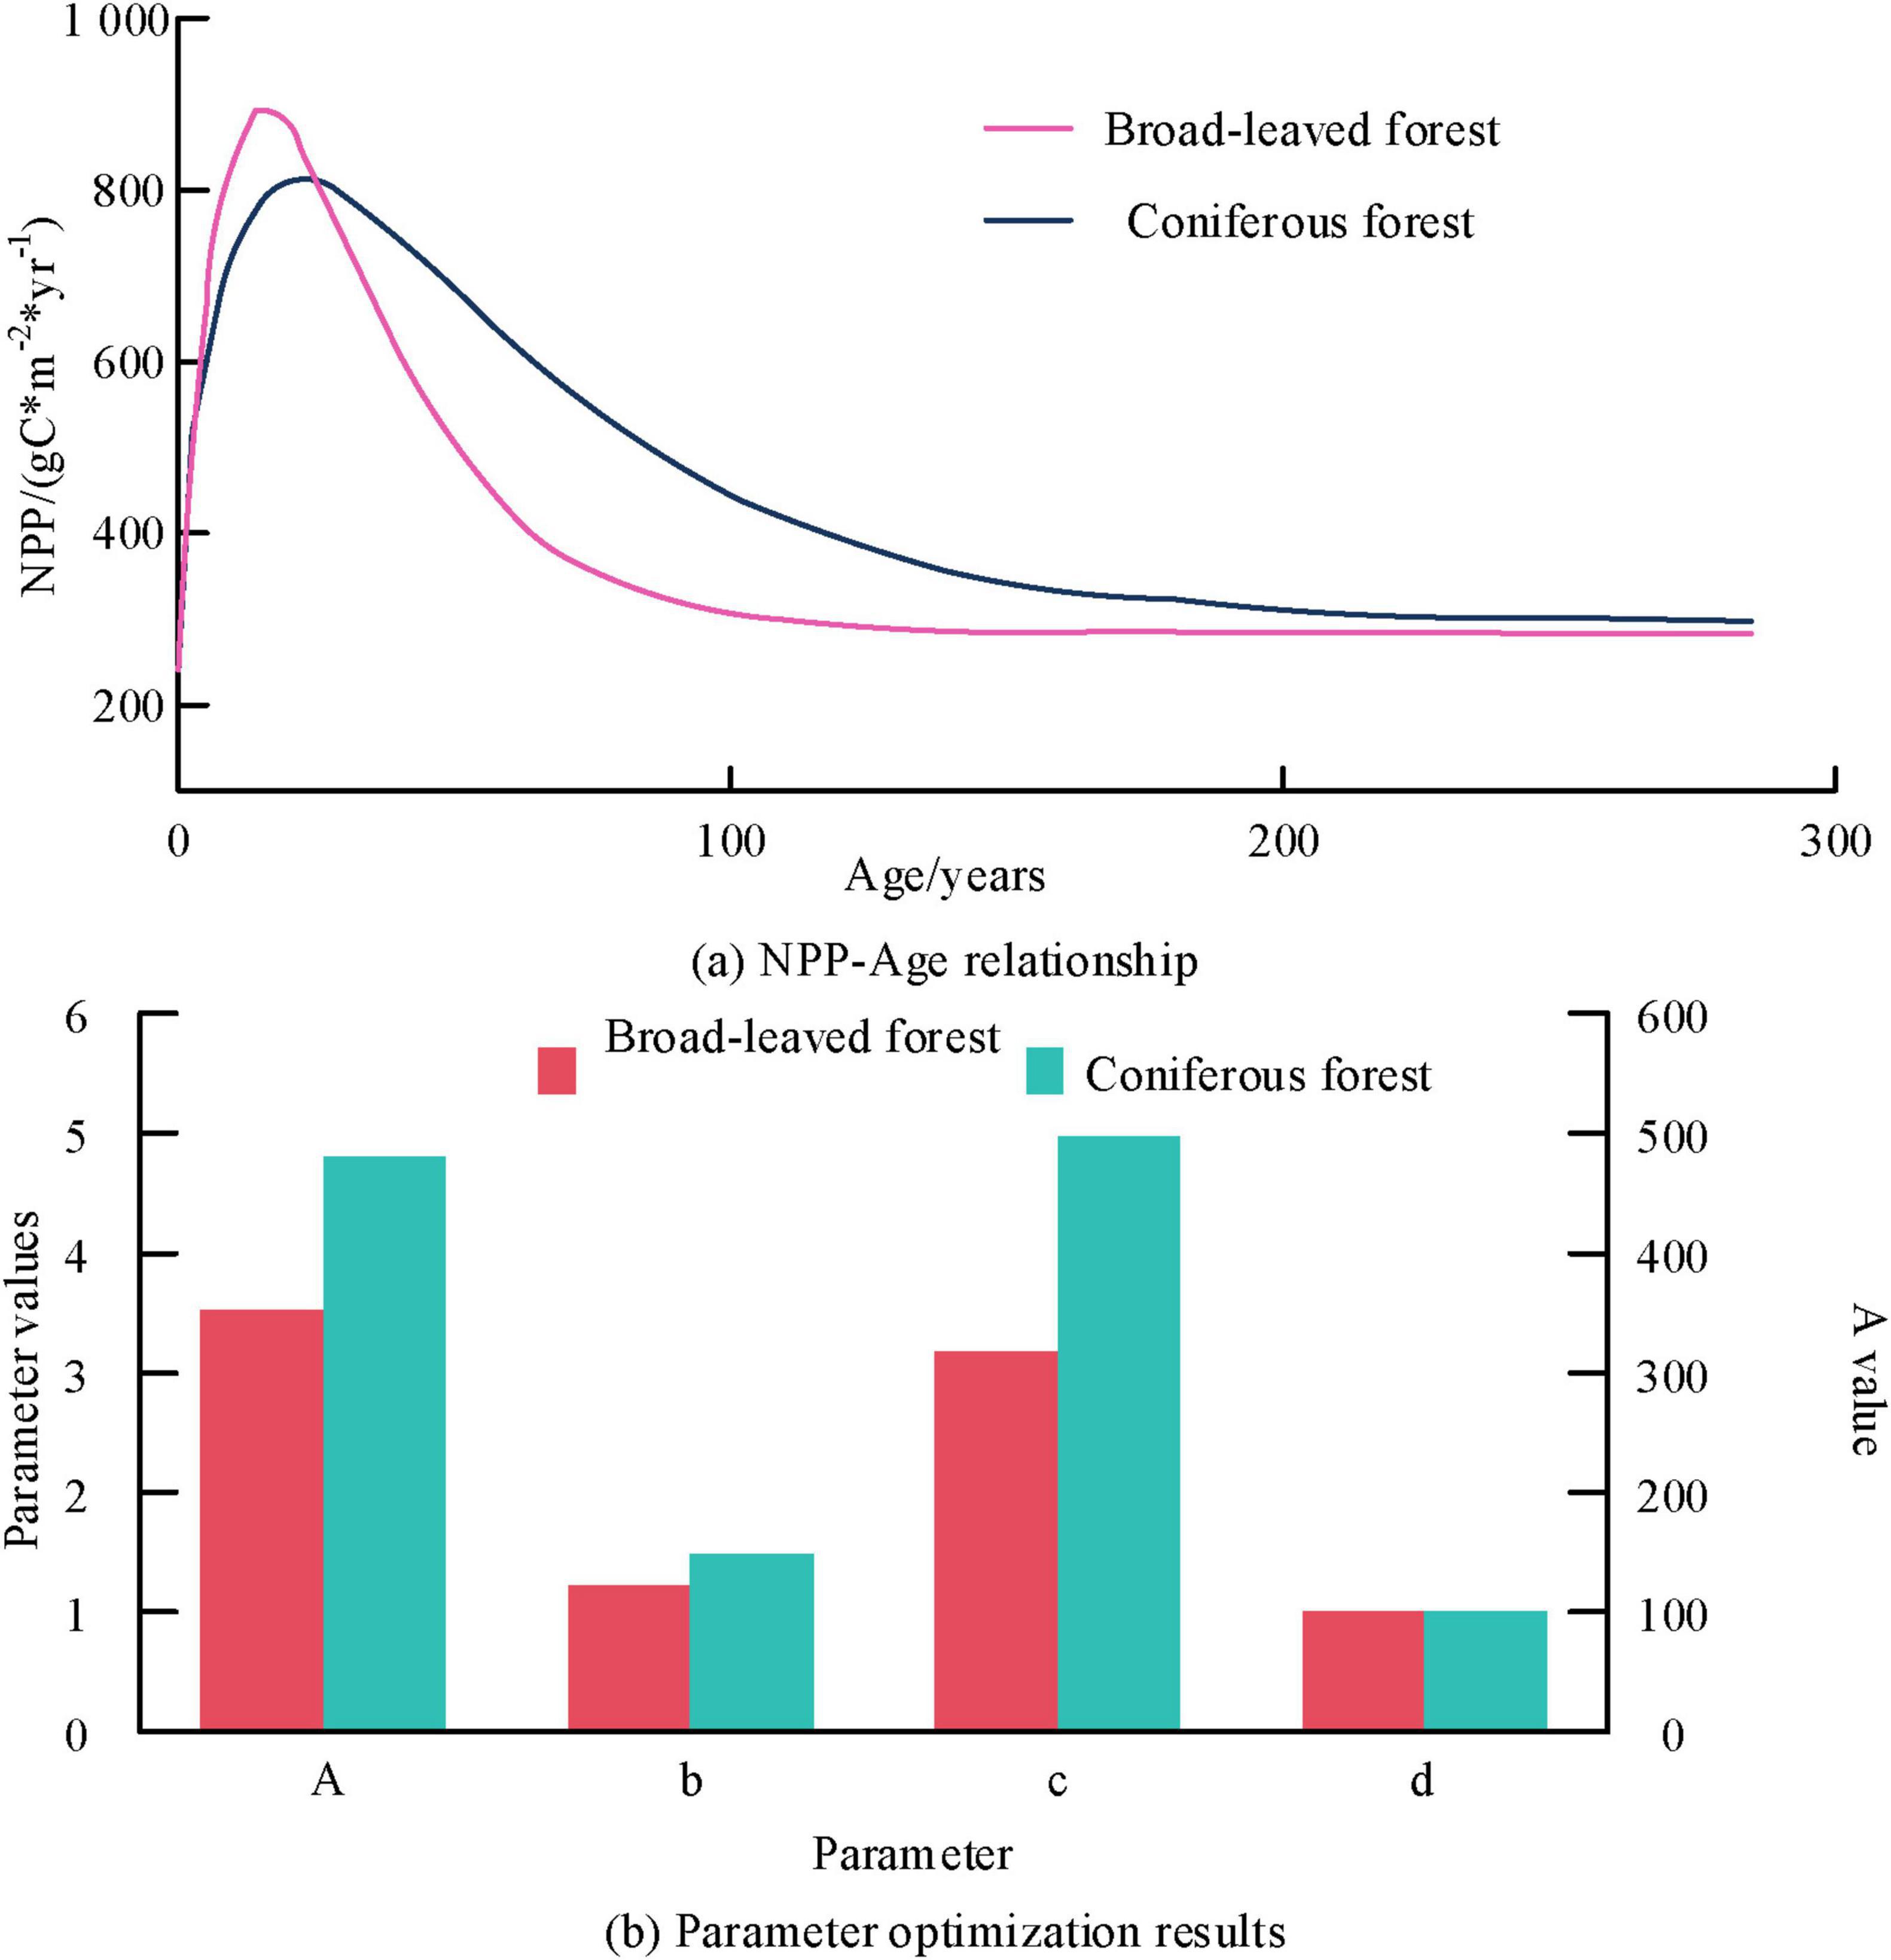
Figure 2. Optimization results of Net Primary Productivity (NPP) Age relationships and parameters for different forest types.
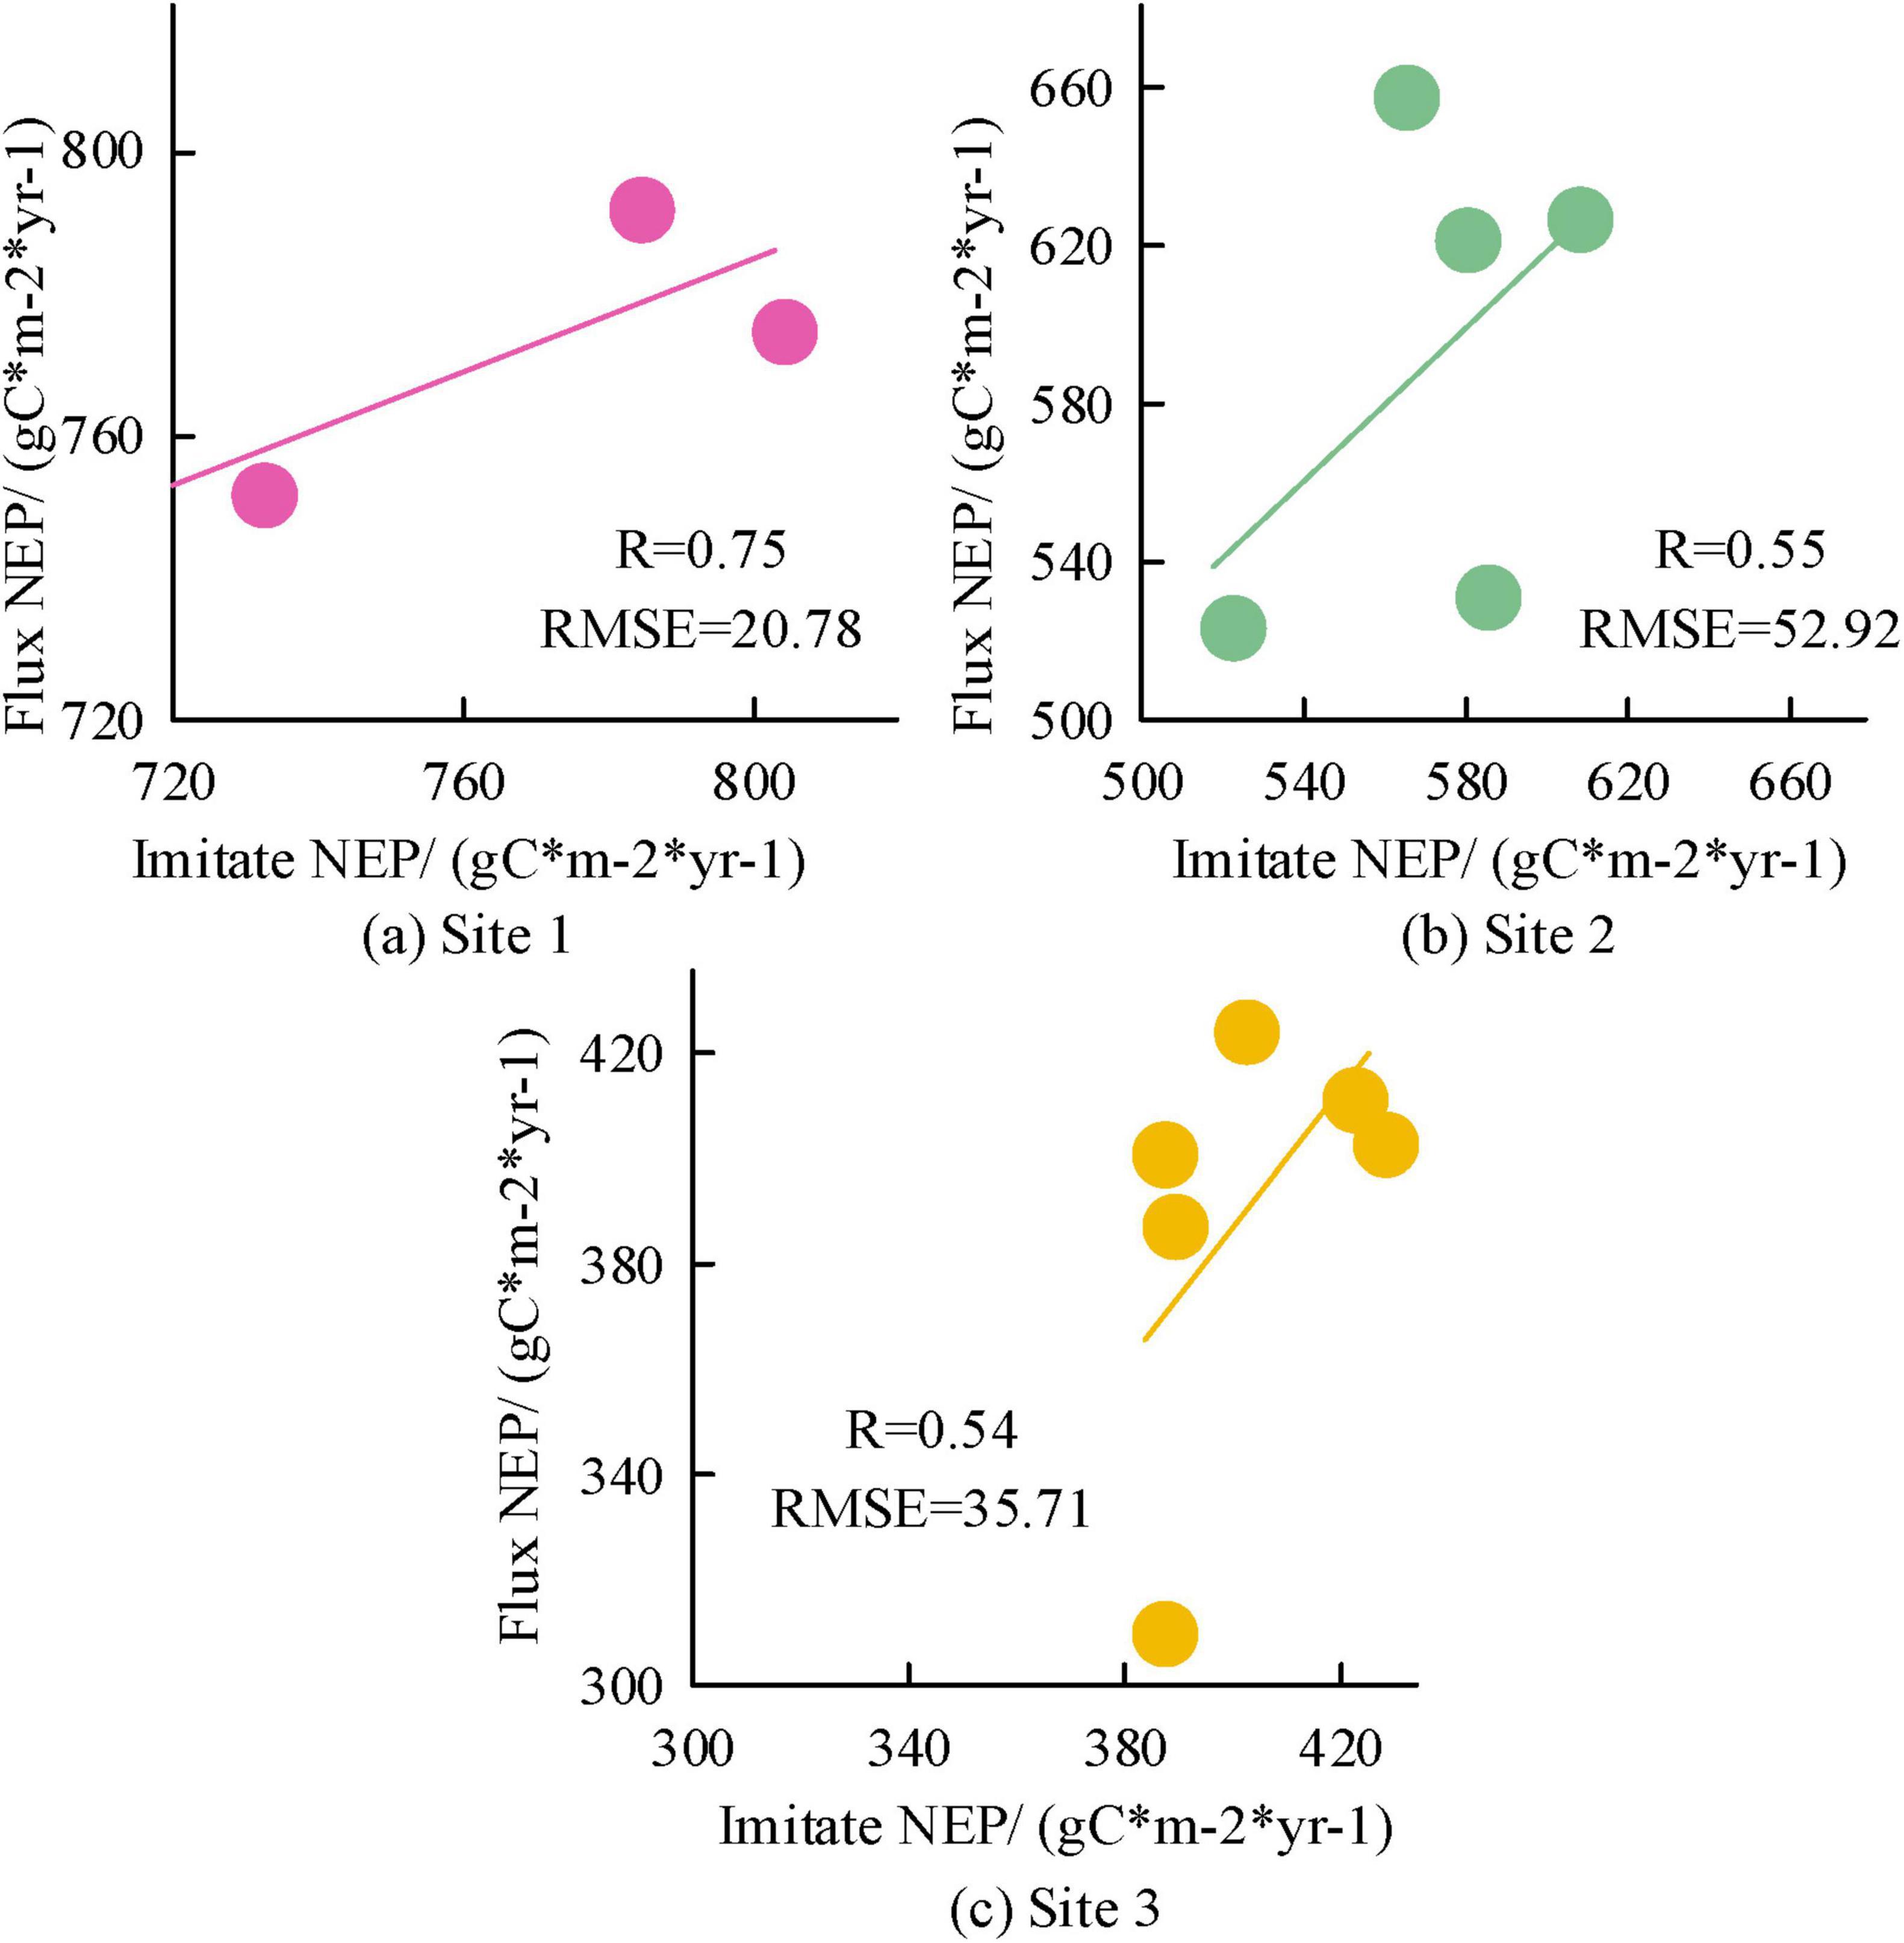
Figure 3. Accuracy results of Carbon Cycle Spatiotemporal (CCS) simulation based on Integrated Terrestrial Ecosystem Carbon Cycle Model (InTEC) model for different sites.
Figures 3a–c show the accuracy results corresponding to stations 1–3 based on the InTEC model CCS simulation. The R is a statistical measure of the strength and direction of the linear relationship between two variables. The relationship between two variables can be visually observed through a scatter plot, while the correlation coefficient provides a quantitative description. If there is a linear relationship between two variables in a scatter plot, the points in the scatter plot will show a certain trend, which can be approximated by a discount chart. This line is the regression line, which reflects the linear relationship between the two variables. The NEP time series changes observed at the three stations was consistent with the NEP simulated based on the InTEC model CCS. The R and RMSE for Site 1 were 0.75 and 20.78 gC*m–2*yr–1. The R and RMSE corresponding to Site 2 were 0.55 and 52.92 gC*m–2*yr–1. The R and RMSE corresponding to Site 3 were 0.54 gC*m–2*yr–1 and 35.71 gC*m–2*yr–1, respectively. The InTEC optimized by parameters has high accuracy in CCS simulation. It can be used for subsequent simulation and prediction of forest NEP spatiotemporal distribution. To further analyze the spatiotemporal distribution of forest NEP in the study area under past and future climate backgrounds, the InTEC model is simulated.
Figures 4a–d show the time series variation curves of the mean and total value of NEP in the study area corresponding to P1, P2, and P3 in past and future scenarios, respectively. From Figure 4, under past climate scenarios, the mean and total NEP values continuously decreased at a rate of 39.2 gC*m–2*yr–1 and 3.94 TgC/yr, reaching the minimum value in 1,985. Subsequently, with the continuous restoration of forests, they transformed into carbon sinks in 1,989. After 1989, the mean and total value of forest NEP continued to increase at a rate of 15.2 TgC/yr and 1.53 TgC/yr, corresponding to an increase in total carbon sequestration. In the future P1 scenario, the mean and total value of NEP decreased at a rate of 0.53 gC*m–2*yr–1 and 5.TgC/yr, respectively. The total carbon sink reached 4.25 gTgC/yr. In the future P2 scenario, the mean and total value of NEP decreased at a rate of 0.43 gC*m–2*yr–1 and 4.25 gTgC/yr, respectively. The total carbon sink reached 492.61 TgC. In the future P3 scenario, the mean and total value of NEP decreased at a rate of 0.36 gC*m–2*yr–1 and 3.49 TgC/yr, respectively, and the total carbon sink reached 770.15 TgC.
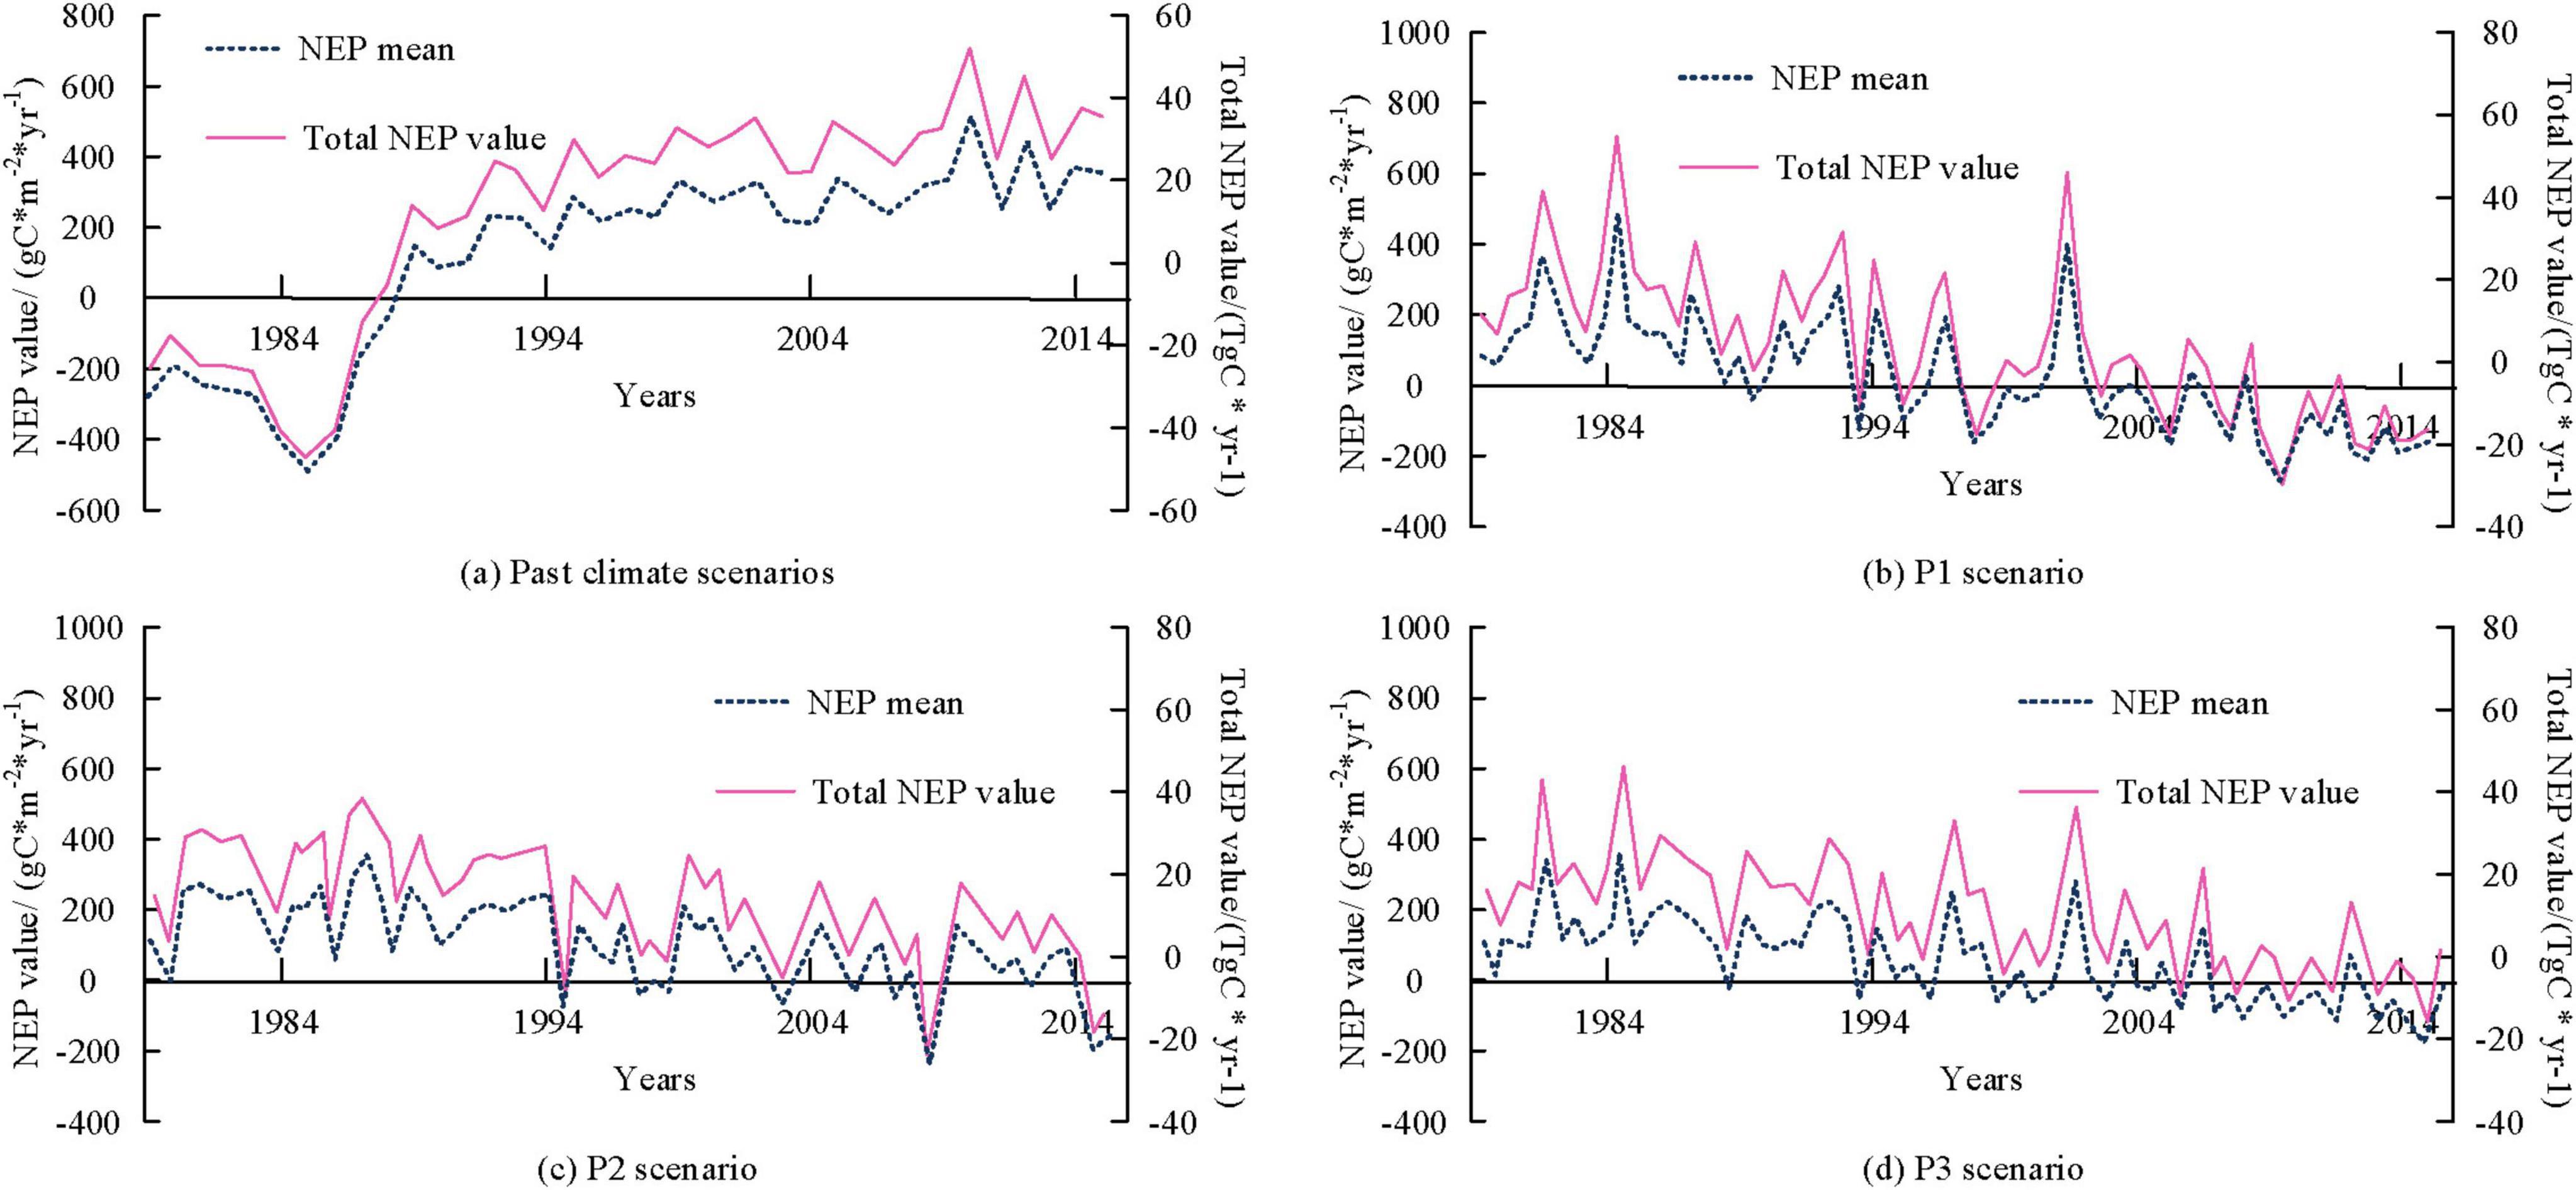
Figure 4. Time variation curve of the mean and total value of regional Net Ecosystem Productivity (NEP) at the century scale.
Figures 5a–d show the NEP value distribution corresponding to P1, P2, and P3 in past climate scenarios and future scenarios, respectively. From Figure 5, in the past climate scenarios, only the two regions with NEP values less than 0 continuously decreased, while the remaining regions with NEP values continuously increased. In the future P1 scenario, NEP showed an overall decreasing trend in both (300, 500) and (500, 2,000) regions, with only an overall increasing trend in regions with NEP less than −100. In the future P2 scenario, NEP showed a decreasing trend overall in (300, 500) and (500, 2,000) regions, and only showed an increasing trend overall in (−100, 0). In the future P3 scenario, NEP showed a decreasing trend overall in (100, 300) and (500, 2,000) regions, only showing an increasing trend overall in (0, 100) region.
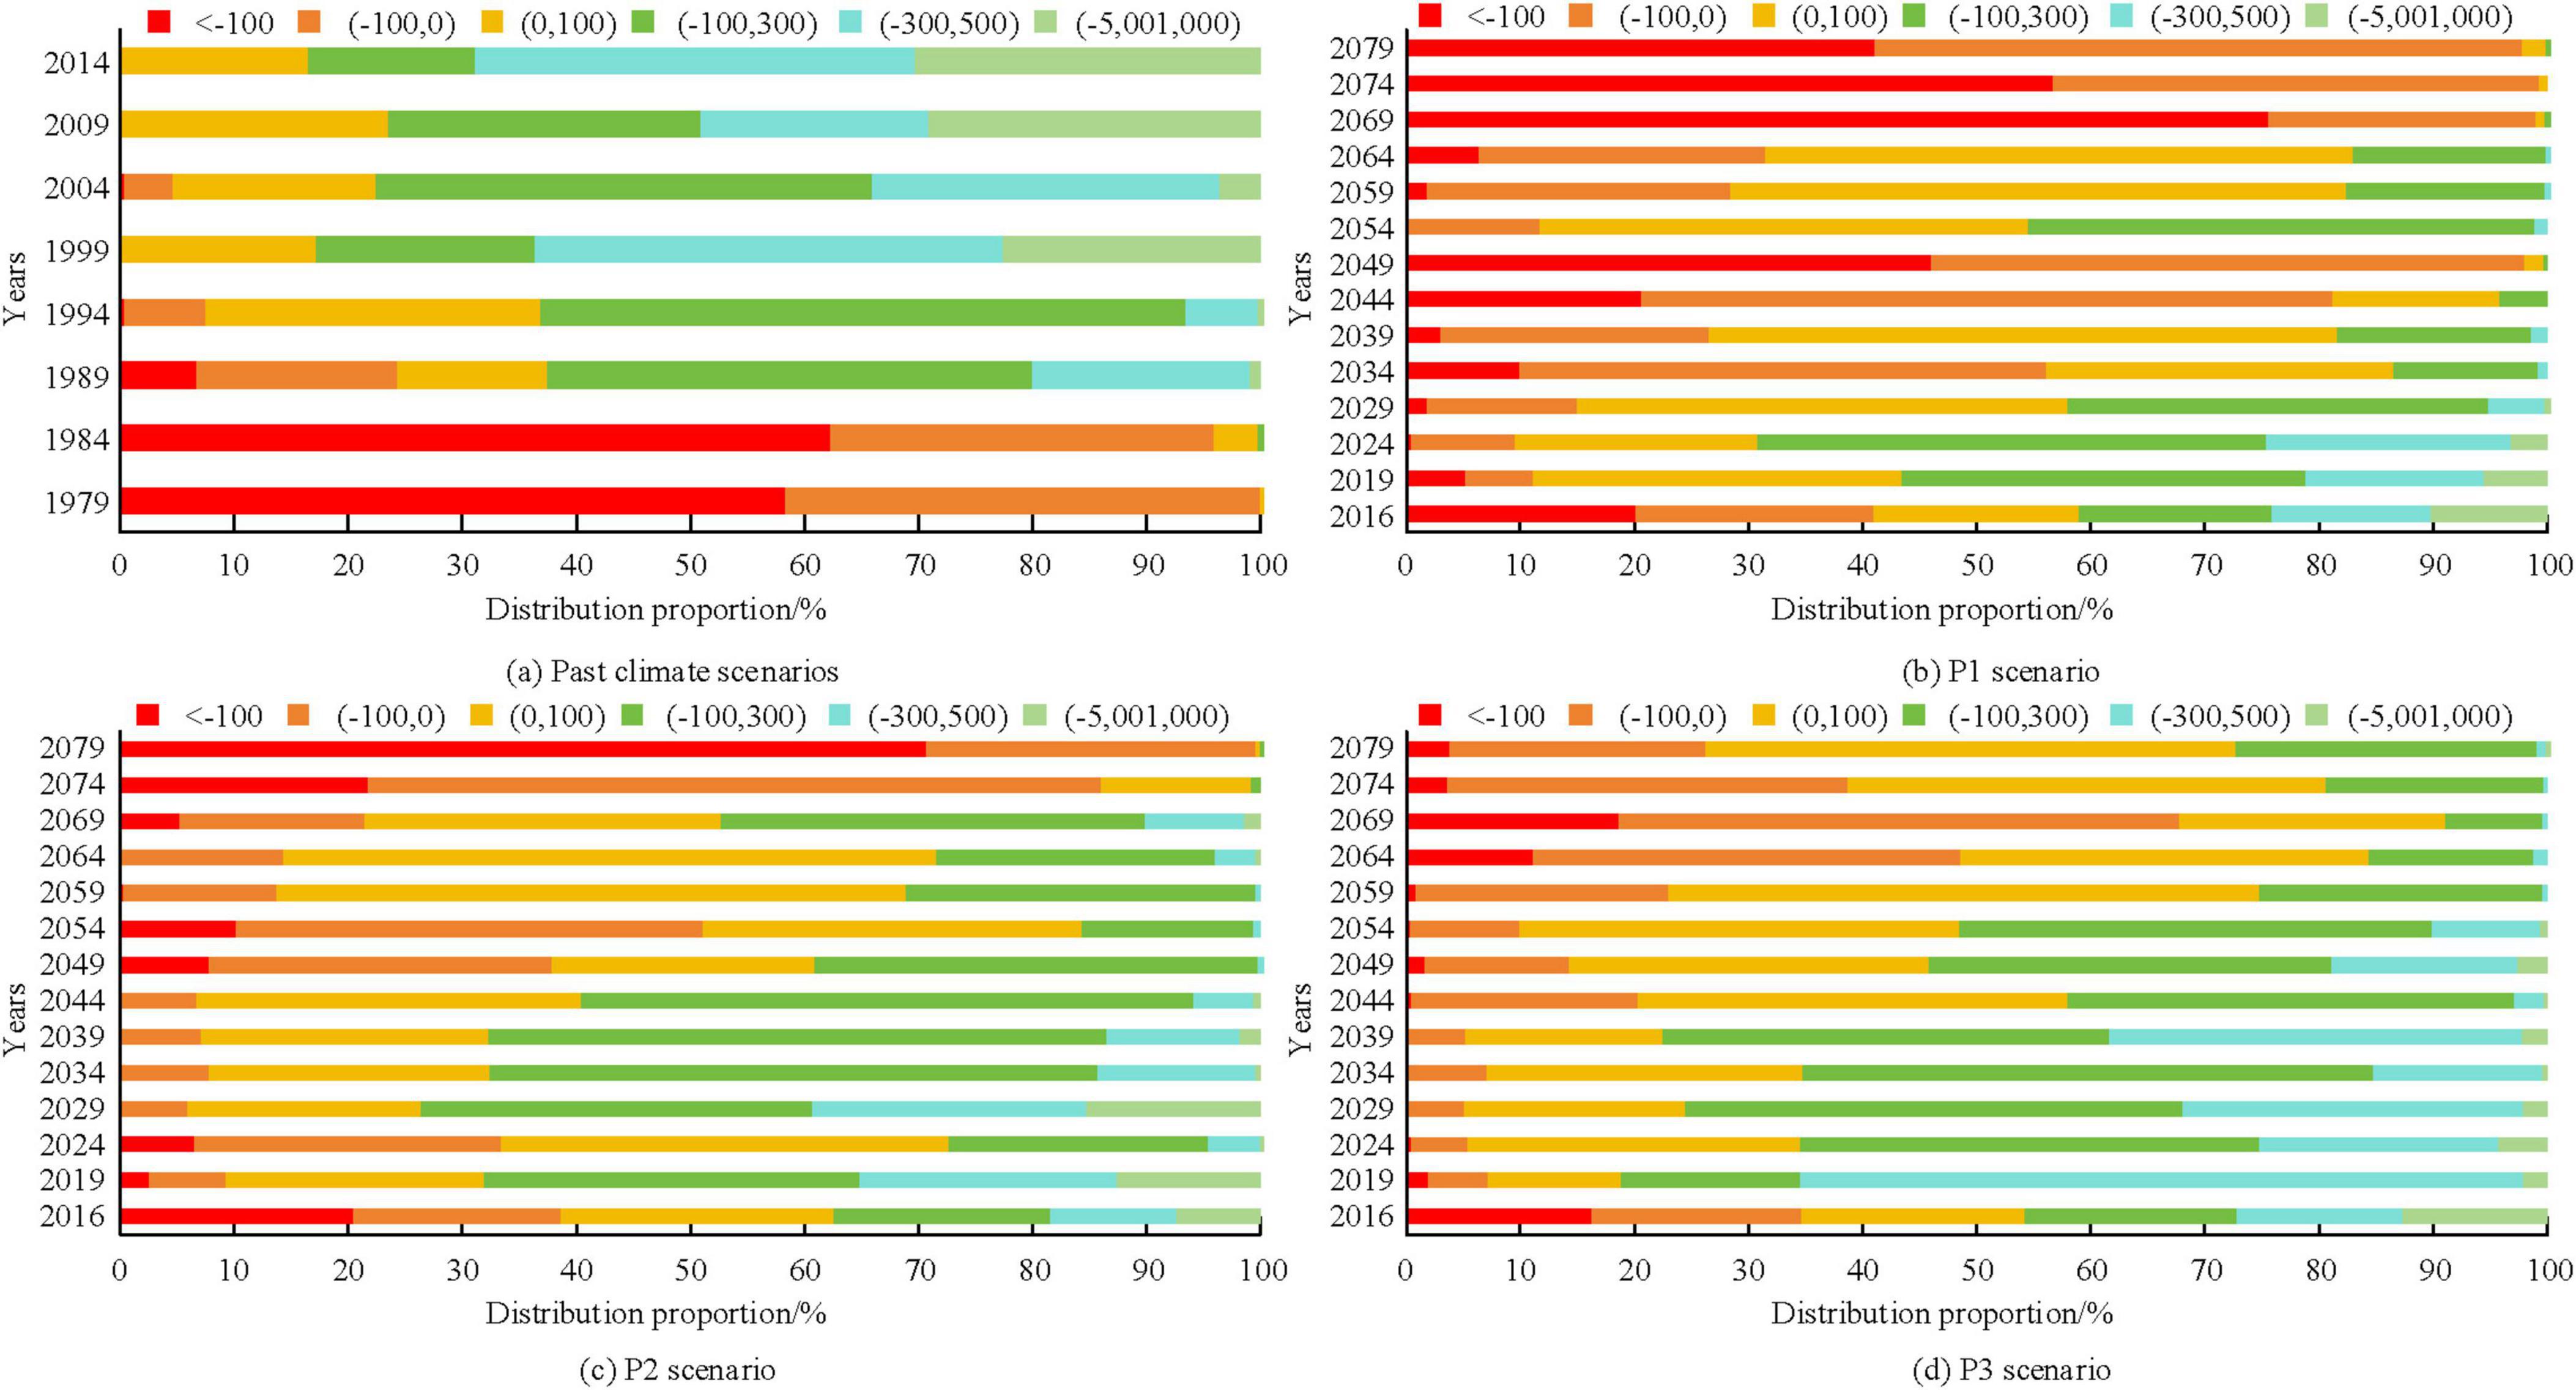
Figure 5. Distribution of Net Ecosystem Productivity (NEP) values in different contexts.
Figure 6a displays the spatial distribution of NEP in the study area under past climate scenarios. Figures 6b–j show the spatial distribution of NEP in the early, middle, and late stages under future P1, P2, and P3 scenarios, respectively. From Figure 6, in the past scenario, due to the implementation of forest protection measures, the local climate and geological conditions were suitable for forest growth. Therefore, the carbon sequestration capacity of regional forests can be restored to a higher state. In the future P1 scenario, most of the initial research area was carbon sinks. With the continuous growth of forest age, most areas gradually shifted toward carbon sources in the later stage.

Figure 6. The spatial distribution results of regional Net Ecosystem Productivity (NEP) at the century scale. The NEP value range from red to dark green is −2000 to 2000.
To explore the response mechanism of subtropical forest carbon cycle to climate change, this study analyzes the relationship with NEP from four perspectives: temperature, precipitation, relative humidity, and solar radiation.
Figures 7a, b show the temperature time variation curves of the study area corresponding to past and future scenarios, respectively. The temperature ranges corresponding to P1, P2, and P3 in the past and future scenarios were [16.79, 19.09], [19.01, 20.62], [19.05, 20.96], and [19.05, 22.62], respectively. The corresponding growth rates every decade were 0.45°C, 0.08°C, 0.16°C, and 0.35°C, respectively. In different radiation intensities, the P1 scenario remained stable, while both the P2 and P3 scenarios showed a clear upward trend, with the P3 scenario growing the fastest.
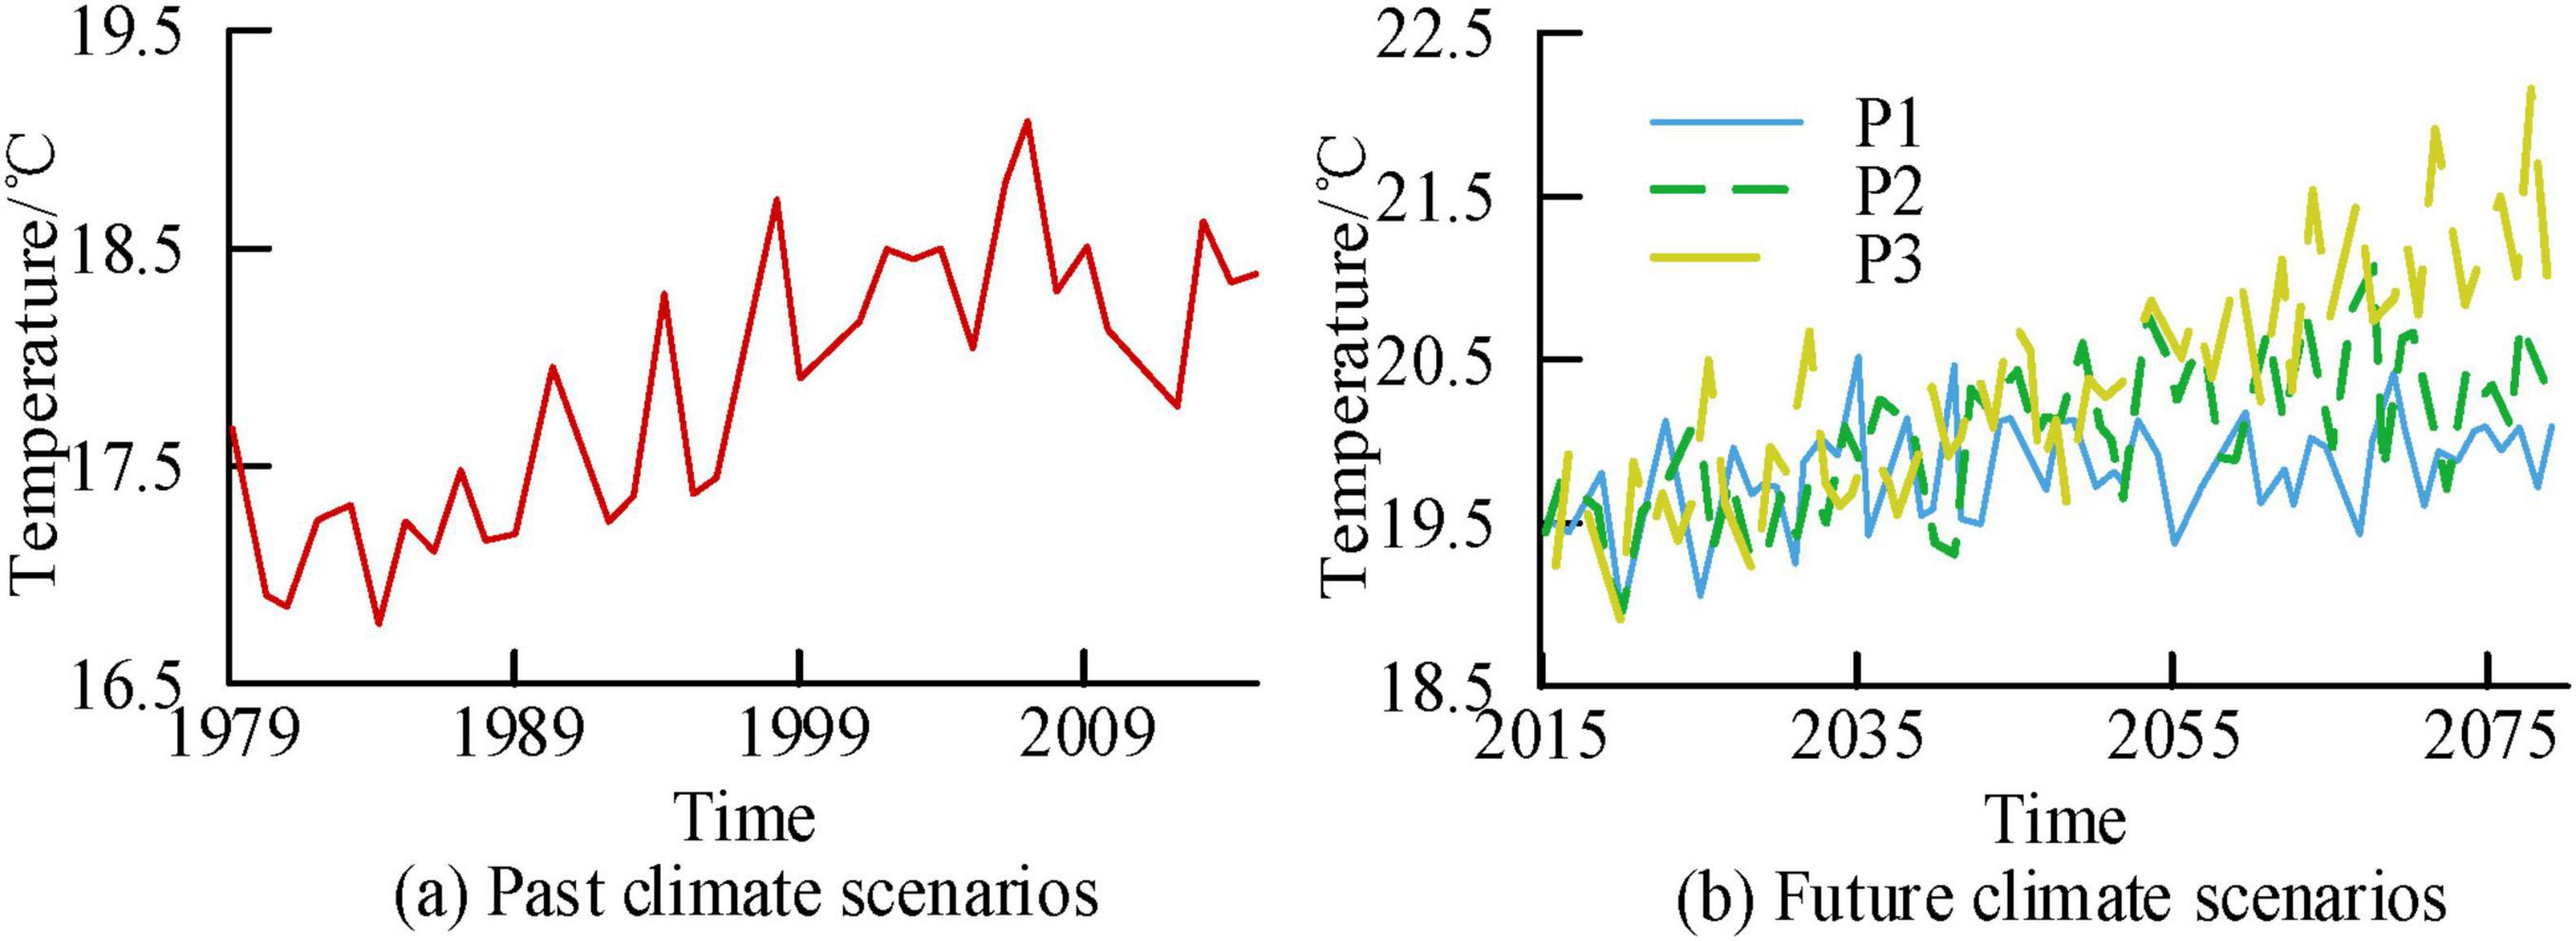
Figure 7. Time series variation curves of regional temperature under different scenarios.
Figures 8a–d show the correlation analysis results between temperature and NEP for P1, P2, and P3 under past and future scenarios, respectively. From Figure 8, before 2,000, there was a positive correlation between temperature and NEP, with a R of 0.56. Afterwards, the two transformed into a negative correlation. This is because the former is in the young forest stage, and the increase in temperature has a significant promoting effect on the photosynthesis of the trees. The growth rate of the latter forest continues to slow down, and the promoting effect of temperature is also weakening. In the future scenario, the corresponding annual average temperature ranges for P1, P2, and P3 were (17.83°C, 20.62°C), (17.83°C, 20.96°C), and (17.73°C, 22.32°C), respectively. At the same time, global temperatures are also increasing due to the greenhouse effect, which have adverse effects on the carbon sequestration capacity of forest ecosystems. In the P1, P2, and P3 scenarios, temperature and NEP presented a negative correlation, with the P3 scenario having the highest R value of −0.82.
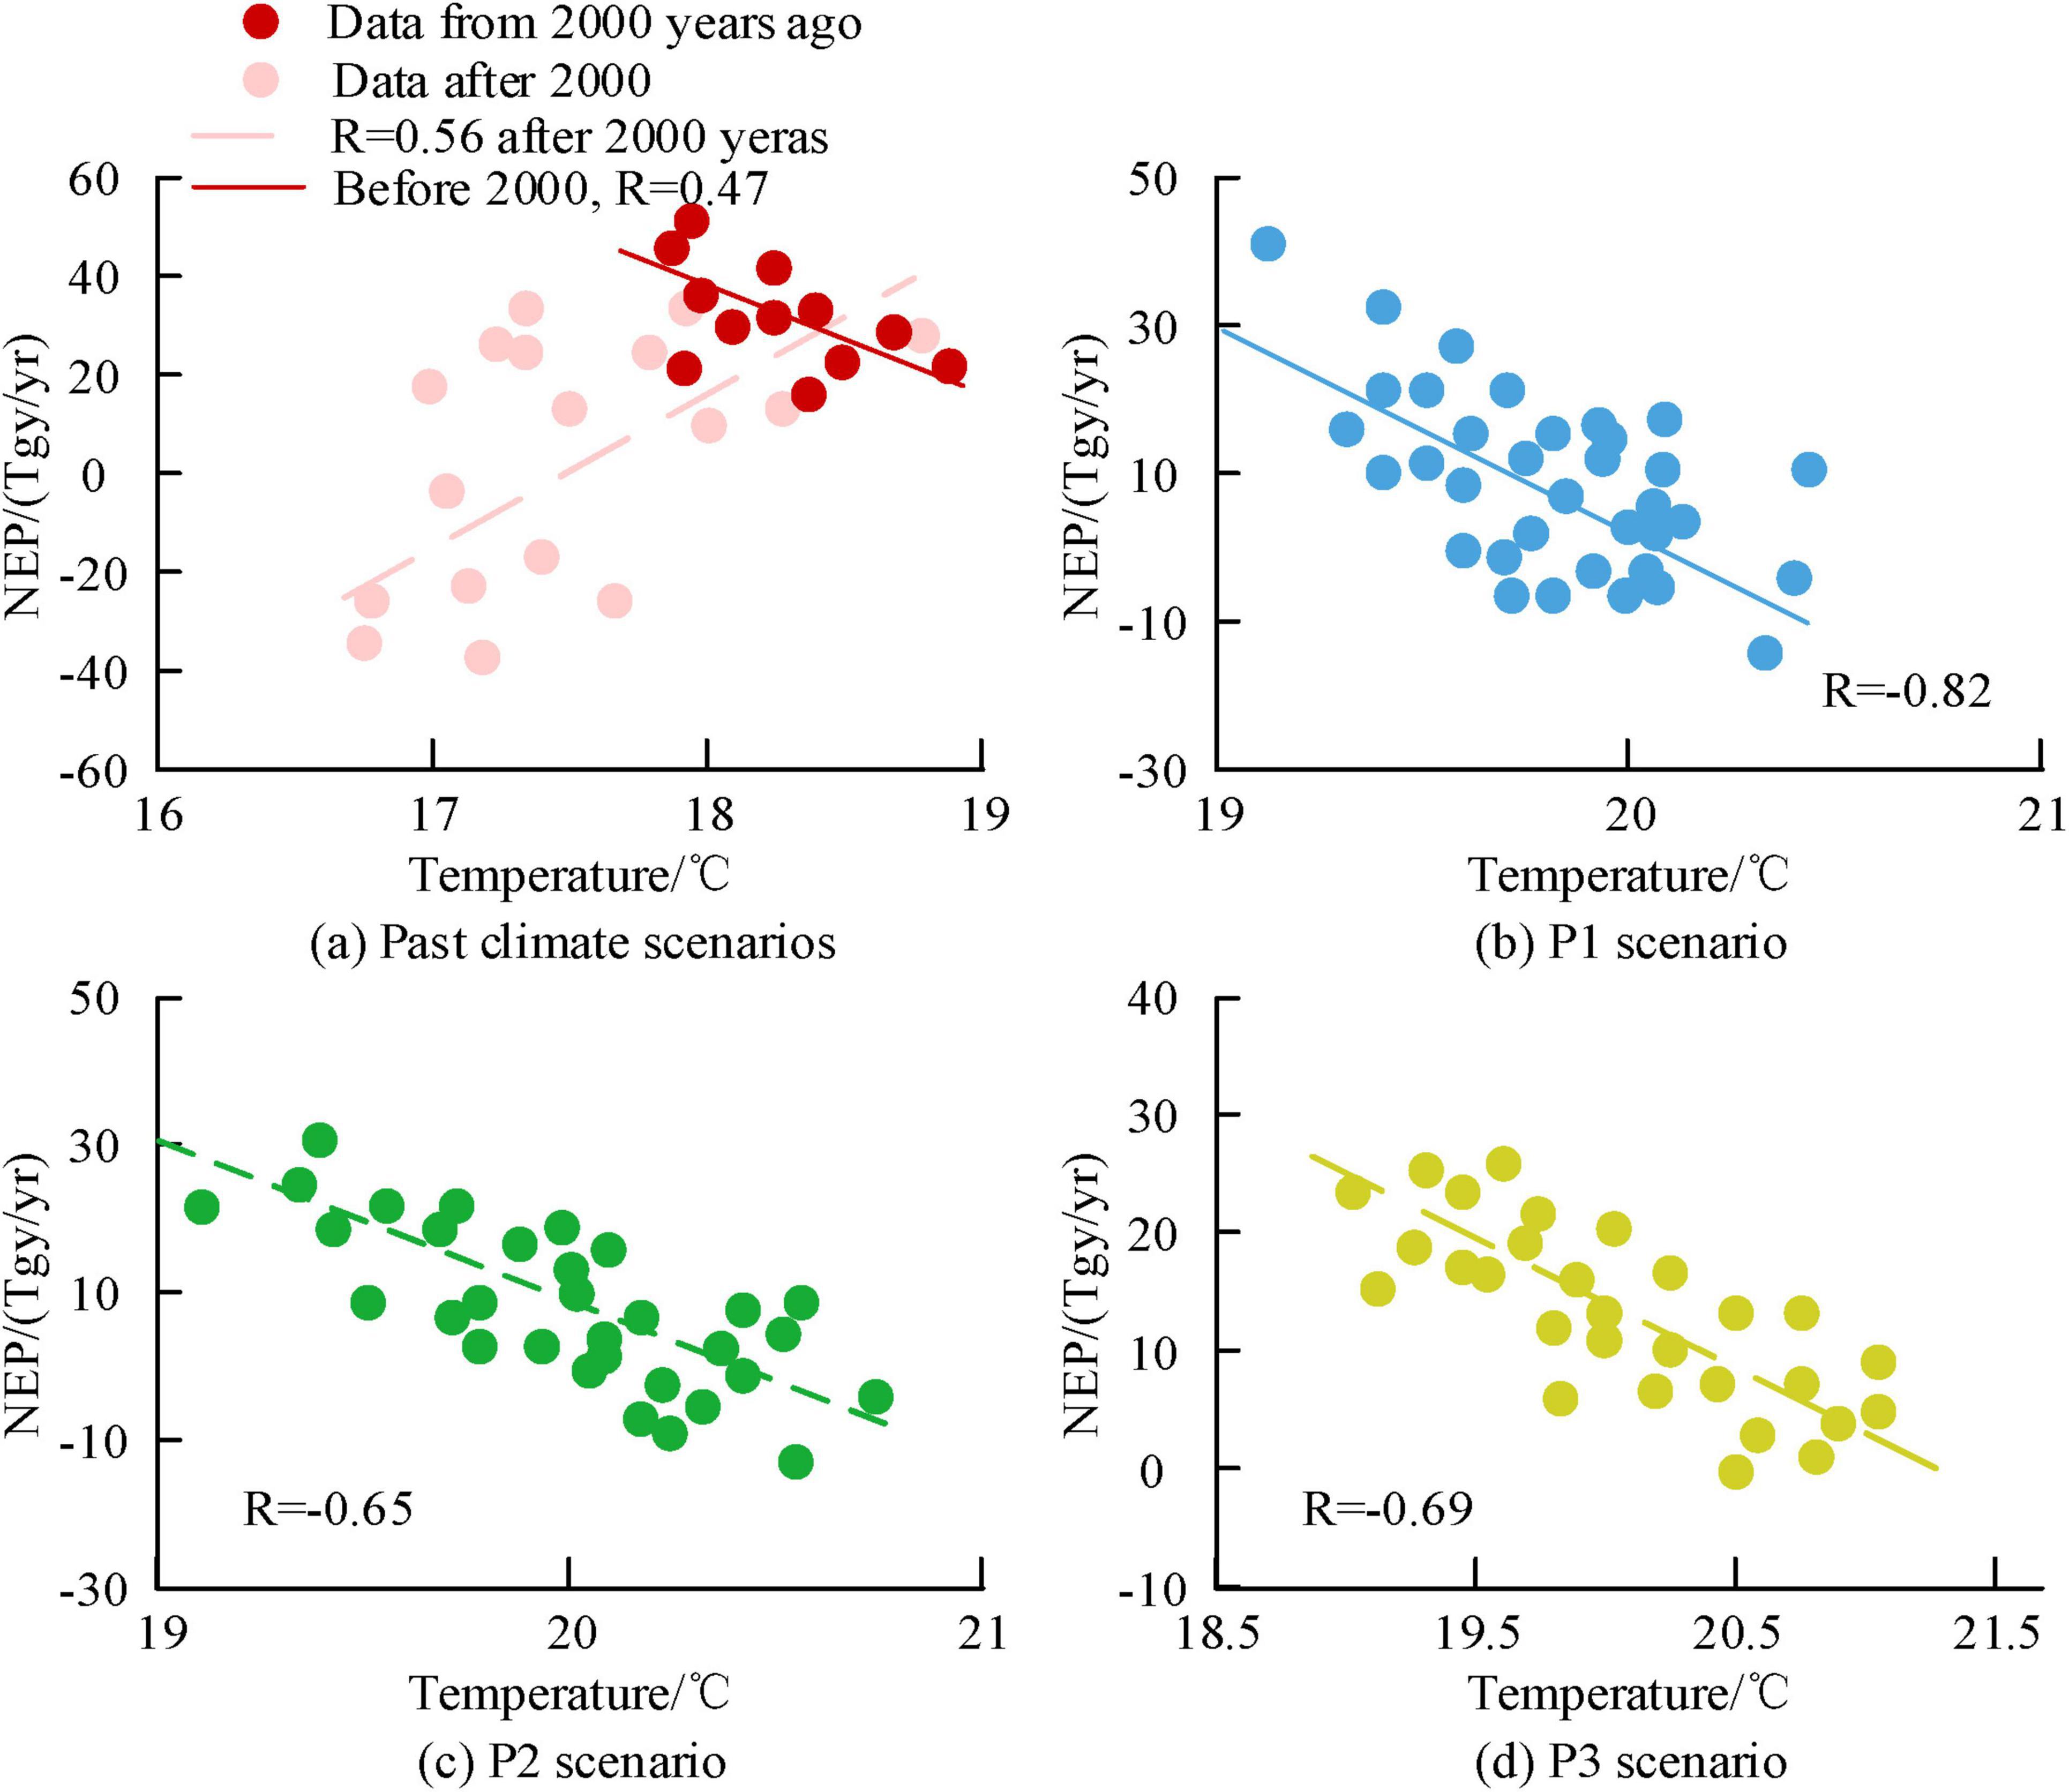
Figure 8. Analysis of the correlation between regional temperature and Net Ecosystem Productivity (NEP) at the century scale.
Figures 9a, b show the temporal variation curves of precipitation in the study area corresponding to past and future climate scenarios, respectively. From Figure 9, the precipitation ranges corresponding to the past climate scenario, P1, P2, and P3 scenarios were (1076.4 mm, 1891.3 mm), (895.1 mm, 2087.1 mm), (753.7 mm, 1679.1 mm), and (858.4 mm, 1694 mm), respectively. The average corresponding precipitation was 1494.6 mm, 1247.3 mm, 1216.3 mm, and 1223.4 mm. From the above results, compared with past climate scenarios, the precipitation of the three future scenarios significantly decreased.
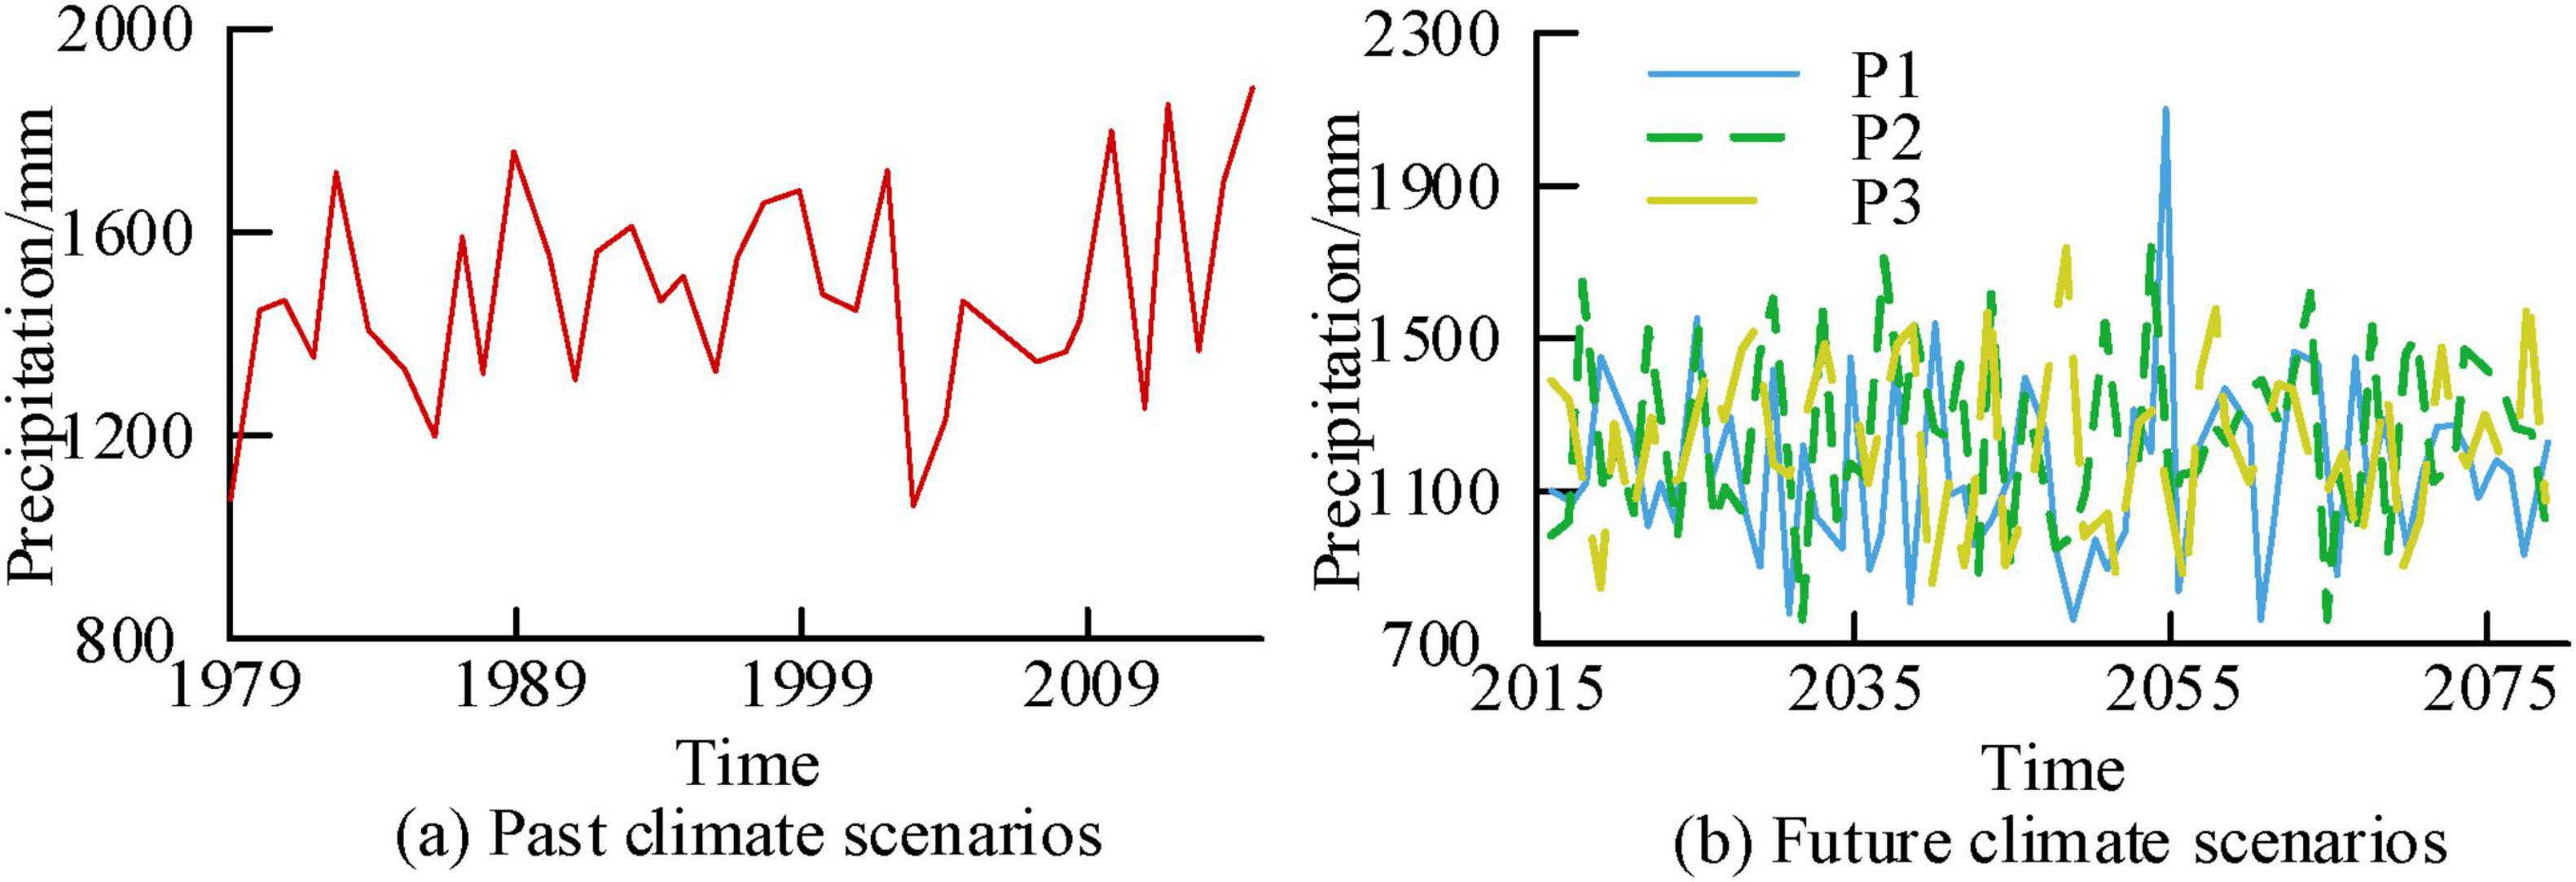
Figure 9. Time variation curve of regional precipitation at a 100 years scale.
Figures 10a–d show the correlation analysis results between precipitation and NEP for P1, P2, and P3 under past and future scenarios, respectively. Figure 10 shows a positive correlation between precipitation before 2000 and NEP in past climate scenarios. Afterwards, the two remained positively correlated, with a R of 0.84. The relationship between precipitation in other future scenarios and NEP displayed a positive correlation, with R values of 0.38, 0.33, and 0.12 for P1, P2, and P3, respectively. From the above results, in the future scenario, the precipitation in the P1 scenario had the greatest impact on the NEP value.

Figure 10. Analysis of the correlation between regional precipitation and Net Ecosystem Productivity (NEP) at century scale.
Figures 11a, b correspond to the relative humidity time variation curves of past climate scenarios and future scenarios, respectively. From Figure 11, the average relative humidity corresponding to the past climate scenario, P1, P2, and P3 were 76.33%, 67.24%, 67.36%, and 67.29%, respectively. In addition, compared with the relative humidity of past climate scenarios, the future three scenarios had lower relative humidity values.
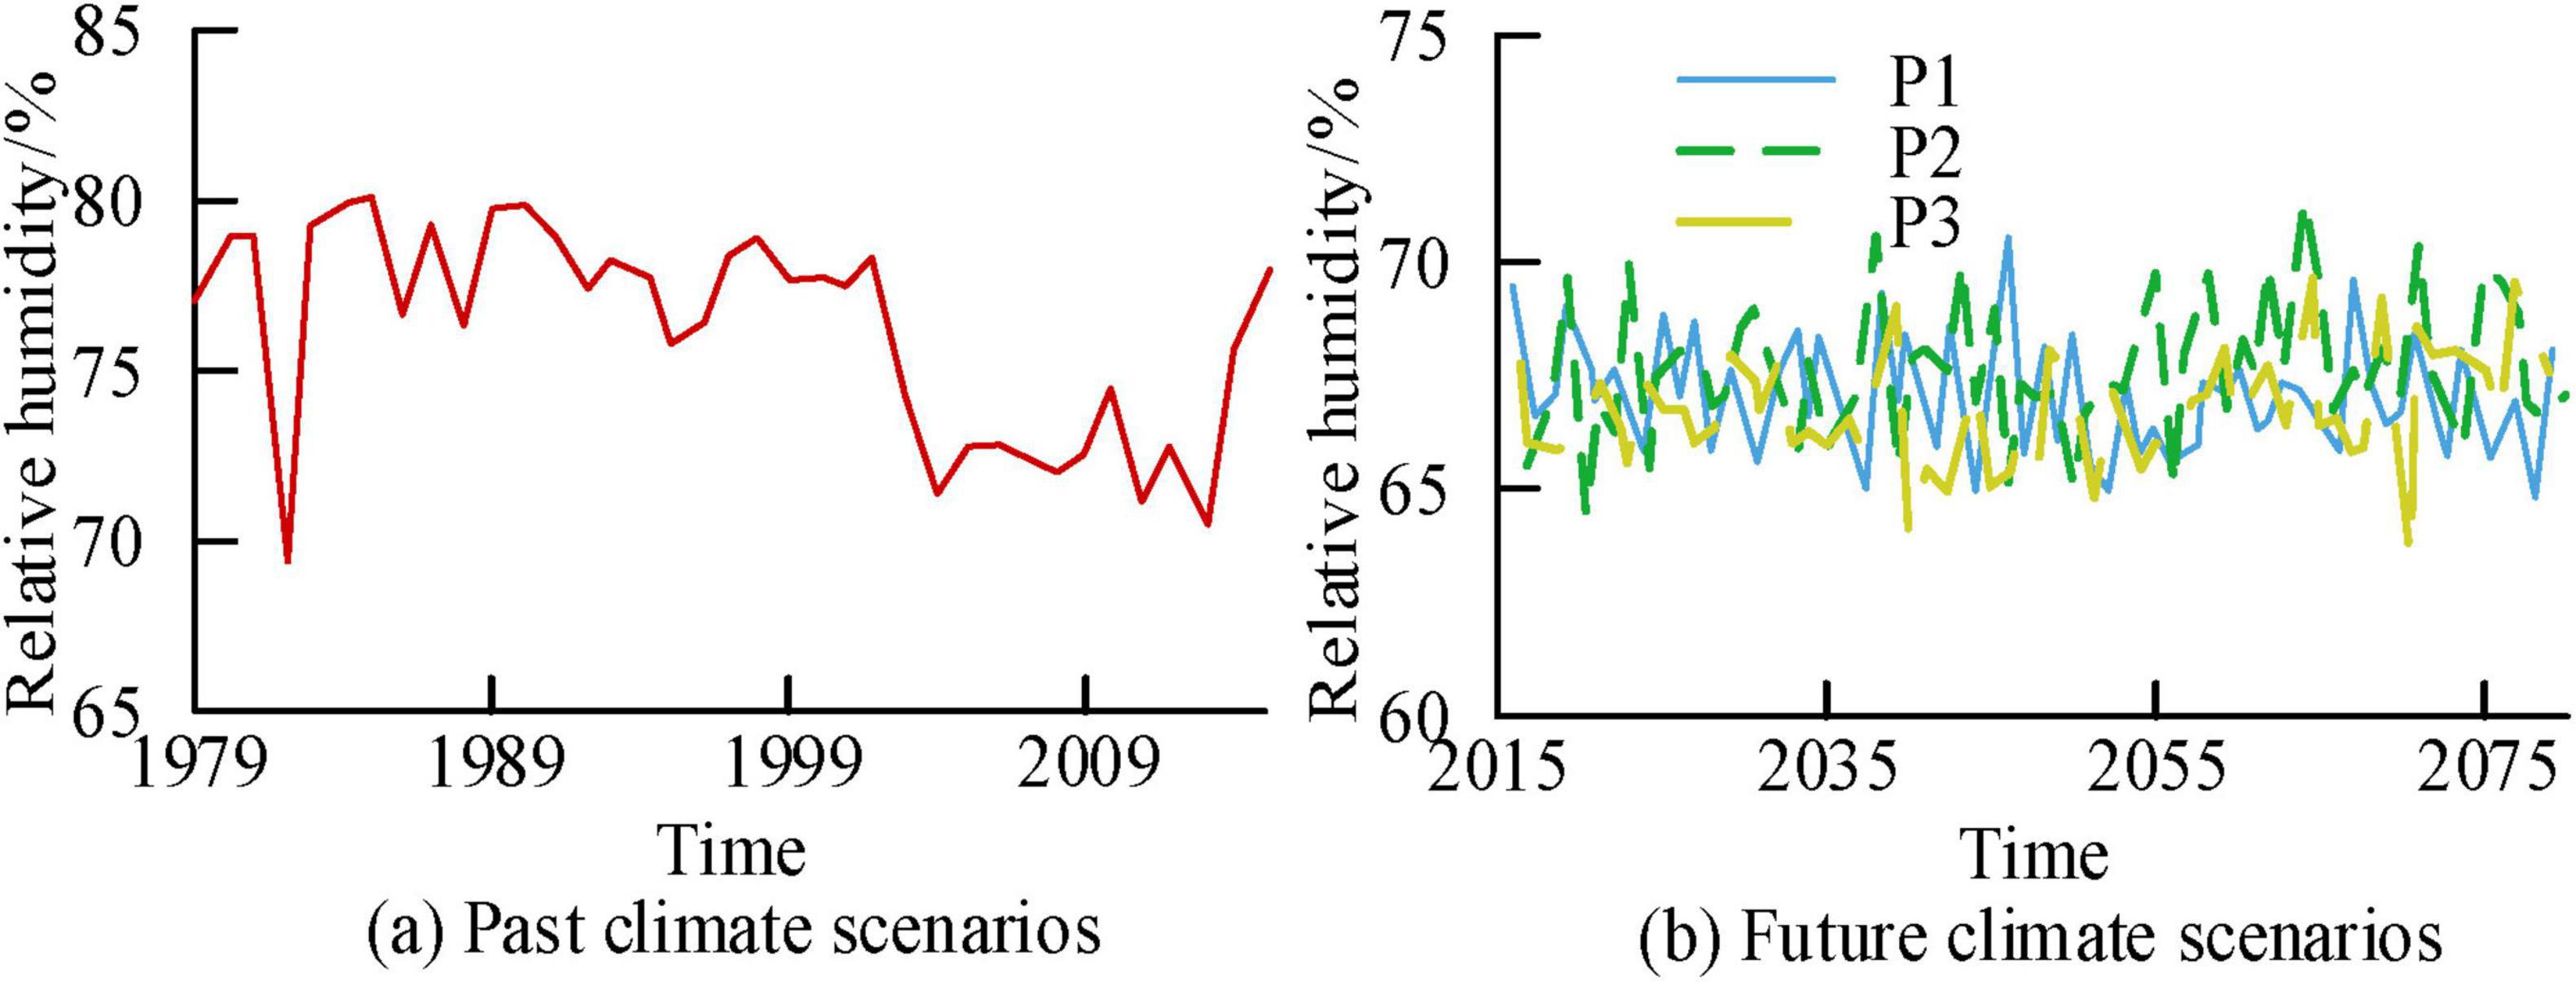
Figure 11. Time variation curve of relative humidity in the study area at a 100 years scale.
Figures 12a–d show the correlation analysis results of relative humidity and NEP for past climate scenarios, future P1, P2, and P3 scenarios, respectively. Figure 12 shows a negative correlation between relative humidity and NEP in past climate scenarios. The corresponding R values before and after 2,000 were 0.01 and 0.23, respectively. In the future scenario, the corresponding R values for P1, P2, and P3 were 0.25, 0.11, and −0.24, respectively. In the P3 scenario, there was a negative correlation between relative humidity and NEP, while in the other scenarios, there was a positive correlation.
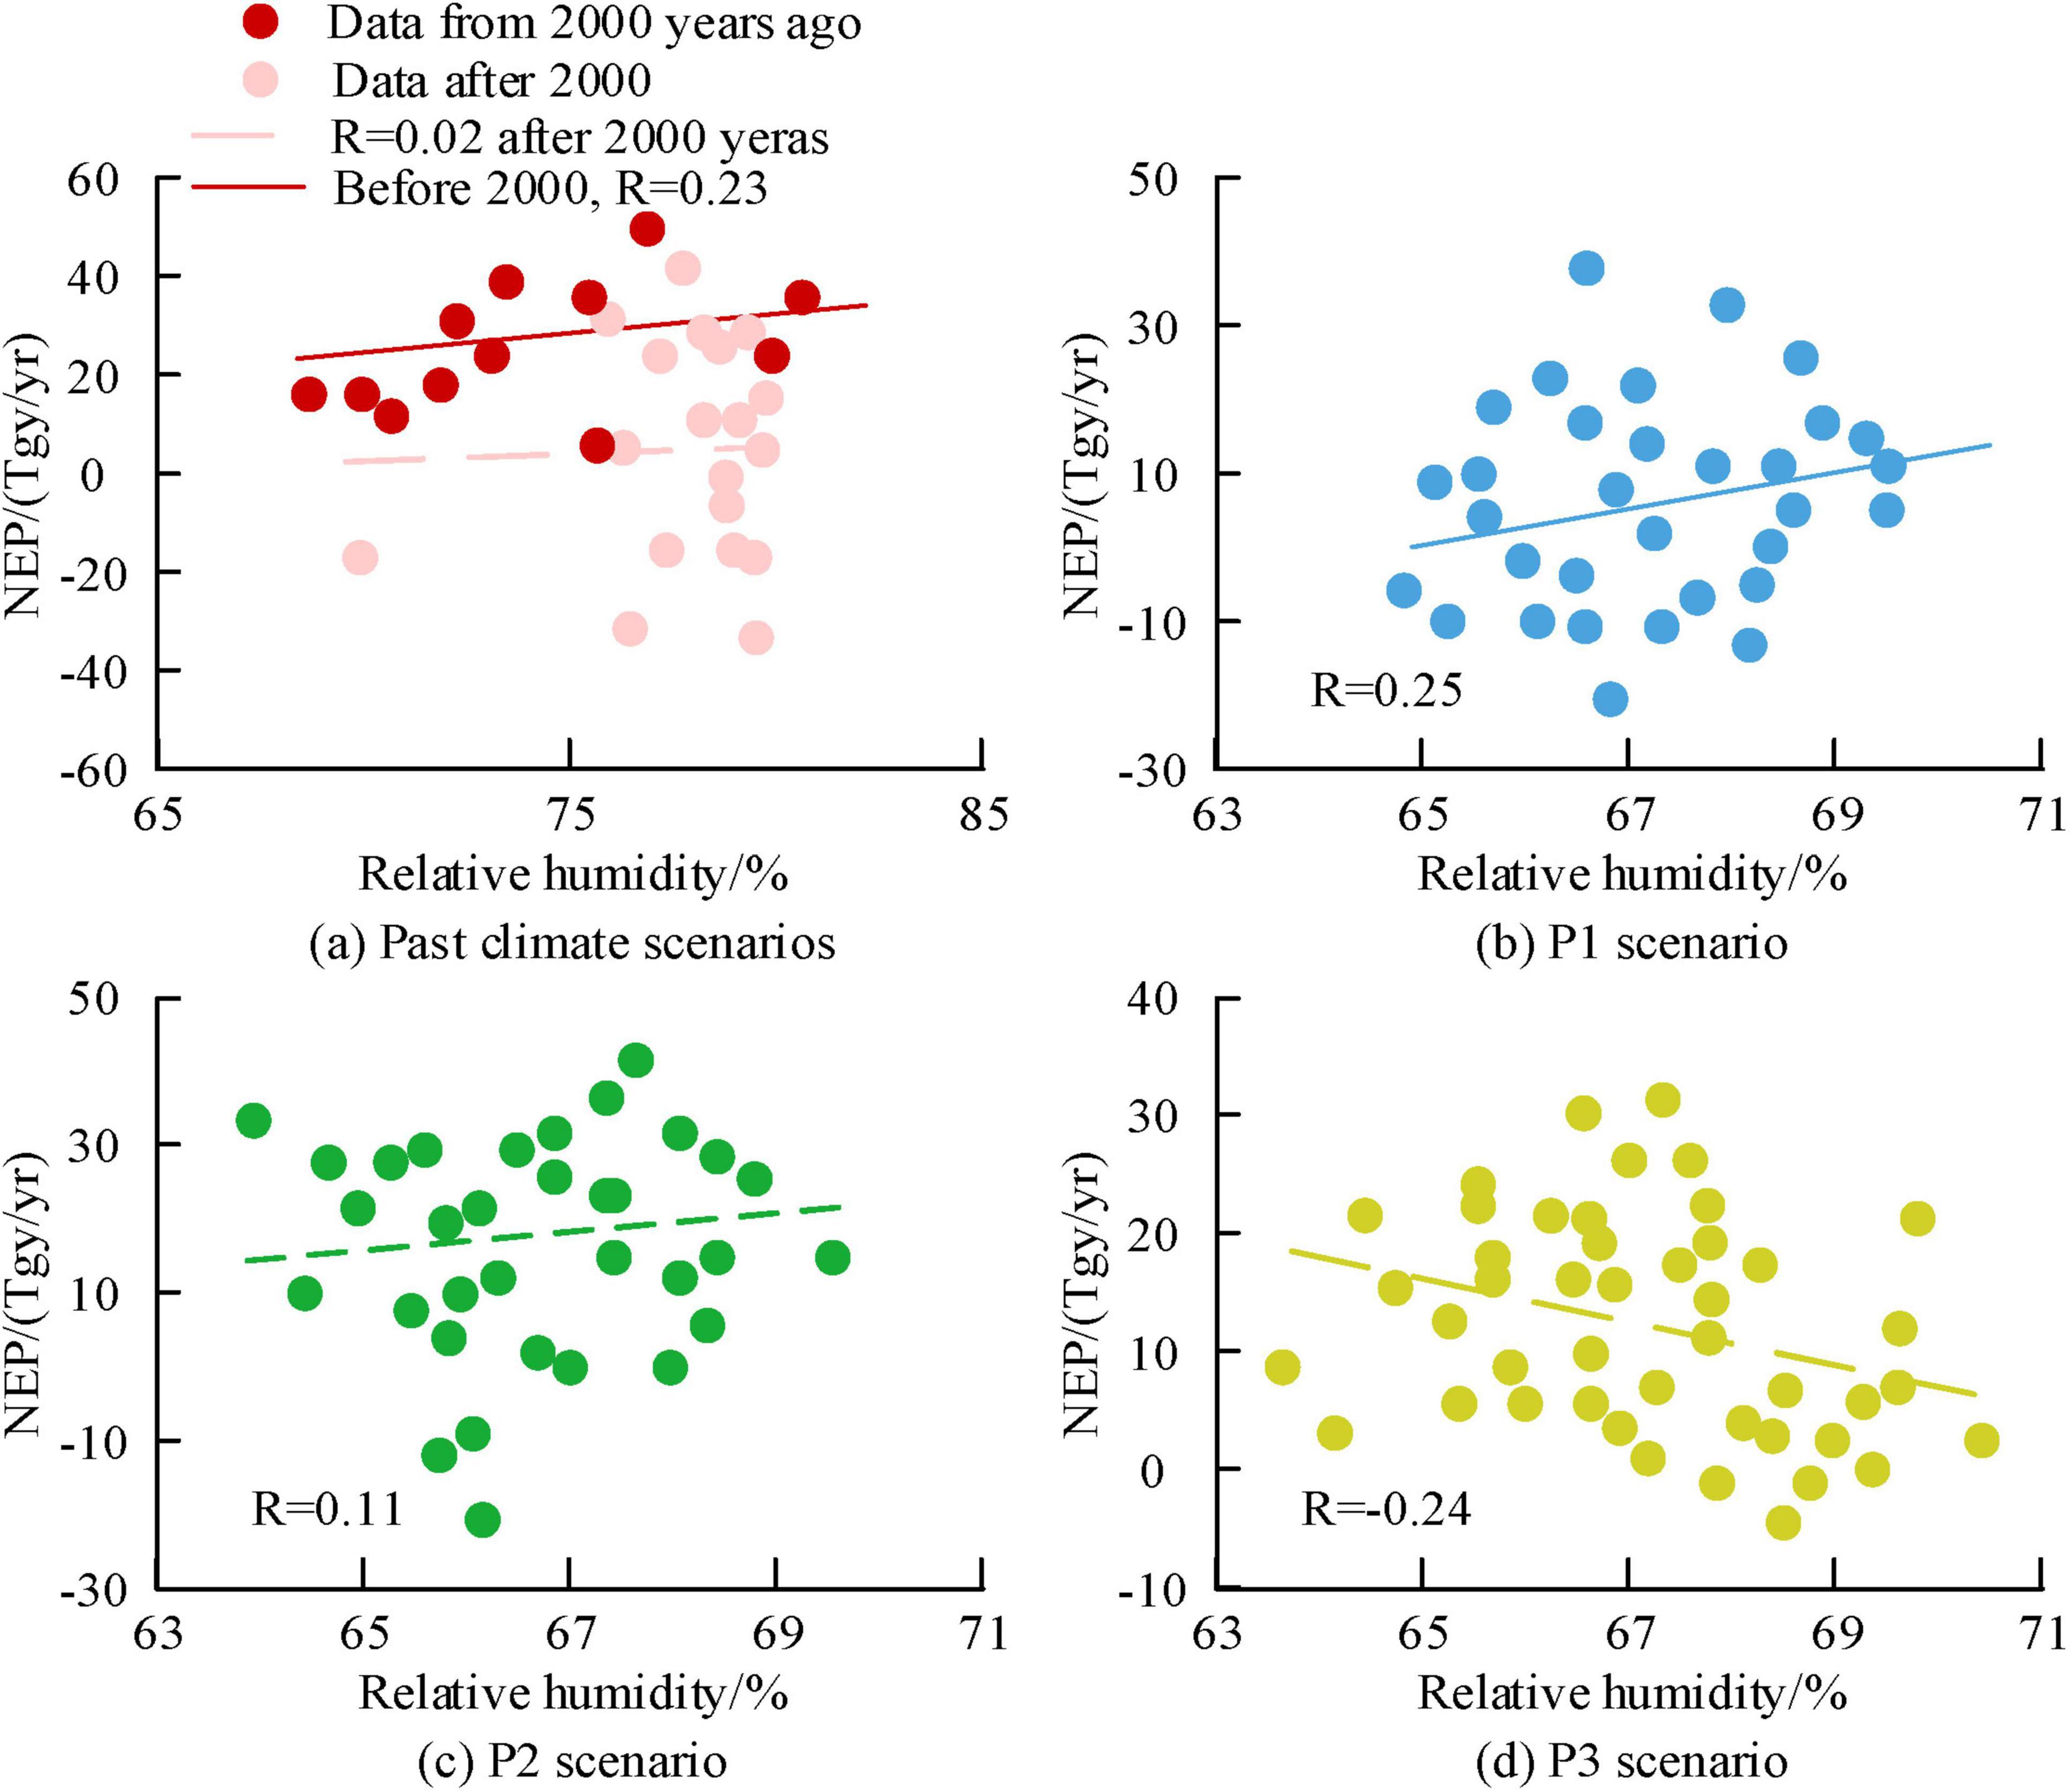
Figure 12. The correlation analysis results between relative humidity and Net Ecosystem Productivity (NEP) in the study area at a century scale.
Figures 13a, b show the time variation curves of solar radiation for past and future scenarios, respectively. According to Figure 13, the average solar radiation for past climate scenarios, future P1, P2, and P3 scenarios were 138.29 W/m2, 192.96 W/m22, 193.69 W/m2, and 194.17 W/m2, respectively. Overall, in the solar radiation results of each scenario, the simulation results of future scenarios have higher solar radiation values.
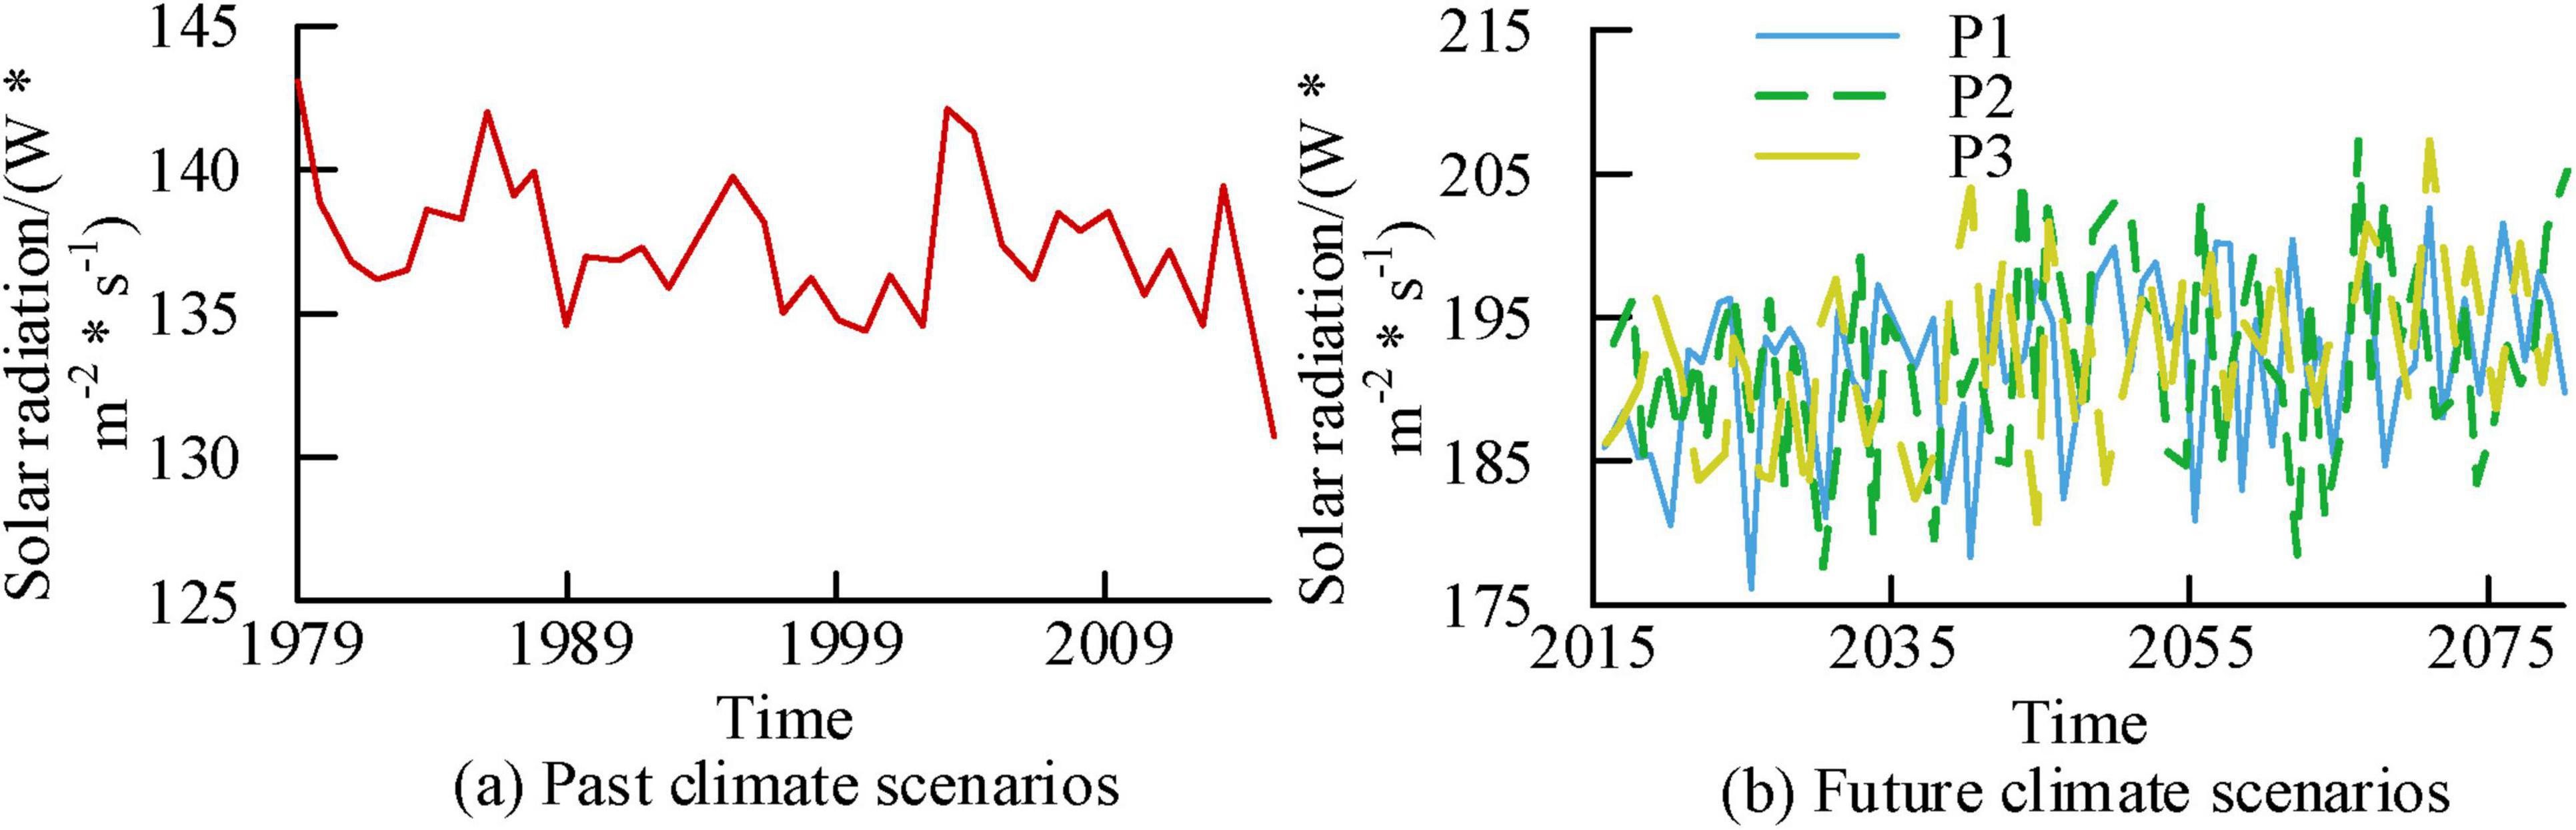
Figure 13. Time variation curve of solar radiation in a research area at a century scale.
Figures 14a–d show the correlation analysis results of solar radiation and NEP under past climate scenarios, future P1, P2, and P3 scenarios, respectively. In past climate scenarios, there was a negative correlation between solar radiation and NEP. After 2000, R was −0.79. In the future P1, P2, and P3 scenarios, both showed a negative correlation, with corresponding R values of −0.61, −0.61, and −0.25, respectively. Based on the above results, among various meteorological factors, temperature, precipitation, and radiation intensity have a greater impact on forest NEP production, while the impact of relative humidity is relatively small.
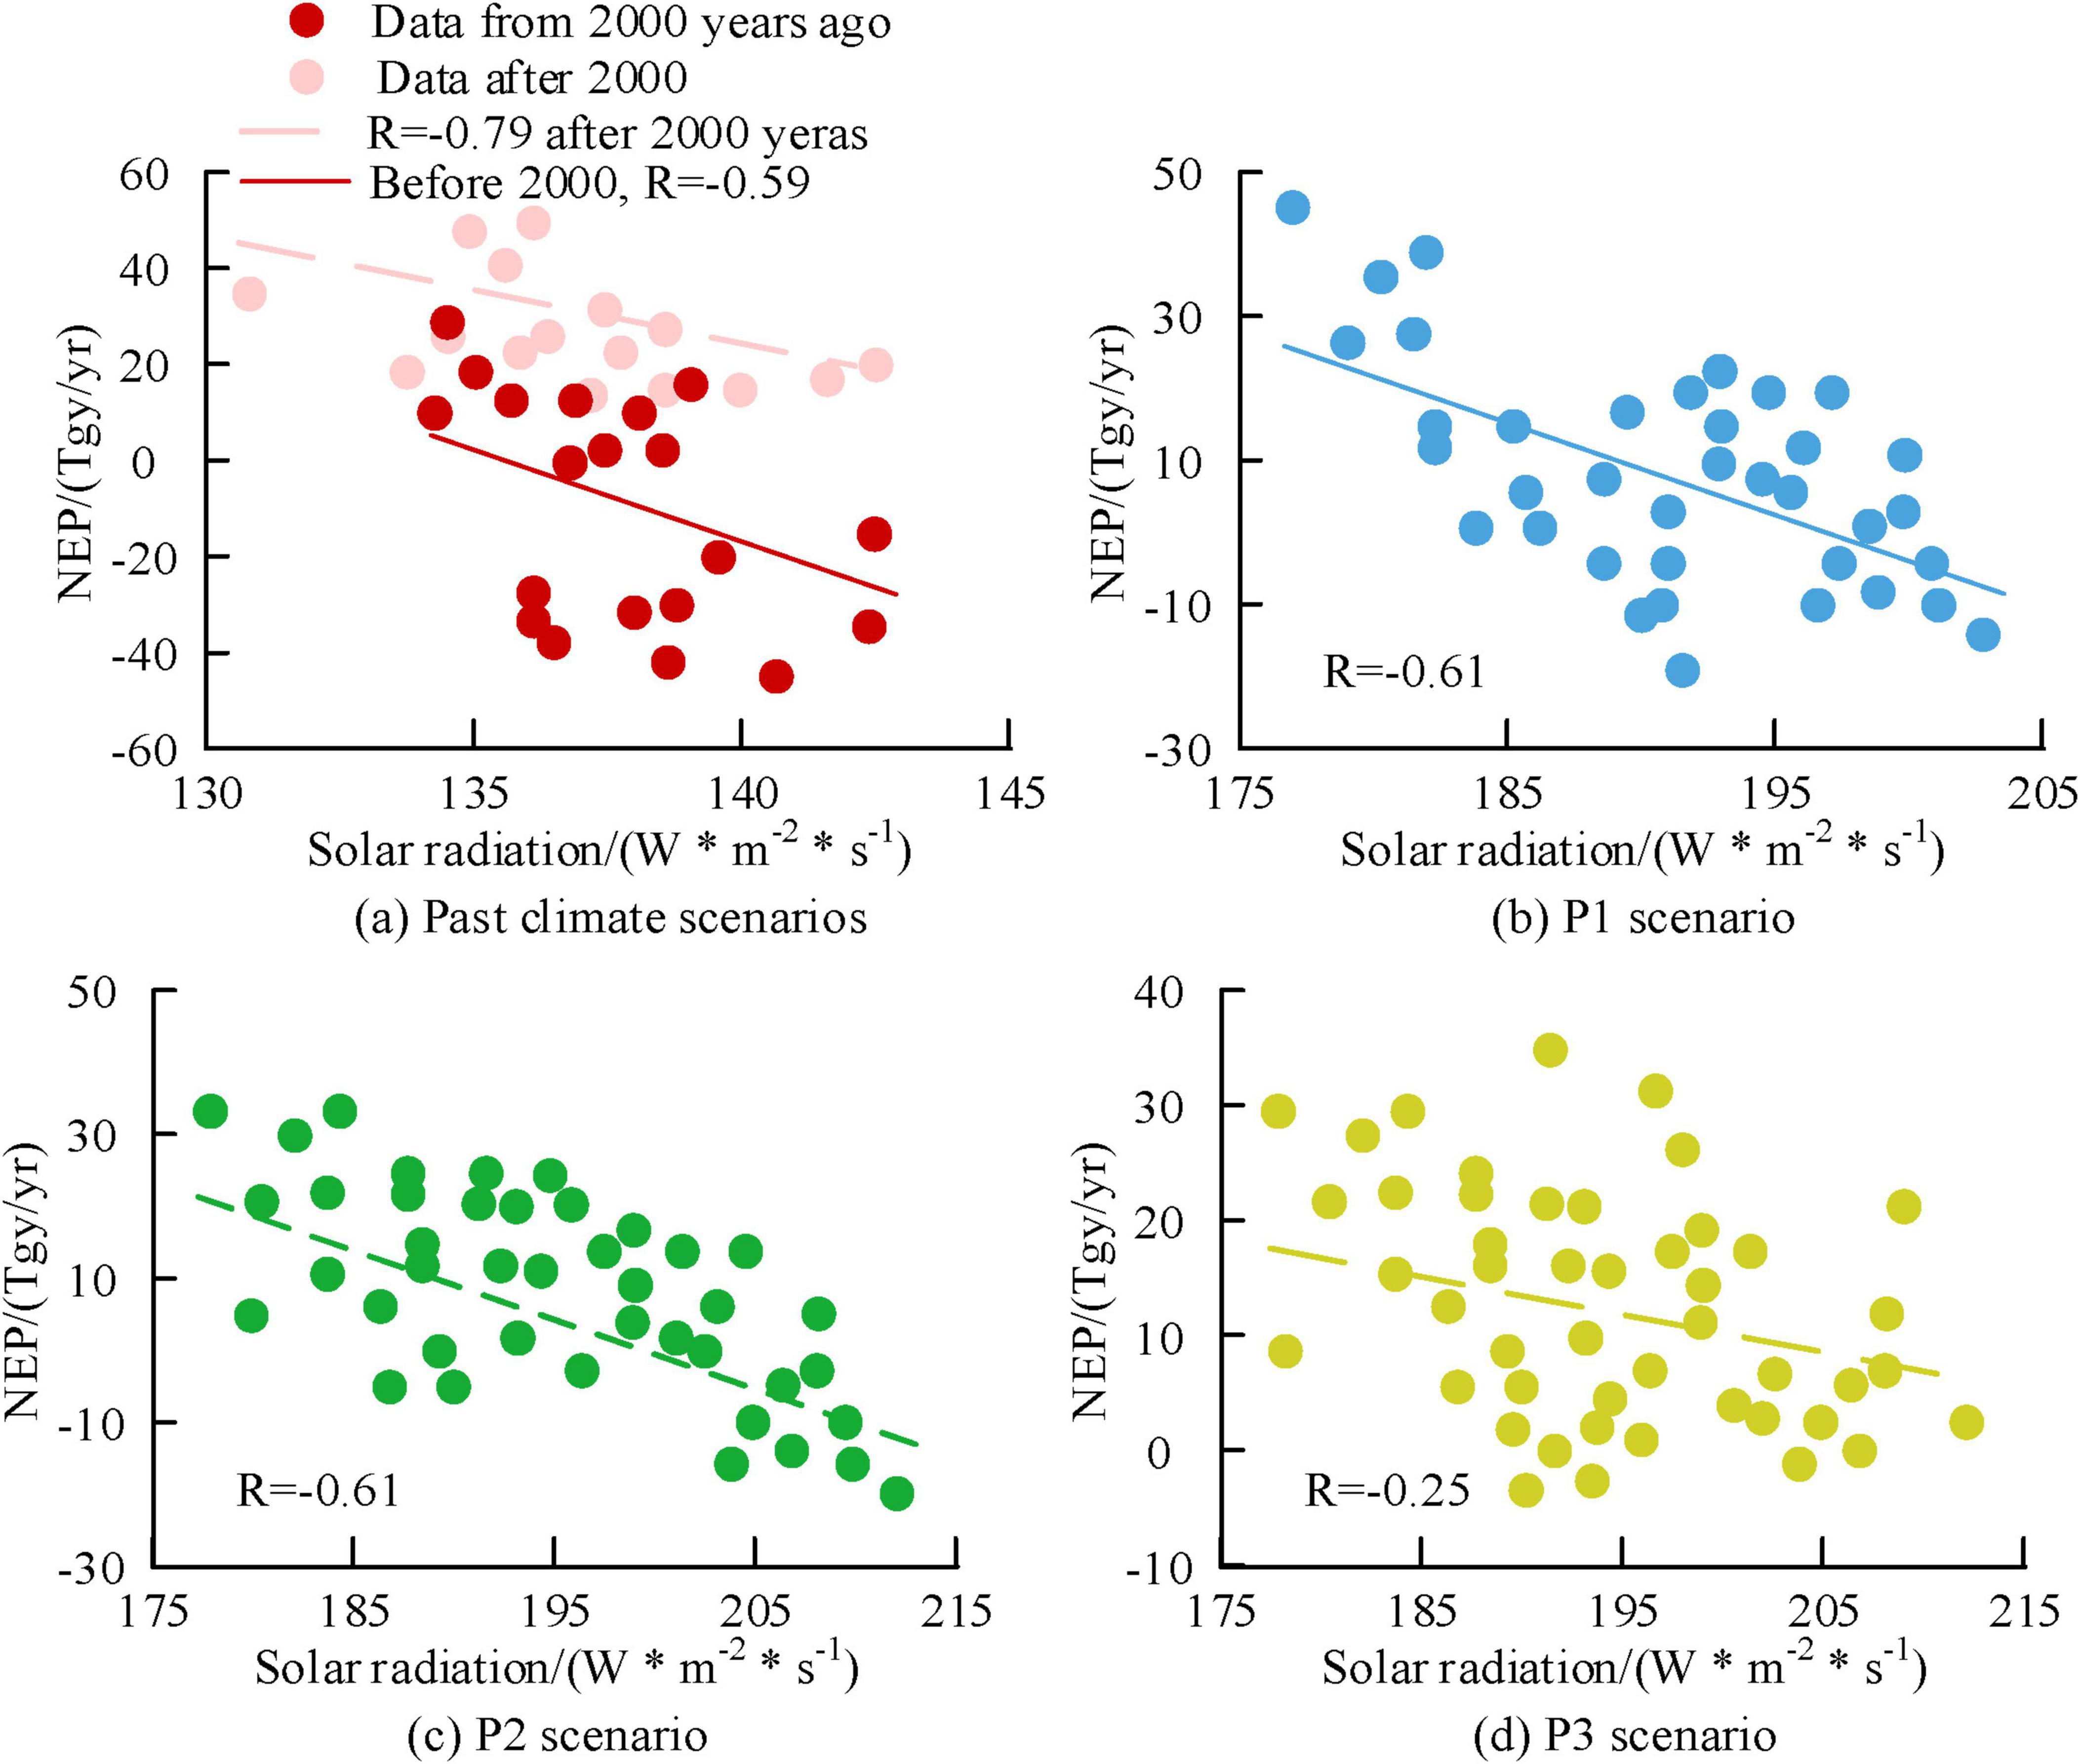
Figure 14. Analysis of the correlation between regional solar radiation and Net Ecosystem Productivity (NEP) at century scale.
Forest ecosystems acts an extremely important role in carbon cycling. In recent years, the combustion of fossil fuels has led to an increase in greenhouse gas emissions and frequent extreme weather events, posing a huge threat to the global ecosystem and human society. In response to the above issues, a climate change response mechanism method based on the InTEC model CCS simulation was designed in Zhejiang Province as the research area. Then the mechanism was analyzed from four meteorological factors: temperature, precipitation, relative humidity, and solar radiation. Based on the InTEC model parameter optimization results, the A, b, c, and d of coniferous and broad-leaved forests were 480.287, 2.931, 21.792, 0.702 and 352.284, 5.317, 14.063, and 0.889, respectively. This indicates that coniferous forests have stronger performance in terms of biomass accumulation and carbon absorption capacity. In the carbon cycle, coniferous forests usually have higher growth rates and biomass accumulation capacity, which can absorb and store more carbon. Broad leaved forests have advantages in diversity and ecosystem stability among the five types of forests. The R and RMSE for Sites 1, 2, and 3 were 0.75 and 20.78 gC*m–2*yr–1, 0.55 and 52.92 gC*m–2*yr–1, and 0.54 gC*m–2*yr–1 and 35.71 gC*m–2*yr–1, respectively. The above results verify the accuracy and reliability of the model. Among different forest types, the predicted results of the research model have the highest degree of agreement with the actual observed values. In the past forest age scenario, temperature, precipitation, and solar radiation had the greatest impact on forest production, with corresponding R values of 0.56, 0.84, and −0.79, respectively. This indicates that in past scenarios, an increase in precipitation was beneficial for forest production; Temperature also has a certain positive promoting effect; The impact of solar radiation on forest production is negatively correlated, possibly due to factors such as increased water evaporation caused by excessive solar radiation, which has an inhibitory effect on forest production. In the future scenario, the P3 scenario had the highest correlation between temperature and NEP, with a R of −0.82. The precipitation in scenario P1 had the greatest impact on the NEP value, with a R of 0.38. The solar radiation in P1 and P2 scenarios had the greatest impact on the NEP value, with R being −0.61. The above results indicate that an appropriate increase in precipitation is beneficial for forest carbon absorption, and the negative impact of solar radiation on forest carbon cycling is still prominent. This can provide insights for forest ecological protection. For example, in areas where temperature rise has a significant negative impact on NEP, forest water management should be strengthened to reduce the stress of high temperature and drought on forests; In areas where increased precipitation promotes NEP, forest area can be appropriately increased or forest structure can be optimized to enhance the carbon sequestration capacity of forests. Therefore, the proposed method has high accuracy and obtains the impact of different meteorological factors on forest carbon sequestration capacity, which is conducive to developing targeted forest management measures. However, there are still shortcomings in the research. Although various interference factors have been considered in the InTEC model, there is a lack of data on deforestation in the study area. The relatively low number of local fires has caused certain errors in the simulation results. In future research, interference factors such as logging and fires can be considered to achieve more comprehensive simulations.
The original contributions presented in this study are included in this article/supplementary material, further inquiries can be directed to the corresponding author.
YZ: Investigation, Writing – original draft. KL: Investigation, Writing – original draft. XZ: Investigation, Writing – original draft. MH: Investigation, Writing – original draft. QW: Investigation, Writing – original draft. SZ: Investigation, Writing – original draft. FZ: Investigation, Writing – original draft. HL: Investigation, Writing – review and editing.
The author(s) declare financial support was received for the research, authorship, and/or publication of this article. Zhejiang Society for Environmental Sciences - Research on Key Technologies for Ground Monitoring of Ecological Quality in Ningbo (No. 2023HT0030) and Project Sponsor: Global Environment Facility (GEF) - Strategy and Action Planning for Biodiversity Conservation in Ningbo City (No. TF0B8386).
The authors declare that the research was conducted in the absence of any commercial or financial relationships that could be construed as a potential conflict of interest.
The authors declare that no Generative AI was used in the creation of this manuscript.
All claims expressed in this article are solely those of the authors and do not necessarily represent those of their affiliated organizations, or those of the publisher, the editors and the reviewers. Any product that may be evaluated in this article, or claim that may be made by its manufacturer, is not guaranteed or endorsed by the publisher.
Aryavalli, S. N. G., and Kumar, G. H. (2024). Futuristic vigilance: Empowering chipko movement with Cyber-Savvy IoT to safeguard forests. Arch. Adv. Eng. Sci. 1, 1–16. doi: 10.47852/bonviewAAES32021480
Chen, L., Keski-Saari, S., Kontunen-Soppela, S., Zhu, X., Zhou, X., Hnninen, H., et al. (2023). Immediate and carry-over effects of late-spring frost and growing season drought on forest gross primary productivity capacity in the Northern Hemisphere. Glob. Change Biol. 29, 3924–3940. doi: 10.1111/gcb.16751
Fan, Y., Cheng, G., Dang, C., Shao, Z., Ding, Q., Huang, X., et al. (2022). Assessment of the importance of increasing temperature and decreasing soil moisture on global ecosystem productivity using solar-induced chlorophyll fluorescence. Glob. Change Biol. 28, 3924–3940. doi: 10.1111/gcb.16043
Fernández-Martínez, M., Peñuelas, J., Chevallier, F., Ciais, P., Obersteiner, M., and Rödenbeck, C. (2023). Diagnosing destabilization risk in global land carbon sinks. Nature 615, 456–460. doi: 10.1038/s41586-023-05725-1
Gea-Izquierdo, G., and Sanchez-Gonzalez, M. (2022). Forest disturbances and climate constrain carbon allocation dynamics in trees. Glob. Change Biol. 28, 4342–4358. doi: 10.1111/gcb.16172
Goll, D. S., Bauters, M., Zhang, H., Ciais, P., Balkanski, Y., Wang, R., et al. (2022). Atmospheric phosphorus deposition amplifies carbon sinks in simulations of a tropical forest in Central Africa. New Phytol. 235, 567–580. doi: 10.1111/nph.18535
Gouge, D., Thiffault, E., and Thiffault, N. (2021). Biomass procurement in boreal forests affected by spruce budworm: Effects on regeneration, costs and carbon balance. Can. J. Forest Res. 51, 1939–1952. doi: 10.1139/CJFR-2021-0060
Guo, F., Sun, H., Zhang, L., Mu, Y., Wang, Y., and Wu, F. (2022). New physiological thresholds improve soil desiccation prediction rationality in apple orchards converted from farmland on the Chinese Loess Plateau. Land. Degrad. Dev. 33, 3801–3816. doi: 10.1002/ldr.4424
He, C., Pan, Y., Ouyang, Y., Shen, Q., Gao, Y., Yan, K., et al. (2022). Manipulating the D: A interfacial energetics and intermolecular packing for 19.2% efficiency organic photovoltaics. Energ. Environ. Sci. 15, 2537–2544. doi: 10.1039/D2EE00595F
He, Y., Ding, J., Dorji, T., Wang, T., Li, J., and Smith, P. (2022). Observation-based global soil heterotrophic respiration indicates underestimated turnover and sequestration of soil carbon by terrestrial ecosystem models. Glob. Change Biol. 28, 5547–5559. doi: 10.1111/gcb.16286
He, Y., Zhou, X., Jia, Z., Zhou, L., Chen, H., Liu, R., et al. (2023). Apparent thermal acclimation of soil heterotrophic respiration mainly mediated by substrate availability. Glob. Change Biol. 29, 1178–1187. doi: 10.1111/gcb.16523
Jiang, H., Pan, Y., Liang, J., Yang, Y., Chen, Q., Lv, M., et al. (2022). UV radiation doubles microbial degradation of standing litter in a subtropical forest. J. Ecol. 110, 2156–2166. doi: 10.1111/1365-2745.13939
Joachimski, M. M., Alekseev, A. S., Grigoryan, A., and Gatovsky, Y. A. (2022). Siberian trap volcanism, global warming and the Permian Triassic mass extinction: New insights from Armenian permian-triassic sections: Reply. Geol. Soc. Am. Bull. 134, 1087–1088. doi: 10.1130/B36214.1
Kumari, B., Tiwari, A., and Anjum, J. (2022). Carbon sequestration potential in natural forests of Himachal Pradesh. India. Curr. Sci. India 122, 846–849. doi: 10.18520/cs/v122/i7/846-849
Li, S., Chan, G. K., and Chow, Y. K. (2023). Expansion of consistent particle method to solve solid mechanics problems. Int. J. Numer. Meth. Eng. 124, 3278–3298. doi: 10.1002/nme.7247
Liu, P., Barr, A. G., Zha, T., Black, T. A., Jassal, R. S., Nesic, Z., et al. (2022). Re-assessment of the climatic controls on the carbon and water fluxes of a boreal aspen forest over 1996–2016: Changing sensitivity to long-term climatic conditions. Glob. Change Biol. 28, 4605–4619. doi: 10.1111/gcb.16218
Morten, J. M., Buchanan, P. J., Egevang, C., Glissenaar, I. A., Maxwell, S. M., Parr, N., et al. (2023). Global warming and arctic terns: Estimating climate change impacts on the world’s longest migration. Glob. Change Biol. 29, 5596–5614. doi: 10.1111/gcb.16891
Na, L., Na, R., Bao, Y., Zhang, J., Bao, Y., and Shan, Y. (2022). Diurnal temperature range variability driven by cloud cover and precipitation in Mongolian Plateau under global warming. Int. J. Climatol. 42, 8184–8200. doi: 10.1002/joc.7702
Rao, J., Garfinkel, C., Ren, R., Wu, T., and Lu, Y. (2023). Southern hemisphere response to the quasi-biennial oscillation in the CMIP5/6 models. J. Climate 36, 2603–2623. doi: 10.1175/jcli-d-22-0675.1
Repo, A., Eyvindson, K. J., Halme, P., and Mnkknen, M. (2020). Forest bioenergy harvesting changes carbon balance and risks biodiversity in boreal forest landscapes. Can. J. Forest Res. 50, 1184–1193. doi: 10.1139/cjfr-2019-0284
Richardson, C. J., Flanagan, N. E., Wang, H., and Ho, M. (2022). Annual carbon sequestration and loss rates under altered hydrology and fire regimes in southeastern USA pocosin peatlands. Glob. Change Biol. 28, 6370–6384. doi: 10.1111/gcb.16366
Usman, A. M., and Abdullah, M. K. (2023). An assessment of building energy consumption characteristics using analytical energy and carbon footprint assessment model. Green Low-Carbon Econ. 1, 28–40. doi: 10.47852/bonviewGLCE3202545
Wang, X., Li, S., Zhu, B., Homyak, P., Chen, G., Yao, X., et al. (2023). Long-term nitrogen deposition inhibits soil priming effects by enhancing phosphorus limitation in a subtropical forest. Glob. Change Biol. 29, 4089–4093. doi: 10.1111/gcb.16718
Xiong, X., Zhou, G., and Zhang, D. (2020). Soil organic carbon accumulation modes between pioneer and old-growth forest ecosystems. Appl. J. Ecol. 57, 2345–2356. doi: 10.1111/1365-2664.13747
Yang, G., Stevens, C., Zhang, Z., Lü, X., and Han, X. (2023). Different nitrogen saturation thresholds for above-, below-, and total net primary productivity in a temperate steppe. Glob. Change Biol. 29, 4586–4596. doi: 10.1111/gcb.16803
Yu, H., Zhang, Q., Wei, Y., Liu, C., Ren, Y., Yue, P., et al. (2022). Bias-corrections on aridity index simulations of climate models by observational constraints. Int. J. Climatol. 42, 889–907. doi: 10.1002/joc.7279
Yu, Y., Battu, A. K., Varga, T., Denny, A. C., Zahid, T. M., Chowdhury, I., et al. (2023a). Minimal impacts of microplastics on soil physical properties under environmentally relevant concentrations. Environ. Sci. Technol. 57, 5296–5304. doi: 10.1021/acs.est.2c09822
Yu, Y., Zhang, M., and Mukherjee, B. (2023b). An inverse probability weighted regression method that accounts for right-censoring for causal inference with multiple treatments and a binary outcome. Stat. Mevol. D. 42, 3699–3715. doi: 10.1002/sim.9826
Zandi, O., Nasseri, M., and Zahraie, B. (2023). A locally weighted linear ridge regression framework for spatial interpolation of monthly precipitation over an orographically complex area. Int. J. Climatol. 43, 2601–2622. doi: 10.1002/joc.7992
Keywords: InTEC model, carbon balance, spatiotemporal simulation, climate response mechanism, subtropical forests
Citation: Zhang Y, Li K, Zhang X, Huang M, Wang Q, Zhang S, Zhang F and Li H (2025) Response mechanism of subtropical forest carbon balance to climate change based on InTEC model. Front. For. Glob. Change 8:1526743. doi: 10.3389/ffgc.2025.1526743
Received: 12 November 2024; Accepted: 21 February 2025;
Published: 11 March 2025.
Edited by:
Alireza Rahemi, Morehead State University, United StatesReviewed by:
Medani Bhandari, Akamai University, United StatesCopyright © 2025 Zhang, Li, Zhang, Huang, Wang, Zhang, Zhang and Li. This is an open-access article distributed under the terms of the Creative Commons Attribution License (CC BY). The use, distribution or reproduction in other forums is permitted, provided the original author(s) and the copyright owner(s) are credited and that the original publication in this journal is cited, in accordance with accepted academic practice. No use, distribution or reproduction is permitted which does not comply with these terms.
*Correspondence: Hong Li, bGVlaG9uZzA2MDVAMTYzLmNvbQ==
Disclaimer: All claims expressed in this article are solely those of the authors and do not necessarily represent those of their affiliated organizations, or those of the publisher, the editors and the reviewers. Any product that may be evaluated in this article or claim that may be made by its manufacturer is not guaranteed or endorsed by the publisher.
Research integrity at Frontiers
Learn more about the work of our research integrity team to safeguard the quality of each article we publish.