 Eryan Guo*
 Jing He
- College of Forestry, Henan Agricultural University, Zhengzhou, China
As global climate change becomes more severe, forests, as important carbon sinks, are of great significance for mitigating climate change and protecting the ecological environment. The study took typical forest farms in southern China as the research area, constructed a multi-objective forest planning model based on Simulated Annealing Algorithm, and interfaced with geographic information systems. The aim is to achieve long-term scientific and rational arrangement of forest management measures to balance wood production and forest carbon storage. The results confirm that under the constraints of forest classification management and age structure adjustment of artificial forests, different optimization scenarios gradually stabilize corresponding logging intensity and forest resources from year 40 onwards. By assigning weights to the net present value of wood and carbon sequestration in the objective function, this study explores the impact of social preferences on spatial allocation schemes for forest management. When the carbon sequestration weight is 100%, the current savings are greater than those of other optimized scenarios starting in the 35th year, at roughly 8.8 × 10⁴ m3, and the current carbon storage is superior to those of other optimized scenarios starting in the 25th year, at 4.9 × 10⁴ t. In summary, this research can provide a scientific basis for actual forest management decisions, which is beneficial for improving forest carbon sequestration services, maintaining ecological balance, and promoting regional ecological sustainable development.
1 Introduction
At present, forest resources around the world are facing problems such as over-logging, fires, and illegal logging, resulting in a significant reduction in forest area and quality. The sustainable and healthy development of forests is crucial for maintaining ecological balance and promoting economic development (Wu et al., 2023; Usman and Abdullah, 2023; Gazman, 2023). Although China has taken a series of measures to control, protect, and restore forest resources, it still needs to face a severe situation. Most of China’s forests have low quality, and the frequent occurrence of forest fires has brought incalculable losses to forest resources (Papineni et al., 2021; Bognounou et al., 2021). It is crucial to master the actual situation and changes of forest resources management to develop a scientifically reasonable forest Spatial Allocation Scheme (SAS) (Witing et al., 2022). Geographic Information System (GIS) can generate various gradient displays, geographic data, and geographic reputation, which can be used to analyze the spatial distribution of various data in forest resources, and can more directly and accurately display the status of forest resources (Salam et al., 2021; Jan et al., 2021). Numerous scholars have conducted in-depth discussions and analyses on this matter.
Kse et al. aimed to propose a demonstration plan for sustainable resource management based on ensuring multi-purpose utilization (Kse et al., 2021). They proposed an urban forest management planning model based on Istanbul as the subject of study. Through 201 surveys, the following results were obtained: all groups emphasized that the lack of coordination and poor management system were the main problems, and a new urban forest law should be formulated. Reichert et al. conducted tests on four small watersheds to evaluate the impact of natural resource management in the southwest on promoting soil conservation and forest management planning, collecting data from 95 plots representing different land use and soil management (Reichert et al., 2022). Through principal component analysis, the physical, chemical, and biological properties of soil determined the decisive role of agricultural soil in household agricultural watersheds. Therefore, it was necessary to protect forests, regenerated forests, and grasslands, adjust soil management, and restore soil organic matter, nutrients, and microbial activity. Maltamo et al. found that forest management surveys typically provided key information for forest management planning at the stand level (Maltamo et al., 2021). They studied Nordic countries and analyzed their forest attribute data from comprehensive field surveys to remote sensing. These results confirmed that the new optical and LiDAR sensors and platforms could further improve accuracy, and there were still bottlenecks related to species-specific forest stand attribute information in mixed forests and evaluating tree quality. Moor et al. believed that green infrastructure planning needed to take into account socio-economic dynamics at the national and global levels, and progress towards policy goals should be assessed on the landscape scale (Moor et al., 2022). They had developed three management plans for a 100,000 hectare area of northern forest landscape in the next 100 years. These results confirmed that in green infrastructure and economic scenarios, environmental indicators typically reached their highest and lowest levels, respectively, with most indicators further increasing in terms of reservation. Compared with the reference plan, the profit of green infrastructure decreased by 14%, and the economic benefits increased by 2%. In the green infrastructure plan, the average increase in species was 135%, followed by a 65% increase in the reference plan and a 47% increase in the economic plan.
GIS is a specific and important spatial information system widely used in various fields. It can collect, manage, and analyze geographic distribution data related to the entire or part of the earth’s surface space, affecting human production and life. Chukwuka et al. used GIS remote sensing data and spatial metrics to evaluate the dynamic properties of the landscape in the Ikere Forest Reserve from 1985 to 2017 (Chukwuka et al., 2021). As of 2017, the changes in land cover types in the region had not reached equilibrium, so it was necessary to use a three-way Markov chain model to determine the future extent of forest cover. The reduction of forest patches and the increase in average plate size indicated that forest diseases had become a single unit. This may be due to the removal of existing forest tree blocks, which is very useful for the government and other stakeholders responsible for ensuring sustainable forests and the overall environment. Kanga et al. evaluated the forest fire vulnerability of the Badwa Forest Subdivision in Jammu and Kashmir based on GIS (Kanga et al., 2021). These experiments confirmed that out of 342 Badwa forest zoning areas, 187 were classified as high vulnerability areas, 123 as medium vulnerability areas, and only 32 as low vulnerability areas. This was constructive for developing better strategies to extinguish forest fires in the region. Sashikala et al. used GIS and Global Positioning System to assess the fertility status of Tatrakallalu village in Anantapuramu affected by long-term drought (Sashikala et al., 2021). They collected 250 surface soil samples (0-15 cm) related to geography from Tatrakalu with sparse rainfall at a grid space of 250 meters and analyzed their fertility parameters. These results confirmed that available nitrogen, sulfur, zinc, and iron were important limiting factors for soil fertility in the village.
In summary, there have been many achievements in forest management planning and GIS. However, the current research problem is the complexity of constructing a multi-objective forest planning model that takes into account both forest wood production and carbon storage. It requires consideration of numerous factors, and the optimization of forest spatial structure needs to follow the sustainable management concept of protection as the main and utilization as the auxiliary, which increases the difficulty of spatial allocation of forest management measures. To improve the Carbon Fixation Service (CFS) of forests and make more efficient and rational use of resources, a forest planning model based on CFS and GIS is studied and established. Simulated Annealing Algorithm (SAA) is used to solve this problem. In addition, GIS is combined to analyze the spatial distribution of influencing factors for SAS optimization of Forest Management Measures (FMMs). The research aims to address the conflict between the economic benefits and ecological service functions of FMM’s SAS, provide a solid data foundation for subsequent related fields, promote China’s ecological civilization construction and sustainable development, and achieve the dual carbon goal. There are two main innovations in this study. At first, the combination of forest CFS and GIS is used for SAS optimization analysis of FMM, providing scientific data support for the development of targeted solutions. The second point is to comprehensively consider the impact of forest solid-state services, social and economic factors, and set different optimization scenarios. The structure of the study consists of four main parts. First, a review of related research findings is given. Then, a planning model based on forest CFS and GIS and a solution method for SAS optimization of forest management based on SAA are designed. The third part explores the factors that affect SAS in FMM, as well as the optimization results that take into account forest CFS, society, and economy in a comprehensive way. Finally, there is a summary of the research.
2 Materials and methods
The study first takes Paiyashan Forest Farm in Hunan Province as the research object to obtain more efficient and scientific forest management plans, protect and restore forest ecosystems, and improve their ecosystem service functions. Its geological conditions, forest overview, personnel composition, and industrial composition are introduced, and the required geographic data are obtained through GIS. Then, various target scenarios and a series of general and special constraints are set by quantifying ecosystem services, and the forest planning model is solved using SAA. Specifically, Due to social preferences, different stakeholders have different opinions on the importance that forests should play in the national economy, sustainable provision of ecosystem services, and climate change mitigation. As a result, there are different priorities for forest management goals. Therefore, this study aims to allocate weights to different objectives and plan the preferences of stakeholders or the importance of ecosystem services, in order to provide optimized operational feedback for forest operators and meet the needs of different social preferences. The objective function mainly sets two scenario categories to verify the impact of social preferences and market prices on forest optimization management.
2.1 Overview of the research area and forest resources
The study selects a typical southern forest farm as the research area, namely Paiyashan Forest Farm in Hunan Province, China. It is located in the border area of Hunan, Guizhou, and Guangxi provinces, with a total operating area of 67.0628 km2, a standing timber volume of 591,000 cubic meters, a forest coverage rate of 95.06%, and a per capita ownership ranking first in Hunan. In addition, the area has over 10 km2 of primary secondary forests and 46.67 km2 of artificial forests. Due to its unique vegetation and excellent ecological environment, Paiya Mountain has formed a unique forest microclimate, hence it is called natural air conditioning (Xia et al., 2021; Chen et al., 2021; Tao et al., 2021). This area belongs to the low mountain terrain of the Xuefeng Mountains, with a maximum altitude of 1,075 m and a minimum altitude of 230 m, with a slope of 20°–30°. The main parent rock of the forest farm is purple sandstone, and the soil is mainly purple soil developed from purple sandstone. And it belongs to the subtropical monsoon humid climate zone, with an average annual temperature of 16.7°C, an annual precipitation of 1,250 mm, and a frost free period of about 290 days (Wang X. et al., 2021). The study area includes 68.667 km2 of state-owned operations, 57.333 km2 of forest land and 25.33 km2 of designated ecological public welfare forests, including 0.362 km2 at the national level and 2.198 km2 at the local level. It has a forest volume of 459,000 cubic meters, including 316,000 cubic meters of commercial forests and 143,000 cubic meters of ecological public welfare forests. Figure 1 is a schematic diagram of the study area.
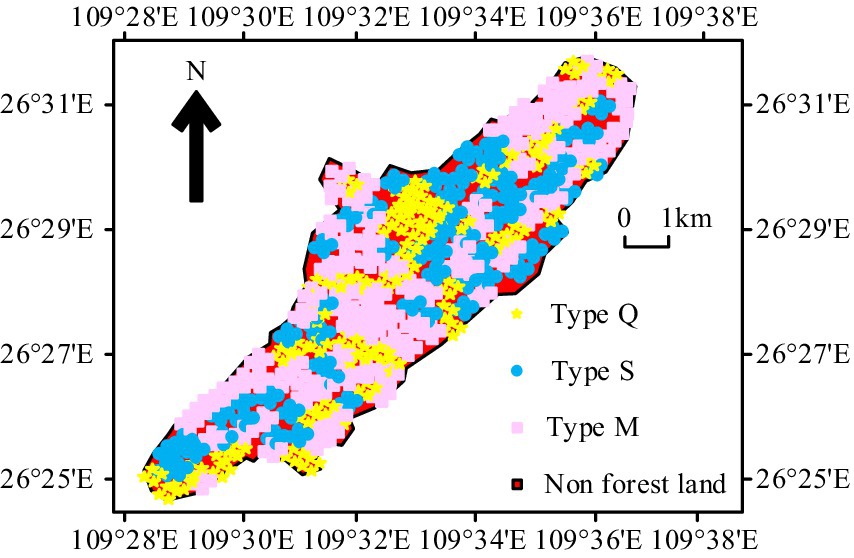
Figure 1. Schematic diagram of the research area.
In Figure 1, the vegetation resources in the study area are very abundant, mainly including three types: cunninghamia lanceolata (type S), pinus massoniana (type M), and deciduous broad-leaved trees and other evergreen broad-leaved tree species (type Q). This includes natural forests and artificial forests. Artificial forests are mainly pure forests, while natural forests are mainly mixed forests, with a compositional structure consisting of M and Q types. Table 1 shows the specific content of forest resources in the study area.
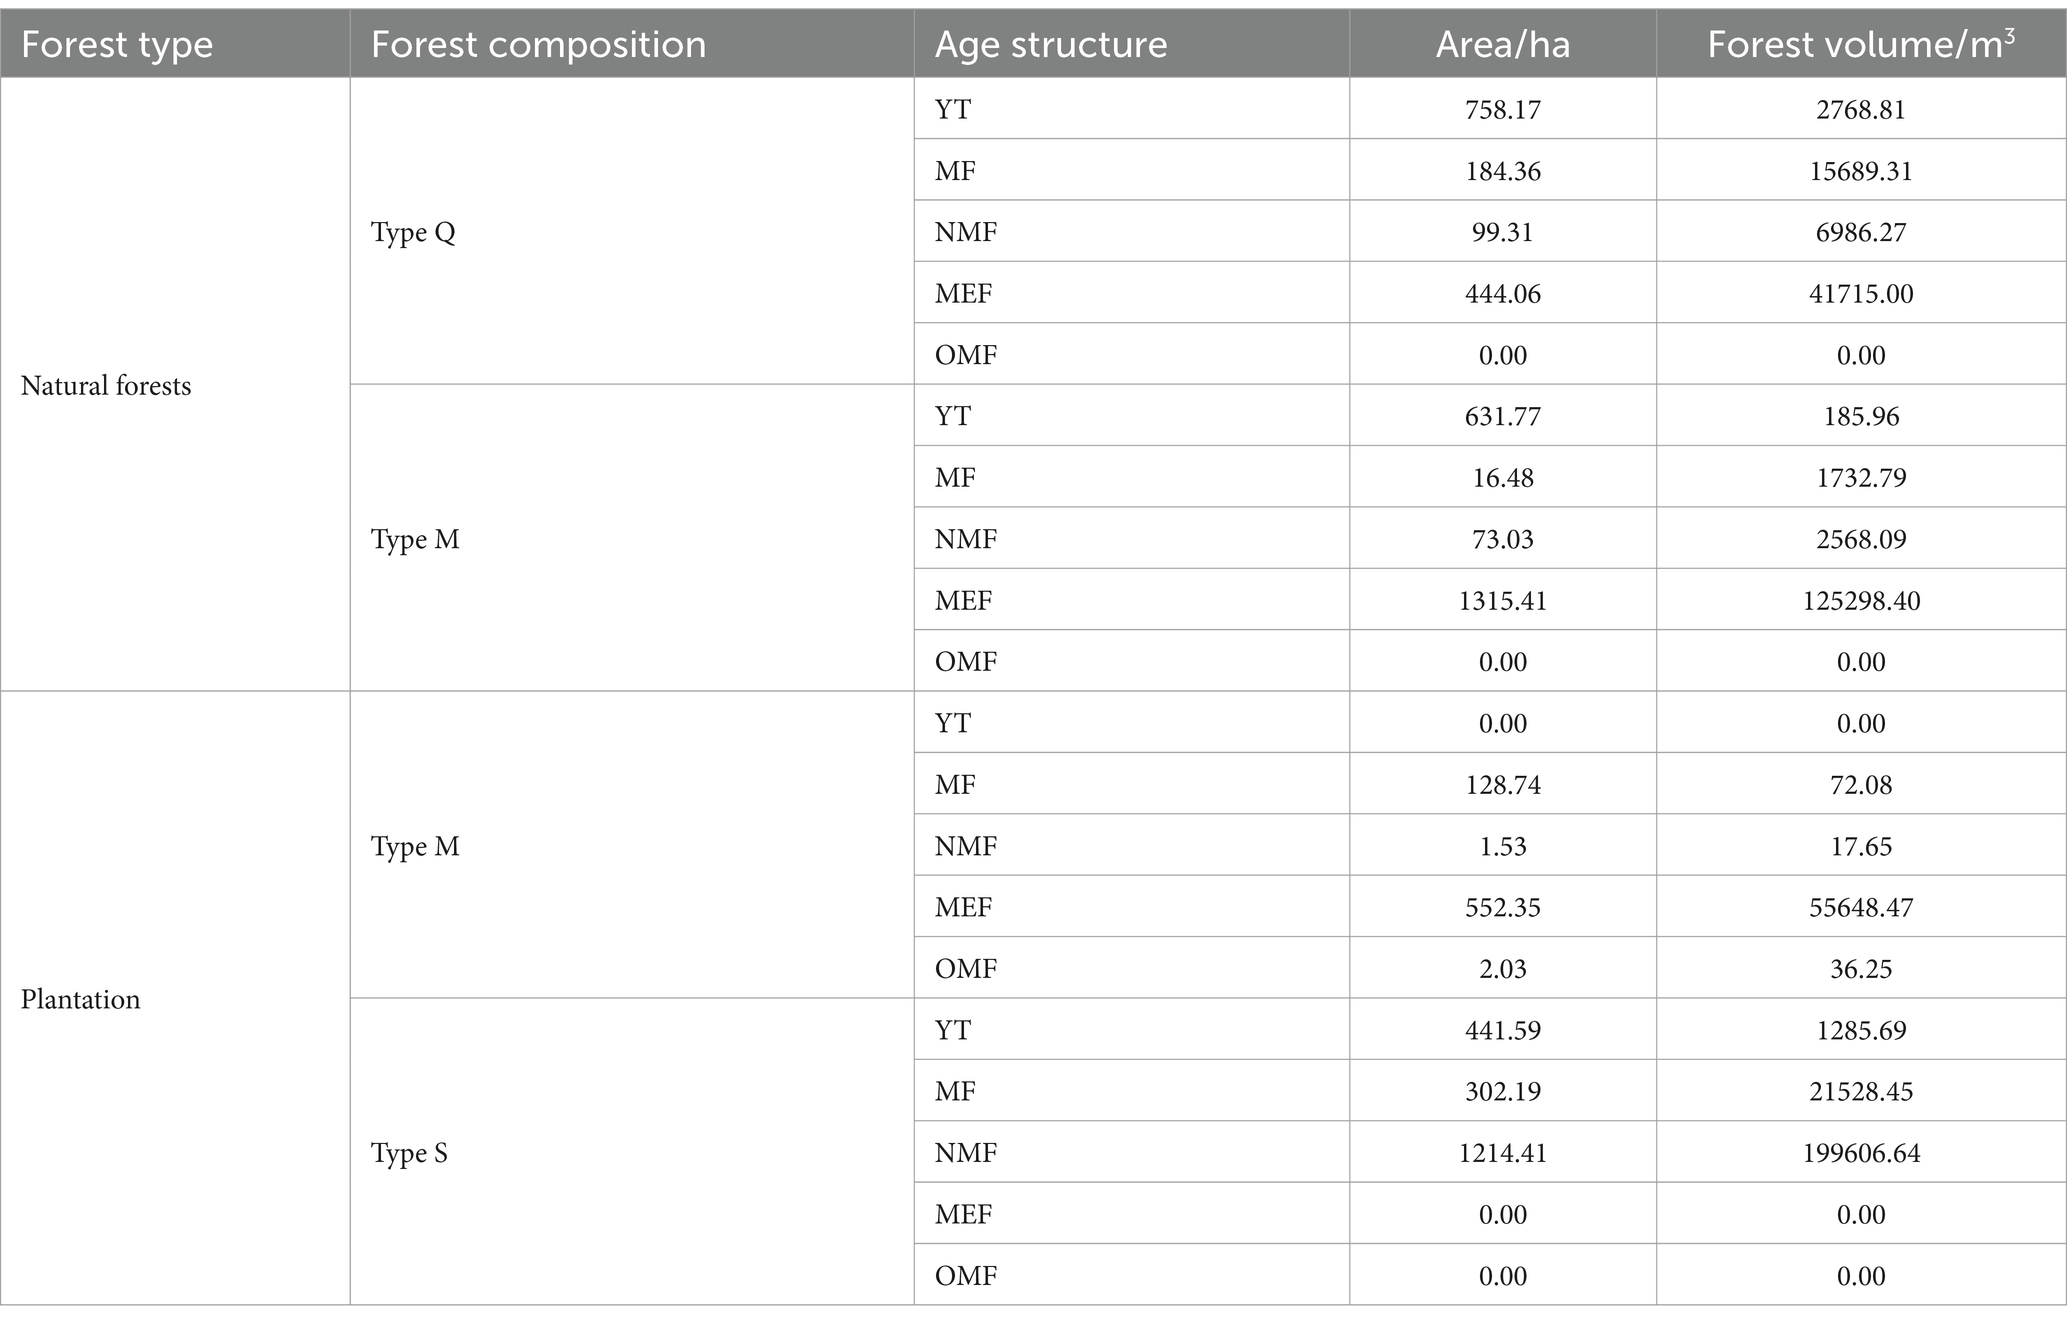
Table 1. Forest resources in the study area.
There are certain problems with the age structure of forests in the study area, among which the age components are divided into five types: Young Forest (YF), Middle Aged Forest (MF), Near-mature Forest (NMF), Mature Forest (MEF), and Over-mature Forest (OMF). However, type S, as the main tree species and an important source of wood income, lacks MEF and OMF, while type M lacks YF. In the personnel composition of this study area, the total population is 1,686, with 43% of employed employees and 47% of the agricultural population and their families, respectively. The internal industrial and economic structure of the forest farm is single, with timber sales as the main industry, but its profit is not high and does not match the corresponding industry and market demand.
2.2 Optimization of forest management spatial allocation schemes based on forest carbon fixation services and GIS
The data used in the study comes from GIS forest spatial layout, dominant tree species, stand volume, average slope, average age, and stand carbon storage of each compartment. The study was conducted in 2022, with a total sample size of 2,136 sub plots. The above data can be used to optimize the SAS of forest management. When optimizing the spatial allocation of forest management measures, the following assumptions are made: firstly, as time passes and management measures are adjusted, the area of forest logging activities will continue to expand, ultimately achieving regional stability; The second is that the dynamic age structure adjustment of artificial forests will reach a stable state in the later stage of the planning period. Firstly, it is necessary to quantify the forest ecosystem services in the research area. A stand growth and harvest model is selected in the wood to simulate the impact of the forest on the management plan (Spiecker and Peter Kahle, 2023). The yield rates for types S, M, and Q are 70, 70, and 66%, respectively. The benefits of forest timber harvesting are evaluated using Net Present Value (NPV) and calculated at an annual discount rate of 3% recommended by relevant departments (Xu et al., 2022). The forest farm is divided into 1800 small communities with an area of 0.005–0.50 km2, with an average area of 0.031 km2. The cost of afforestation mainly consist of the following four categories: forest clearing, seedlings, fertilizers, and planting fees. There are six main types of forest logging costs, including logging, logging area design, wood loading and unloading, transportation, wood quarantine, and wood sales. The cost of afforestation and cultivation includes seedling fees, planting fees, forest clearing fees, and fertilizer fees. The wood prices of all tree species are sourced from China Timber Network. The amount of wood received is represented by Equation 1.
In Equation 1, , , and mean the area of the divided community, time period, and cutting method, respectively. and represent area and hectare accumulation, respectively. is a binary variable that determines whether wood has been harvested. is the cutting intensity under . The represents the total volume of various living trees in the forest per hectare area, which measures the forest production capacity. The NPV of total timber during the planning period is represented by Equation 2.
In Equation 2, and are the number of time periods during the community review and planning periods, respectively. and are the discount rate and period length, respectively. and represent the market price and harvesting cost of wood, respectively. The growth models corresponding to types S, M, and Q are represented by Equation 3 (Hanbury-Brown et al., 2022).
In Equation 3, and represent forest age and stand volume, respectively. In carbon storage quantification, biomass above and below ground are calculated mainly. In the research model, for every 1 ton increase in carbon storage, it can be converted into a reduction of 3.67 tons of carbon dioxide, which can further calculate NPV. The existing total carbon storage is represented by Equation 4.
In Equation 4, and represent the above ground and underground carbon storage of on , respectively. The carbon increment is represented by Equation 5.
In Equation 5, represents the total existing carbon storage corresponding to the period. The NPC of during the planning period is represented by Equation 6.
In Equation 6, means the trading price per ton of carbon dioxide. In the study area, different tree species have different growth models, which can be used for targeted calculations. The biomass growth model expressions corresponding to types S, M, and Q are shown in Equation 7 (Alexander Ruiz-Blandon et al., 2022).
The overall planning period in the study is 100 years, with one time period set every 5 years. To analyze the impact of social preferences on SAS optimization of FMM, this study assigns different weights to wood NPV and carbon increment NPV in the objective function and sets different scenarios for simulation. Comparative experiments are performed using the non-logging scenario. Through the simulation experiments of several scenarios, five scenarios, namely, Scenario AA, Scenario BB, Scenario CC, Scenario DD and Scenario EE, were finally selected, and the corresponding and were set to be 0, 25, 50 75 and 100%; 100, 75, 50, 25 and 0%, respectively. To investigate the impact of market prices on SAS optimization of FMM, the study assigns the same weight to wood NPV and carbon increment NPV in the objective function, but sets different price levels, namely Low Price (LP), Mid Price Range (MPR), and High Price Point (HPP). Based on the above content, the yield, carbon content, and market trading prices of different tree species and trading types can be obtained in Table 2.
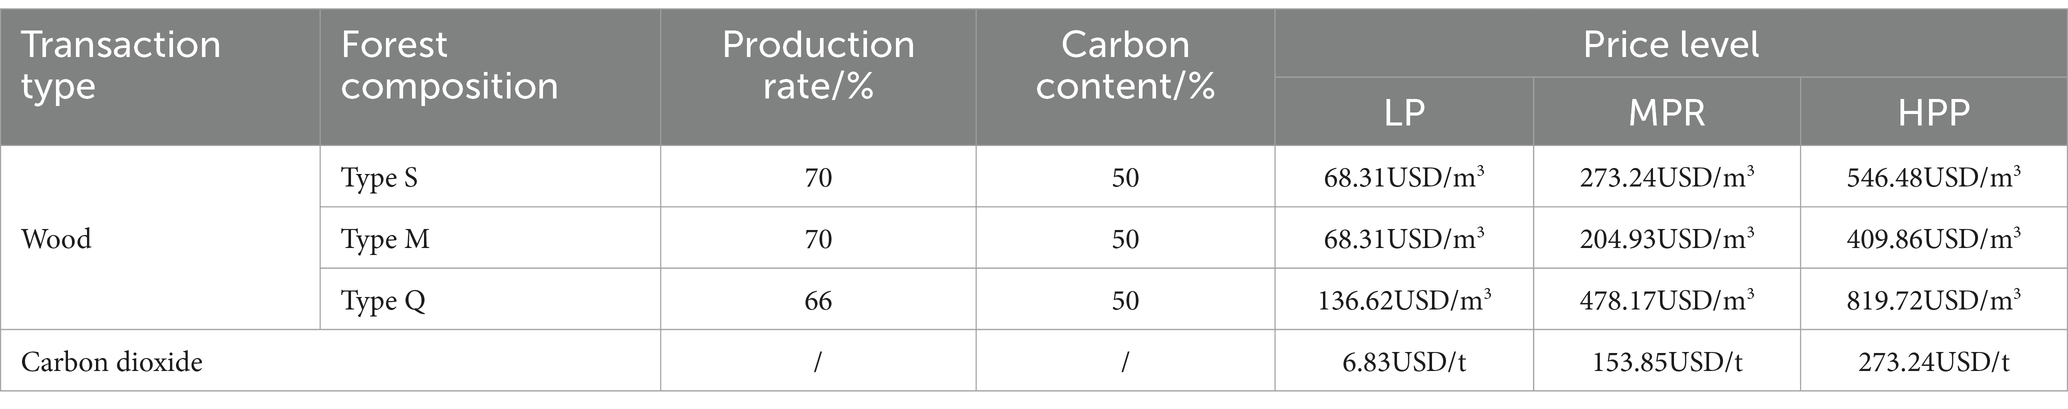
Table 2. Yield, carbon content, and market transaction prices of different tree species and transaction types.
The optimization objectives for different scenarios are to maximize the NPV of wood plus carbon increment NPV, and the objective function is represented by Equation 8.
In Equation 8, , , and represent the weights of wood and carbon storage, as well as the current scenario. In the optimization model, constraints need to be set. In addition to general constraints such as age and amount of harvesting, the study also sets corresponding harvesting methods for different forest uses based on the differences in ecosystem services that the forest needs to undertake. Because artificial forests mainly provide timber attack services, a clear logging approach is adopted. Ecological public welfare forests are mainly used for ecological functions such as protecting biodiversity and habitats, mitigating climate change, etc. Therefore, selective logging is adopted, and logging is carried out at 10% intensity. In addition, the imbalanced initial age structure of various tree species in the study area will have an impact on the long-term supply of ecosystem services. Therefore, the research is set to adjust the age structure of each tree species to reach the positive age class distribution in 50 years and adjust the types S and M to 6 age classes and 4 age classes in 50 years. Finally, to avoid soil erosion, it is necessary to set restrictions on logging in areas with slopes exceeding 35°. The amount of wood received during the period is represented by Equation 9.
The constraints for the quantity of wood received are represented by Equation 10.
The constraints for growth rate are represented by Equation 11.
The constraints for logging age and slope are represented by Equation 12.
In Equation 12, represents the age of the forest stand. represents the minimum harvesting age of tree species . The age level area corresponding to is represented by Equation 13.
In Equation 13, represents the collection of communities with age level in the 50th year. represents the target age level set of . Because the artificial forest age level needs to be adjusted to the normal state at 50 years, a 20% error is allowed for the target age level area of each tree species. The corresponding constraints for the target age level are shown in Equation 14 (Ju et al., 2023).
Table 3 shows all the planning scenarios and their objective functions and constraints set.
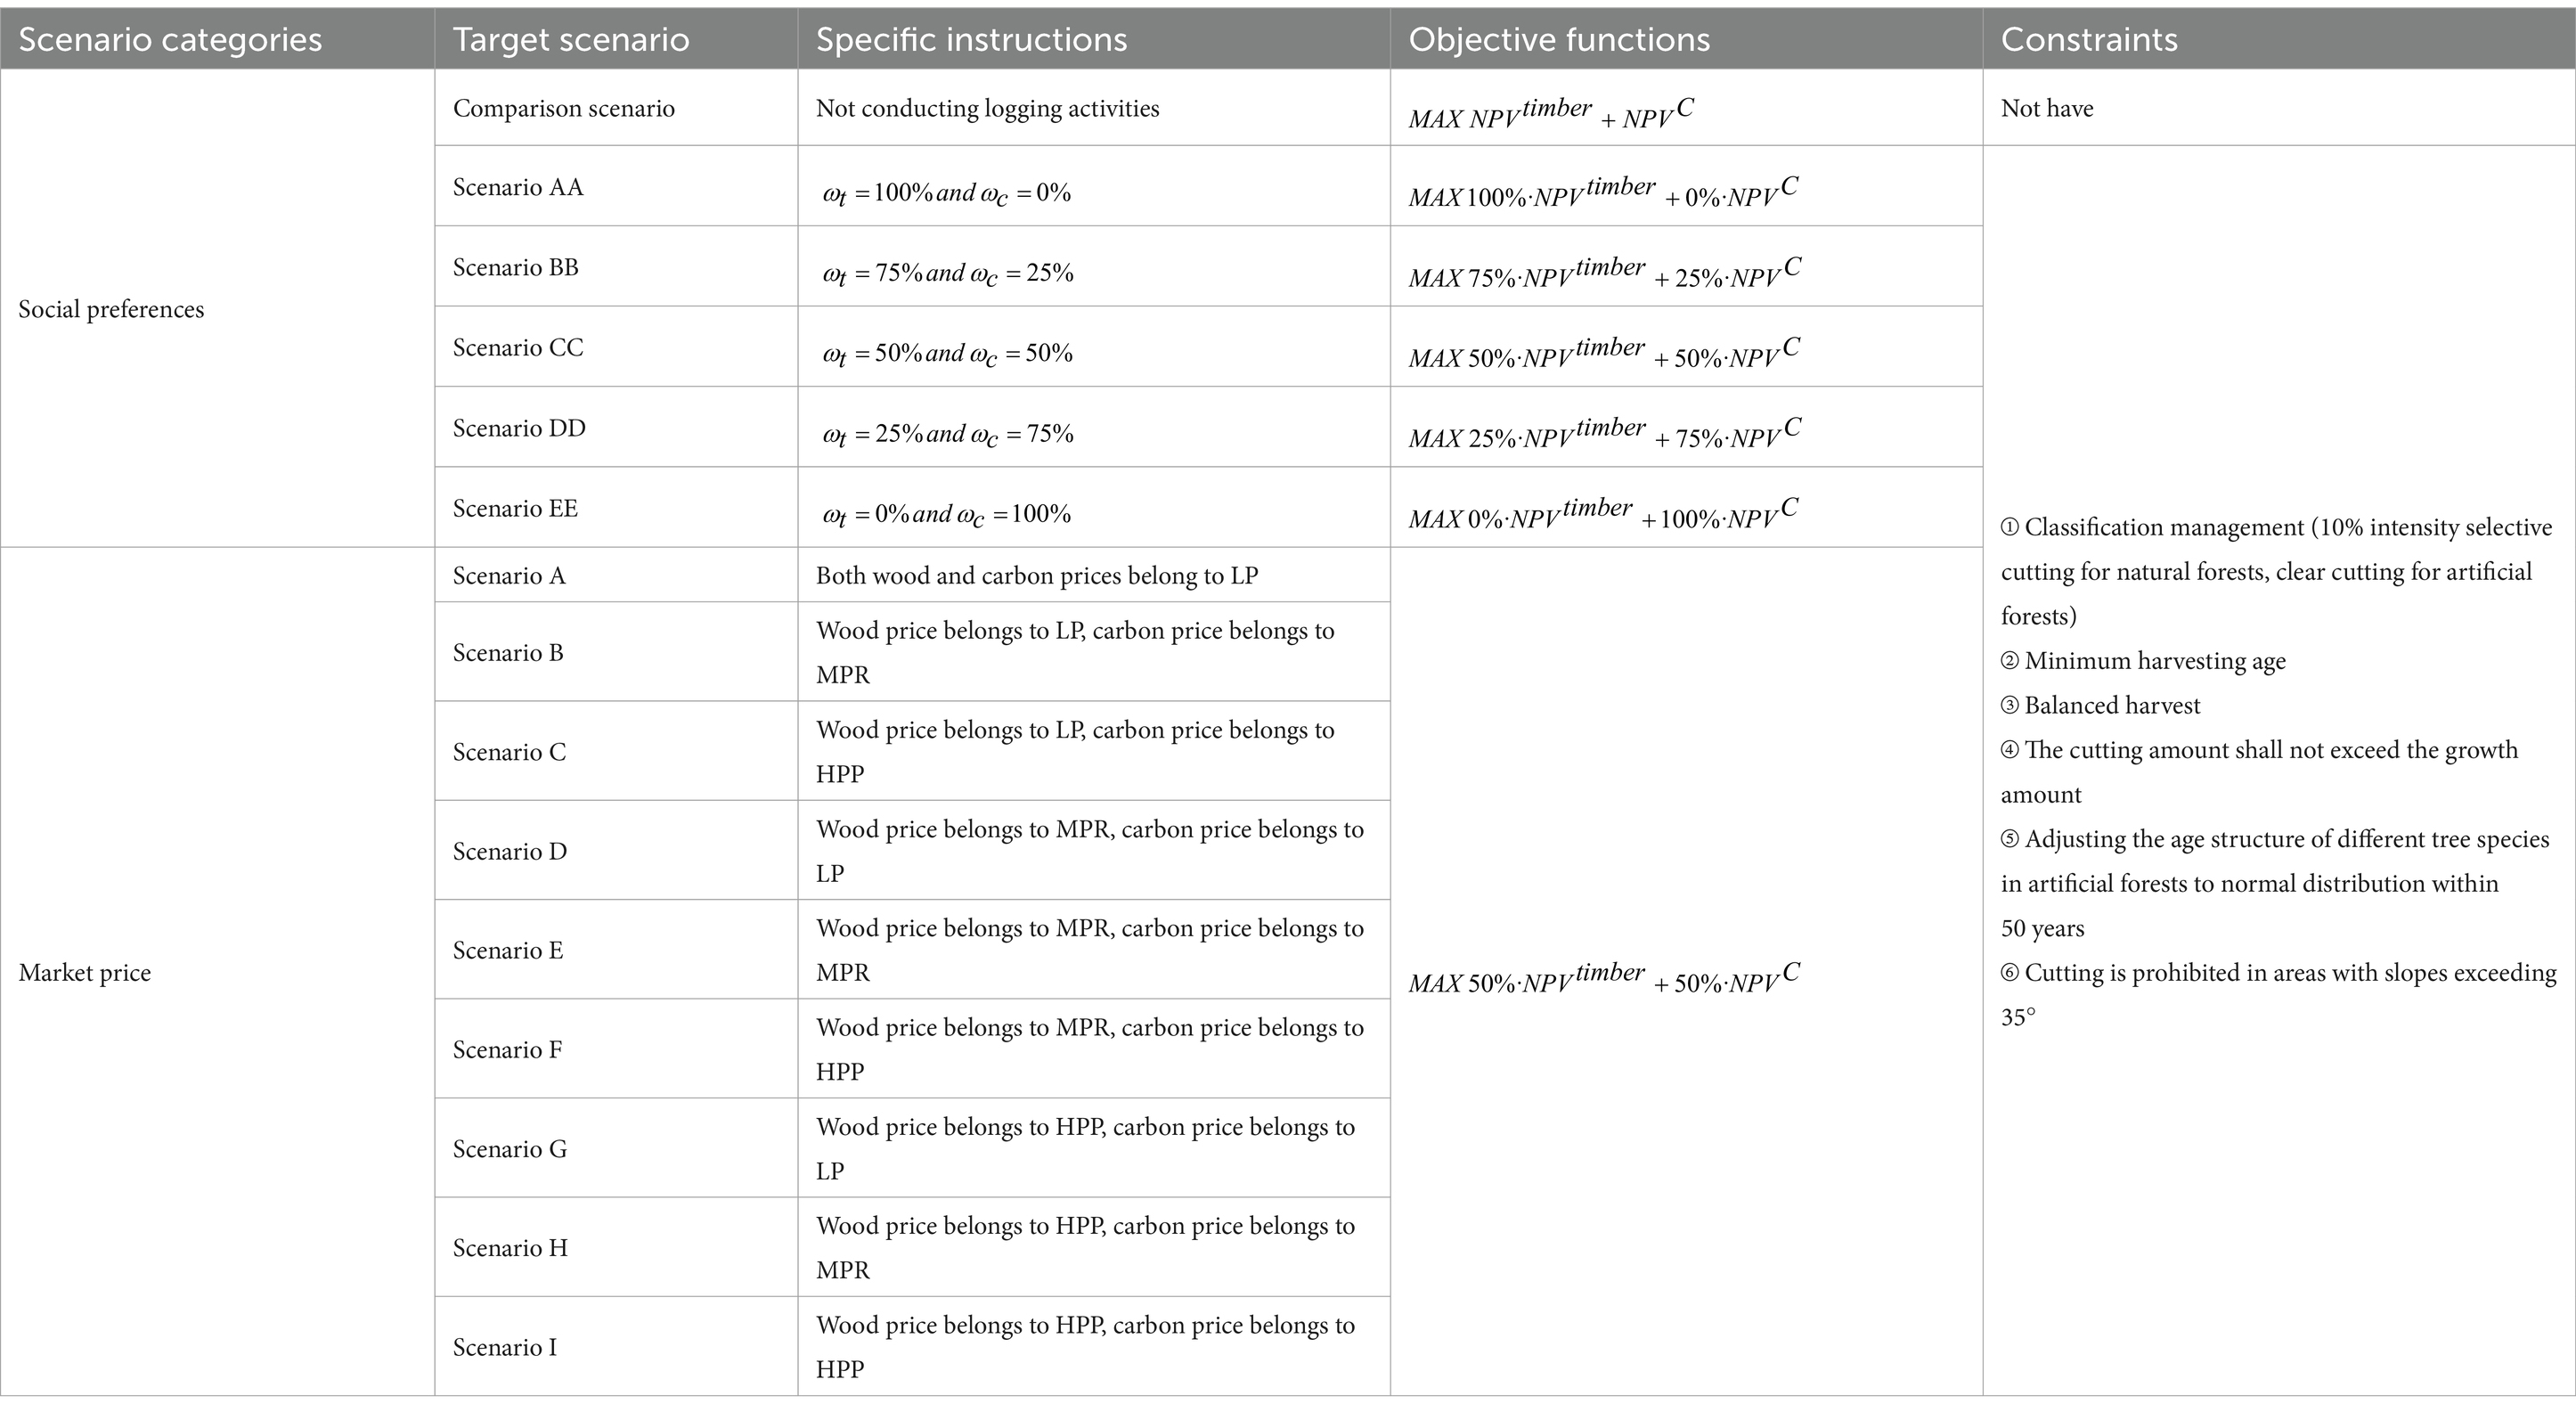
Table 3. All planning scenarios and their objective functions and constraints.
In Table 3, the planning scenarios are mainly divided into two categories: social preference and market price. In the social preference category experiment, the weights of and are adjusted, while for the market price, and are evenly divided and fixed, which are analyzed by changing the wood price and carbon price. Through the above experiments, the impact of market price and social preference on the spatial allocation plan of forest management can be explored. After the completion of the forest planning model mentioned above, the SAS optimization of FMM can be obtained through SAA. This algorithm originates from solid-state annealing, which iteratively searches the solution space starting from the initial solution. In the iteration, new solutions with a certain probability are selected to accept or reject based on the current state of the solution and the quality of the objective function, ultimately obtaining the global optimal solution of the objective function (Xuan et al., 2021; Zolfaghari et al., 2021). This method can avoid getting stuck in local optima and quickly obtain global optima, making it very suitable for SAS optimization problems in FMM (Yang et al., 2021; Zolfi and Jouzdani, 2023; Liu et al., 2021). The Metropolis criterion needs to be used for discrimination, represented by Equation 15.
In Equation 15, and are the objective function values of the new and old feasible solutions, respectively. represents the probability of accepting new solutions. The value is 1, indicating acceptance of the new state as the current state; Other values indicate maintaining the current state. SAA enables memory, feedback, and the ability to improve new solutions, with initial temperature, termination temperature, and cooling coefficient set to 100,000, 10, and 0.995, respectively, and unified temperature iteration times set to 300 (Wang Y. et al., 2021; Zhang et al., 2021; Zhu et al., 2021). Figure 2 shows the specific process of SAA.
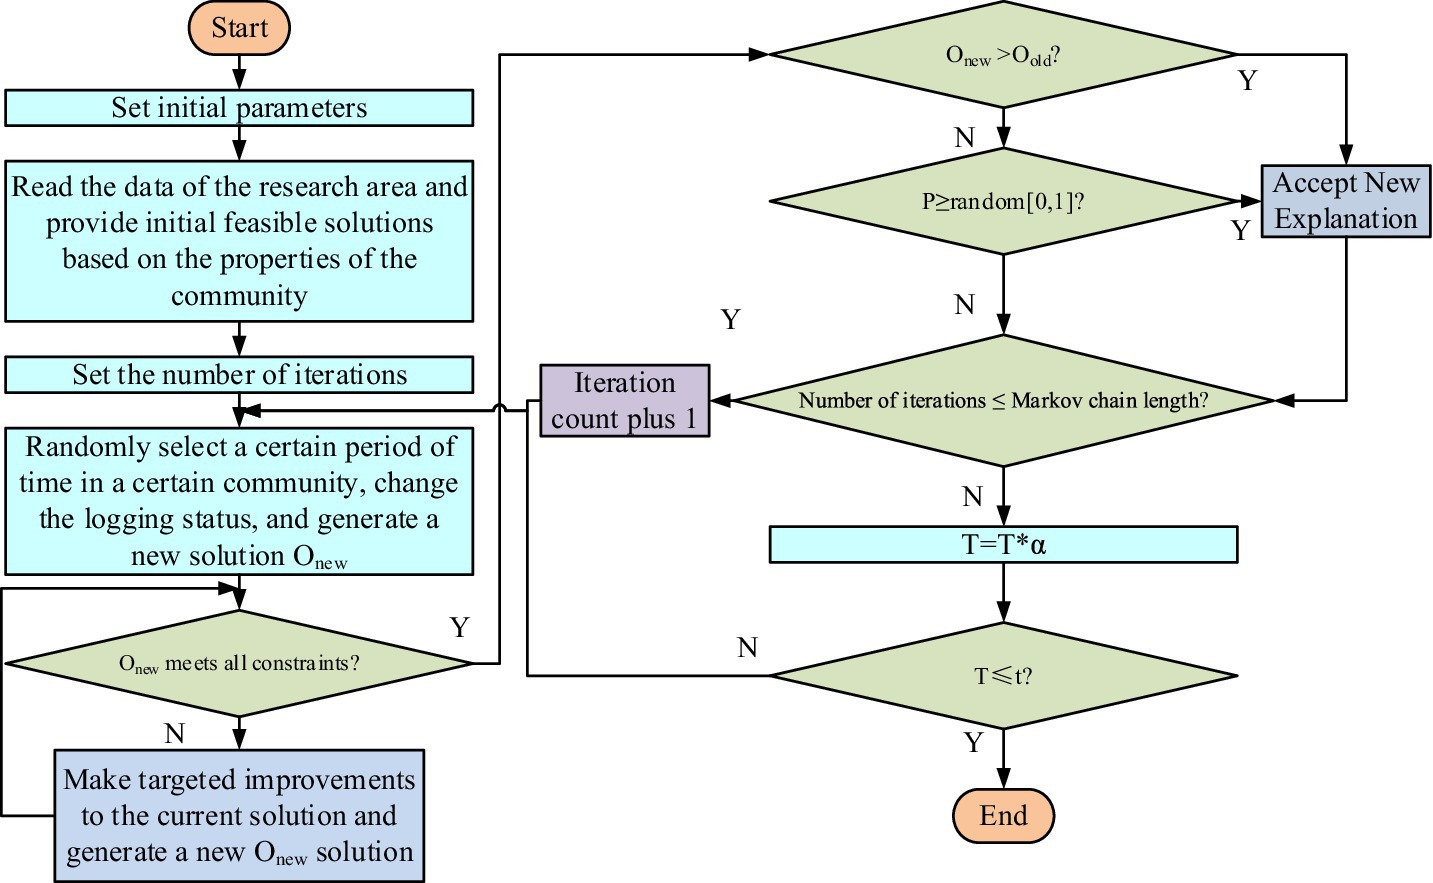
Figure 2. The specific process of SAA.
In Figure 2, the proposed SAA can compare each feasible solution and set corresponding improvement directions for all constraint conditions, so that the optimization scheme can meet the constraint conditions more quickly. Finally, after the annealing is terminated, the optimal solution obtained from the previous annealing will become the initial feasible solution. The annealing process is repeated to search for the global solution, ensuring that the final result is closer to the global optimum. To more scientifically verify the performance of constructing forest planning models, the unit limit model (ULM) and area limit model (ALM) were introduced to quantitatively analyze the impact of different spatial constraint forms on forest planning results. The ULM model strictly prohibits simultaneous logging of adjacent forest stands during the same planning period. Although it significantly reduces the wood income of deep forest management, it makes the spatial and temporal distribution of management measures more reasonable, which helps to maintain and create a reasonable landscape structure. The ALM model allows for the harvesting of a certain area of adjacent forest stands without violating the maximum area constraint, with a relatively small impact on economic benefits, and the planning results are more in line with the concept of sustainable forest management.
3 Results
To obtain the best SAS optimization for forest management, the study first analyzed the dynamic FMM spatial configuration and artificial forest structure adjustment in the study area. Then, the SAS for FMM was explored separately from social preferences and market prices. Finally, the above analysis was used to obtain the SAS optimization results for forest management that fully account for carbon fixation, social and economic factors.
3.1 Spatial allocation plan for forest management measures and adjustment of age structure of artificial forests
The experimental environment is as follows. The SAA algorithm is implemented using MATLAB software and a personal computer with Intel Core i7, 16GB RAM, and Windows 11 is used. Firstly, it is necessary to verify the feasibility of the proposed forest planning model. This statistical data implementation requires 10 independent runs. Using the SAA algorithm to solve the objective functions of different forest planning models, the corresponding statistical feature results can be obtained, as shown in Table 4.
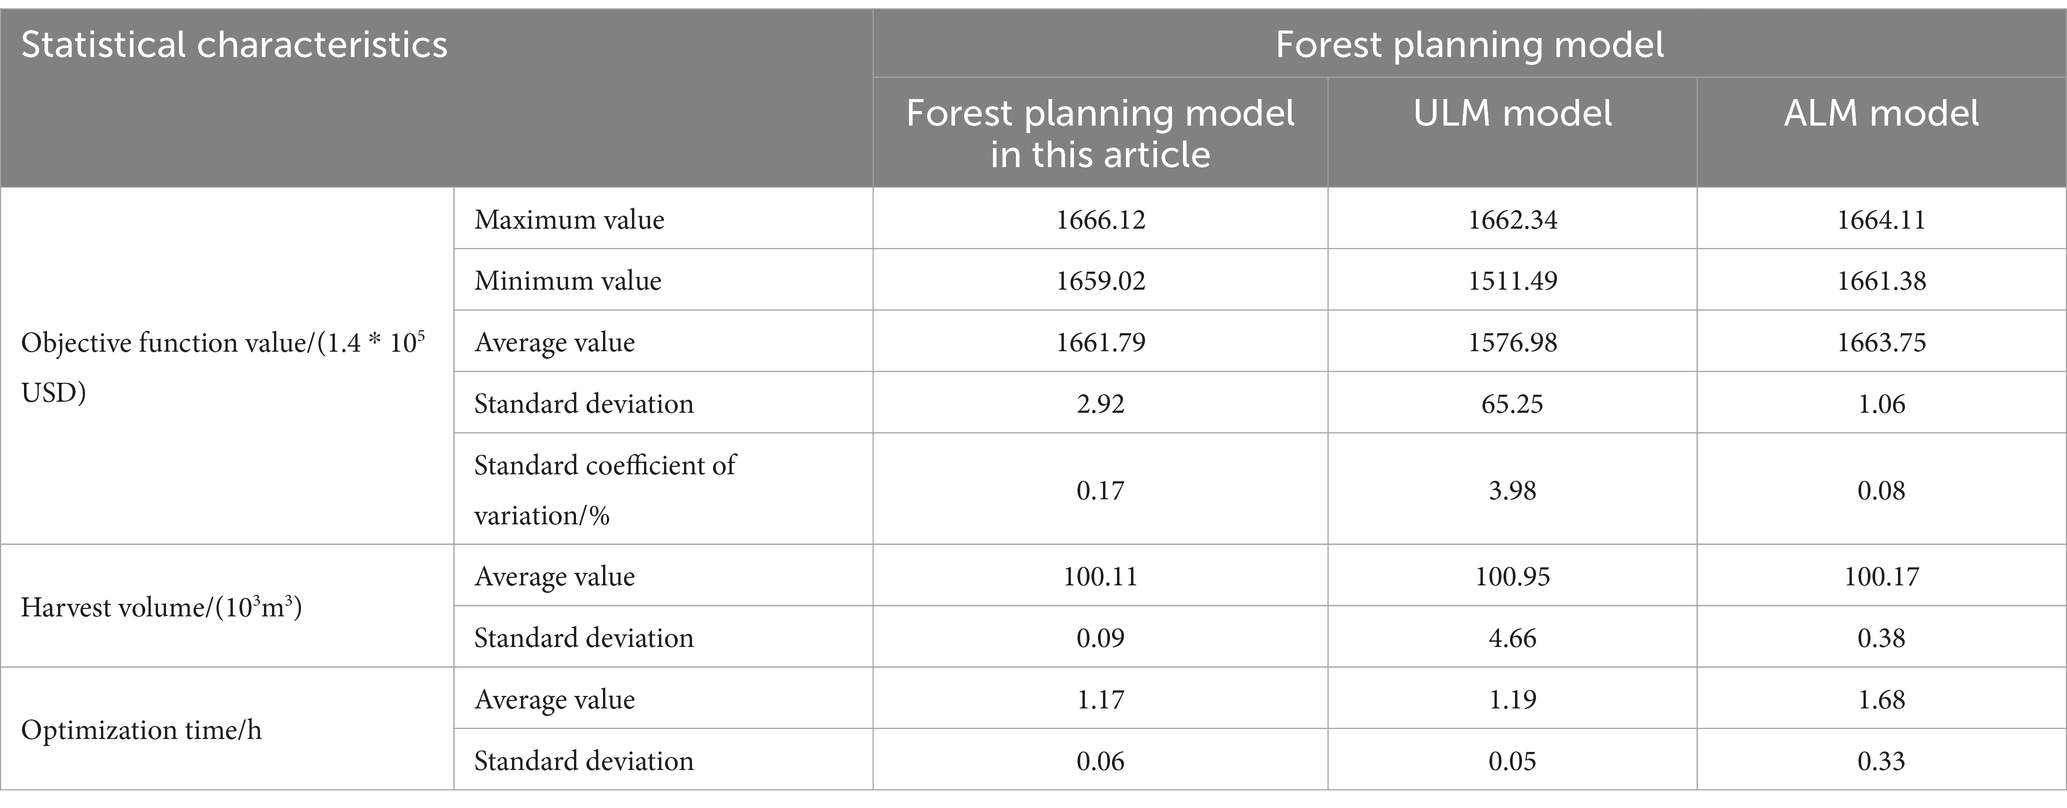
Table 4. Statistical feature results of objective function solving for different forest planning models based on SAA algorithm.
From Table 4, it can be observed that the coefficient of variation corresponding to the objective function values of different forest planning models is relatively small, indicating that the optimization results of the proposed SAA algorithm have good stability and can meet the needs of complex forest management planning. The ULM model has the highest coefficient of variation, which is 3.98%, indicating that the model is more complex and difficult to solve. In terms of harvest volume, different models are similar to the expected harvest goals, and the average harvest volume of the proposed model is closer to the expected goals, with an average deviation of only 93.3 m3/a. The average harvest volume deviation of the other two models shows a continuous increasing trend, reaching 170m3/a and 950m3/a, respectively. The average optimization time of the model proposed in the study is the lowest, at 1.17 h. In addition, based on the significant differences in standard deviation and standard coefficient of variation, there are significant differences between the forest planning model and other methods, and the performance differences in the objective function values are more significant. Based on the above results, it can be concluded that the proposed model can more effectively control the spatial and temporal distribution of forest management plans, which is more conducive to the application of forest planning in the later stage. To dynamically display the changes of SAS for FMM during the planning period, this study analyzed scenarios with different wood and carbon sequestration weights and selected three time periods: start, middle, and end stages. Figure 3 shows the corresponding results.
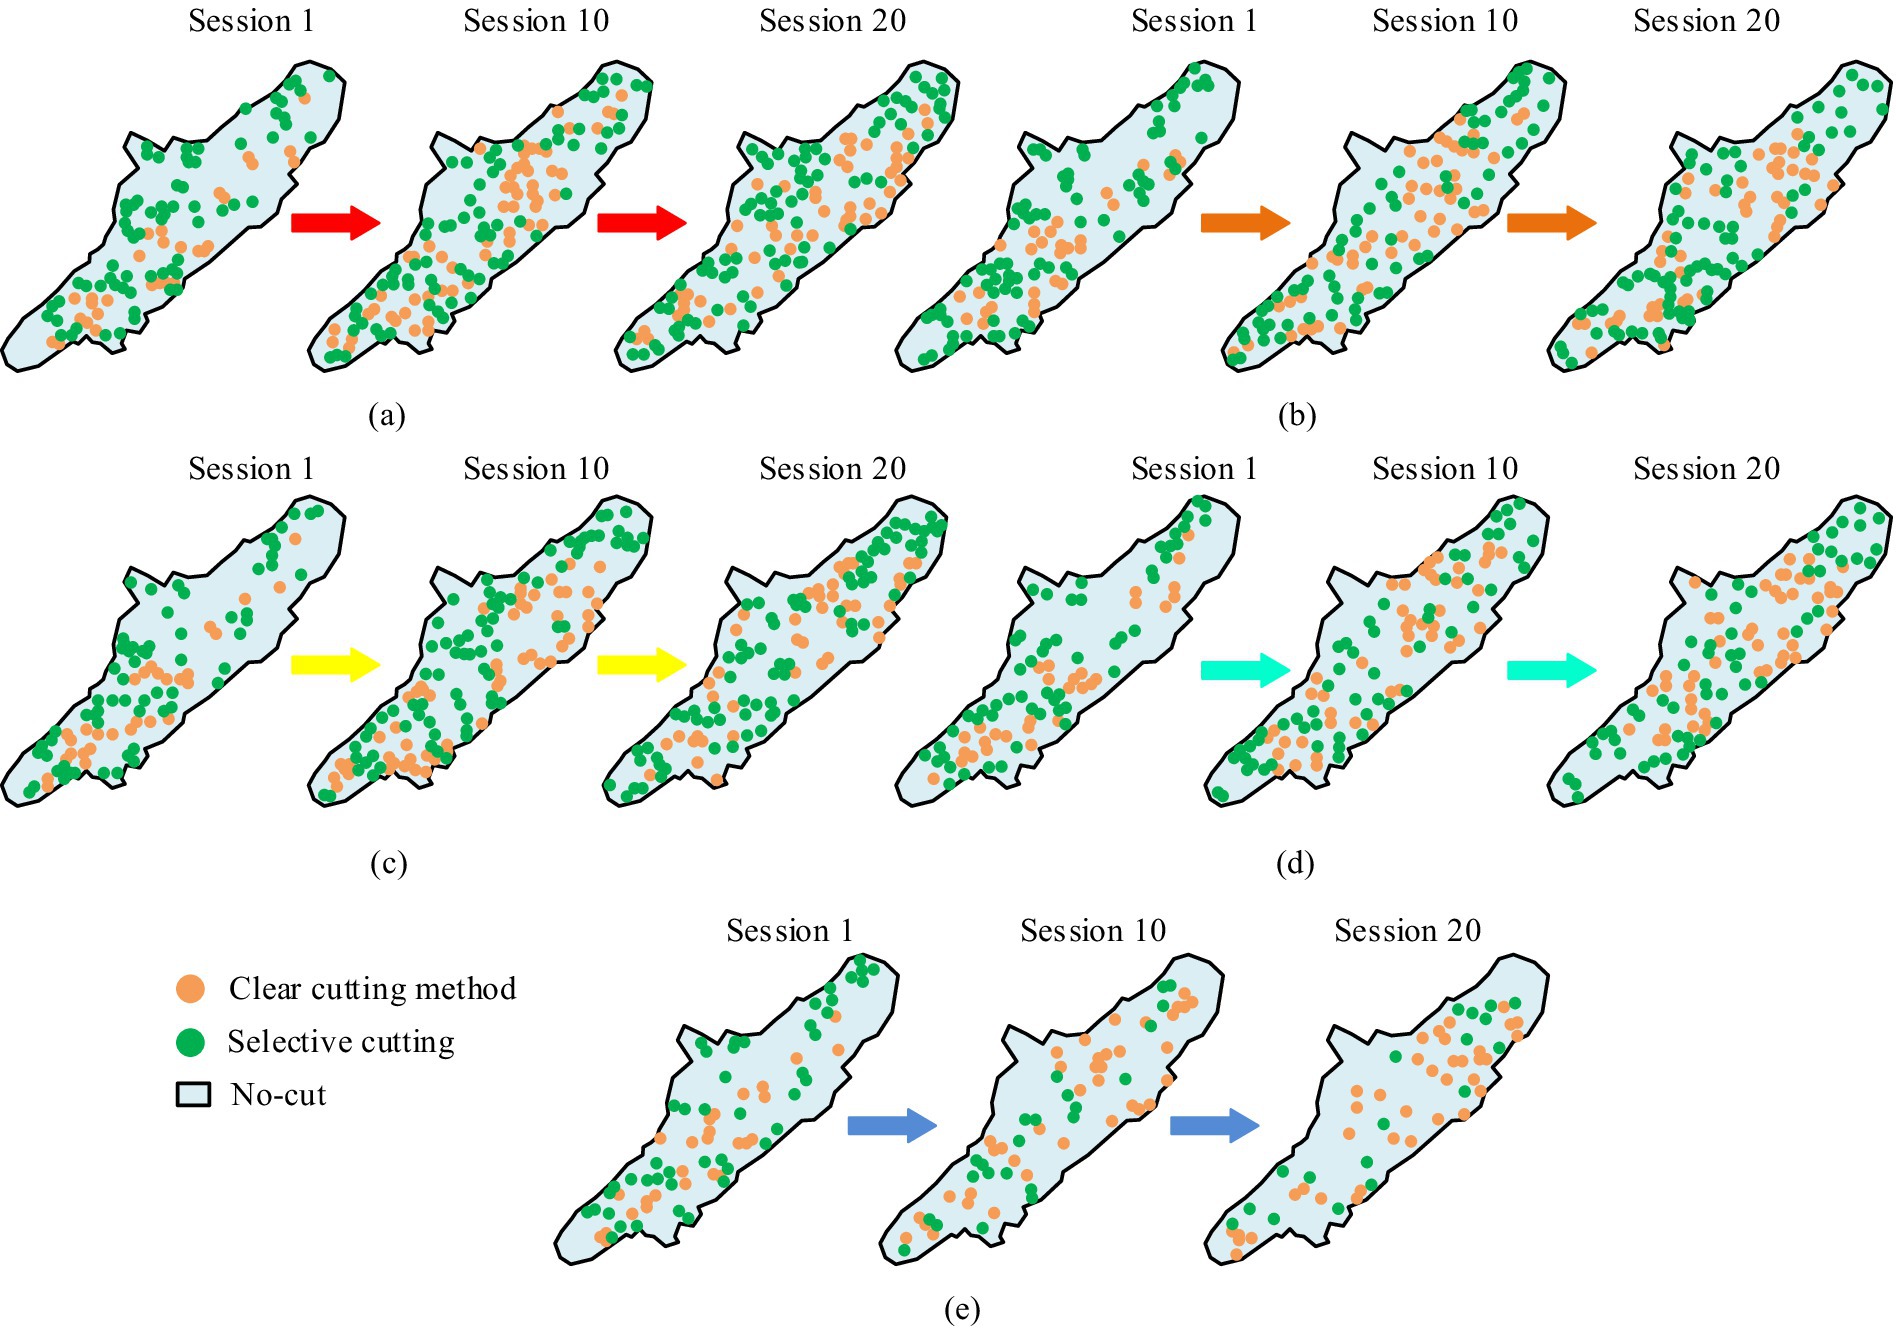
Figure 3. Spatial allocation schemes for dynamic forest management measures under different scenarios of wood and carbon sequestration weights at the beginning, middle, and end stages.
From Figure 3, at the beginning, there were very few resources available for logging in the forest of the study area, and the age structure of the forest was imbalanced. The fraction of SAS logging regions in the FMM was very small for all five scenarios. During the intermediate period, due to a period of adjustment, the area of logging activities was continuously expanding and tended to stabilize finally (Si et al., 2022; Gea-Izquierdo and Sanchez-Gonzalez, 2022). Due to differences in logging methods and their proportions, there are also differences in different scenarios. As continued to grow, the proportion of clear and selective logging also increased. Scenario AA corresponded to the highest selective logging area, with an average of 23% at different time periods, but the average clear logging area was 10%. In the scenario EE with the highest , the average proportion of selective and clear logging areas decreased by 72 and 48%, respectively. This means that to achieve maximum forest CFS, it is necessary to minimize logging frequency as much as possible. Although the forest has been divided into different age groups in the method, the age classes of different tree species cannot be one-to-one matched with age groups. For example, the over mature forest of Chinese fir type is at the age of 8, and the over mature forest of Pinus massoniana artificial forest is at the age of 6. Therefore, in order to better demonstrate the dynamic age structure adjustment changes of different tree species types, age class standards are used to divide the age structure. All optimization scenarios require completing the task of normal distribution within 50 years, that is, the age structure corresponding to the artificial forest must be stable in a relatively uniform distribution. Therefore, the dynamic age-structure adjustment variations of types S and M were analyzed in this study.
Figure 4 shows the results of dynamic age structure adjustment for type S in different scenarios during the planning period. In the initial stage, type S lacked forest resources with the minimum logging age, so logging activities only began in the second time period. After the 9th period, the age structure of this type had been adjusted to a normal distribution state and stabilized within a certain range in the later stage of the planning period (Liu et al., 2022).
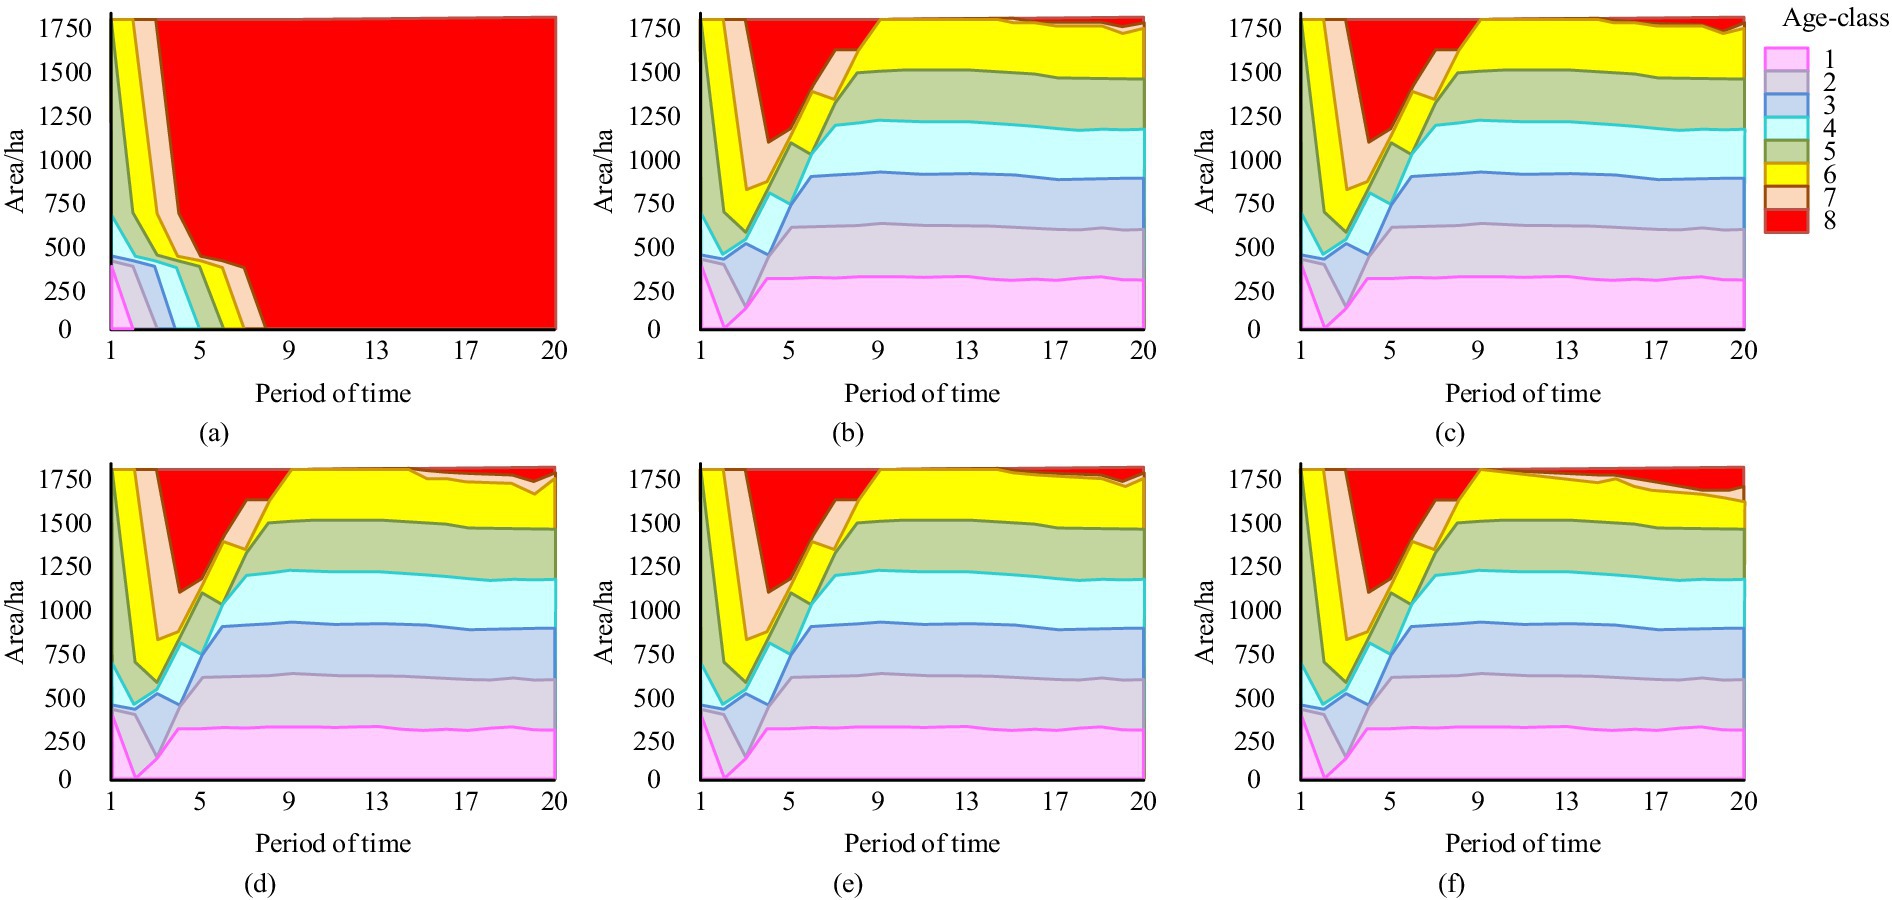
Figure 4. The dynamic age structure adjustment results of artificial forests under different scenarios during the planning period for type S.
Figure 5 shows the results of dynamic age structure adjustment for artificial forests of type M in different scenarios during the planning period. In the initial stage, type M already had forest resources available for logging activities and could achieve its goal of uniform distribution of target age structure area in the 8th period. After this period, the age structure of this type could achieve a relatively stable state. Based on the above content, in different optimization scenarios, as increases, the proportion of OMF area increases, while in the comparison scenario, types S and M eventually grow to OMF. Based on the above results, it can be concluded that by using forest inventory vector data as input data for the model and optimizing it using the SAA algorithm, configuration plans for different management measures can be obtained. At the same time, through dynamic visualization, the forest planning model and optimization results can be combined with geographic dynamic visualization. This indicates that the proposed method has wider applicability and can help forest operators arrange forest spatial configuration.
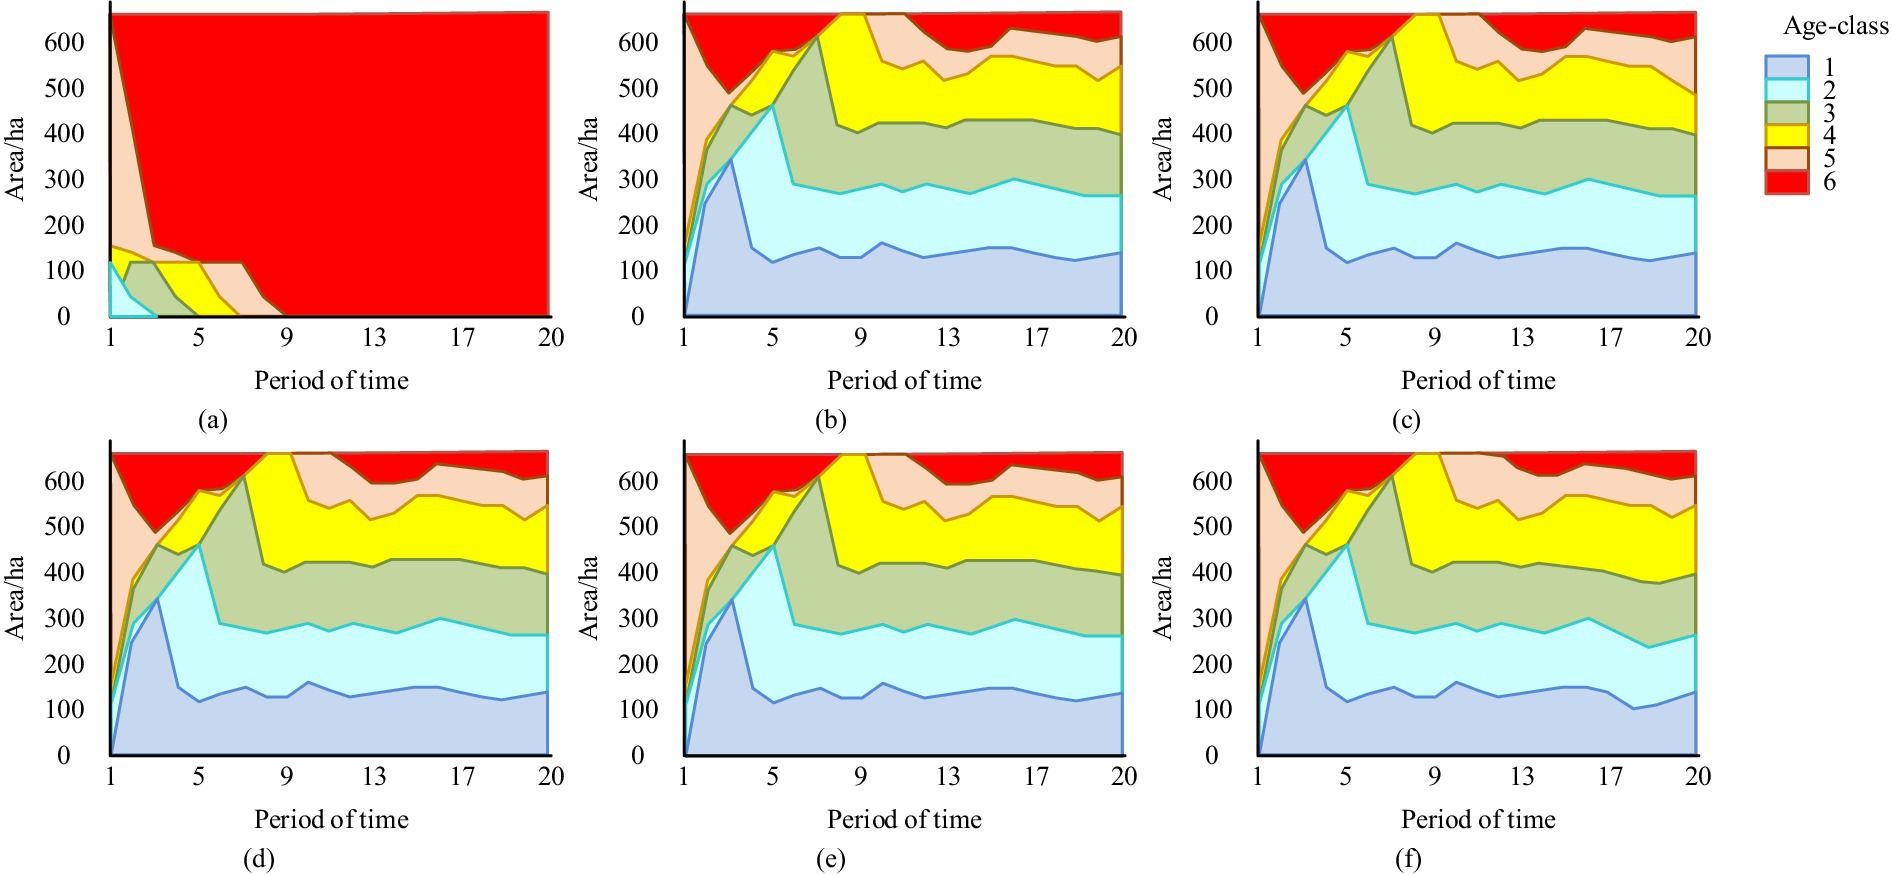
Figure 5. The dynamic age structure adjustment results of artificial forests under different scenarios during the planning period for type M.
3.2 Analysis of the impact of social preferences on spatial allocation schemes of forest management measures
To explore the impact of social preferences on the SAS of FMM, experiments were conducted on five optimization and comparison scenarios. Changes in forest resources, total yield, total NPV, Existing Storage Capacity (ESC), and Carbon Stock (CS) were explored. ESC represents the total volume of various living trees in a certain area of forest during a certain period, while CS is the total amount of carbon fixed in vegetation, soil, and wood in the forest. ESC focuses on measuring forest growth status, while CS focuses more on the carbon storage capacity of forest ecosystems.
Figure 6 shows the dynamics of forest resources in various contexts of social preference. Compared with the comparison scenario, the optimized scenario achieved significant improvements in both ESC and CS in a short time due to higher logging intensity. However, starting from the 6th period, the ESC and CS of all optimized scenarios were lower than those of the comparison scenario. Compared with the comparison scenario, the ESC and CS of each optimized scenario were 200,000 to 280,000 cubic meters and 50,000 to 100,000 tons higher, respectively. At the initial stage, there was a severe shortage of forest resources available for logging in the study area, resulting in significant changes in logging intensity for all optimized scenarios. From the 35th year onwards, the ESC of scenario EE began to be higher than other optimization scenarios, about 8.8*104 m3, while CS began to outperform other optimization scenarios from the 25th year, at 4.9*104 t. In addition, as increased, the logging intensity continued to increase, resulting in a decrease in ESC and a decrease in CS (Bousfield et al., 2023). The scenarios EE and AA had the lowest and highest annual timber harvest, respectively. However, EE had higher ESC and CE in the late stage. Compared with other optimized scenarios, AA showed no significant fluctuations in resource changes throughout the entire process.
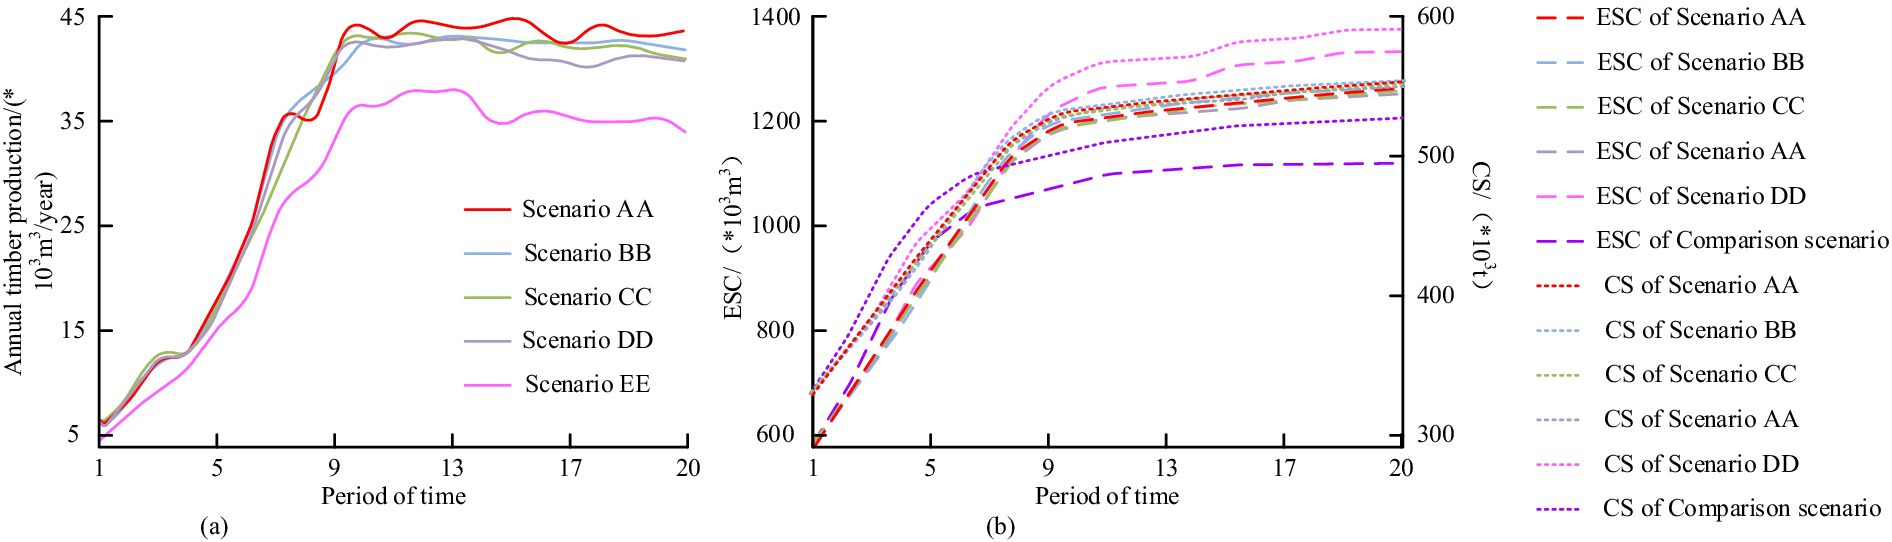
Figure 6. Dynamic forest resource change curve under various social preference scenarios.
Figure 7 shows the total forest timber production and total NPV benefits under various social preference scenarios. Scenario EE achieved the maximum CFS, whose was 362,000 USD higher than other scenarios, but its total wood production and total NPV benefits were lower than the other scenarios. There was a small difference between and in other scenarios. The benefits of were much lower than those of . Every 254% increase in only increased by 1.09*106 USD, while decreasing by 2.7*104 USD.
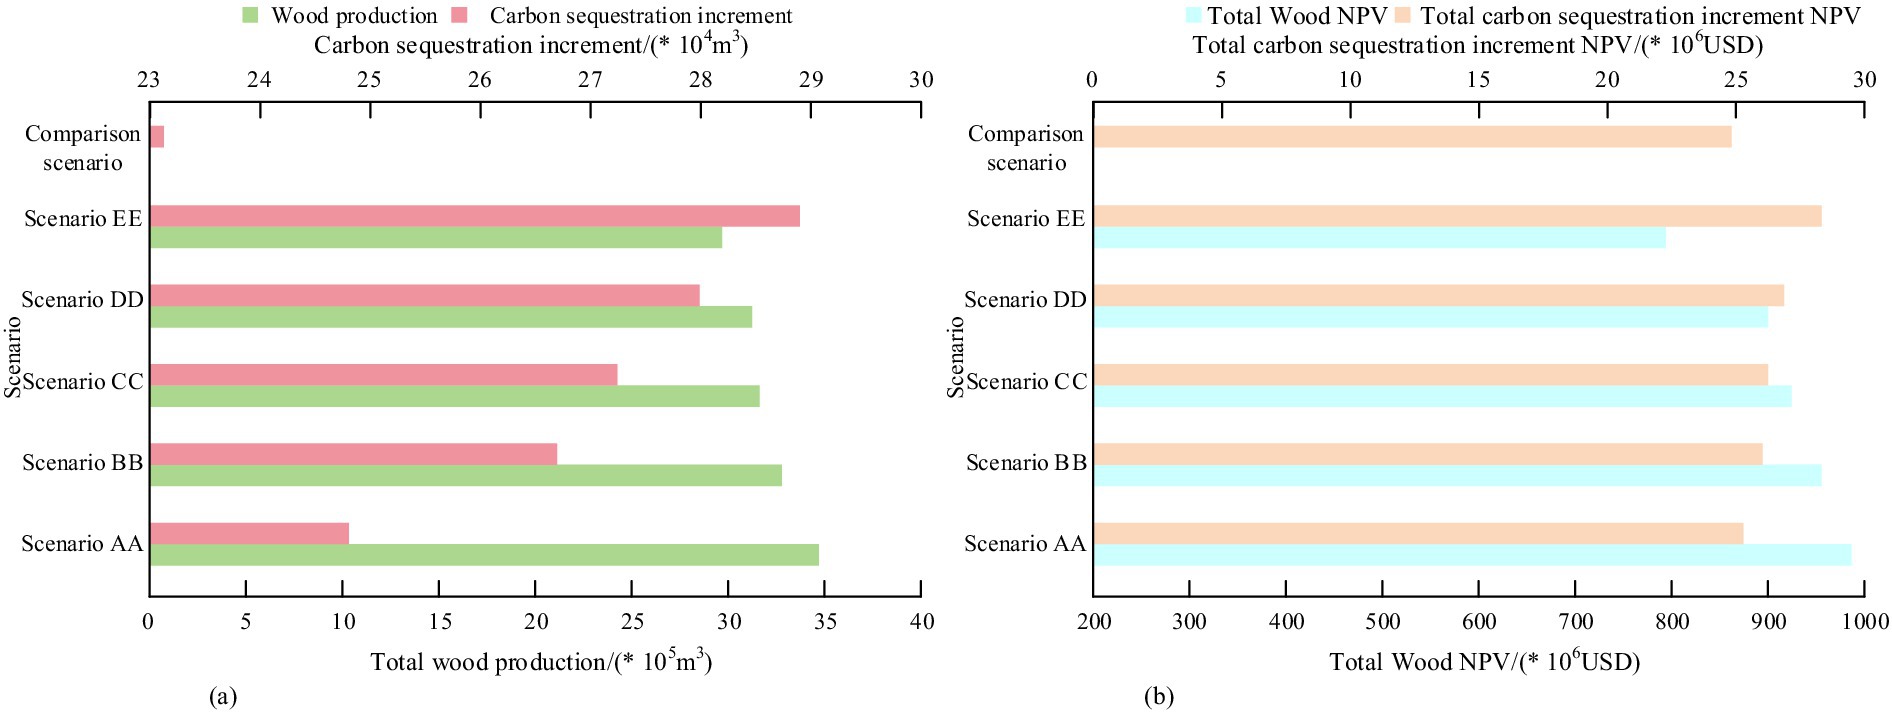
Figure 7. Total forest wood production and total NPV benefit results under various social preference scenarios.
Figure 8 shows the spatial changes of ESC under various social preference scenarios before and after optimization. In the initial planning stage, ESC was relatively low, which was less than 110m3/ha in most areas, accounting for approximately 64.16% of the total area. Only 0.22% of the forest farm area had an ESC between 360-480 m3/ha. There was a significant increase in ESC in all optimization scenarios, with an average ESC increase to 220m3/ha. Although there were differences in the forest management SAS obtained from various optimization scenarios, the spatial distribution changes were not significant due to the small area of the community. Overall, scenario EE had the best ESC optimization effect, with an average ESC of 231.35m3/ha. The average ESC for other optimization scenarios was 201.27m3/ha, and the distribution of ESC was relatively similar. There was also an improvement in the ESC in the comparison scenario, with an average ESC of 193.15m3/h. The ESC of 120-240 m3/h, 240-360 m3/h, and 360-480 m3/h accounted for 33, 3.65, and 11.87% of the total area, respectively.
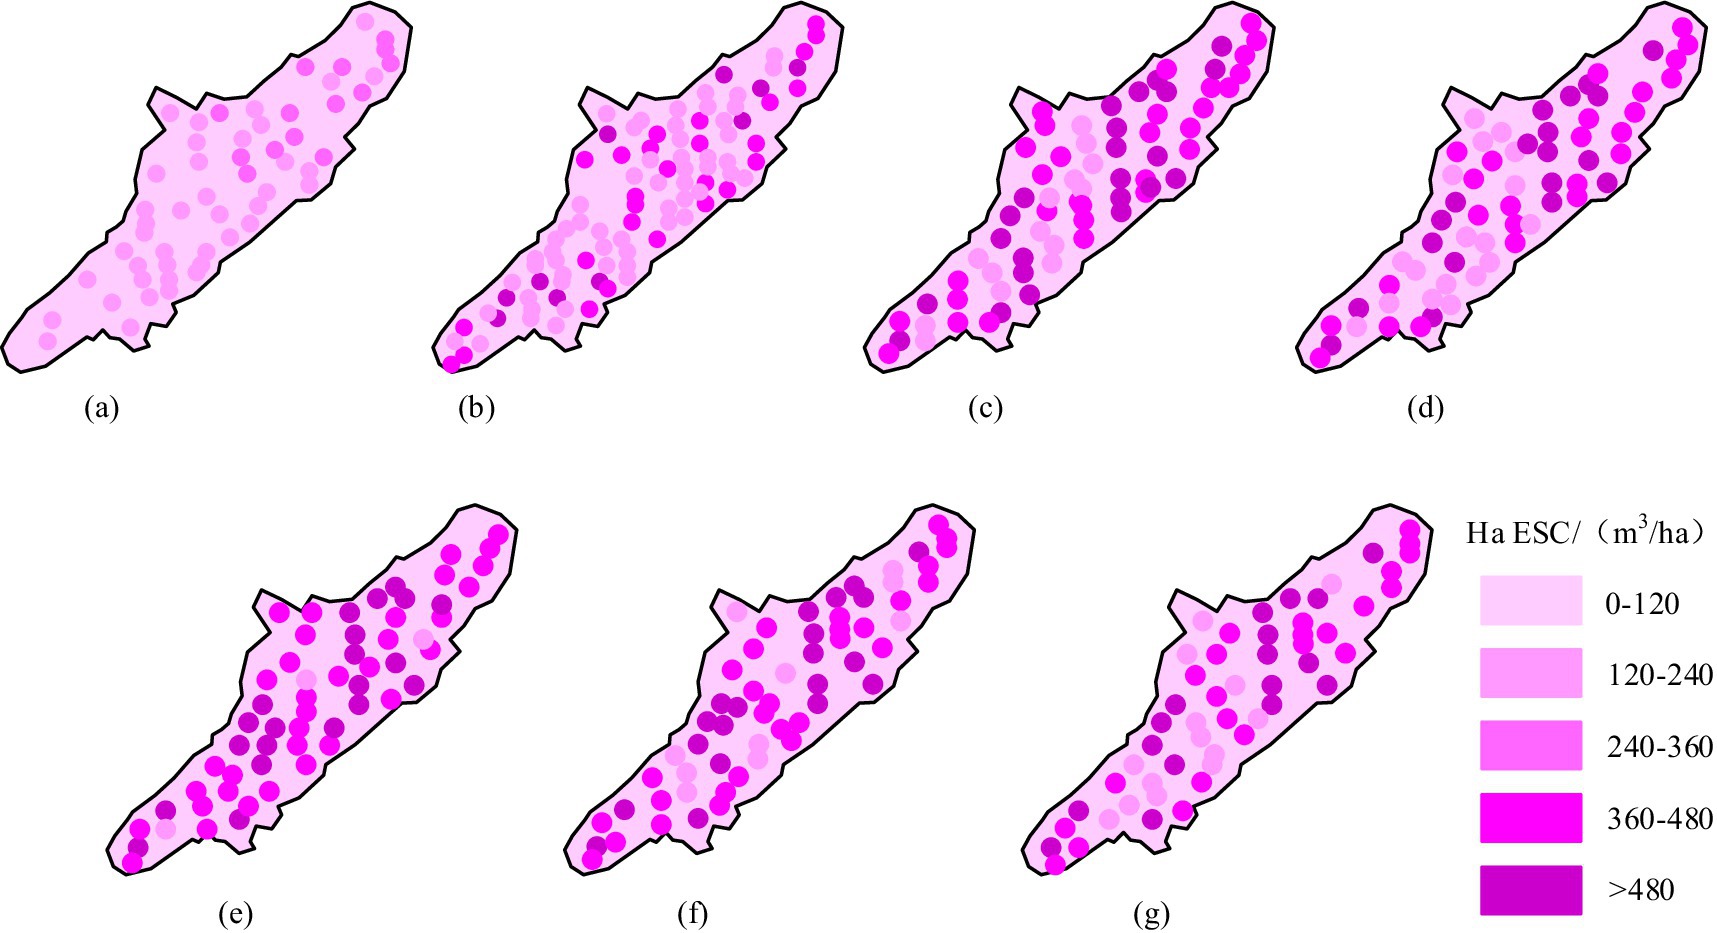
Figure 8. The spatial changes of ESC under various social preference scenarios before and after optimization.
Figure 9 shows the spatial distribution changes of CS under various social preference scenarios before and after optimization. At the initial stage, 80% of the area had CS below 70 t/ha, while only 1.78% had CS above 190 t/ha, with an average CS of 96.3 t/ha. In various optimization scenarios, the CS of most regions had significantly improved. The average CS of scenario EE increased to 123.25 t/ha, while the average CS of scenario AA increased to 109.835 t/ha, and the average CS of other optimized scenarios increased to about 1,055 t/ha. In the comparison scenario, the average CS was only 85.175 t/ha, and the areas with CS of 70–140 t/ha, 140–210 t/ha, and 210–280 t/ha accounted for 18.53, 3.72, and 4.36%, respectively. In summary, the management method that protects existing resources has a good effect on the sustainable optimization of forest quality, and the changes of have a relatively small impact on the optimization of SAS for FMM management. Considering social preferences, more emphasis should be placed on CS to create more economic benefits, while enhancing the carbon sequestration capacity of the entire forest farm, which is consistent with China’s policy philosophy. In summary, in the 50th year of the planning period, compared with the non logging scenario, considering more scientific constraints, the forest stock and carbon storage were higher than those in the non logging scenario. Moreover, the forest annual logging remained stable in the subsequent stages, which is more conducive to the long-term improvement of forest quality and lays a good foundation for sustainable forest management in the future. But placing greater emphasis on social preferences can bring more economic benefits and enhance the overall carbon sequestration capacity of forest farms, which is consistent with the current carbon policy of the Chinese government.
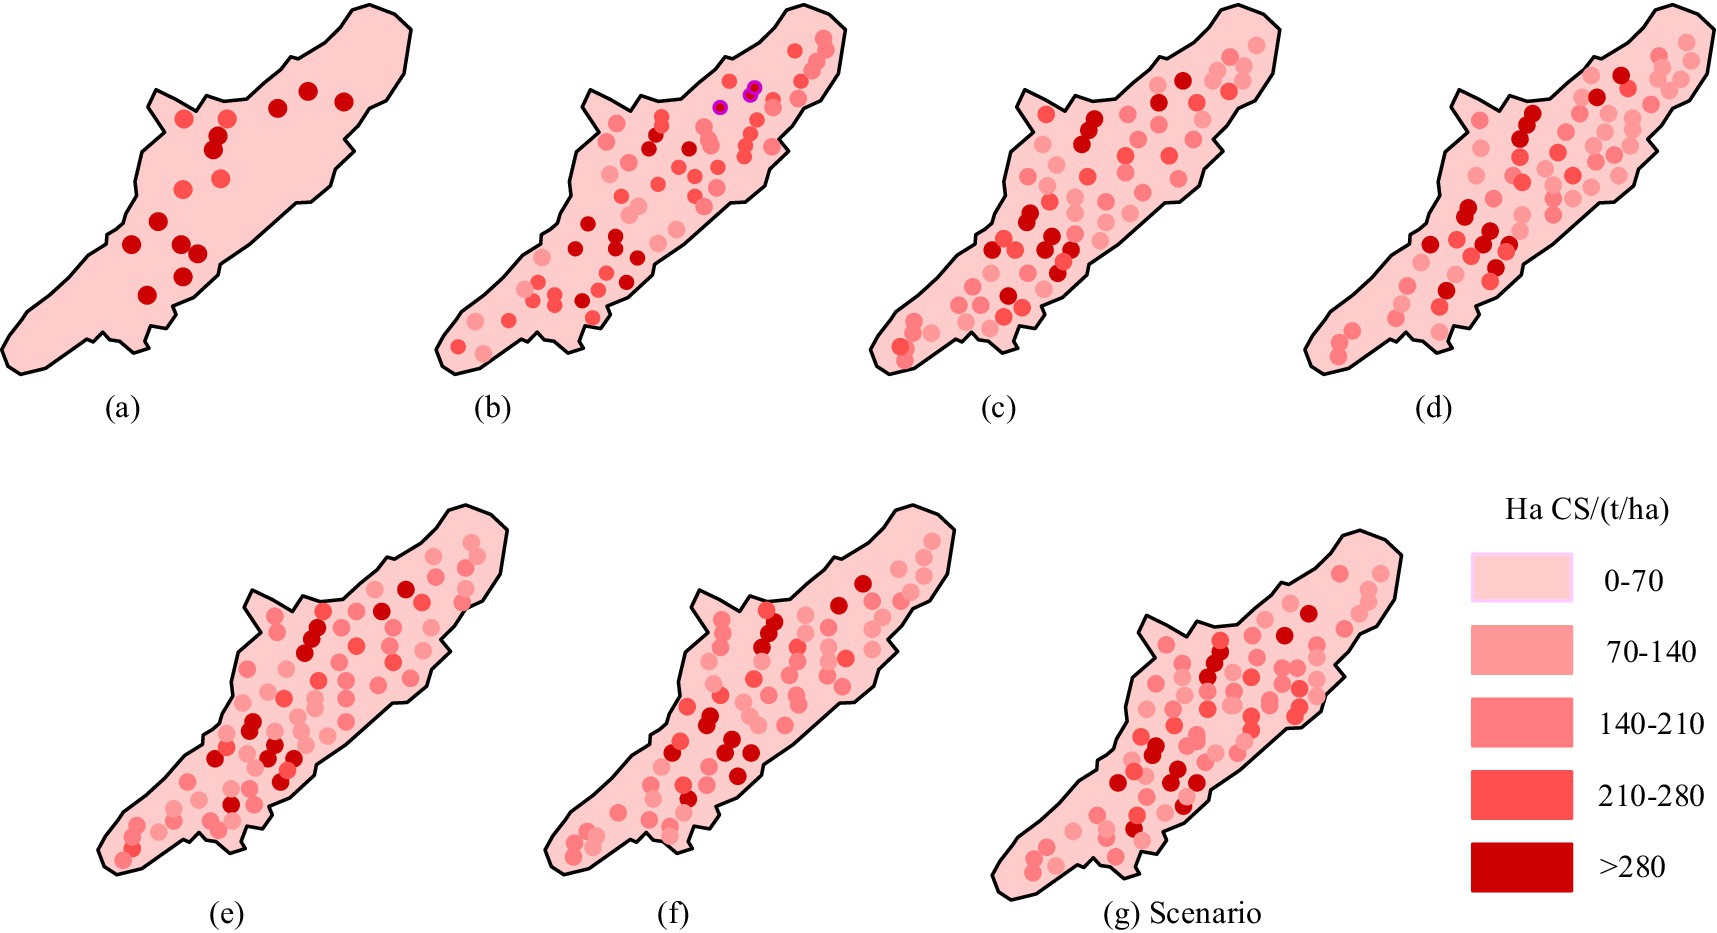
Figure 9. Changes in the spatial distribution of CS under various social preference scenarios before and after optimization.
3.3 Impact of market prices on spatial allocation schemes of forest management measures and optimization results
To explore the impact of market prices on the SAS of FMM, experiments were conducted on optimization scenarios with different prices. Dynamic forest resources, total production, and total NPV were evaluated.
Figure 10 shows the impact of wood prices on dynamic forest resources when the carbon price is kept constant. When the carbon price was at LP level, the impact of wood prices on forest resources was relatively small, and the changes in annual production, ESC, and CS in scenarios A, D, and G were minimal. When the carbon price was between MPR and HPP, wood prices had a certain impact on the dynamic changes of forest resources. When the carbon price was MPR, the annual production of scenario B was 6*103 m3 lower than that of scenarios E and H. However, the ESC differences among these three scenarios in the early stage were relatively small. After the 10th period, the ESC and CS of scenario B continued to be higher than other two scenarios, specifically 40,000 and 50,000 tons. The logging intensities in scenarios E and H were similar. Therefore, in the late stage, the annual logging volume for both scenarios remained stable at 44,100 m3. After the 9th period, the ESC and CS of scenario E tended to stabilize with values of 1.31*106 m3 and 6.1*105 t, respectively. After the 16th period, the difference in ESC and CS between scenarios E and H was smaller. When the carbon price was HPP, the wood production in scenario C was 7,100 m3 lower than that in scenarios F and I. After the 8th period, the ESC and CS of scenario EE began to be higher than those of scenarios F and I. At the end of the planning period, the changes in ESC and CS of scenarios F and I tended to be consistent.

Figure 10. Impact of wood price on dynamic forest resources at a fixed carbon price.
Figure 11 shows the impact of carbon prices on dynamic forest resources at a fixed wood price level. When wood prices were at the LP level, carbon prices had a certain impact on dynamic forest resources. In the initial and intermediate stages, scenario A had higher annual production than scenarios B and C. However, the corresponding ESC and CS for this scenario were the lowest, while scenario C had the highest corresponding ESC and CS. When the wood price was at the MPR level, the annual production of scenarios D, E, and F decreased with the increase of carbon price, but ESC and CS did not show significant changes. When the wood price was at the HPP level, carbon price was inversely proportional to wood production, and scenario I had the highest ESC and CS. At the end of the period, the difference between scenario G and H continued to narrow.

Figure 11. Impact of carbon price on dynamic forest resources at a fixed wood price. (a) Wood yield results under different scenarios during LP; (b) ESC and CS results in different scenarios during LP; (c) Wood yield results under different scenarios during MPR; (d) ESC and CS results in different scenarios during MPR; (e) Wood yield results under different scenarios during HPP; (f) ESC and CS results in different scenarios during HPP.
Figure 12 shows the comparison between the total forest production and the total NPV benefit for the optimized scenario considering the market price. The impact of wood and carbon prices on SAS optimization in forest management was relatively small in market prices, with greater fluctuations in carbon prices. Overall, when the gap between yield and nitrogen fixation was very small, prices were directly proportional to economic benefits (Singh et al., 2022). In summary, when considering the impact of market prices on forest management SAS, it is necessary to increase carbon prices in the market to achieve a balance between wood sales and carbon storage, economic benefits, and ecological functions. Based on the specific analysis of SAS optimization of forest management using SAA and GIS, the following optimization results have been obtained taking into account forest carbon sequestration, society, and economy. Firstly, at the end of the planning period, the age structure corresponding to different optimization scenarios will tend to stabilize, so more attention needs to be paid to the changes in forest carbon sinks and prices. Secondly, the carbon sequestration cost in China’s forest CFS is relatively low, so a series of policies are needed to increase the carbon price in the trading market to ensure the achievement of China’s dual carbon goals. The output results obtained through the method proposed in the study can well meet the constraint conditions and achieve forest planning goals, with better applicability. It provides reference for the development of management plans based on classification management and age structure adjustment theory in Chinese forest farms, contributes to ensuring long-term stable forest quality and sustainable wood production, and is also conducive to the increase of forest carbon sinks in China and helping China better achieve carbon neutrality goals.
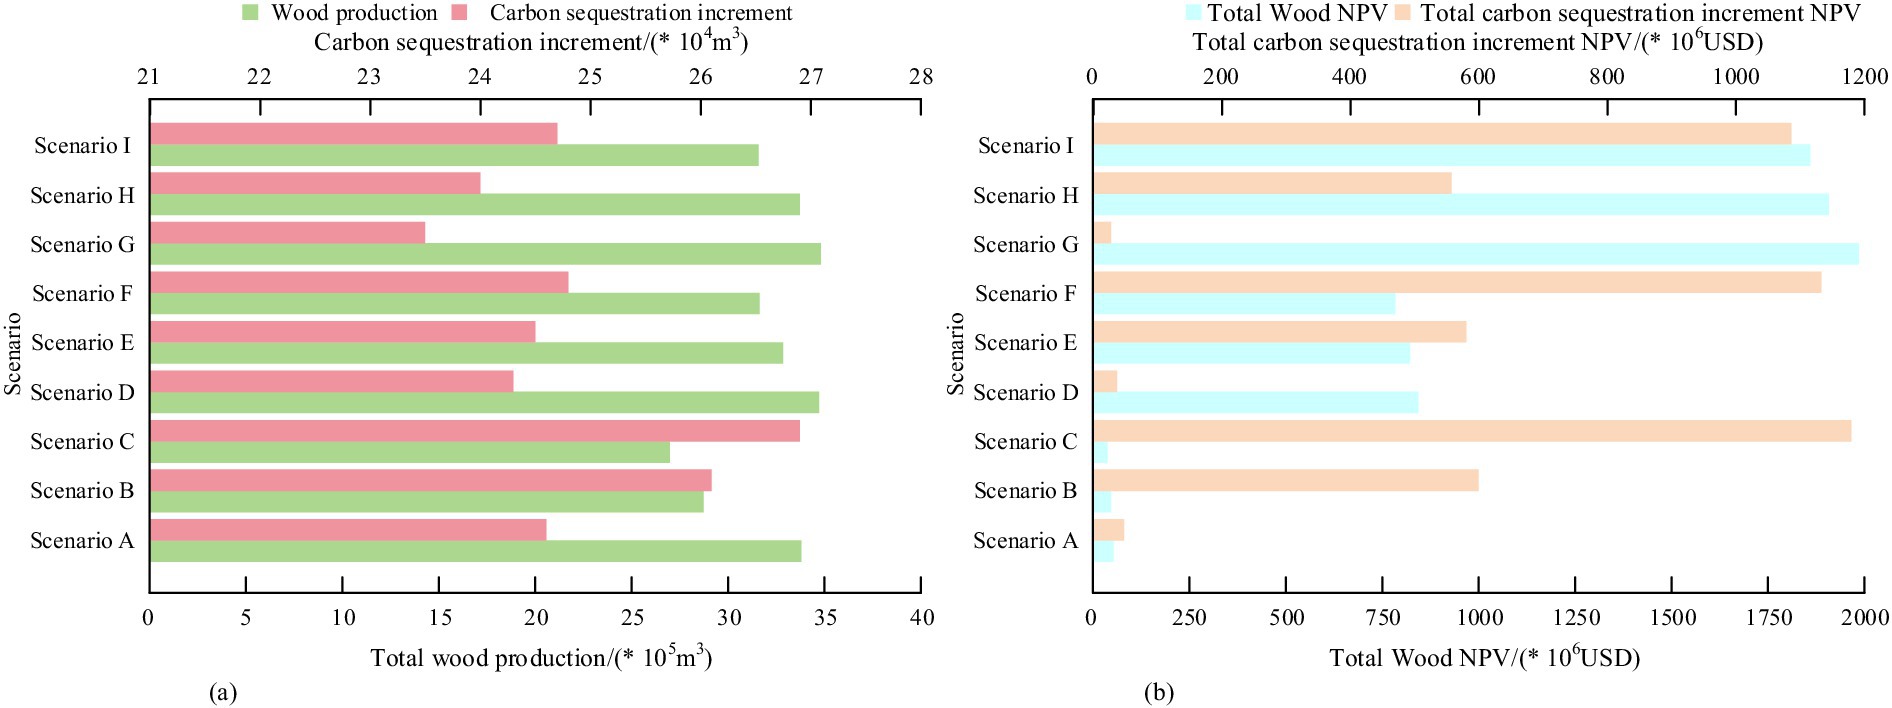
Figure 12. Comparison of total forest yield and total NPV benefits in optimization scenarios considering market prices. (a) Wood production and carbon sequestration increment results; (b) NPV results of total wood and carbon sequestration increment.
4 Discussion
Forest is an important natural ecosystem, which plays a basic and strategic role in maintaining national ecological security and promoting the construction of ecological civilization. At present, China’s forest and grass ecological construction has ushered in a new historical stage, which attaches equal importance to scientific greening and improving quality and efficiency. It is urgent to continue to increase the total amount and quality of forest resources by strengthening forest protection and sustainable management, implementing forest quality improvement projects, and enhancing forest carbon sequestration capacity. Therefore, the research first determined the research area and forest resources overview, then designed the forest resources planning model, and finally explored the effects of different constraints through GIS and SAA algorithms. The results were analyzed from three aspects: spatial allocation scheme of forest management measures and adjustment of plantation age structure, considering the influence of social preference and considering the influence of market price.
First of all, in the initial stage of the spatial allocation scheme of forest management measures, there were very few resources that could be harvested, and the forest age structure was unbalanced, and the proportion of felling area under different scenarios was very small. Due to the adjustment measures taken in the middle period, the felling activity area continued to expand, while the region was stable in the end period. With the continuous growth of , the proportion of clear cutting and selective cutting also increases. Among them, scenario AA corresponds to the most selected felled area, with an average of 23% in different periods, but the average clear-felled area is 10%. In the scenario EE with the highest , the average proportion of selected and clear-cut areas decreased by 72 and 48%, respectively. These results suggest that attention needs to be paid to the frequency of harvesting to maximize forest carbon sequestration services. These results may be due to the effects of past forest management activities in the study area, such as overharvesting or the natural growth cycle not yet reaching the harvestable stage. In addition, due to the adjustment and change of the dynamic age structure of the plantation, both type S and type M lacked forest resources with the minimum cutting age at the initial stage, so the cutting activities began only in the second stage. However, after the ninth stage, the age structure of this type had been adjusted to a positive distribution state and stabilized in a certain range in the later stage of the planning period. These results contribute to the sustainability of forest biodiversity, ecosystem services and resource production, and their stability is critical to the long-term maintenance of forest prisons and productivity.
Then, considering the influence of social preference, the results showed that compared with the control group, the optimal scenario had a great increase in both ESC and CS due to higher cutting intensity in a short period of time, but from the 6th period, the ESC and CS of all the optimized scenarios were lower than that of the control scenario. The ESC of the 35th year scenario EE began to be higher than that of the other optimized scenarios, at about 8.8*104m3, while the CS was better than that of the other optimized scenarios from the 25th year, at 4.9*104t. In addition, with the growth of , the cutting intensity is also increasing, which leads to the reduction of ESC and the reduction of CS. The above results may be due to the rapid release of forest resources and the promotion of forest regeneration and growth in the early scientific logging activities, while the optimization scheme takes into account short-term resource release and long-term forest health and carbon storage capacity. The results of total wood production and total NPV benefit under different scenarios show that scenario EE achieves maximum carbon sequestration service, and is 362,000 USD higher than the other scenarios, but its total wood production and total NPV benefit are lower than the other scenarios. On the whole, scenario EE has the best ESC optimization effect, with an average ESC of 231.35m3/ha. The average ESC of the other optimization scenarios is 201.27m3/ha, and the ESC distribution is similar. In each optimization scenario, CS in most regions is significantly improved. The above results are due to the fact that the optimization scheme is conducive to the growth of forest biomass and stock, and the increase of forest carbon storage through forest regeneration and vegetation restoration. Previous research results have shown that designing four alternative forest management strategies, namely Non Intervention Management (NIM), Classic Timber Management (CTM), Multi functional Management (MPM), and Space Constrained Management (SCM), and quantitatively evaluating and optimizing them with different management objectives and regulations, can lead to the economic inefficiency of MPM and SCM implementation, a reduction in the joint welfare of forests and bargaining, and a corresponding decrease in China’s current trading market. And when ecological and spatial constraints are incorporated into CTM, it is very meaningful for restoring forest resources in Northeast China. During the 50 year simulation period, an additional 136,000 tons and 162,000 tons of carbon were sequestered, respectively (Huang et al., 2019). This is consistent with the research findings that increasing ecological preferences leads to a decrease in economic benefits, but it also promotes the growth of forest carbon storage.
Finally, considering the impact of market price, the results show that when carbon price is LP, the impact of wood price on forest resources is small. When the carbon price is MPR, the annual output of scenario B is lower than that of scenario E and scenario H, but the difference of ESC in the previous three scenarios is small, and after the 10th period, the ESC and CS in scenario B are continuously higher than those in the other two scenarios. When the carbon price is HPP, the wood yield of scenario C is 7100m3 lower than that of scenario F and scenario I. At the end of the planning period, the ESC and CS changes in scenario F and scenario I converge. When the wood price is at LP, the carbon price will have A certain range of influence on dynamic forest resources. The annual output of scenario A in the initial stage and the intermediate stage is higher than that of scenario B and scenario C, but the ESC and CS corresponding to this scenario are the lowest, and the ESC and CS corresponding to scenario C are the highest. When the price of wood is at MPR, the annual production of scenario D, scenario E and scenario F decreases with the increase of carbon price, but ESC and CS do not change significantly. When the price of wood is at HPP, the carbon price is inversely proportional to the output of wood, and the ESC and CS of scenario I are the highest, and the difference between scenario G and scenario H will continue to shrink in the end. In the market price, the price of wood and carbon has little influence on the optimization of forest management spatial allocation scheme, and the change of carbon price is more volatile. On the whole, when the gap between production and nitrogen fixation is very small, the price is proportional to the economic benefit. Previous studies have shown that by using the SSA algorithm to determine the optimal forest management strategy, the optimization results of timber supply indicate that the target yield can be achieved more effectively and sustainably over a longer planning period. For carbon sequestration services, there will be adverse changes from carbon sinks to carbon sources over a longer planning period. Considering the combination of integrated forest management scenarios with the above two objectives, when based on the assumption of no carbon leakage (i.e., synergistic effect), the total carbon sequestration services composed of growing and harvesting populations are positively correlated with the wood supply services within the long-term planning scope (Li et al., 2019). This is consistent with the study on changes in wood supply and carbon sequestration.
Based on the above results analysis, the following management opinions can be proposed for forest management personnel. One approach is to manage areas with high carbon sequestration potential by reducing the frequency of selective and clear logging. The second is to use scientific methods to adjust the age structure of forests, by increasing the ratio of mature forests to overripe forests, in order to improve the carbon storage capacity of forests. The third is to establish a long-term monitoring and evaluation mechanism, regularly checking the changes in forest resources and the effectiveness of forest management measures to ensure the sustainable management of forest resources. The fourth is to establish an ecological compensation mechanism for the value of forest carbon pools, in order to achieve precise compensation for forest carbon sinks, vigorously promote multifunctional forest management, and fully focus on the construction of national forest management pilot demonstrations.
In summary, the research method takes the accurate improvement of forest quality as the main direction, comprehensively strengthens the sustainable management of forests, ensures the double growth of forest area and stock, and plays an important role in optimizing and adjusting the stand structure, continuously improving the forest environment, scientifically restoring degraded stands, and comprehensively protecting biodiversity.
The advantage of research lies in analyzing from multiple dimensions, providing a more comprehensive perspective for forest resource management, and optimizing forest resource planning models through intelligent algorithms to achieve a balance between ecological service functions and economic benefits. However, there are still shortcomings in research, as differences in logging methods can have long-term adverse effects on forest stand productivity and soil fertility. For instance, the quality and generation capability of forest stands are directly impacted by the logging techniques used in the forest. In general, stand production and logging intensity are positively correlated. Consequently, the productivity of forest ecosystems might be significantly reduced as a result of excessive logging. Furthermore, logging practices can have a big effect on how many and how active soil microorganisms really are. Microbial biomass frequently rises following the completion of activities and proper logging techniques. But over a certain point, damage to the soil structure would result in a steady decline in the quantity and activity of soil microorganisms, which will eventually have an impact on forest carbon sinks. However, this response cannot be quantified at present, and in future research, advanced technology can be used to quantify the above response process.
5 Conclusion
Currently, the ecological environment in China is seriously threatened by desertification, soil erosion, and other factors. Forests, as an important carbon sink, can alleviate climate crises and maintain ecological balance. To maximize the benefits and resources of forest CFS, a forest resource planning model was studied and constructed. GIS and SAA were combined to analyze the impact and spatial distribution changes of different constraint conditions on forest management SAS optimization. The experimental results show that scenario AA corresponds to the largest selective cutting area, with an average of 23% at different time periods, but the average clear cutting area is 10%. In the scenario EE with the highest carbon storage, the average proportion of selective and clear logging areas decreased by 72 and 48%, respectively. Then, considering social preferences, the results showed that in the initial stage of the planning period, there was a severe shortage of forest resources in the study area that could be harvested. The harvesting intensity of all optimized scenarios varied greatly, but from the 35th year onwards, the ESC of scenario EE was higher than other optimized scenarios, about 8.8 * 104 m3, while CS was better than other optimized scenarios from the 25th year onwards, at 4.9 * 104 t. The final consideration of market prices shows that the prices of wood and carbon have a relatively small impact on the optimization of forest management spatial allocation plans, with carbon prices fluctuating more significantly. In summary, the research work provides solid and powerful data support for maximizing the benefits of forest carbon sequestration services and rational utilization of resources, and is conducive to promoting the construction of world ecological civilization and sustainable development. However, there are still shortcomings in research, as differences in logging methods can have long-term adverse effects on forest stand productivity and soil fertility. For instance, the quality and generation capability of forest stands are directly impacted by the logging techniques used in the forest. In general, stand production and logging intensity are positively correlated. Consequently, the productivity of forest ecosystems might be significantly reduced as a result of excessive logging. Microbial biomass frequently rises following the completion of activities and proper logging techniques. But over a certain point, damage to the soil structure would result in a steady decline in the quantity and activity of soil microorganisms, which will eventually have an impact on forest carbon sinks. However, this response cannot be quantified at present, and in future research, advanced technology can be used to quantify the above response process.
Data availability statement
The original contributions presented in the study are included in the article/supplementary material, further inquiries can be directed to the corresponding author.
Author contributions
GE: Investigation, Supervision, Writing – review & editing. JH: Investigation, Writing – original draft.
Funding
The author(s) declare financial support was received for the research, authorship, and/or publication of this article. This work was sponsored in part by Henan Province Philosophy and Social Science Planning Project (2023BJJ039).
Conflict of interest
The authors declare that the research was conducted in the absence of any commercial or financial relationships that could be construed as a potential conflict of interest.
Publisher’s note
All claims expressed in this article are solely those of the authors and do not necessarily represent those of their affiliated organizations, or those of the publisher, the editors and the reviewers. Any product that may be evaluated in this article, or claim that may be made by its manufacturer, is not guaranteed or endorsed by the publisher.
References
Alexander Ruiz-Blandon, B., Salcedo-Perez, E., Rodriguez-Macias, R., Hernandez-Alvarez, E., Campo, J., and Merino, A. (2022). Growth, biomass, carbon and nutrient pools in Gmelina arborea established in pure and mixed forest stand production systems in Mexico. New For. 53, 735–757. doi: 10.1007/s11056-021-09878-7
Bognounou, F., Venier, L., Wilgenburg, S. V., Aubin, I., and Grandpre, L. D. (2021). Early avian functional assemblages after fire, clearcutting, and post-fire salvage logging in north American forests. Can. J. For. Res. 51, 393–407. doi: 10.1139/cjfr-2020-0145
Bousfield, C. G., Massam, M. R., Peres, C. A., and Edwards, D. P. (2023). Large-scale impacts of selective logging on canopy tree beta-diversity in the Brazilian Amazon. J. Appl. Ecol. 60, 1181–1193. doi: 10.1111/1365-2664.14403
Chen, H., Zhang, Q., Wang, X., Zhang, J., Ismail, A. M., and Zhang, Z. (2021). Nitrogen form-mediated ethylene signal regulates root-to-shoot K+ translocation via NRT1.5. Plant Cell Environ. 44, 3576–3588. doi: 10.1111/pce.14182
Chukwuka, A. F., Alo, A., and Aigbokhan, O. J. (2021). Remote sensing and GIS forest landscape assessment for sustainable forest management. JAFSS 17, 12–26. doi: 10.4314/joafss.v17i1.2
Gazman, V. D. (2023). A new criterion for the ESG model. Green Low Carbon Econ. 1, 22–27. doi: 10.47852/bonviewGLCE3202511
Gea-Izquierdo, G., and Sanchez-Gonzalez, M. (2022). Forest disturbances and climate constrain carbon allocation dynamics in trees. Glob. Chang. Biol. 28, 4342–4358. doi: 10.1111/gcb.16172
Hanbury-Brown, A. R., Ward, R. E., and Kueppers, L. M. (2022). Forest regeneration within earth system models: current process representations and ways forward. New Phytol. 235, 20–40. doi: 10.1111/nph.18131
Huang, Y., Qin, H., and Guan, Y. (2019). Assessing the impacts of four alternative management strategies on forest timber and carbon values in Northeast China. Cand. J. Forest Res. 34, 289–299. doi: 10.1080/02827581.2019.1578894
Jan, S., Dolej, M., and Kristna, R. (2021). Mixed-method approach incorporating geographic information system (GIS) tools for optimizing collection costs and convenience of the biowaste separate collection. Waste Manag. 134, 177–186. doi: 10.1016/j.wasman.2021.07.018
Ju, T., Liu, B., Yue, G., Du, H., Li, Q., Wang, X., et al. (2023). Estimation of forest above-ground biomass in Guangxi, China, by integrating forest age and stack learning. Land Degrad. Dev. 34, 4079–4093. doi: 10.1002/ldr.4740
Kanga, S., Rather, M. A., Farooq, M., and Singh, S. K. (2021). GIS based Forest fire vulnerability assessment and its validation using field and MODIS data: a case study of Bhaderwah Forest division, Jammu and Kashmir (India). Indian Forester 147, 120–136. doi: 10.36808/if/2021/v147i2/153779
Kse, M., Kirca, S., Gürbey, A. P., Saglam, S., and Gümüs, C. (2021). A model for URBAN forest management planning: Istanbul CASE study. Environ. Eng. Manag. J. 20, 1173–1182. doi: 10.30638/eemj.2021.109
Li, H., Liu, G., Liu, Y., Zhu, Y., and Yang, X. (2019). Optimal strategies for integrated forest management in megacities combined with wood and carbon services. J. Clean. Prod. 229, 431–439. doi: 10.1016/j.jclepro.2019.04.209
Liu, X., Han, Y., and Chen, J. (2021). Discrete pigeon-inspired optimization-simulated annealing algorithm and optimal reciprocal collision avoidance scheme for fixed-wing UAV formation assembly. Unmanned Syst. 9, 211–225. doi: 10.1142/S230138502141003X
Liu, H., Wu, X., Yu, P., Xu, C., Allen, C. D., Hartmann, H., et al. (2022). Nature-based framework for sustainable afforestation in global drylands under changing climate. Glob. Chang. Biol. 28, 2202–2220. doi: 10.1111/gcb.16059
Maltamo, M., Packalen, P., and Kangas, A. (2021). From comprehensive field inventories to remotely sensed wall-to-wall stand attribute data — a brief history of management inventories in the Nordic countries. Can. J. For. Res. 51, 257–266. doi: 10.1139/cjfr-2020-0322
Moor, H., Eggers, J., Fabritius, H., Forsell, N., Henckel, L., Bradter, U., et al. (2022). Rebuilding green infrastructure in boreal production forest given future global wood demand. J. Appl. Ecol. 59, 1659–1669. doi: 10.1111/1365-2664.14175
Papineni, S. L. V., Reddy, A. M., Yarlagadda, S., Yarlagadda, S., and Akkinen, H. (2021). An extensive analytical approach on human resources using random Forest algorithm. IJETT 69, 119–127. doi: 10.14445/22315381/IJETT-V69I5P217
Reichert, J. M., Gubiani, P. I., Santos, D. R. D., Reinert, D. J., Aita, C., and Giacomini, S. J. (2022). Soil properties characterization for land-use planning and soil management in watersheds under family farming. Int. Soil. Water Conse. 10, 119–128. doi: 10.1016/j.iswcr.2021.05.003
Salam, M. A., Tazneen, F., and Chowdhury, A. (2021). Geomorphological study of Jaflong area near Dauki fault using remote sensing and geographic information system. JESNR 12, 151–155. doi: 10.3329/jesnr.v12i1-2.52011
Sashikala, G., Naidu, M. V. S., and Raman, K. V. (2021). Mapping of nutrients status in Tatrakallu Village of Anantapurami District of Andhra Pradesh using geographic information system. JISSS 69, 133–141. doi: 10.5958/0974-0228.2021.00031.1
Si, L., Shu, L., Wang, M., Zhao, F., Chen, F., Li, W., et al. (2022). Study on forest fire danger prediction in plateau mountainous forest area. Nat. Hazards Res. 2, 25–32. doi: 10.1016/j.nhres.2022.01.002
Singh, G., Singh, B., and Mishra, D. (2022). Diversity and carbon storage in Calligonum polygonoides associated shrub ecosystem of Indian Desert. Indian Forester 148, 680–690. doi: 10.36808/if/2022/v148i7/157244
Spiecker, H., and Peter Kahle, H. (2023). Climate-driven tree growth and mortality in the Black Forest, Germany—long-term observations. Glob. Chang. Biol. 29, 5908–5923. doi: 10.1111/gcb.16897
Tao, L. I., Gong, Y. B., Jian-Zhai, G. E., Zeng-Xiang, Q. I., and Xie, S. B. (2021). Construction of urban landscape ecological security pattern based on circuit theory: a case study of Hengyang City, Hunan Province, China. Chin. J. Appl. Ecol. 32, 2555–2564. doi: 10.13287/j.1001-9332.202107.020
Usman, A. M., and Abdullah, M. K. (2023). An assessment of building energy consumption characteristics using analytical energy and carbon footprint assessment model. Green Low Carbon Econ. 1, 28–40. doi: 10.47852/bonviewGLCE3202545
Wang, Y., Li, Y., Zhang, D., and Xie, Y. (2021). Aerodynamic optimization of a SCO2radial-inflow turbine based on an improved simulated annealing algorithm. Proc. IMech E Part A 235, 1039–1052. doi: 10.1177/0957650920976666
Wang, X., Otto, M., and Scherer, D. (2021). Atmospheric triggering conditions and climatic disposition of landslides in Kyrgyzstan and Tajikistan at the beginning of the 21st century. Nat. Hazard Earth Sys. 21, 2125–2144. doi: 10.5194/nhess-21-2125-2021
Witing, F., Forio, M. A. E., Burdon, F. J., Mckie, B., Goethals, P., Strauch, M., et al. (2022). Riparian reforestation on the landscape scale: navigating trade-offs among agricultural production, ecosystem functioning and biodiversity. J Appl. Ecol. 59, 1456–1471. doi: 10.1111/1365-2664.14176
Wu, Z., Zhao, Y., and Zhang, N. (2023). A literature survey of green and low-carbon economics using natural experiment approaches in top field journal. Green Low Carbon Econ. 1, 2–14. doi: 10.47852/bonviewGLCE3202827
Xia, D., Li, B., Zhang, J., Zhang, B., and Zhang, N. (2021). Ecological cooperative adaptive cruise control of over-actuated electric vehicles with in-wheel motor in traffic flow. IET Intell. Transp. Syst. 15, 765–780. doi: 10.1049/itr2.12059
Xu, Z., Ma, X., Shi, Y., Moradian, J. M., Wang, Y., Sun, G., et al. (2022). Surface activated natural wood biomass electrode for efficient microbial electrocatalysis: performance and mechanism. Int. J. Energ. Res. 46, 8480–8490. doi: 10.1002/er.7705
Xuan, H., Zheng, Q., Li, B., and Wang, X. (2021). A novel genetic simulated annealing algorithm for no-wait hybrid Flowshop problem with unrelated parallel machines. ISIJ Int. 61, 258–268. doi: 10.2355/isijinternational.ISIJINT-2020-258
Yang, D., Lu, T., Guo, W., and Wang, X. (2021). MIT image reconstruction method based on simulated annealing particle swarm algorithm. J. Northeastern Univ. 42, 531–537. doi: 10.12068/j.issn.1005-3026.2021.04.011
Zhang, Z., Luo, L., and Yin, Y. (2021). Simulated annealing and genetic algorithm based method for a bi-level seru loading problem with worker assignment in seru production systems. J. Ind. Manag. Optim. 17, 779–803. doi: 10.3934/jimo.2019134
Zhu, X., Xiao, F., Wang, Y., and Wang, Y. (2021). Optimal edge gateway deployment in internet of things based on simulated annealing with adaptive external penalty. IET Commun. 15, 2111–2124. doi: 10.1049/cmu2.12244
Zolfaghari, A., Izadi, M., and Razavi, H. (2021). Optimum design of natural gas trunk line using simulated annealing algorithm. Int. J. Oil Gas Coal. 26, 281–301. doi: 10.1504/IJOGCT.2021.113135
Keywords: carbon fixation services, GIS, forest management, space configuration, simulated annealing algorithm, carbon storage, artificial forest
Citation: Guo E and He J (2025) Optimizing spatial allocation schemes with a focus on carbon fixation services by the integration of GIS and a robust algorithmic approach. Front. For. Glob. Change. 8:1470065. doi: 10.3389/ffgc.2025.1470065
Edited by:
Samuel Evans, California Department of Forestry and Fire Protection, United StatesReviewed by:
Sumit Chakravarty, Uttar Banga Krishi Viswavidyalaya, IndiaLingbo Dong, Northeast Forestry University, China
Copyright © 2025 Guo and He. This is an open-access article distributed under the terms of the Creative Commons Attribution License (CC BY). The use, distribution or reproduction in other forums is permitted, provided the original author(s) and the copyright owner(s) are credited and that the original publication in this journal is cited, in accordance with accepted academic practice. No use, distribution or reproduction is permitted which does not comply with these terms.
*Correspondence: Eryan Guo, Z3VveWFuQGhlbmF1LmVkdS5jbg==