 Xiaoxiong Li
 Dongsheng Yang2*
 Jingjie Wang
94% of researchers rate our articles as excellent or good
Learn more about the work of our research integrity team to safeguard the quality of each article we publish.
Find out more
ORIGINAL RESEARCH article
Front. For. Glob. Change, 26 February 2025
Sec. Forest Management
Volume 8 - 2025 | https://doi.org/10.3389/ffgc.2025.1465416
As a keystone species maintaining alpine ecosystem stability, Tibetan juniper (Sabina tibetica) is endemic to the Qinghai-Tibetan Plateau, thriving at 2,800–4,600 m elevations. We employed the MaxEnt model with 10 bioclimatic and topographic variables to predict its distribution shifts under RCP4.5 and RCP8.5 scenarios for 2050 and 2070. Model performance was validated through five-fold spatial cross-validation (AUC = 0.932), utilizing 99 occurrence records from field surveys and biodiversity databases. Minimum winter temperature (35.1% contribution) and warmest quarter precipitation (18.9%) emerged as dominant drivers. The current suitable habitat (4.69 × 10⁴ km2) is projected to decrease to 3.82 × 10⁴ km2 (18.6% reduction) under RCP4.5-2050 and 2.78 × 10⁴ km2 (40.7% reduction) by 2070. Under high-emission scenarios, suitable areas will contract to 3.83×10⁴ km² (RCP8.5-2050) and 3.86 × 10⁴ km2 (RCP8.5-2070), showing 18.3% and 17.7% reductions respectively. Range contractions concentrate in western Sichuan and southeastern Tibet, with RCP4.5-2070 exhibiting the most severe habitat loss. with range contractions concentrated in western Sichuan and southeastern Tibet. Priority conservation areas were identified in the Yarlung Zangbo Valley and Hengduan Mountains. This study provides quantitative assessment of Sabina tibetica’s climate vulnerability, offering critical insights for adaptive management of high-altitude ecosystems under global change.
The spatial distribution of vegetation is greatly affected by climate warming (Dirnböck et al., 2011). Studies of the future change in geographic distribution of vegetation have received much attention worldwide (Harrison and Noss, 2017). Such studies are, however, poorly conducted on the Qinghai-Tibet Plateau (QTP). The total extent covers of the Qinghai-Tibet Plateau approximately 2.5 million square kilometers, with an average altitude of 4,000 meters above sea level (Wang et al., 2016). The difficulties are mainly due to paucity of systematic data of vegetation distribution and complexity of topography influencing the growth of vegetation.
Here we conducted a study to predict the future change in geographic distribution of Tibetan juniper on the QTP. Sabina tibetica is the only woody plant occurring over large areas of high-altitude Tibet, it often grows on south-facing slopes in mountainous areas, even if the Tibetan juniper exhibits a sluggish growth rate under the severe climatic circumstances prevalent in that region, but it also providing important ecological services to human communities on Tibet (Wang et al., 2021). The study by Li et al. (2020) examined tree-ring chronologies of Tibetan juniper in the Gongga Mountains on the southeastern Tibetan Plateau. Their results showed that growth of Tibetan juniper at high-elevation sites was primarily constrained by minimum winter temperatures (bio06). compared to Abies georgei at lower elevations, potentially due to species-specific traits and altitudinal differences. He et al. (2013) investigated the growth-climate relationships of Juniperus tibetica along an altitudinal gradient on the southern Tibetan Plateau. Their results suggest that local tree growth is primarily driven by common regional climatic signals, with moisture variability during April–June having the highest impact on tree growth, even at the upper tree attitude limit. Tibetan juniper serves various purposes such as construction material, fuel, and incense. Moreover, the foliage of the tree is heavily consumed by domestic goats and other livestock (Farjon, 2005). However, these uses have led to a considerable decrease in the species’ population. Initially categorized as not threatened in 1998, it has now been reclassified as Near Threatened since 2005 (Farjon, 2013). What’s more, the growth of this tree species is sensitive to climate change and the amplitude of climate warming on the QTP is higher than the global average (Zhao et al., 2004; Lu et al., 2019). Study of the distribution change in Tibetan juniper forests in future will help assessing impacts of climate change on forest ecosystem services and planning of biodiversity protection (Birch et al., 2014; Koschke et al., 2012).
We used the maximum entropy model (MaxEnt), which falls under the category of Species Distribution Models, to simulate species niche suitable for the growth of Tibetan juniper. The MaxEnt model has the capability to produce a forest-environment response curve, which illustrates the quantitative correlation between the logistic probability of forest presence and the corresponding environmental factors. By utilizing the MaxEnt model, we have forecasted the suitable distribution areas of Sabina tibetica in the years 2050 and 2070, considering two different greenhouse gas emission scenarios: RCP4.5 and RCP8.5. The MaxEnt model has found extensive application in forecasting the plausible range of occurrence of species across diverse ecological settings, such as terrestrial, freshwater, and oceans at different temporal and spatial scales (Araújo and Luoto, 2007; Elith and Leathwick, 2009; Buckland et al., 2014; Ponce-Reyes et al., 2013; Gelviz-Gelvez et al., 2015). The model uses mathematical statistics and machine learning to quantify the association between species habitates and species distribution (Franklin, 2010; Jetz et al., 2012). MaxEnt’s selection over other machine learning algorithms is justified by its suitability for presence-only data, robust performance with small samples, and high ecological interpretability. Its built-in regularization, computational efficiency, and widespread acceptance in the field further support its use. While alternatives exist, MaxEnt’s balance of predictive power, interpretability, and applicability aligns optimally with this study’s objectives and data constraints (Ma et al., 2023). This optimized approach not only improves the accuracy of our predictions for Tibetan juniper but also offers an effective tool for simulating species distribution across the Qinghai-Tibetan Plateau, potentially aiding in the study and conservation of other high-altitude species in this unique ecosystem.
The primary objective of this study was to predict the potential changes in the geographic distribution of Tibetan juniper on the Qinghai-Tibetan Plateau under future climate warming scenarios. The study aims to model the current geographic distribution of Sabina Tibetic using MaxEnt, identify key environmental factors affecting its habitat suitability, and classify habitat suitability levels. Furthermore, we analyze Tibetan juniper habitat response to two climate warming scenarios (RCP4.5 and RCP8.5) for 2050 and 2070, and predict and quantify changes in its distribution under these future climate scenarios. Through these objectives, we seek to provide insights into the potential impacts of climate change on this endemic species on the Qinghai-Tibetan Plateau. Predict and quantify changes in Tibetan juniper distribution under future climate scenarios. By addressing these objectives, our study aims to provide important insights for assessing climate change impacts on this endemic tree species and inform conservation planning for Tibetan juniper on the Qinghai-Tibetan Plateau.
This study centered on the Qinghai-Tibetan Plateau (QTP), an expansive elevated region in Central and East Asia. This unique geographical feature exerts significant influence on regional and global climate patterns, making it a critical area for ecological research in the context of climate change. The phased uplift of the Tibetan Plateau has been the key driver in the Cenozoic Asian monsoon system’s development. By modifying regional topography and thermal dynamics, it has incrementally shaped unique monsoon circulation and precipitation patterns (Zhisheng et al., 2001). Our research focused on Tibetan juniper, an endemic tree species of particular ecological importance on the QTP. S. tibetica is a slow-growing coniferous tree adapted to the harsh high-altitude environment, typically found at elevations between 2,800 to 4,600 m. It often forms the treeline in many parts of the plateau and plays a crucial role in the region’s ecosystem functioning. In this study, we carefully selected a suite of environmental variables to explore the distribution patterns of Tibetan juniper. These variables encompassed climatic, edaphic, and topographic factors, which are thought to potentially influence plant distributions. Through this comprehensive approach, we aimed to elucidate the complex factors that may shape the distribution of this distinctive species.
The data used in this study included geographic coordinates of Tibetan juniper distribution, the corresponding environmental factors and the future climate warming scenarios. The data of Tibetan juniper distribution was collected from our previous field survey in combination with the data from literatures. Fifty-seven sites were acquired through field surveys conducted as part of the Second National Census of Ancient and Famous Trees in China. For each survey site, we personally collected geographical coordinates using GPS, maintaining an accuracy of less than 10 m. We conducted an extensive literature search using online databases (42 locations), the Scientific Database of China Plant Species,1 and referred to the Global Biodiversity Information Facility (GBIF).2 When records from literatures lacked exact geo-coordinates, we used Google Earth3 to determine the latitude and longitude. Setting spatial resolution as 5 km × 5 km, a total of 99 grid cells with occurrence of Tibetan juniper were documented.
For data of environments, we examined 19 bioclimatic variables, 3 soil factors and altitude information (Table 1). Pliscoff et al. (2014) highlighted the critical influence that the selection of climatic predictor sets has on species distribution models (SDMs). The bioclimatic parameters dataset, comprising the present-day climatic conditions (computed through interpolation of recorded data for the time period spanning 1990–2020), was acquired from World Clim-Global Climate Data’s online repository.4 Soil data containing the World Reference Base (WRB)/FAO classes of three soil variables were obtained from the ISRIC World Soil Information SoilGrids portal.5 Altitude data containing global elevation information were obtained from the NASA Shuttle Radar Topography Mission (SRTM) portal.6 All environmental data had a 30 arc-second spatial resolution (also referred to as 1 km spatial resolution). To avoid the issue of multicollinearity among variables, which could lead to an overfitted model (Graham, 2003), we employed Spearman’s rank correlation coefficient to assess the interdependence of the predictors (rather than Pearson product–moment correlation coefficient) and subsequently excluded the variables that exhibited high correlation (>0.8 were eliminated). In cases of high variable collinearity, variable selection was conducted based on dual criteria (Dormann et al., 2013): primacy was given to ecological relevance, retaining variables with superior biological significance to the target species; secondarily, variables demonstrating stronger correlations with the response variable were preserved to maximize explanatory power.
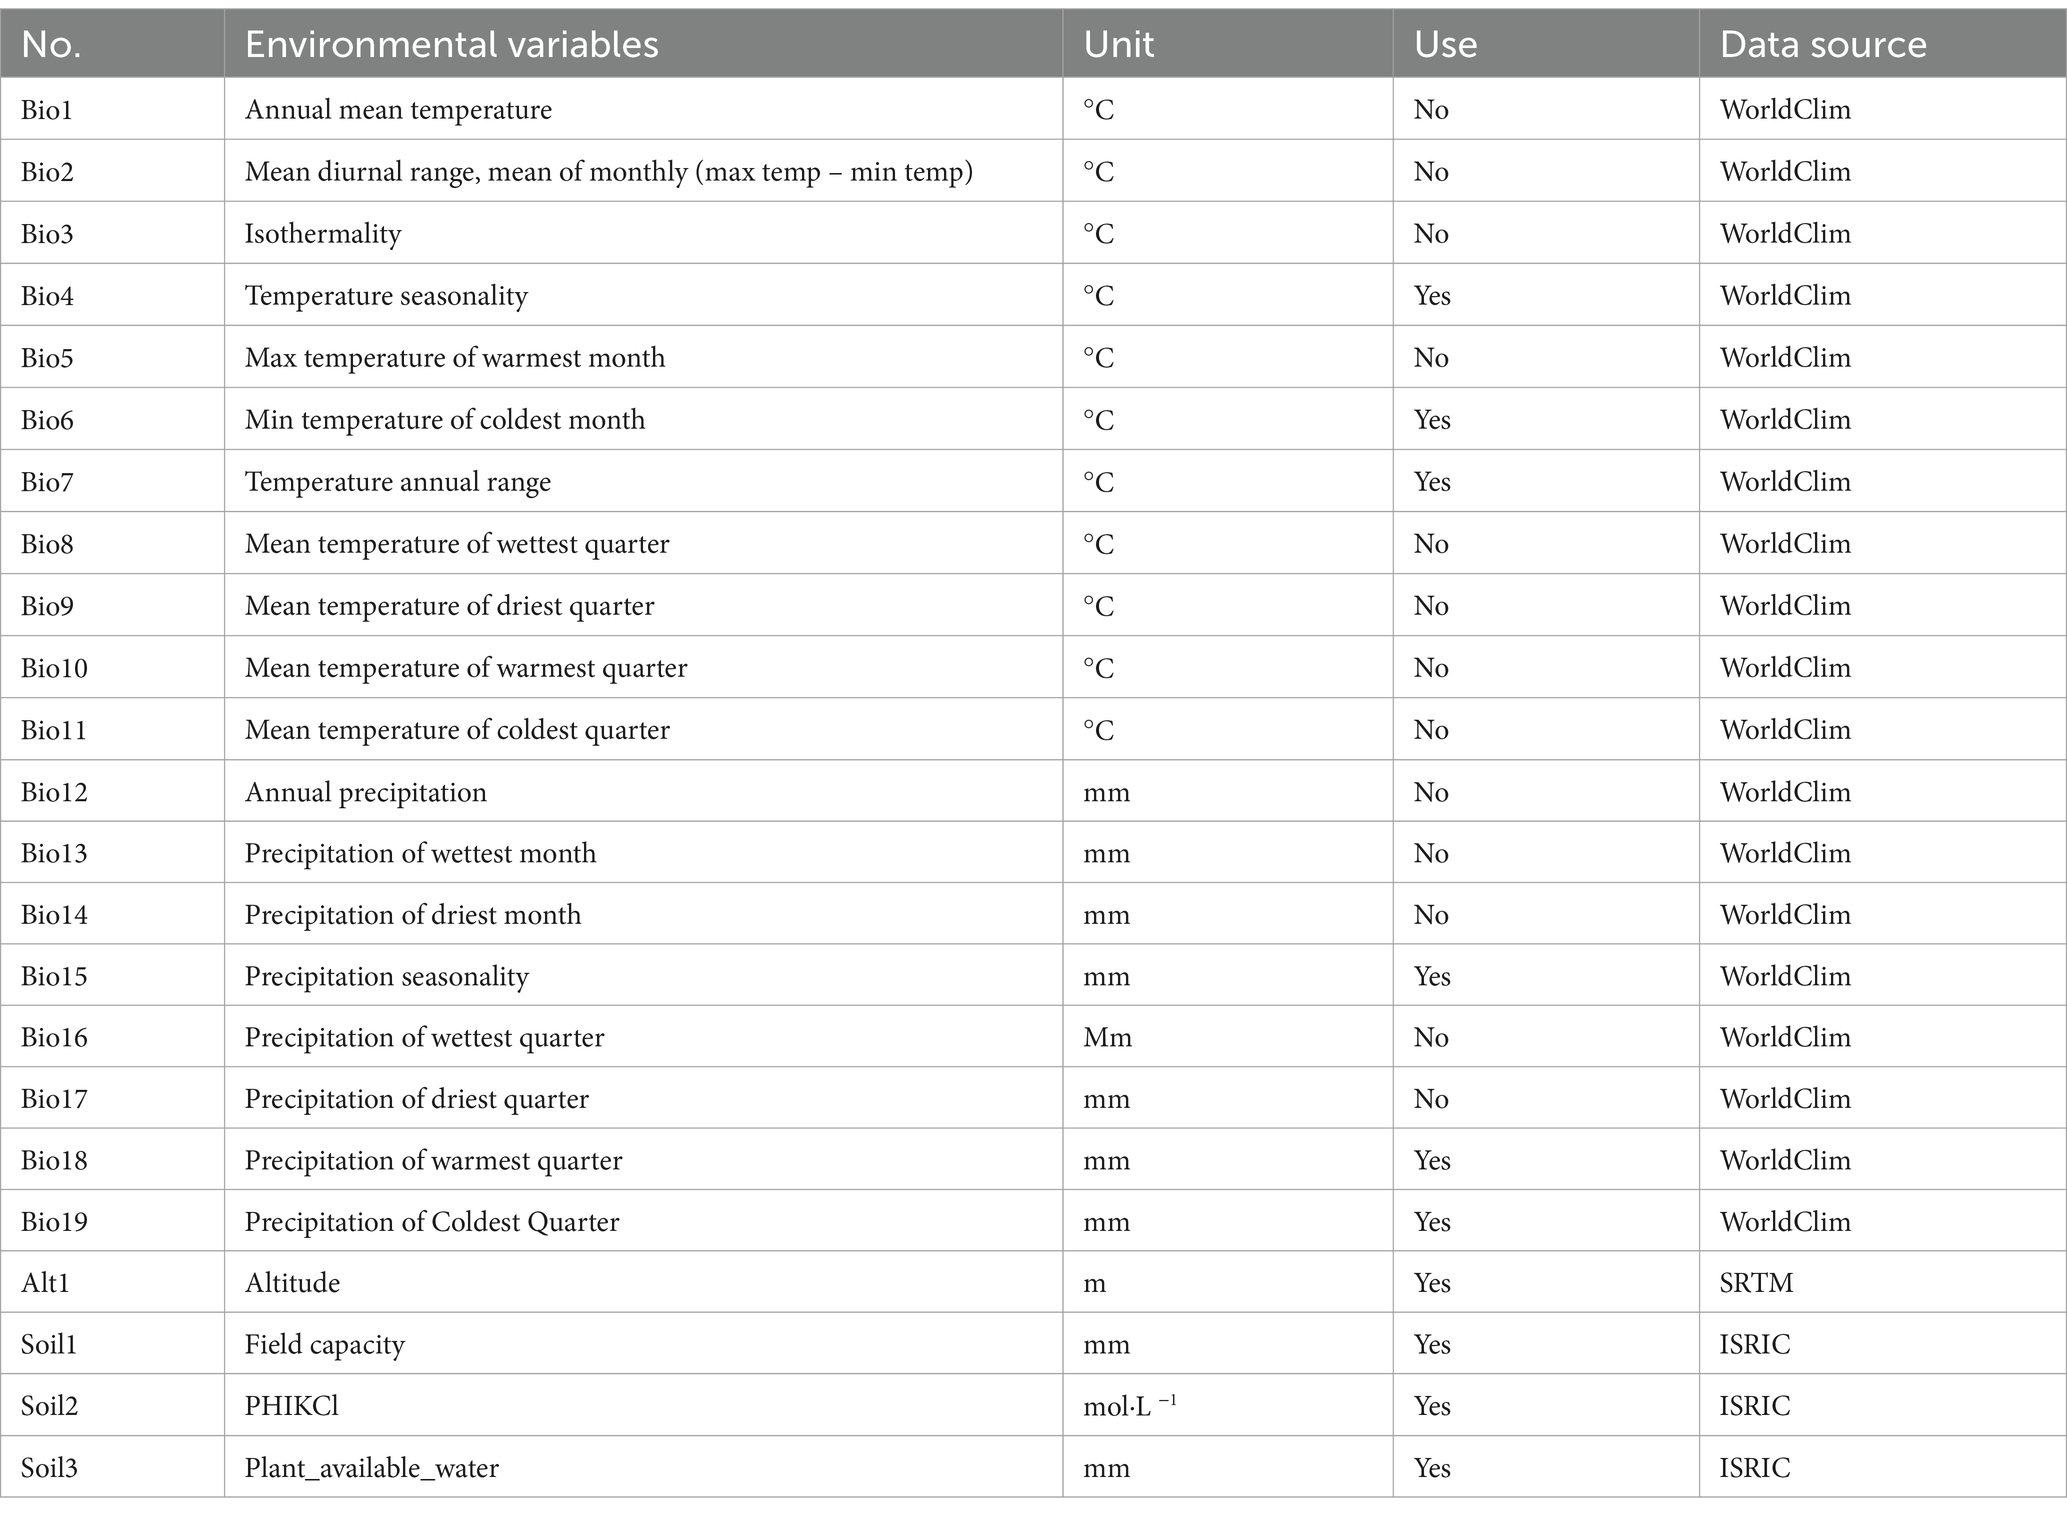
Table 1. All variables of bioclimatic (Bio), soil and altitude selected in generating the MaxEnt models for Tibetan juniper distribution.
Therefore, we obtained 17 biogeographic indicators without collinearity, and entered the next step of model building. The jackknife test was employed to assess the relative importance of each environmental variable. We then applied a leave-one-out cross-validation approach to further validate the selected variables (Bedia et al., 2011). This rigorous process allowed us to identify the most influential predictors while minimizing multicollinearity and reducing model complexity. The final set of 10 variables was determined based on their contribution to model performance and ecological relevance to Tibetan juniper distribution.
Data for future climate (year 2050 and 2070) under four climate warming scenarios (RCP2.5–2050, RCP2.5–2070, RCP4.5–2050, and RCP4.5–2070) were downloaded from global climate model database of the Coupled Model Intercomparison Project 5 (CMIP5) and the World Climate Database.7
We developed Maxent models adhering to the frameworks outlined in Araújo et al. (2019) and Zurell et al. (2020) for species distribution modeling and reporting. The MaxEnt model was based on R language and was obtained from the Biomod2 package (Di Cola et al., 2017) and Enmevel package (Kass et al., 2021). We selected 80% of the data of Tibetan juniper and their associated environmental variables for training the MaxEnt model, and the remaining 20% for validating the model. We employed a five-fold cross-validation to assess species distribution models, addressing spatial autocorrelation issues (Phillips and Dudík, 2008; Zhao et al., 2021; Khalaf et al., 2024). The study area was divided into five contiguous blocks, with model training on four blocks and testing on one, iterated five times. Implemented using ENMeval in R, this approach ensures spatial independence between training and testing data. Model performance was evaluated using AUC metric.
The inherent limitations of MaxEnt’s default parameters in small sample scenarios are often overlooked, despite its reputation as a powerful modeling tool. This oversight may lead to overfitting or oversimplification of models (Morales et al., 2017). In the MaxEnt modeling process, we selected the optimal model by adjusting the regularization multiplier (rm) and environmental feature parameters. The regularization multiplier was set at eight levels: 1, 2, 3, 4, 5. We manually configured six feature combinations: linear (L), linear-quadratic (LQ), hinge (H), linear-quadratic-hinge (LQH). We used Enmeval to calculate AICc values for each parameter combination. The configuration with the lowest AICc was selected as optimal for the final model construction.
The algorithm runs either 1,000 iterations of these processes or continues until convergence (threshold 0.00001). The outputs were transformed into raster format using the ArcMap tool in ArcGIS software for further analysis. The geographical data were obtained from the National Basic Geographic Information System.8 The vector map of Chinese administrative divisions at a scale of 1:4,000,000 was acquired as the fundamental map for conducting the analysis. To prevent overfitting of the training data, we conducted dimensionality reduction on the initial dataset. The significance of key climate factors was assessed using the knife-cut method, which examined the cumulative contribution rate and environmental variable response curve. The model’s accuracy was evaluated by analyzing the area under the receiver operating characteristic (ROC) curve and creating response curves. AUC (Area Under Curve) is defined as the area under the ROC curve and the coordinate axis. The complementary log–log (cloglog) transformation offers a theoretically robust framework for interpreting MaxEnt results (Phillips et al., 2017; Hou et al., 2023), facilitating more accurate assessments of potential species distributions in the landscape. We employed this transformation to derive a habitat suitability index (HSI) from the MaxEnt model outputs. This approach, grounded in point process theory, yields a probabilistic interpretation of species occurrence. The resulting HSI ranges from 0 to 1, where 0 denotes completely unsuitable habitat and 1 indicates optimal conditions. Increasing index values correspond to higher habitat suitability, reflecting a greater likelihood of species presence. The habitat suitability indices derived from the SDM were reclassified into four distinct categories using the Jenks Natural Breaks optimization method in ArcGIS (He et al., 2023; Zhao et al., 2021). This classification technique minimizes within-class variance while maximizing between-class differences, ensuring that the resulting categories are internally homogeneous and externally heterogeneous. The four classes were delineated as follows: unsuitable areas (0–0.2), low suitability areas (0.2–0.4), moderate suitability areas (0.4–0.6), and high suitability areas (0.6–1.0). The validated MaxEnt model was then performed for four future climate scenarios (RCP2.5–2050, RCP2.5–2070, RCP4.5–2050, and RCP4.5–2070) to predict the extent of suitable habitats for Tibetan juniper in the future (Figure 1).
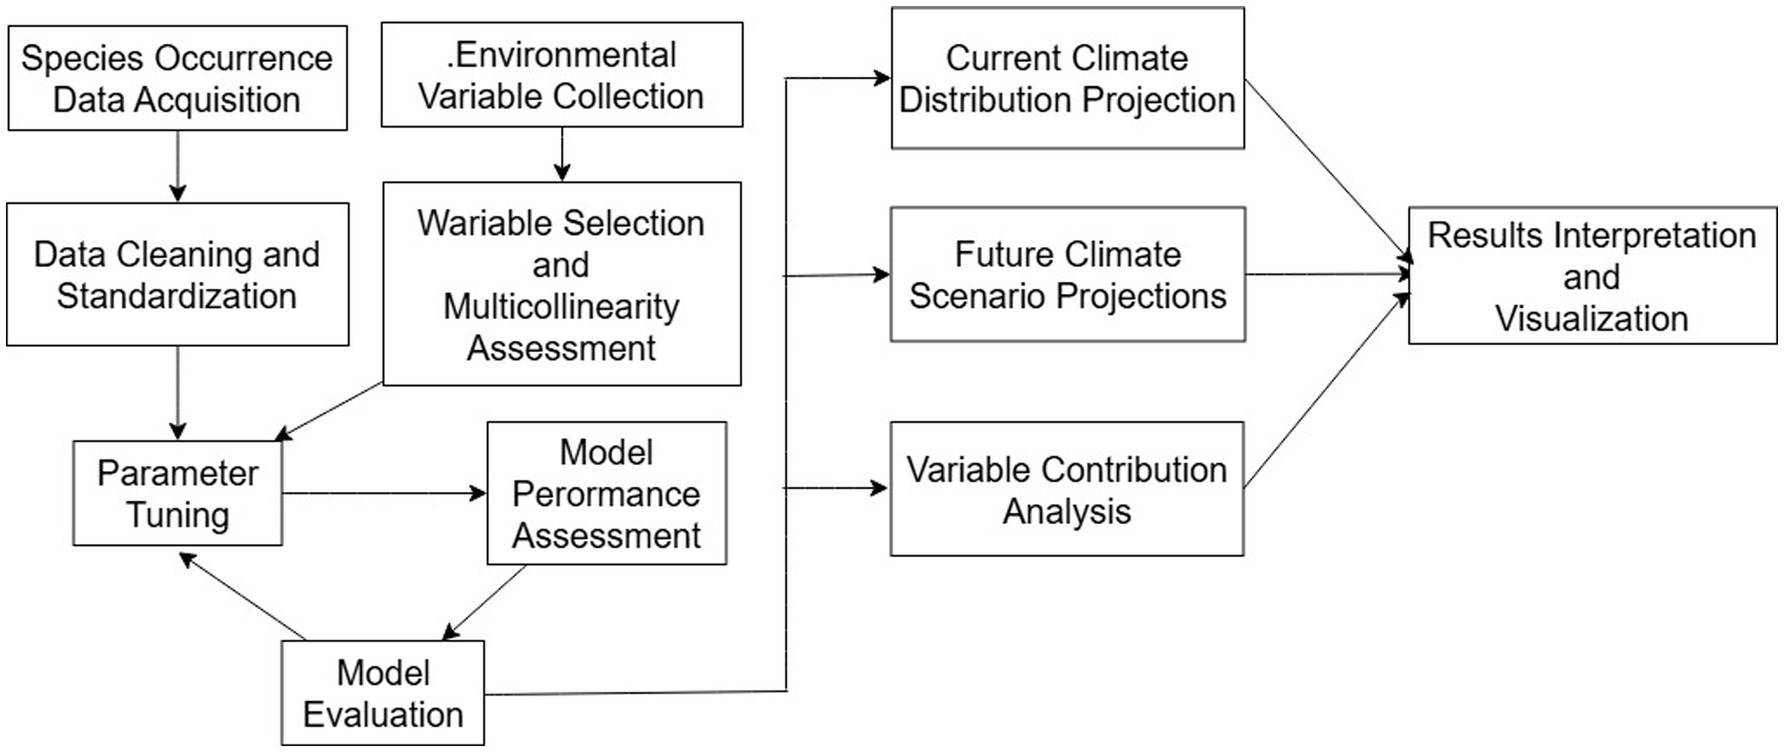
Figure 1. Workflow schematic of species distribution modeling (SDM) process.
We evaluated the performance of various MaxEnt model (Zurell et al., 2020) configurations by systematically assessing different feature class combinations (L: linear, Q: quadratic, H: hinge) and regularization multiplier (rm) values ranging from 1 to 5. This analysis was conducted using the ENMeval package in R (Muscarella et al., 2014). Model selection was based on the corrected Akaike Information Criterion (AICc), which balances model fit and complexity (Warren and Seifert, 2011). Delta AICc values were calculated for each model configuration, with lower values indicating superior performance. Our results (Figure 2) demonstrated that more complex feature combinations (LQH) generally yielded lower Delta AICc values compared to simpler models (L or LQ). The impact of increasing rm. values varied across feature classes, initially improving model fit but potentially leading to overfitting at higher values. The optimal model configuration was determined by the lowest Delta AICc value, ensuring a balance between model fit and parsimony (Phillips and Dudík, 2008; Elith et al., 2011).
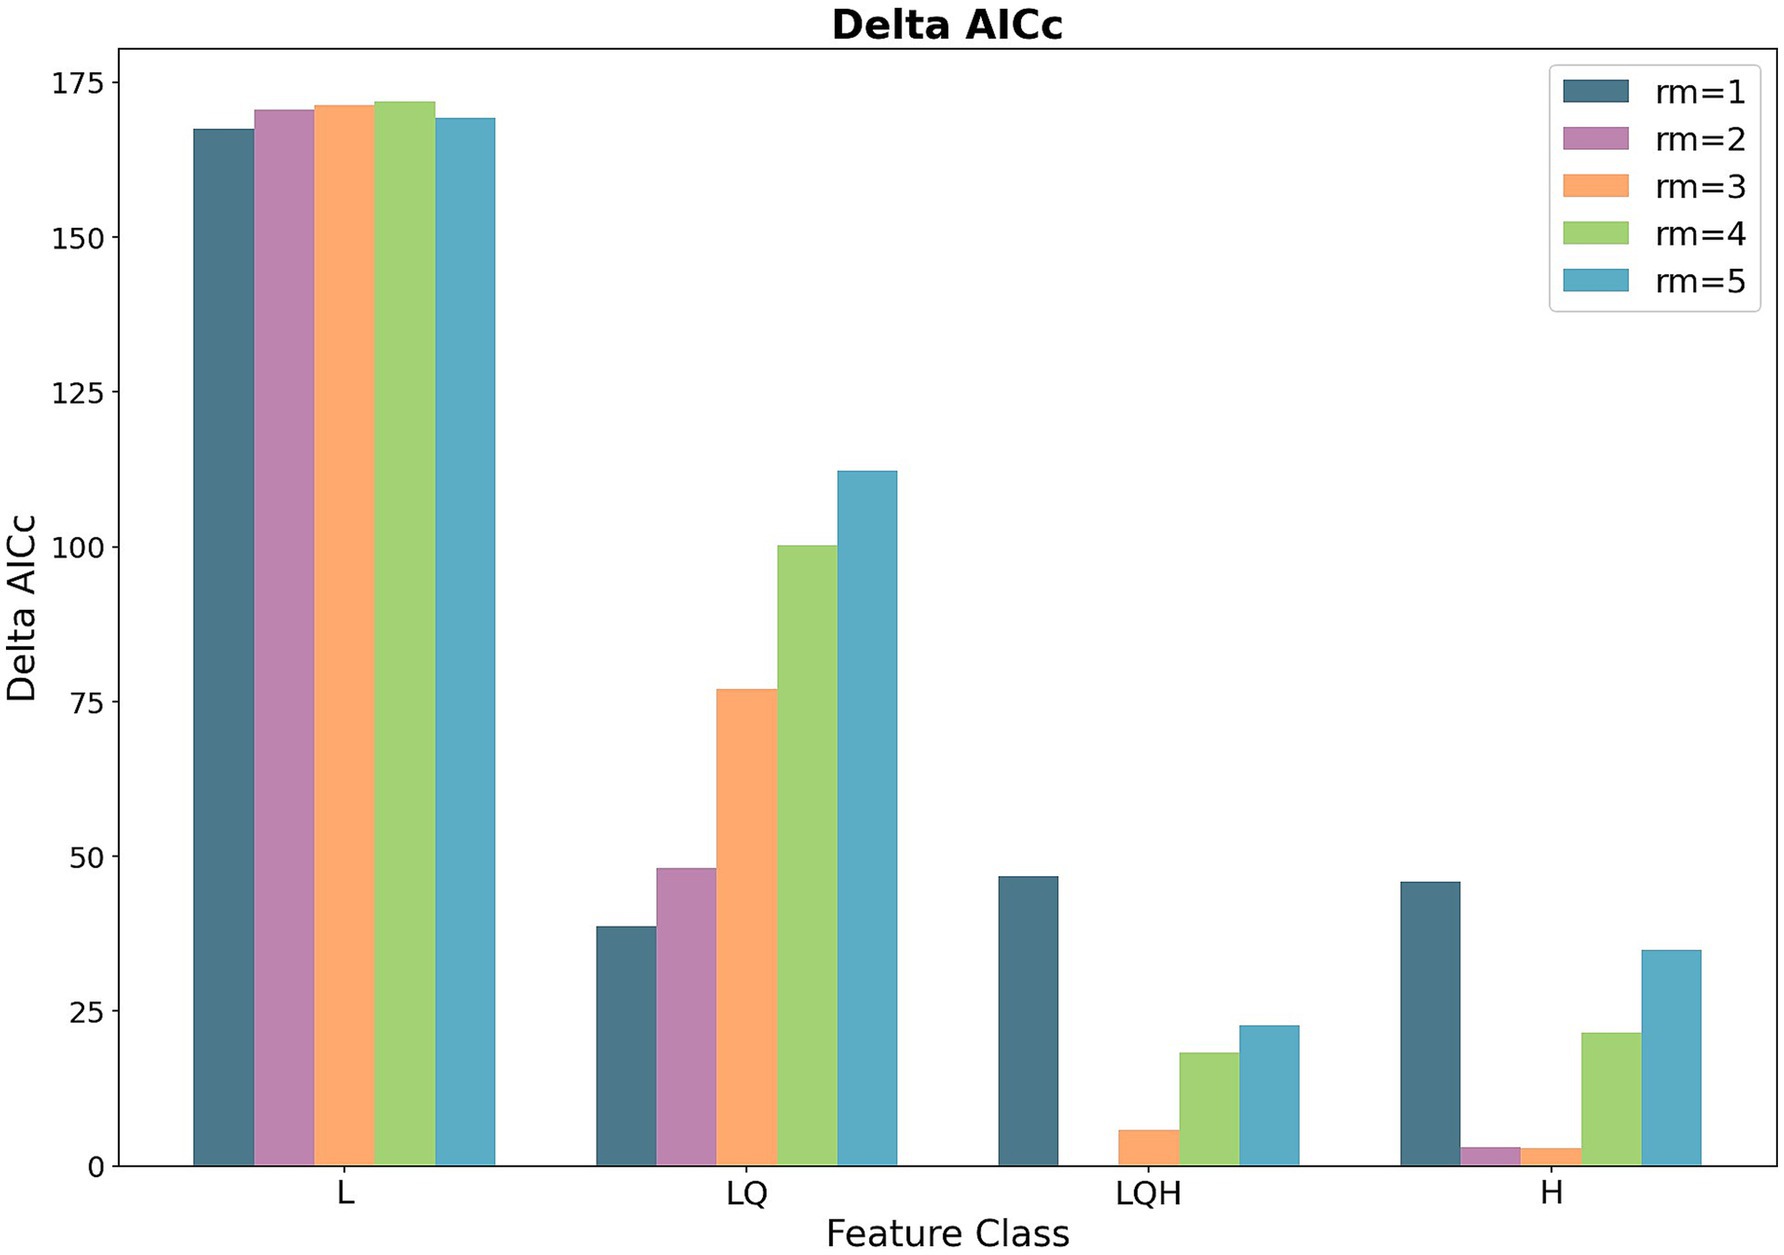
Figure 2. Delta AICc across MaxEnt feature classes and regularization multipliers.
The derived MaxEnt model had a maximum AUC value of 0.932, indicating a high level of accuracy in model performance. The distribution of Tibetan juniper under current climatic conditions, as simulated from the model, had a total area of 4.69 × 10⁴ km2 (Figure 3), indicating that this model can accurately depict the distribution area of Tibetan juniper.
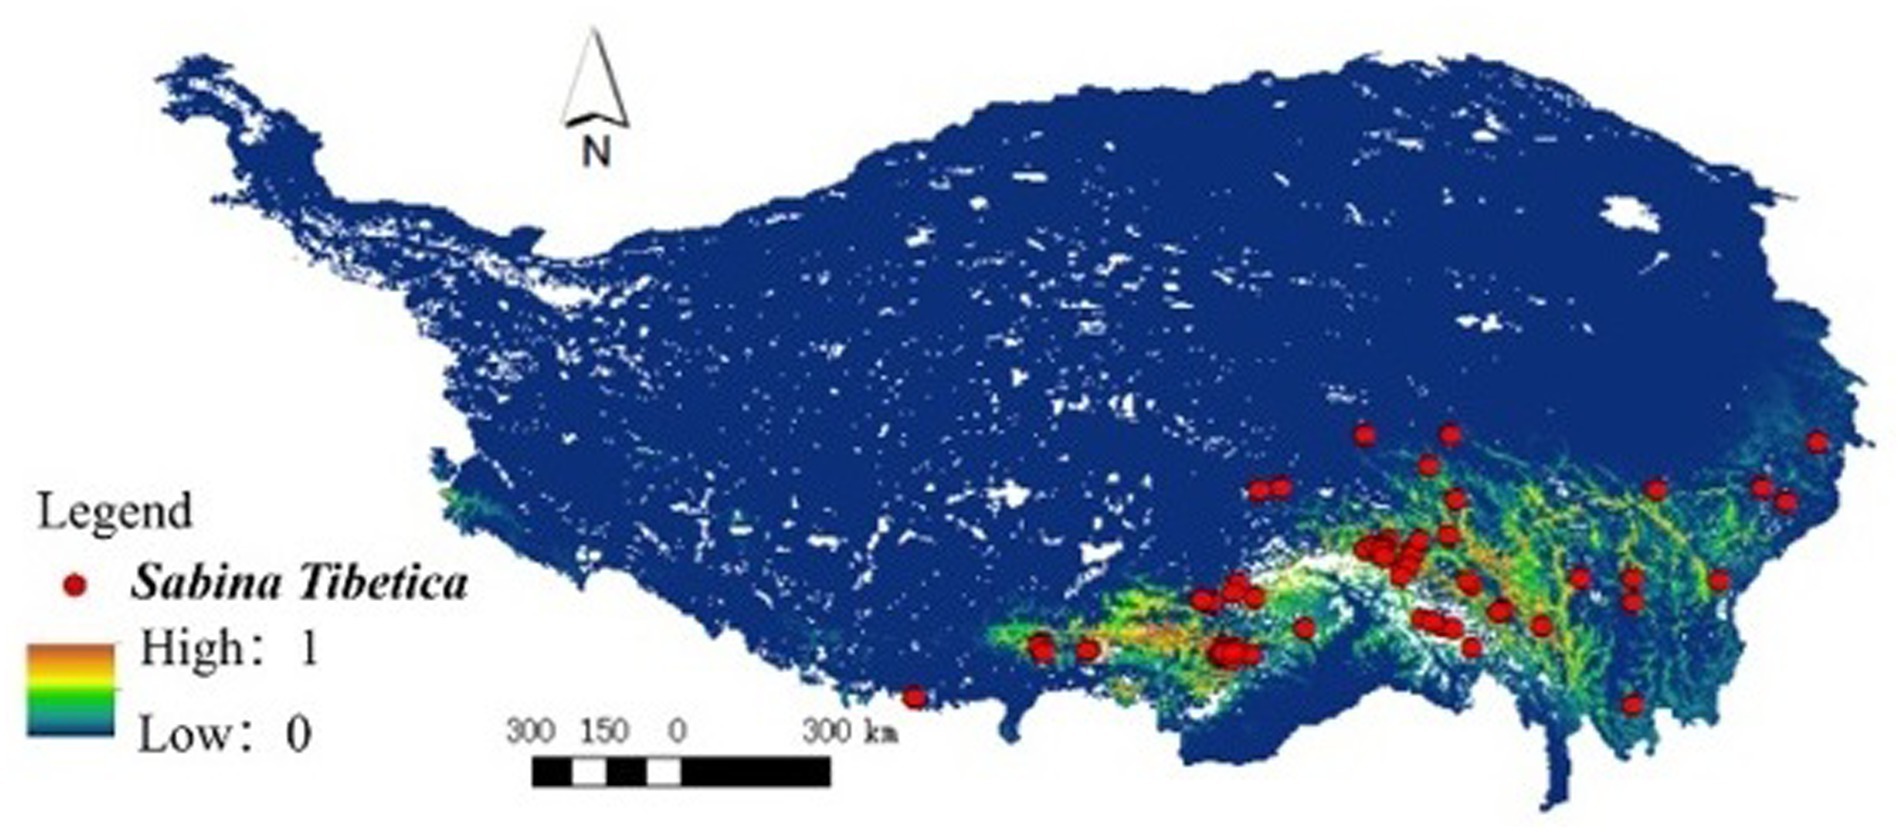
Figure 3. Observed (up) and MaxEnt model derived (down) distribution of Sabina tibetica in Tibetan Plateau. Based on all the data (99 grids) of Sabina tibetica, we compared the actual distribution of sample points (left) with the model after the establishment (right), and both were consistent.
Among the 23 environmental variables used to generate the MaxEnt model, 10 variables eventually entered the model after dimensionality reduction and Jackknife test (Figure 4). Five environmental variables, which had the most significant contributions when used separately, accounted for 86.5% of variance in Tibetan juniper distribution. These five variables were Min Temperature of Coldest Month (accounted for 35.1% of the variance), Temperature Annual Range (accounted for 11.2% of the variance), Temperature Seasonality (accounted for 6.1% of the variance), Altitude (accounted for 11.3% of the variance) and Precipitation of Warmest Quarter (accounted for 18.9% of the variance). The other five variables, namely Temperature Seasonality, Plant available water, Precipitation Seasonality, Precipitation of Coldest Quarter and Field capacity, have less impact on the distribution of Tibetan juniper. At the same time, in order to verify that there is no collinearity between the optimal explanatory variables, we assessed their contribution to the principal axis load through PCA-env analysis and determined the percentage of inertia explained by each axis. The findings revealed that these 10 environmental variables exhibited a relatively weak correlation with each other (Figure 5).
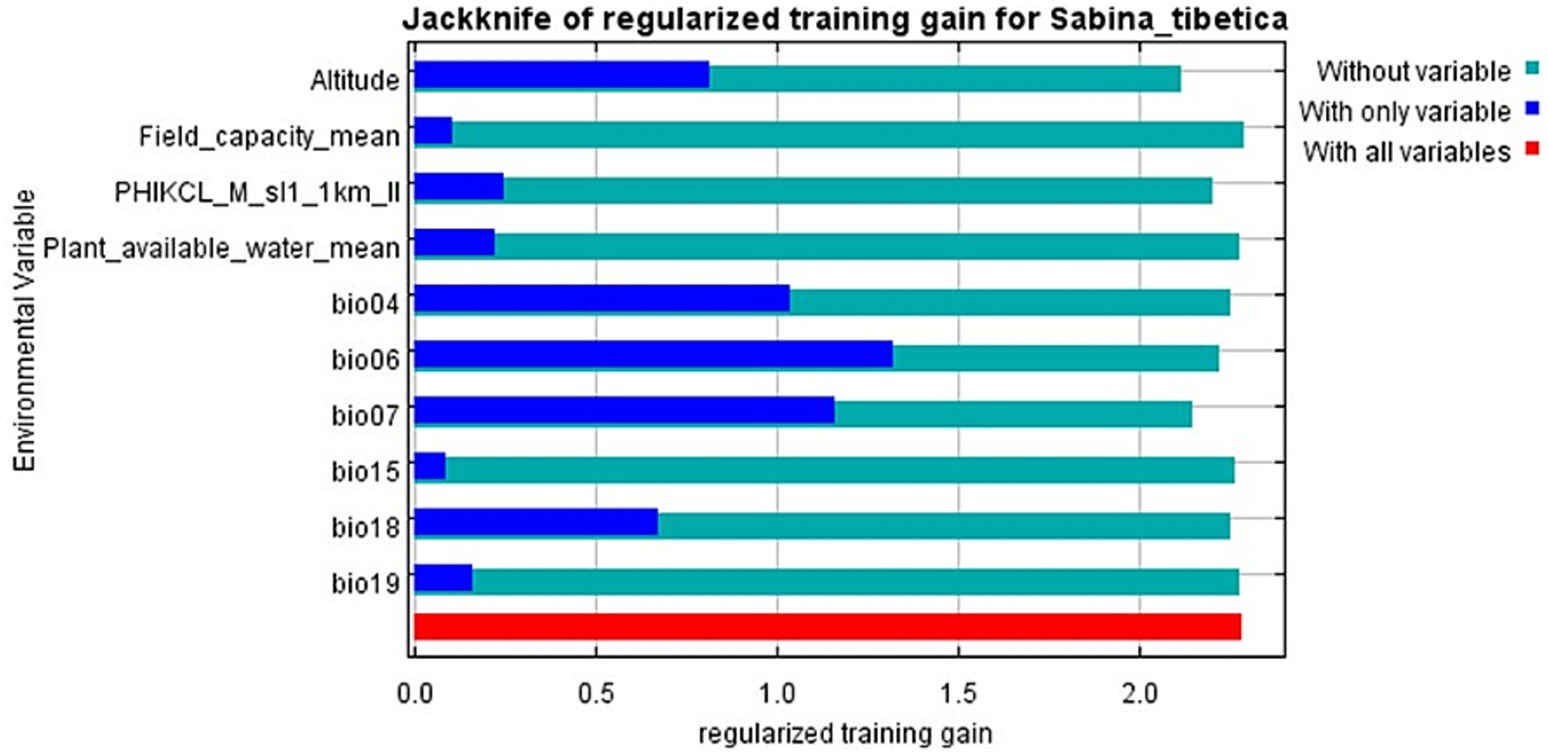
Figure 4. Jackknife test to verify the correlation of environmental variables of Sabina tibetica in the Tibetan Plateau.
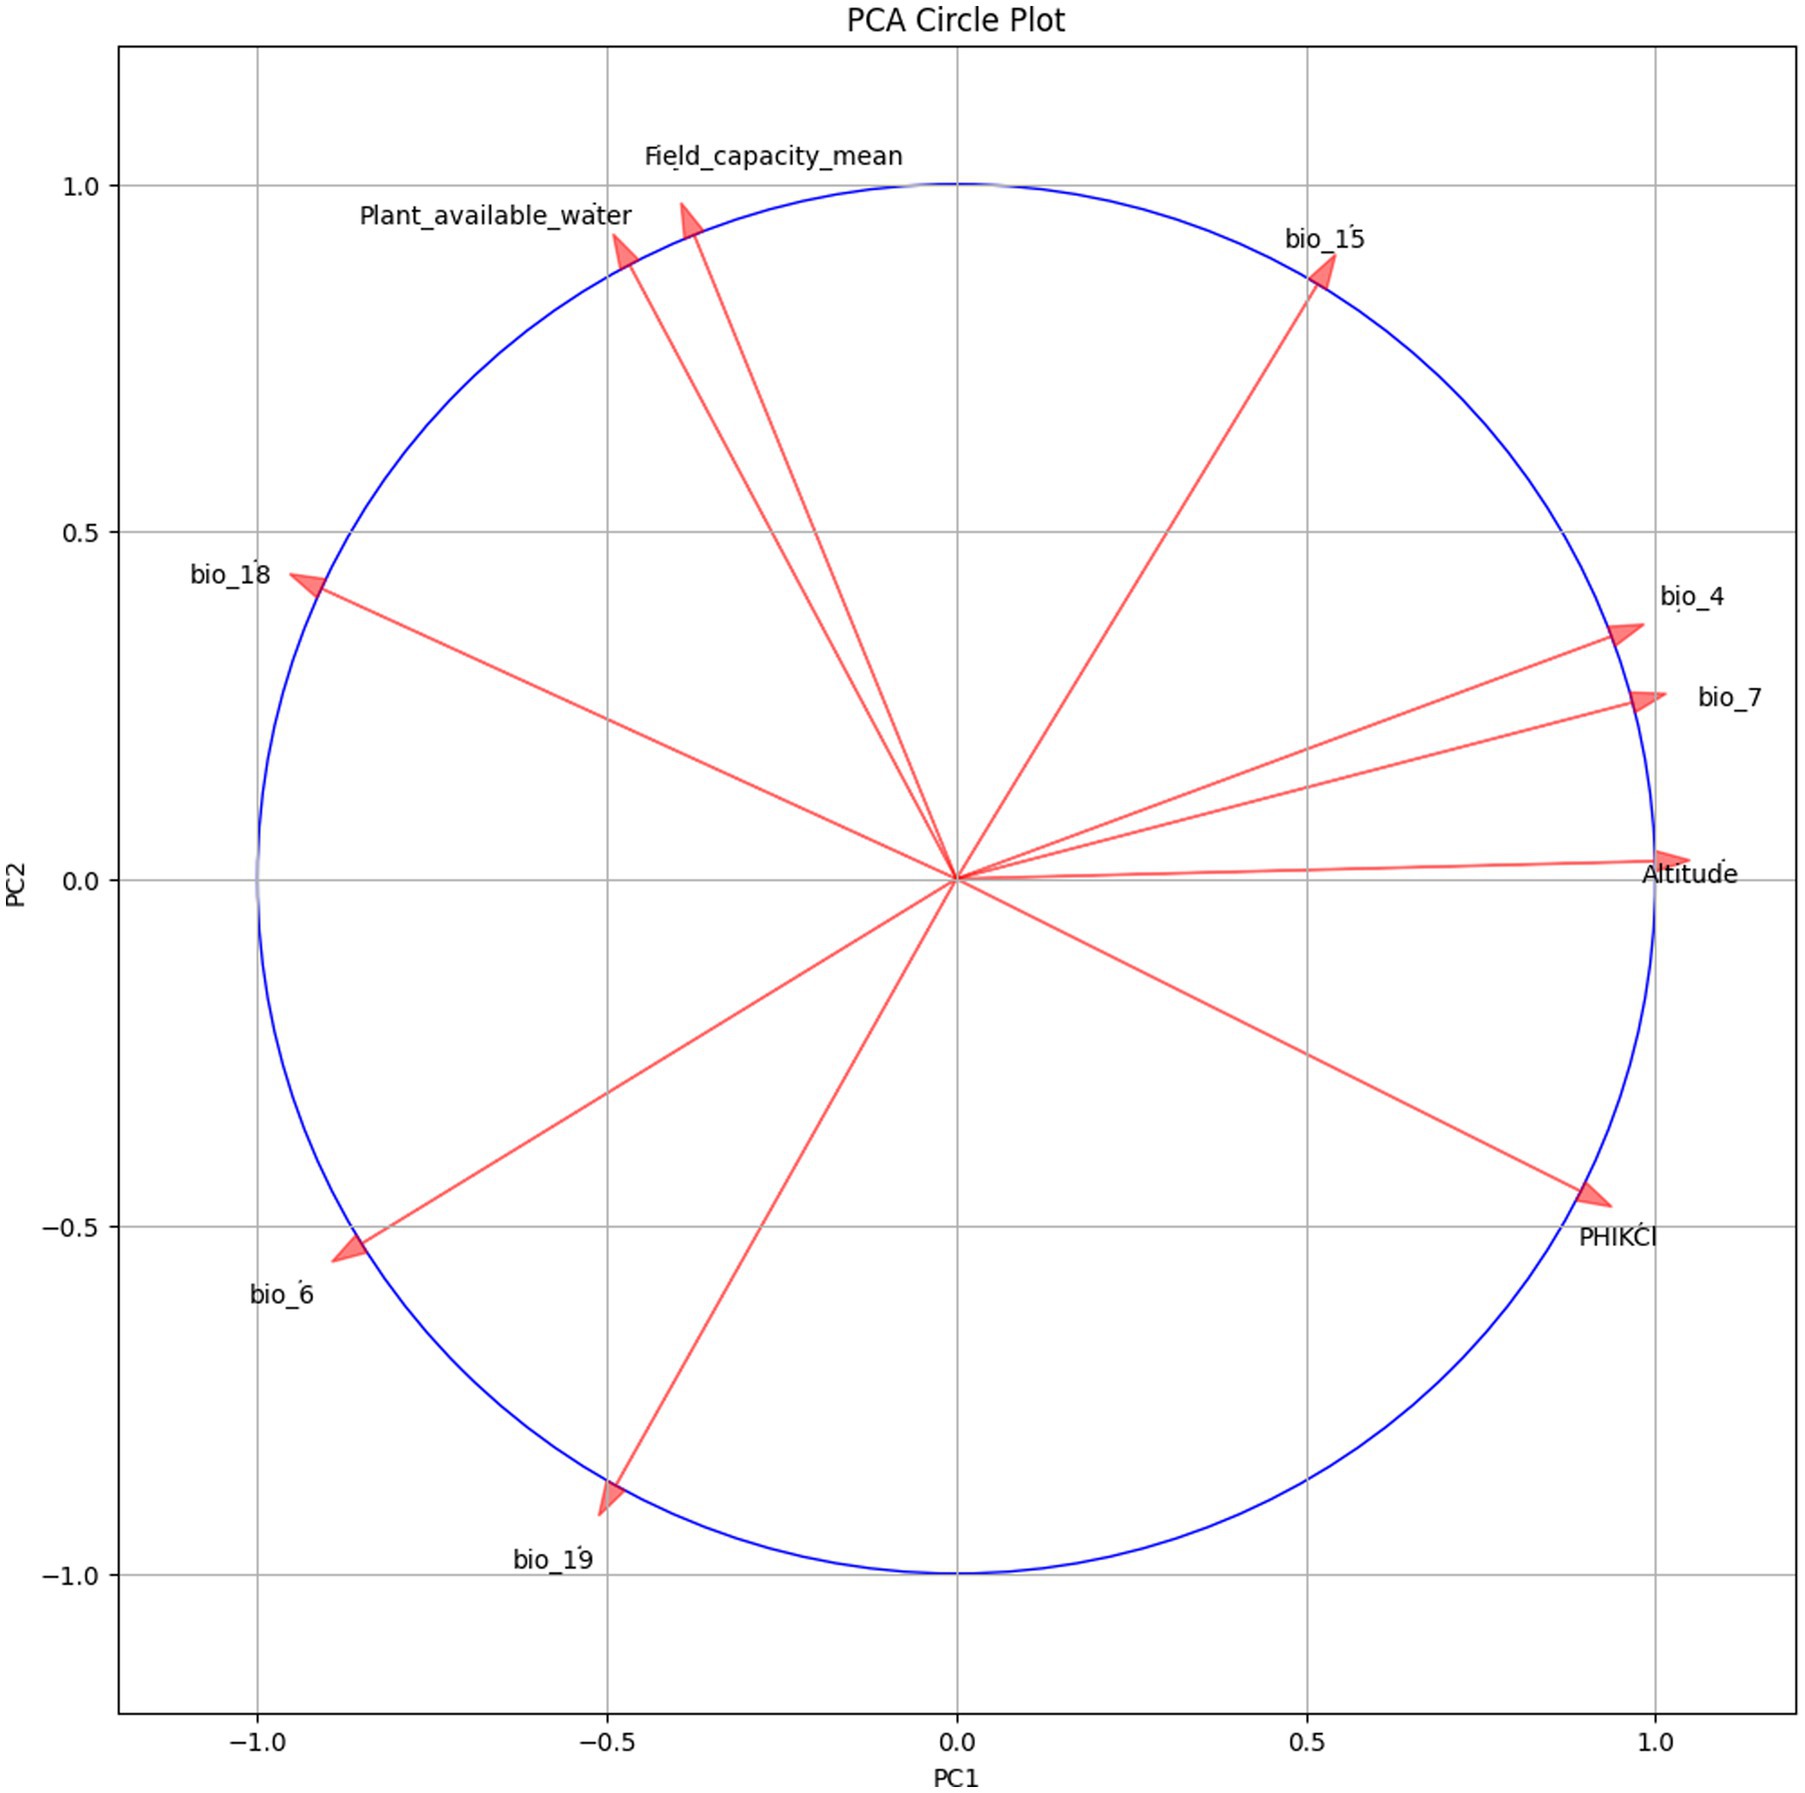
Figure 5. The variables’ contribution to the loadings of the principal axes in the PCA-env analyses and the percentage of explained variability (inertia) by each axis were determined.
From the response curve, we can obtain the thresholds of main environmental variables (probability of existence > 0.5) limiting the growth of Tibetan junipers. The threshold of Min Temperature of Coldest Month (Bio06) was −17°C, Precipitation of Warmest Quarter had a range between 100 and 400 mm, Altitude range was between 2,900-4800 m, Temperature Annual Range was between 24 and 34°C, PHIKCL (pH index measured in KCl solution) has a range greater between 44 and 70 (Figure 6).
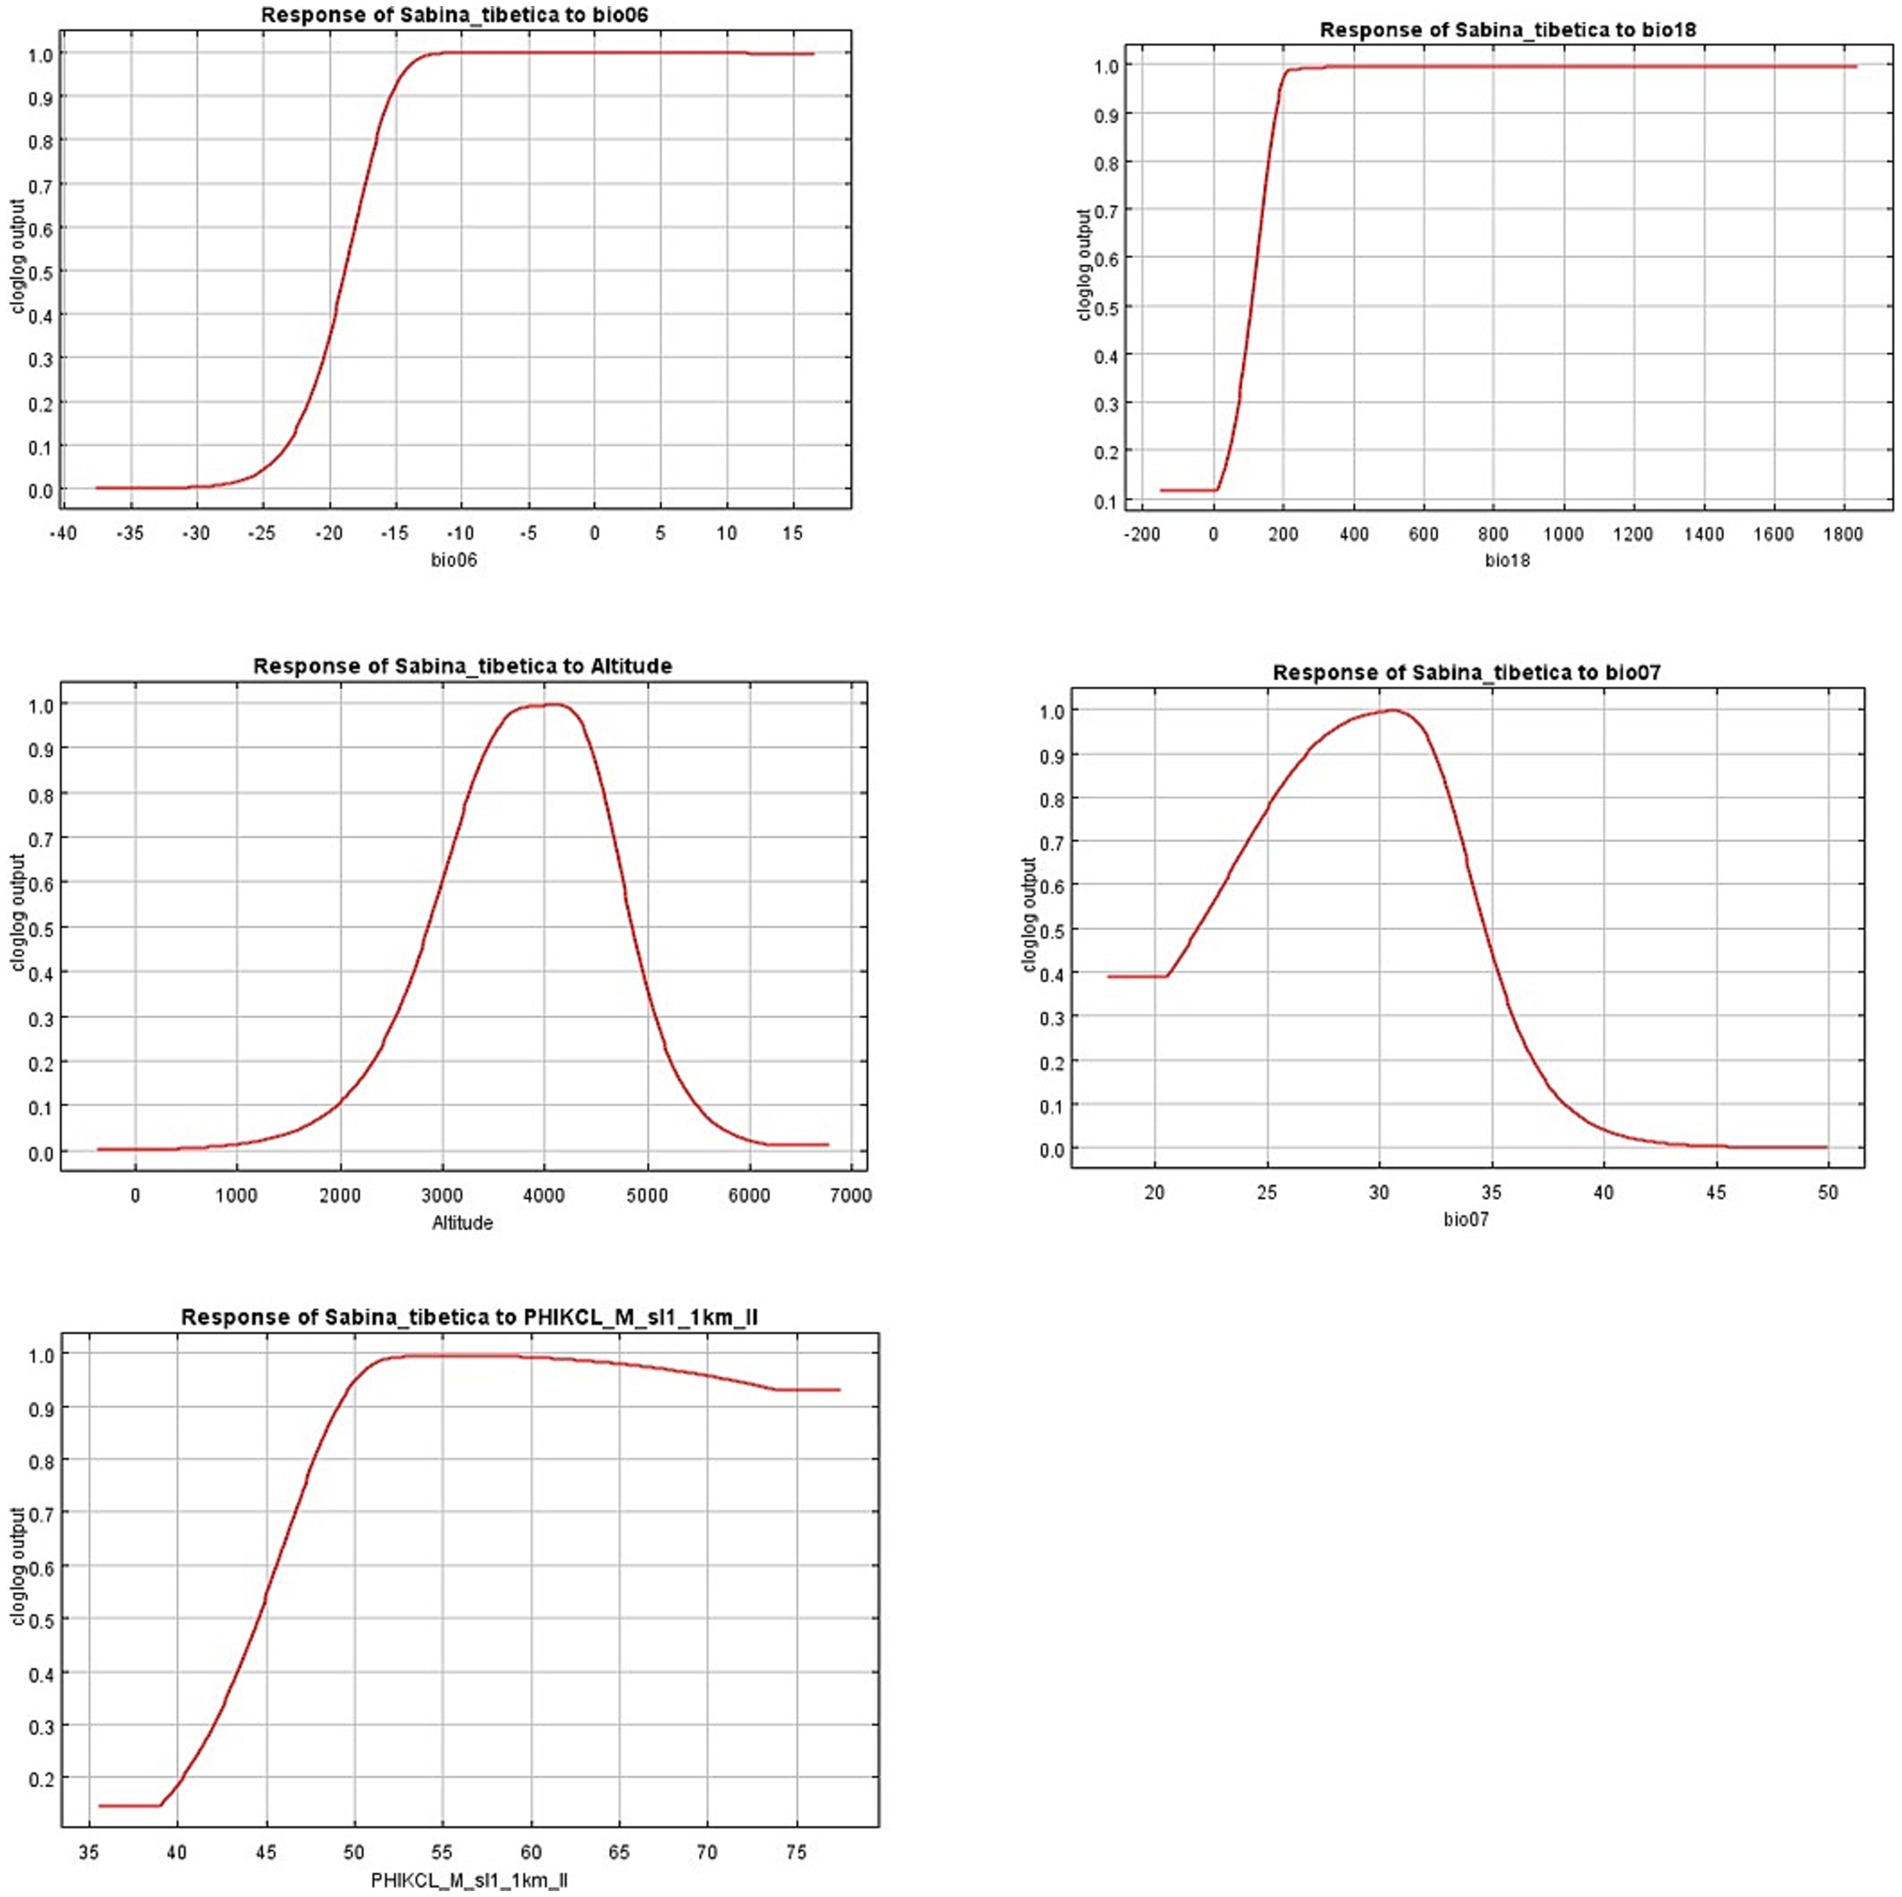
Figure 6. Response curve of environment variable generated by MaxEnt model.
Based on the forest-environment response curve, the habitat suitability indices were calculated for each grid cell from the MaxEnt model. The results showed that the highly suitable habitats existed in the valley areas of central and southeastern Tibet, including the middle reaches of the Yarlung Zangbo River, the Lhasa River Basin, the upper reaches of the Niyang River Basin, the Nu River, the Lancang River, and the Jinsha River. Medium suitable habitats existed in mainly located around the high suitable distribution area, especially the high altitude area around the high suitable distribution area. The low suitable distribution area usually exists in the medium suitable distribution area, the area at an altitude of 4,700–5000 m. Unsuitable habitats existed in Altitude >5,000 m and Inflow area of the Qinghai-Tibet Plateau.
Under the lower greenhouse gas emissions scenario of RCP4.5 for the year 2050, the distribution area projected by the MaxEnt model exhibits a substantial reduction in comparison to the present distribution area. The future distribution area will be about 3.82 × 10⁴ km2, which is 18.33% less than the current distribution area. This is mainly reflected in the disappearance of the previously highly suitable distribution areas in Dingri County and Yadong County. A large number of the highly suitable distribution areas in the western Sichuan region, especially the Yalong River, will vanish in 2050 (Figure 7A). Other highly suitable distribution areas, such as that near Upper middle and upper reaches of Yarlung Zangbo River and Shigatse City, will turn into medium suitable distribution areas.
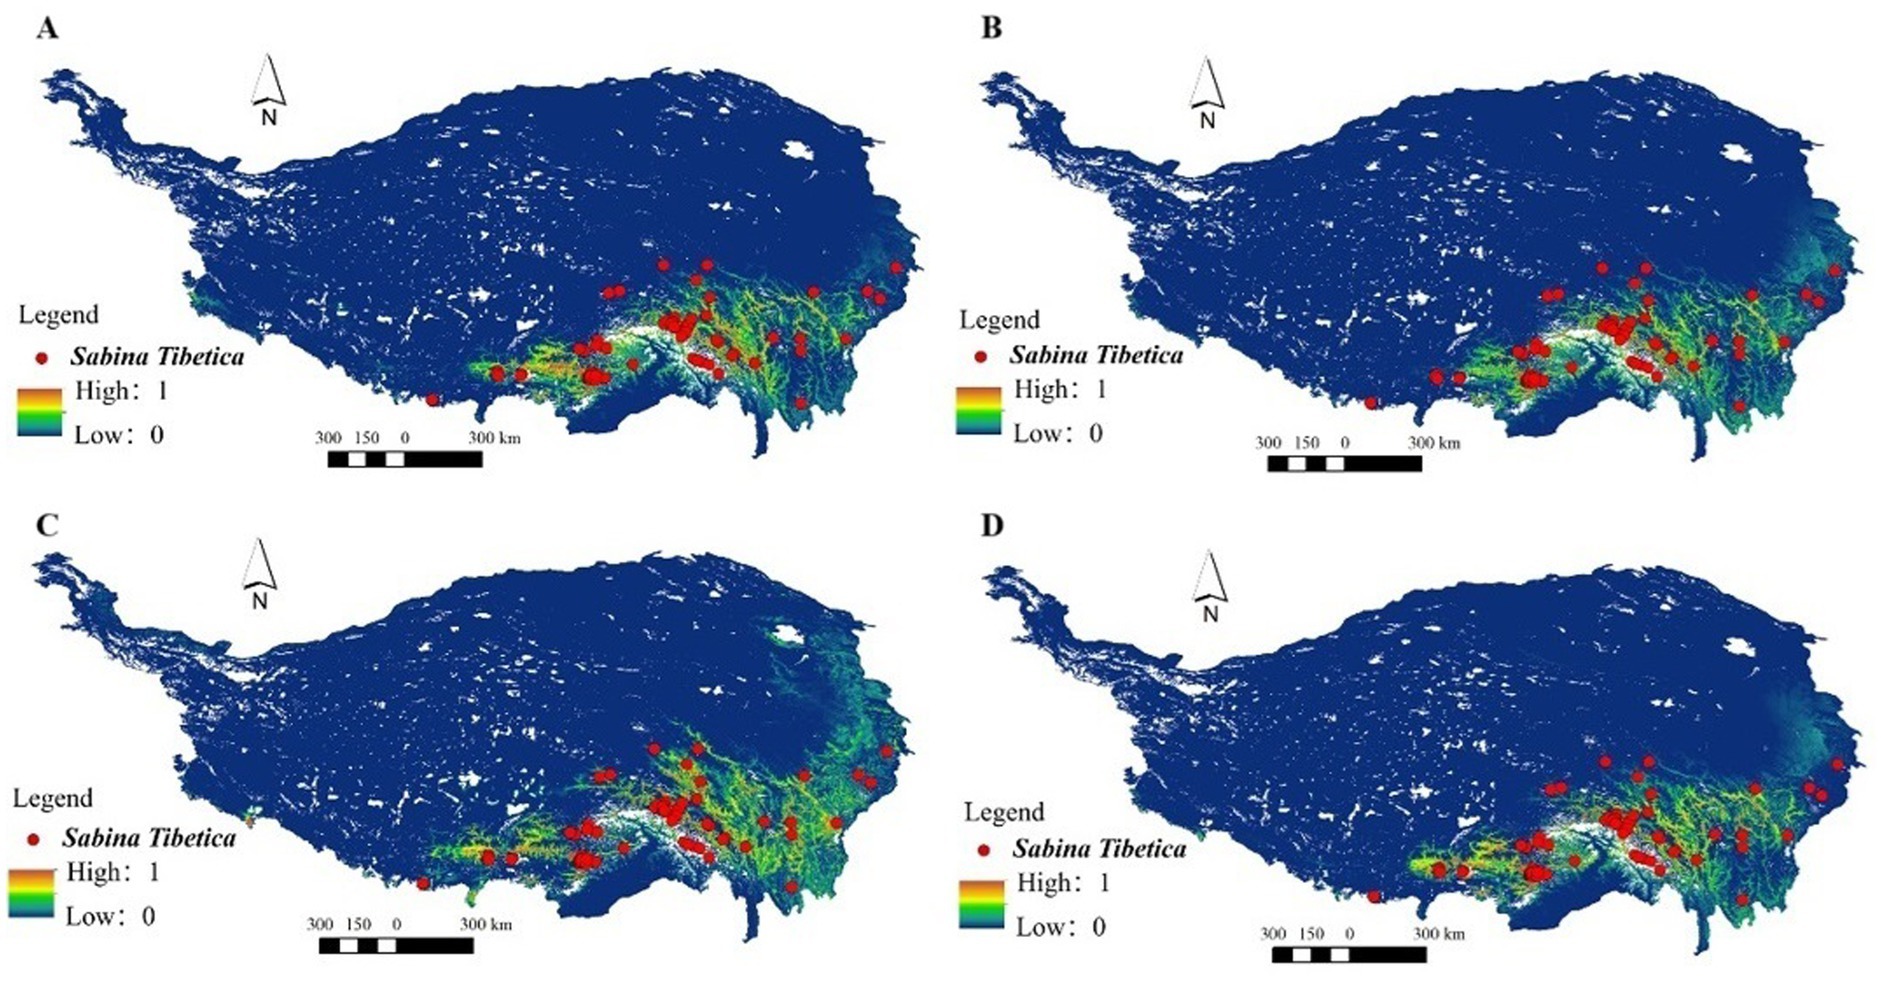
Figure 7. The MaxEnt model was employed to predict the potential distribution of Sabina tibetica in 2050 and 2070 under different scenarios. The forecasted distributions are as follows: (A) potential distribution under RCP4.5 in 2050, (B) potential distribution under RCP8.5 in 2070, (C) potential distribution under RCP4.5 in 2050, and (D) potential distribution under RCP8.5 in 2070.
According to the RCP4.5–2070 scenario, the regions exhibiting high suitability for Sabina tibetica are projected to predominantly occur in the western section of Sichuan province. This is mainly reflected in the disappearance of the previously highly suitable distribution areas in Xiangqian County and Chengdu City. The proportion of its potential distribution area in Qinghai-Tibetan Plateau will increase to 3.33% (Figure 7B). The moderately and high suitable distribution area will be about 2.78 × 10⁴ km2, which is 43.96% less than the current distribution area. This represents the RCP4.5–2070 scenario with the smallest suitable distribution area when compared to various future climate scenarios. However, their suitable distribution areas are different. Other highly suitable distribution areas, such as that near Upper middle and upper reaches of Nujiang River and Lancangjiang River, will turn into medium suitable distribution areas.
In the RCP8.5–2050 scenario, there is a slight eastward shift in the projected distribution of highly suitable areas for Sabina tibetica. However, the estimated proportion of highly suitable habitat area is notably low at 2.04%, covering a total distribution area of only 2.8 × 10⁴ km2 (Figure 7C). The moderately and high suitable distribution area will be about 3.83 × 10⁴ km2, which is 18.33% less than the current distribution area. Other highly suitable distribution areas, such as that near Upper middle and upper reaches of Yadong County and Lancangjiang River, will turn into medium suitable distribution areas.
It is noteworthy that, under the RCP8.5–2070 (Figure 7D), a rise in the highly suitable area for Sabina tibetica is expected, which is projected to cover an extent of 3.86 × 10⁴ km2, equivalent to 3.36% of the total area of Qinghai-Tibetan Plateau. This scenario is similar to the distribution under the RCP8.5–2050 scenario.
From the numerical point of view, this result is not much different from the RCP8.5–2050, but the specific suitable distribution area is different. In the Qamdo region of Tibet and the western Sichuan region of Sichuan, especially Daocheng County and Xiangcheng County, a large number of highly suitable distribution areas will disappear under this climate scenario. This is primarily manifested in the loss of previously moderate and highly suitable areas of distribution, leading to an overall contraction in the distribution range of Sabina tibetica (Table 2).
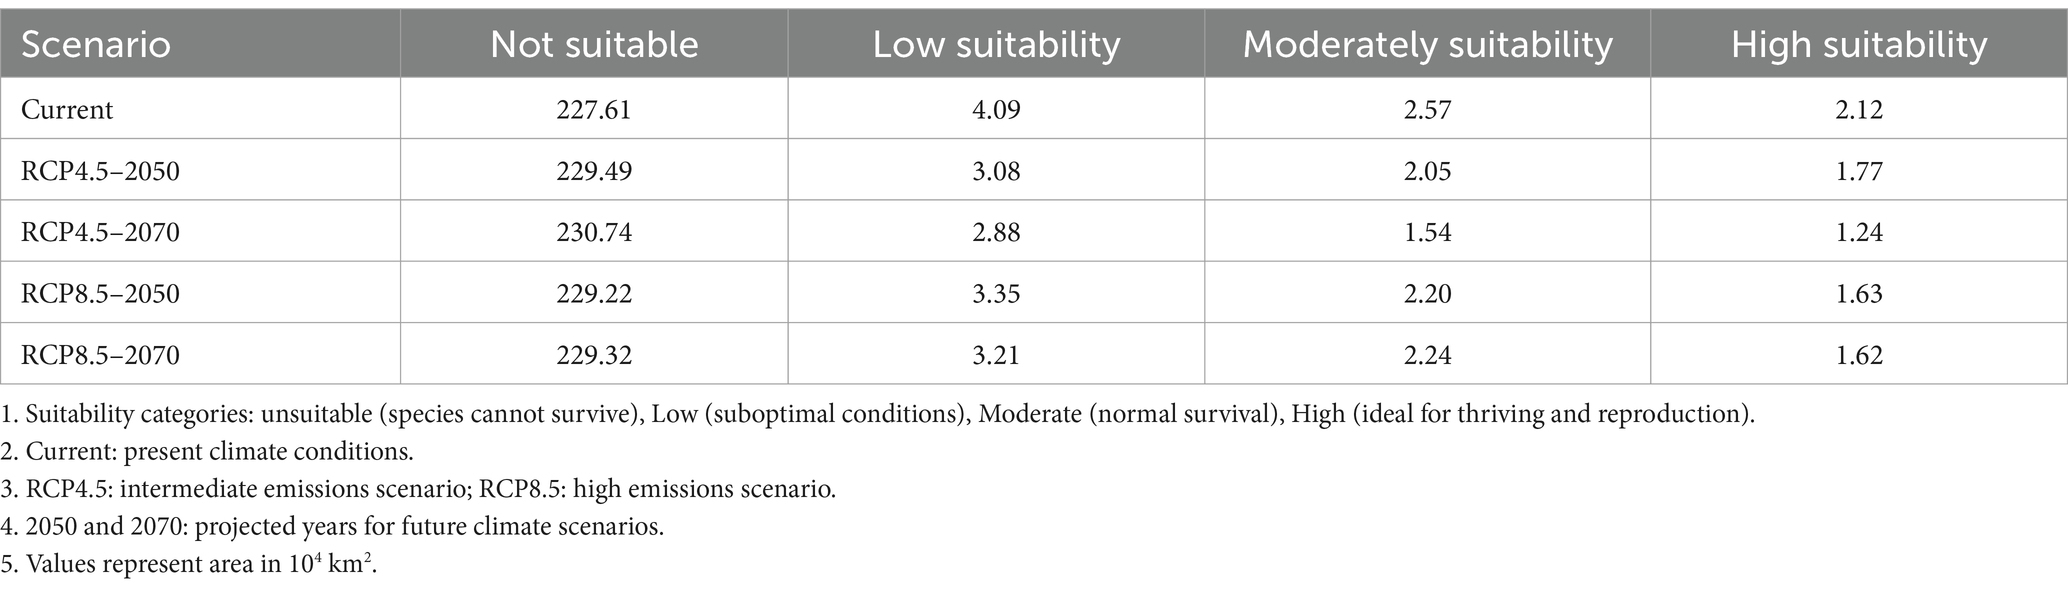
Table 2. The climate change impact on the suitable distribution area (×104 km2) of Sabina tibetica in 2050 and 2070.
In both backgrounds of RCP 4.5 and RCP 8.5, the forecast of the area of Sabina tibetica in 2050 and 2070 is smaller than the current suitable distribution area. At the same time, its distribution center moved north.
Out of the 10 environmental variables utilized in the maxent model, the Minimum Temperature of the Coldest Month (Bio06) and the Temperature Annual Range (Bio07) emerged as the foremost influential factors in determining the habitat suitability distribution for Sabina tibetica. This inference is supported by their significant weights when assessed individually. Recent research by Xie et al. (2024) provides compelling evidence that global treeline elevations are constrained not only by temperature but also significantly by moisture availability. Their comprehensive analysis of 55,300 treeline positions across 77 mountain ranges worldwide reveals that approximately two-thirds of uppermost tree distributions deviate from the thermal treeline, with drought conditions being the primary limiting factor in 51% of cases. The Tibetan juniper has a significant positive correlation with the summer precipitation (similar to bio13 and bio18) The radial growth of Sabina tibetica and the growing season moisture conditions (similar to bio18) and the average temperature before the growing season (similar to bio6) were significantly and positively correlated (Song and Fang, 2019). An et al. (2023) project divergent habitat changes for Larix species on the QTP: L. potaninii Batalin’s suitable area is expected to decrease, L. griffithii’s to expand, while L. speciosa’s remains stable. All species exhibit a common trend of habitat centroids shifting to higher altitudes and latitudes, indicating a shared adaptive response to climate change. Analogous to this study, our research demonstrates that as the trend of climate warming progresses, the suitable habitat range of Sabina tibetica is gradually expanding toward higher elevations. This upward shift in distribution aligns with the species’ response to changing climatic conditions. In the context of climate change, species with widespread but contracting distributions face elevated risks. As Keith et al. (2008) suggest, the rate of habitat loss for these species may potentially exceed their population recovery capacity. Our study indicates that drought stress caused by climate warming has reduced the radial growth of Tibetan juniper trees in future decades.
We attribute the potential distribution area of the Sabina tibetica colony to climate, topography, and soil. First, the climatic conditions could explain the distribution of Sabina tibetica by MaxEnt Model. The climate of the study area in winter and summer was alternatively influenced by dry and cold air from Siberia and warm and moist air from the Indian Ocean, as noted by Hu-zhi et al. (2001). The summer here is short and cool, and the winter is long and severe (Bai et al., 2004). Meteorological data from 84 Qinghai-Tibet Plateau stations (up to 2001) show gradual precipitation increases, peaking at 10.2%. (Xiao-bo and Ze-yong, 2003). Most of the precipitation is concentrated in summer (Hu-zhi et al., 2001). Recent research by You et al. (2019) demonstrates that the Tibetan Plateau is experiencing accelerated warming compared to the global average under climate change scenarios. Ecosystem risks progress nonlinearly with warming, reaching critical thresholds above 3°C through carbon sink-source tipping points (Scholze et al., 2006). This study, which analyzed 21 CMIP5 global climate models under RCP4.5 and RCP8.5 scenarios, reveals that the Tibetan Plateau is projected to reach 1.5°C and 2°C warming thresholds approximately 15 years earlier than the global average. The plateau climate has the characteristics of significant temperature differences between day and night. Adequate sunlight during the day can promote photosynthesis, and lower temperatures at night can reduce respiration so that trees can obtain sufficient nutrient accumulation. You et al. (2020) provide a comprehensive review of EDW (elevation dependent warming) patterns over the Tibetan Plateau, noting that many studies have observed enhanced warming rates at higher elevations. As rapid warming and EDW may lead to substantial shifts in suitable habitats and potential range contractions for high-altitude flora. All these climatic characteristics are consistent with the growth habits, drought resistance, and cold tolerance of Tibetan juniper. The terrain of the Qinghai-Tibet Plateau is complicated, and the accuracy of soil data is relatively low compared to climate and topographic data. In addition, we did not considered other factors, such as interactions between species, genetic effects, and personal effects, in future research, these factors could be included in modeling analysis, because they are likely playing a role in determining whether Tibetan juniper can be distributed in a particular area.
In this study, we employed General Circulation Models (GCMs) to predict the suitable distribution areas of Tibetan juniper under future climate scenarios. However, GCMs may have limitations in representing complex terrain and regional climate characteristics (Shi et al., 2018). For future research, we propose utilizing regional climate models such as RegCM4.4 to conduct multi-model, multi-scenario, high-resolution ensemble simulations. This approach is more advantageous in reducing uncertainties compared to single high-resolution simulations.
The MaxEnt model showed a significantly large habitat suitable for Tibetan juniper, which is much larger than the currently known species distribution. The majority of the observed distribution points for current Sabina tibetica align with the highly suitable distribution area projected by the model. However, a few actual distribution points are situated within the low suitable distribution area as predicted by the model. This is probably because the model cannot include factors such as niche competition. What’s more, there aren’t distribution points of Sabina tibetica in the highly suitable distribution areas predicted by many models. Due to the complex topography of the Qinghai-Tibet Plateau, there are relatively few survey records in remote areas of the distribution of juniper. In the future, more data from field surveys to these areas will improve the accuracy of the MaxEnt model as well as its predictions.
Sabina tibetica is an unique tree species of the Qinghai-Tibet Plateau. Although the natural juniper in the Qinghai-Tibet Plateau is considerably large, their distribution is uneven in space. The areas of high suitability and high connectivity identified by the model can serve as “core protection zones.” These can be supplemented with buffer zone designs to reduce dependence on surrounding matrices, aligning with the conservation principles of landscape ecology (Araújo and Williams, 2000). The nursery stock in the study area has a weak foundation and also lacks scientific guidance in seedling breeding. Our study provides practical solutions for ecological restoration, soil and water conservation, and artificial breeding.
Environmental protection agencies and ecologists need to find a tool, such as MaxEnt, to deal with ecosystem changes that caused by climate change. In this paper, we developed a MaxEnt model to predict changes in the distribution area of juniper under future climate scenarios. According to the prediction results of the MaxEnt model, adequate planning of Sabina tibetica’s in situ conservation and introduction of cultivation can avoid economic losses caused by blind planting in areas not suitable for its growth. However, the prediction from this article can only represent areas with similar environmental conditions to the distribution area, without taking into account factors such as genetic variation and human effects affecting the distribution. Consequently, the prediction results will have possibly deviation from the actual suitable area of Sabina Tibetica. Sabina Tibetica cultivation experiments could be carried out in the suitable areas obtained by our analysis to verify the reliability of MaxEnt Model.
This research provides valuable insights into the potential impacts of climate change on the distribution of Sabina tibetica on the Qinghai-Tibetan Plateau. Employing the MaxEnt model and incorporating multiple environmental variables, we meticulously calibrated the model parameters. Particular emphasis was placed on optimizing feature combinations and regularization multipliers, which substantially enhanced the robustness and reliability of our spatial predictions. This approach not only augmented the model’s predictive capabilities but also improved its applicability across complex geographical landscapes.
The projected contraction of S. tibetica’s suitable habitat area from 4.69 × 10⁴ km2 to 3.83 × 10⁴ km2 (RCP4.5) or 3.86 × 10⁴ km2 (RCP8.5) by 2070 signals potential ecological consequences for high-altitude ecosystems on the Qinghai-Tibetan Plateau. The findings underscore the vulnerability of this endemic species to climate change and highlight the importance of minimum temperature of the coldest month, precipitation of the warmest quarter, and altitude as key determinants of its distribution. These results emphasize the urgent need for targeted conservation strategies and adaptive management practices to mitigate the impacts of climate change on this ecologically significant species.
The raw data supporting the conclusions of this article will be made available by the authors, without undue reservation.
XL: Conceptualization, Investigation, Software, Writing – original draft, Writing – review & editing. DY: Investigation, Writing – review & editing. JW: Investigation, Writing – review & editing. GP: Funding acquisition, Investigation, Resources, Writing – review & editing.
The author(s) declare that financial support was received for the research, authorship, and/or publication of this article. This study was supported by the Registration and Management Project for Ancient and Notable Trees in Bayi District, Nyingchi City (2021).
XL was employed by Nanjing Gago Group Co. Ltd.
The remaining authors declare that the research was conducted in the absence of any commercial or financial relationships that could be construed as a potential conflict of interest.
All claims expressed in this article are solely those of the authors and do not necessarily represent those of their affiliated organizations, or those of the publisher, the editors and the reviewers. Any product that may be evaluated in this article, or claim that may be made by its manufacturer, is not guaranteed or endorsed by the publisher.
6. ^https://www.usgs.gov/centers/eros/science/usgs-eros-archive-digital-elevation-shuttle-radar-topography-mission-srtm-1
An, X., Huang, T., Zhang, H., Yue, J., and Zhao, B. (2023). Prediction of Potential Distribution Patterns of Three Larix Species on Qinghai-Tibet Plateau under Future Climate Scenarios. Forests, 14, 1058. doi: 10.3390/f14051058
Araújo, M. B., Anderson, R. P., Márcia Barbosa, A., Beale, C. M., Dormann, C. F., Early, R., et al. (2019). Standards for distribution models in biodiversity assessments. Science. Advances 5:eaat4858. doi: 10.1126/sciadv.aat4858
Araújo, M. B., and Luoto, M. (2007). The importance of biotic interactions for modelling species distributions under climate change. Glob. Ecol. Biogeogr. 16, 743–753. doi: 10.1111/j.1466-8238.2007.00359.x
Araújo, M. B., and Williams, P. H. (2000). Selecting areas for species persistence using occurrence data. Biol. Conserv. 96, 331–345. doi: 10.1016/S0006-3207(00)00074-4
Bai, H., Dong, W., and Ma, Z. (2004). Climatic characteristics of Qinghai-Xizang plateau and its surrounding. Plateau Meteorol. 23, 890–897. doi: 10.3321/j.issn:1000-0534.2004.06.023
Bedia, J., Busqué, J., and Gutiérrez, J. M. (2011). Predicting plant species distribution across an alpine rangeland in northern Spain. A comparison of probabilistic methods. Appl. Veg. Sci. 14, 415–432. doi: 10.1111/j.1654-109X.2011.01128.x
Birch, J. C., Thapa, I., Balmford, A., Bradbury, R. B., Brown, C., Butchart, S. H. M., et al. (2014). What benefits do community forests provide, and to whom? A rapid assessment of ecosystem services from a Himalayan forest, Nepal. Ecosyst. Serv. 8, 118–127. doi: 10.1016/j.ecoser.2014.03.005
Buckland, S., Cole, N. C., Aguirre-Gutiérrez, J., Gallagher, L. E., Henshaw, S. M., Besnard, A., et al. (2014). Ecological effects of the invasive giant Madagascar day gecko on endemic Mauritian geckos: applications of binomial-mixture and species distribution models. PLoS One 9:e88798. doi: 10.1371/journal.pone.0088798
Di Cola, V., Broennimann, O., Petitpierre, B., Breiner, F., D'Amen, M., Randin, C., et al. (2017). Ecospat: an R package to support spatial analyses and modeling of species niches and distributions. Ecography 40, 774–787. doi: 10.1111/ecog.02671
Dirnböck, T., Essl, F., and Rabitsch, W. (2011). Disproportional risk for habitat loss of high-altitude endemic species under climate change. Glob. Chang. Biol. 17, 990–996. doi: 10.1111/j.1365-2486.2010.02266.x
Dormann, C. F., Elith, J., Bacher, S., Buchmann, C., Carl, G., Carré, G., et al. (2013). Collinearity: a review of methods to deal with it and a simulation study evaluating their performance. Ecography 36, 27–46. doi: 10.1111/j.1600-0587.2012.07348.x
Elith, J., and Leathwick, J. R. (2009). Species distribution models: ecological explanation and prediction across space and time. Annu. Rev. Ecol. Evol. Syst. 40, 677–697. doi: 10.1146/annurev.ecolsys.110308.120159
Elith, J., Phillips, S. J., Hastie, T., Dudík, M., Chee, Y. E., and Yates, C. J. (2011). A statistical explanation of MaxEnt for ecologists. Divers. Distrib. 17, 43–57. doi: 10.1111/j.1472-4642.2010.00725.x
Farjon, A. (2005). A monograph of Cupressaceae and Sciadopitys. Kew, London, UK: Royal Botanic Gardens.
Farjon, A. (2013). Juniperus tibetica. Gland, Switzerland: The IUCN Red List of Threatened Species 2013:e.T42256A2967451.
Franklin, J. (2010). Mapping species distributions: spatial inference and prediction. Cambridge, UK: Cambridge University Press.
Gelviz-Gelvez, S. M., Pavón, N. P., Illoldi-Rangel, P., and Ballesteros-Barrera, C. (2015). Ecological niche modeling under climate change to select shrubs for ecological restoration in Central Mexico. Ecol. Eng. 74, 302–309. doi: 10.1016/j.ecoleng.2014.09.082
Graham, M. H. (2003). Confronting multicollinearity in ecological multiple regression. Ecol. 84, 2809–2815. doi: 10.1890/02-3114
Harrison, S., and Noss, R. (2017). Endemism hotspots are linked to stable climatic refugia. Ann. Bot. 119, 207–214. doi: 10.1093/aob/mcw248
He, Y., Ma, J., and Chen, G. (2023). Potential geographical distribution and its multi-factor analysis of Pinus massoniana in China based on the maxent model. Ecol. Indic. 154:110790. doi: 10.1016/j.ecolind.2023.110790
He, M., Yang, B., and Bräuning, A. (2013). Tree growth–climate relationships of Juniperus tibetica along an altitudinal gradient on the southern Tibetan Plateau. Trees, 27, 429–439. doi: 10.1007/s00468-012-0813-5
Hou, J., Xiang, J., Li, D., and Liu, X. (2023). Prediction of potential suitable distribution areas of Quasipaa spinosa in China based on MaxEnt optimization model. Biology 12:366. doi: 10.3390/biology12030366
Hu-zhi, B. A. I., Jin-nan, X. I. E., and Dong-liang, L. I. (2001). The principal feature of Qinghai-Xizang Plateau monsoon variation in 40 years. Plateau Meteorol. 20, 22–27.
Jetz, W., McPherson, J. M., and Guralnick, R. P. (2012). Integrating biodiversity distribution knowledge: toward a global map of life. Trends Ecol. Evol. 27, 151–159. doi: 10.1016/j.tree.2011.09.007
Kass, J. M., Muscarella, R., Galante, P. J., Bohl, C. L., Pinilla-Buitrago, G. E., Boria, R. A., et al. (2021). ENMeval 2.0: redesigned for customizable and reproducible modeling of species’ niches and distributions. Methods Ecol. Evol. 12, 1602–1608. doi: 10.1111/2041-210X.13628
Keith, D. A., Akçakaya, H. R., Thuiller, W., Midgley, G. F., Pearson, R. G., Phillips, S. J., et al. (2008). Predicting extinction risks under climate change: coupling stochastic population models with dynamic bioclimatic habitat models. Biol. Lett. 4, 560–563. doi: 10.1098/rsbl.2008.0049
Khalaf, S. M., Alqahtani, M. S., Ali, M. R., Abdelalim, I. T., and Hodhod, M. S. (2024). Using maxent modeling to analyze climate change impacts on Pseudomonas syringae van hall, 1904 distribution on the global scale. Heliyon 10:e41017. doi: 10.1016/j.heliyon.2024.e41017
Koschke, L., Fürst, C., Frank, S., and Makeschin, F. (2012). A multi-criteria approach for an integrated land-cover-based assessment of ecosystem services provision to support landscape planning. Ecol. Indic. 21, 54–66. doi: 10.1016/j.ecolind.2011.12.010
Li, J., Li, J., Li, T., and Au, T. F. (2020). Tree growth divergence from winter temperature in the Gongga Mountains, southeastern Tibetan plateau. Asian Geogr. 37, 1–15. doi: 10.1080/10225706.2019.1666015
Lu, X., Liang, E., Wang, Y., Babst, F., Leavitt, S., and Julio, J. (2019). Past the climate optimum: recruitment is declining at the world's highest juniper shrublines on the Tibetan plateau. Ecology 100:e02557. doi: 10.1002/ecy.2557
Ma, R., Li, C., Tian, H., Zhang, Y., Feng, X., Li, J., et al. (2023). The current distribution of tick species in Inner Mongolia and inferring potential suitability areas for dominant tick species based on the MaxEnt model. Parasit. Vectors 16:286. doi: 10.1186/s13071-023-05870-6
Morales, N. S., Fernández, I. C., and Baca-González, V. (2017). MaxEnt’s parameter configuration and small samples: are we paying attention to recommendations? A systematic review. PeerJ 5:e3093. doi: 10.7717/peerj.3093
Muscarella, R., Galante, P. J., Soley-Guardia, M., Boria, R. A., Kass, J. M., Uriarte, M., et al. (2014). ENM eval: An R package for conducting spatially independent evaluations and estimating optimal model complexity for Maxent ecological niche models. Methods Ecol. Evol. 5, 1198–1205. doi: 10.1111/2041-210X.12261
Phillips, S. J., Anderson, R. P., Dudík, M., Schapire, R. E., and Blair, M. E. (2017). Opening the black box: An open-source release of Maxent. Ecography 40, 887–893. doi: 10.1111/ecog.03049
Phillips, S. J., and Dudík, M. (2008). Modeling of species distributions with maxent: new extensions and a comprehensive evaluation. Ecography 31, 161–175. doi: 10.1111/j.0906-7590.2008.5203.x
Pliscoff, P., Luebert, F., Hilger, H. H., and Guisan, A. (2014). Effects of alternative sets of climatic predictors on species distribution models and associated estimates of extinction risk: a test with plants in an arid environment. Ecol. Model. 288, 166–177. doi: 10.1016/j.ecolmodel.2014.06.003
Ponce-Reyes, R., Nicholson, E., Baxter, P. W. J., Fuller, R. A., and Possingham, H. (2013). Extinction risk in cloud forest fragments under climate change and habitat loss. Divers. Distrib. 19, 518–529. doi: 10.1111/ddi.12064
Scholze, M., Knorr, W., Arnell, N. W., and Prentice, I. C. (2006). A climate-change risk analysis for world ecosystems. Proc. Natl. Acad. Sci. 103, 13116–13120. doi: 10.1073/pnas.0601816103
Shi, S. L., Jin, T. T., and Liu, G. H. (2018). Climate warming decelerates growth of Sabina tibetica in Lhasa River area of Tibet. Acta Ecol. Sin. 38, 8964–8972. doi: 10.5846/stxb201807131522
Song, F. S., and Fang, O. Y. (2019). Research on history of Juniperus tibetica growth decline in Three-River-source National Park. J. Forest Environ. 39, 386–392. doi: 10.13324/j.cnki.jfcf.2019.04.009
Wang, W., McDowell, N. G., Liu, X., Xu, G., Wu, G., Zeng, X., et al. (2021). Contrasting growth responses of Qilian juniper (Sabina przewalskii) and Qinghai spruce (Picea crassifolia) to CO2 fertilization despite common water-use efficiency increases at the northeastern Qinghai–Tibetan plateau. Tree Physiol. 41, 992–1003. doi: 10.1093/treephys/tpaa169
Wang, Z., Zhang, Y., Yang, Y., Zhou, W., Gang, C., Zhang, Y., et al. (2016). Quantitative assess the driving forces on the grassland degradation in the Qinghai–Tibet plateau, in China. Eco. Inform. 33, 32–44. doi: 10.1016/j.ecoinf.2016.03.006
Warren, D. L., and Seifert, S. N. (2011). Ecological niche modeling in Maxent: the importance of model complexity and the performance of model selection criteria. Ecol. Appl. 21, 335–342. doi: 10.1890/10-1171.1
Xiao-bo, M. A., and Ze-yong, H. U. (2003). Precipitation variation characteristics and abrupt change over Qinhai-Xizang plateau in recent 40 years. J. Desert Res. 25, 137–139. doi: 10.3321/j.issn:1000-694X.2005.01.024
Xie, Y., Shen, Z., Wang, T., Malanson, G. P., Peñuelas, J., Wang, X., et al. (2024). Uppermost global tree elevations are primarily limited by low temperature or insufficient moisture. Glob Chang Biol. 30, e17260. doi: 10.1111/gcb.17260
You, Q., Chen, D., Wu, F., Pepin, N., Cai, Z., Ahrens, B., et al. (2020). Elevation dependent warming over the Tibetan Plateau: Patterns, mechanisms and perspectives. Earth-Sci. Rev. 210, 103349. doi: 10.1016/j.earscirev.2020.103349
You, Q., Zhang, Y., Xie, X., and Wu, F. (2019). Robust elevation dependency warming over the Tibetan plateau under global warming of 1.5 C and 2 C. Clim. Dyn. 53, 2047–2060. doi: 10.1007/s00382-019-04775-4
Zhao, L., Ping, C. L., Yang, D., Cheng, G., Ding, Y., and Liu, S. (2004). Changes of climate and seasonally frozen ground over the past 30 years in Qinghai–Xizang (Tibetan) plateau, China. Glob. Planet. Chang. 43, 19–31. doi: 10.1016/j.gloplacha.2004.02.003
Zhao, Y., Deng, X., Xiang, W., Chen, L., and Ouyang, S. (2021). Predicting potential suitable habitats of Chinese fir under current and future climatic scenarios based on Maxent model. Eco. Inform. 64:101393. doi: 10.1016/j.ecoinf.2021.101393
Zhisheng, A., Kutzbach, J. E., Prell, W. L., and Porter, S. C. (2001). Evolution of Asian monsoons and phased uplift of the Himalaya–Tibetan plateau since late Miocene times. Nature 411, 62–66. doi: 10.1038/35075035
Keywords: Sabina tibetica, climate change, Qinghai-Tibet plateau, MaxEnt, distribution area
Citation: Li X, Yang D, Wang J and Pan G (2025) Prediction of the change in suitable growth area of Sabina tibetica on the Qinghai-Tibetan plateau using MaxEnt model. Front. For. Glob. Change. 8:1465416. doi: 10.3389/ffgc.2025.1465416
Edited by:
Yashwant Singh Rawat, Federal Technical and Vocational Education and Training Institute (FTVETI), EthiopiaReviewed by:
Prashant Sharma, Dr. Yashwant Singh Parmar University of Horticulture and Forestry, IndiaCopyright © 2025 Li, Yang, Wang and Pan. This is an open-access article distributed under the terms of the Creative Commons Attribution License (CC BY). The use, distribution or reproduction in other forums is permitted, provided the original author(s) and the copyright owner(s) are credited and that the original publication in this journal is cited, in accordance with accepted academic practice. No use, distribution or reproduction is permitted which does not comply with these terms.
*Correspondence: Dongsheng Yang, Mzk1MTgwNjg2QHFxLmNvbQ==; Gang Pan, NDQ1OTQ0OTUzQHFxLmNvbQ==
Disclaimer: All claims expressed in this article are solely those of the authors and do not necessarily represent those of their affiliated organizations, or those of the publisher, the editors and the reviewers. Any product that may be evaluated in this article or claim that may be made by its manufacturer is not guaranteed or endorsed by the publisher.
Research integrity at Frontiers
Learn more about the work of our research integrity team to safeguard the quality of each article we publish.