 Dandan Li1,2
 Weiwei Jia
- 1Department of Forest Management, School of Forestry, Northeast Forestry University, Harbin, China
- 2Key Laboratory of Sustainable Forest Ecosystem Management-Ministry of Education, School of Forestry, Northeast Forestry University, Harbin, China
Forest management is vital to the growth and development of trees at different stages. However, comprehensively capturing tree attributes to determine the response to management remains a major challenge. Therefore, this study utilized TLS technology to probe forest structure information, explore the effects of TLS on stem diameter, and develop the most appropriate taper model to reveal how thinning management affects the stem size and form of larch during SIS and SES. Larch plantations aged 16 and 26 years were subjected to different intensities of thinning treatments, and 3D structural information of the stems was measured via TLS in the 7th year after the intervention. In present study, age and thinning intensity were used as dummy variables to reduce modeling costs and taper models were developed to reflect the stem shape. ANOVA was applied to assess differences in tree attributes (slenderness, stem taper, form factor at breast height, and form quotient) among the different thinning treatments. The results showed that the ability of TLS to measure stem diameter information was related to forest conditions, and the effect of the SES with low stand density and large stem diameters was greater than that of the SIS with complex understory conditions and small stem diameters (with 70% of the stem diameter captured in the SIS and 80% in the SES). During the SIS, plants were more sensitive to thinning, and their diameter growth efficiency was significantly greater than that during the SES. Thinning promoted trunk growth in the bottom part and intermediate section compared to that in the unthinned plots. The average DBH increased with increasing thinning intensity, while slenderness exhibited the opposite pattern. The responses of TH and form factor at breast height to thinning were not significant, but they were age dependent. Since TLS has difficulty capturing the diameter of canopy height, the Kozak variable-exponent taper equation is more suitable for modeling stem forms, and setting age as well as thinning intensity as dummy variables is an efficient modeling method. Overall, TLSs can be used for measuring long-term tree responses after intervention to efficiently support nondestructive forest inventories and management.
1 Introduction
Stem form is an important factor affecting wood quality and yield, and improving it can help increase forest harvest and wood utilization efficiency. Stem form is influenced by genetics (Li et al., 2012; Morley and Little, 2012), stand density (Mäkinen and Isomäki, 2004; Jacobs et al., 2020; Hirigoyen et al., 2021), site characteristics (Larson, 1963; Jacobs et al., 2020), social status (Mette et al., 2015), climatic factors (Nigh and Smith, 2012; Liu et al., 2020; Rais et al., 2021), silvicultural management (Zhao et al., 2022b), and other factors. Generally, the slenderness, stem taper, form factor at breast height, form quotient and trunk curve model are used to characterize stem shape (these terms are described in Table 1). In forest production, treatments such as thinning (Saarinen et al., 2020; Wagle et al., 2022; Benedetti-Ruiz et al., 2023), pruning (Beadle et al., 2007; Alvarez et al., 2013) and fertilization (Teste and Lieffers, 2011; Zhao et al., 2011) are used to improve the quality of the forest and change the shape of the trunks. In particular, thinning controls stand density, changes forest spatial structure, reduces competition between trees, and provides trees with more growing space (Zhao et al., 2014; Saarinen et al., 2020).
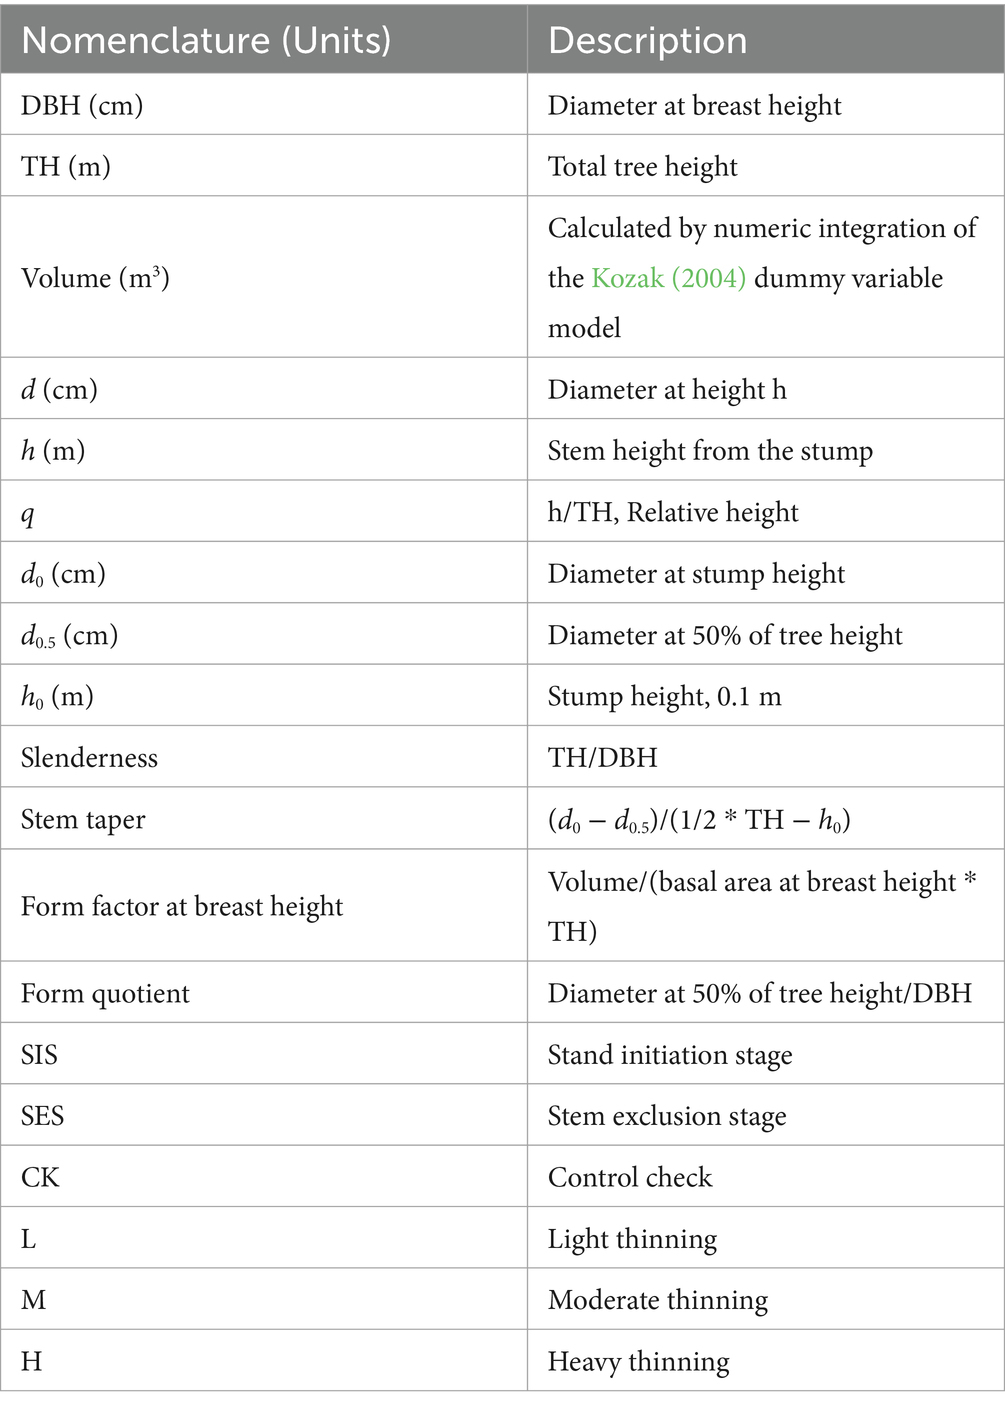
Table 1. Description and units of nomenclature used in this paper.
Thinning is an important measure in forest operation and management that directly affects the growth and development of trees along with the establishment of stand growth models. The purposes of thinning are to improve stand conditions, reduce competition among trees, and allow the remaining trees to receive more light, more favorable temperatures, soil nutrients and water, thereby promoting the growth of individual trees and improving forest quality (Yu et al., 2017; Forrester, 2019; Giana et al., 2023). Forests with high canopy density will undergo self-thinning; however, self-thinning does not progress toward timber forests; therefore, human intervention is particularly important. Studies have shown that for trees during the stand initiation and stem exclusion stages, thinning promotes the growth of diameter at breast height (DBH), tree height (TH), volume, stand basal area, and storage and causes suppressed trees to recover rapidly (Saarinen et al., 2020; Benedetti-Ruiz et al., 2023; Lehtonen et al., 2023). Slenderness serves as a measure of tree stability, and trees with smaller slenderness values are expected to be more robust (Kontogianni et al., 2011; Albrecht et al., 2012; Wang et al., 2023). Species in larch plantations are isolated and have increased vulnerability to risks such as winds, snow, and pests. Thinning reduces the slenderness of forests (Tasissa and Burkhart, 1998; Pape, 1999; Morley and Little, 2012; Jacobs et al., 2020), enhances their ability to resist natural disasters, and improves forest health (del Río Gaztelurrutia et al., 2017; Liu et al., 2020; Saarinen et al., 2020). Benedetti-Ruiz et al. (2023) reported in their study on adult chestnut plantations that the largest increase in DBH occurred in the third year after thinning, and after 5 years, the effect of thinning on tree growth decreased significantly. Compared with unthinned forests, thinned forests have advantages, increasing the economic value of forests and improving their stability (Newton, 2022). However, differences in the response of larch to thinning and its stem form during the stand initiation and stem exclusion stages have rarely been reported.
Some studies have shown that the DBH, basal area, and volume increase with increasing thinning intensity and that the slenderness decreases with increasing thinning intensity (Mäkinen and Isomäki, 2004; Saarinen et al., 2020). With the development of thinning, the stem taper width, crown width and height of the tree crown base (HCB) also increased gradually. In addition, differences in stem tapering were also found to be related to tree age (Pape, 1999; Mäkinen and Isomäki, 2004). However, no previous studies have investigated the effects of the stand initiation and stem exclusion stages on tapering. Conflicting results have been published on the response of thinning to the growth of individual trees of different relative sizes, as they often ignore the effects of age factors (Muhairwe, 1994; Karlsson, 2000; Mäkinen and Isomäki, 2004). The growth dominance of thinning plots was shown to be greater than that of unthinned plots, but the stand growth efficiency exhibited the opposite trend (Qu et al., 2022). Heavy thinning results in a significantly faster increment of individual trees but produces more large stems, leading to poorer stem shape and decreases in forest biomass and stock, reducing forest quality (Mäkinen and Isomäki, 2004). Although progress has been made, the most appropriate thinning intensity for larch in the stand initiation and stem exclusion stages, as well as whether the response of stands in both age groups to thinning is consistent, is still unknown.
The taper equation, also known as the stem curve equation, describes the degree to which the stem diameter gradually decreases with increasing height. It provides a complete indication of the shape of the entire tree trunk and can be used to calculate volume and compile a table of timber yield (Meng, 1982; Kozak, 2004). The taper model is an important approach for describing stem shape and calculating commercial timber. Traditionally, the taper model is established by felling trees, but this often consumes considerable manpower and material resources and is dangerous. Determining accurate stem form factors is challenging because information on tree height and upper stem diameter is difficult to obtain. In recent years, terrestrial laser scanning (TLS) has been widely used in forestry investigations due to its high precision, high efficiency and nondestructive nature (Zhang et al., 2022; Bornand et al., 2023). TLS can be used to capture detailed 3D information about stands and individual trees and provide nondestructive measurements of DBH, TH, crown, basal area, volume stocks, biomass and carbon storage (Jacobs et al., 2020; Bogdanovich et al., 2021; Li S. et al., 2021; Abegg et al., 2023). According to the report of Stovall (Stovall et al., 2023), TLS can estimate stem diameter to an average of 15.7 m above ground. Similarly, Li et al. (2023) indicated that it could capture the upper stem diameter to 75% of the relative height. Saarinen et al. (2020) used TLS to assess the effects of thinning on the stem growth allocation of individual trees and revealed differences between stem form and tree size. Sun et al. (2016) and Li D. et al. (2021) used TLS data to establish a taper model. Although previous studies have shown good results, no detailed information has been obtained on how thinning intensity in the context of TLS data affects stem shape and size during the stand initiation and stem exclusion stages. This study assumes that the response of the thinning effect in larch remains consistent during the stand initiation and stem exclusion stages.
The present study adopted TLS technology to capture three-dimensional structural information on the stand initiation and stem exclusion stages of larch (Larix olgensis Henry) under different thinning intensities in a nondestructive manner, with three main objectives: (A) the use of TLS in estimating upper stem diameters for Larix olgensis, larch species in other regions, other coniferous tree species, and stand initiation and stem exclusion stages; (B) the use of TLS in building taper models and computations of tree form indices similar for Larix olgensis and larch species, coniferous tree species; and (C) the use of thinning effects on tree form indices similar for Larix olgensis and larch species. The following notations (Table 1) will be used throughout the remainder of this paper.
2 Materials and methods
2.1 Study site and data acquisition
The study site is in Heilongjiang Province, Northeast China (45°03′29″–45°58′30″N, 129°41′50″–130°34′20″E). The average annual temperature is 2.7°C, the altitude is 400–600 m, and the average annual precipitation is 580 mm. The forests of the study area mostly covered by conifer plantations along with few broad leave species. The larch plantations were established in 1990 and 2000. In 2008, 18-year-old plantations were thinned, with an average plant intensity of 60%. Thinning treatment was performed on 16- and 26-year-old larches in spring 2016, and 0.06 ha (20 m × 30 m) of sample plots were set in each thinned area. The 26-year-old stem exclusion stage larch was thinned to three intensities (light thinning: 20% of the plant density was removed; moderate thinning: 35% of the plant density was removed; heavy thinning: 50% of the plant density was removed), the 16-year-old stand initiation stage larch was thinned to two intensities of thinning (light thinning: 20% of the plant density was removed; moderate thinning: 35% of the plant density was removed), and a control group was set up, that is, 0% of the plant density was removed (Peng et al., 2018). Two sample plots were set for each thinning treatment in both age groups, for a total of 14 sample plots. The DBH, TH and crown width of all trees in the plots were measured, and the relative position of each tree was also recorded.
All sample plots were measured in 2022, with stand ages of 22 years (stand initiation stage) and 32 years (stem exclusion stage). The summary statistics of the trees for the DBH and TH at each thinning intensity for both ages are shown in Table 2. This study used the RIEGL VZ-400i terrestrial laser scanning system to capture data from thinning plots. Each plot scans five positions, that is, one station set at the center of the plot and four stations set at the corner of the rectangle. Then, this study selected typical representative trees of average size near each sample plot, felled them and performed stem analysis (destructively sampled), measured their DBH, TH, and stump diameter, and measured their diameter at relative heights of 2, 4, 6, 8, 10, 20, 25, 30, 40, 50, 60, 70, 75, 80, and 90%. These positions refer to Li D. et al. (2021). The point cloud data captured by TLS were coregistered and preprocessed using RISCAN PRO software, and then outliers were removed from the LiDAR360 software. An improved progressive triangulated irregular network densification filtering algorithm was implemented to classify ground points (Zhao et al., 2016). To remove the effects of topographic relief on the elevation of the point cloud data, this study performed normalization by ground points. Finally, tree segmentation was performed using the comparative shortest-path algorithm (CSP). The CSP algorithm consists of two steps, namely, trunk detection and subsequent crown segmentation (Tao et al., 2015). There are some phenomena of incorrect segmentation and omission in the process of tree segmentation. This study extracted the trunk diameters at 0.1 m and 1.3 m and each relative height for the correctly segmented trees in the plots. These diameters were fitted using the least squares algorithm defined by the software itself at each target position of the stem (for example, the 1.3 m point cloud height is 1.2–1.4 m, with a buffer height of 20 cm) (Figure 1). For the detailed process, please refer to https://www.lidar360.com/archives/9428.html. This study used 14 destructively sampled larch trees to verify the effect of TLSs on stem diameter measurements at different heights. The identification precision is used to check the reliability of the TLS data, which is calculated based on Equation 1. After removing anomalous data, such as dead trees, nontarget trees, and TLS point clouds missing trees, this study used 880 trees for modeling analysis in thinning plots. This study was conducted in August, when all vegetation was under leaf-on conditions.
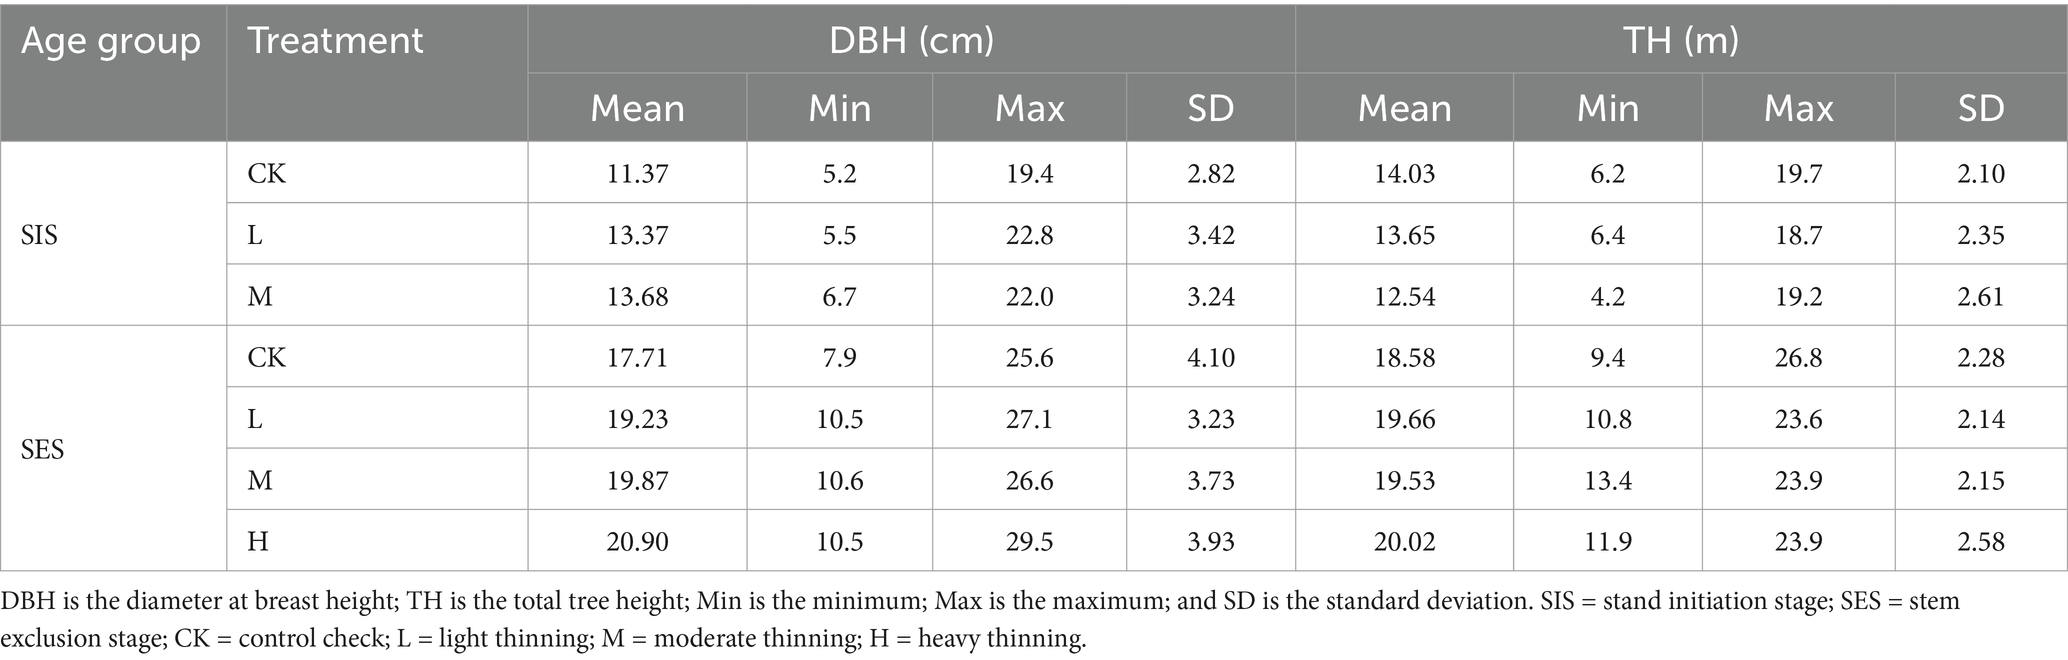
Table 2. Descriptive statistics of the larch dataset.
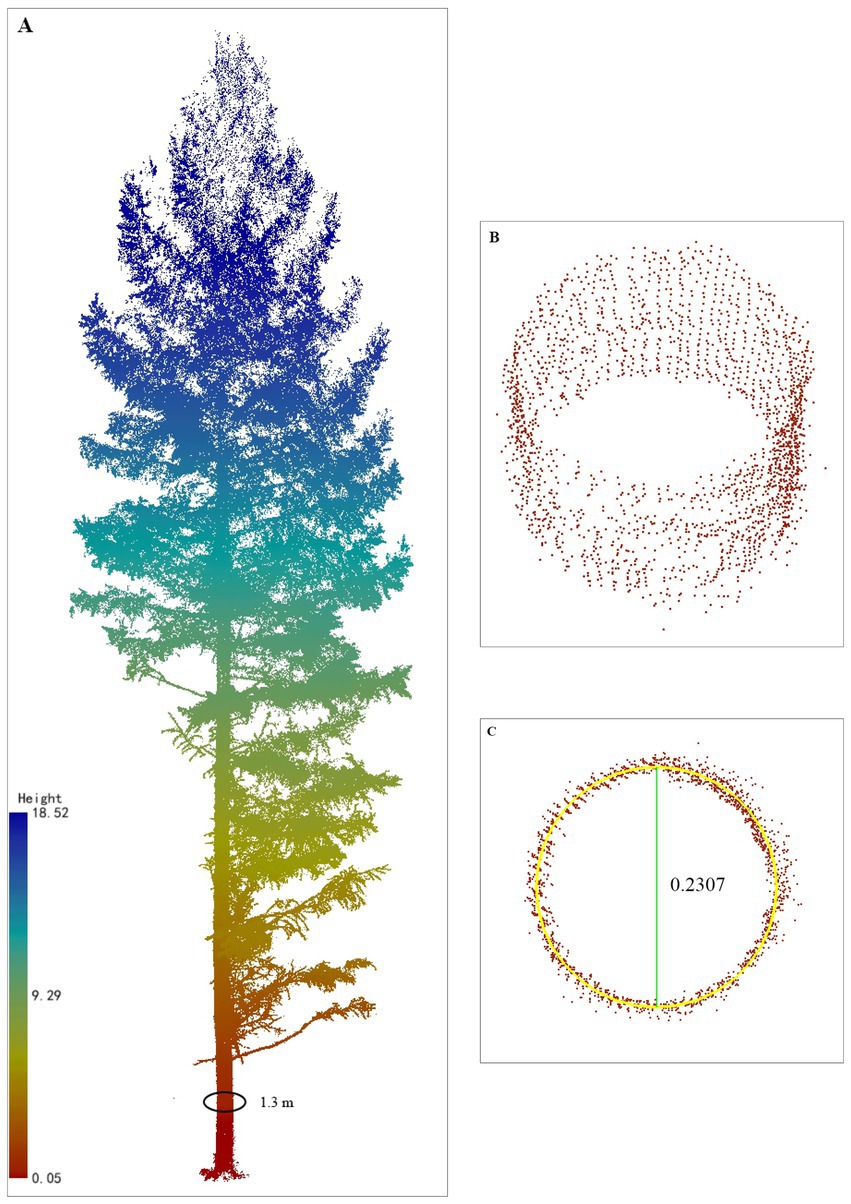
Figure 1. Single tree points cloud and diameter extraction (taking 1.3 m as an example). (A) A larch colored by height (DBH = 23.07 cm, TH = 18.52 m); (B) point cloud at the 1.3 m position with a layer thickness of 1.2–1.4 m and buffer of 20 cm; (C) rasterized point cloud at 1.3 m with a fitted diameter of 0.2307 m.
2.2 Taper models and tree trunk variables
In this study, four highly accurate taper equations were used to simulate the stem shape of larch at each thinning intensity in the stand initiation and stem exclusion stages: Max and Burkhart (1976) [abbreviated as Max and Burkhart (1976)], Fang et al. (2000), Bi (2000) and Kozak (2004). Max and Burkhart (1976) and Fang et al. (2000) are segmented models, Bi (2000) is a trigonometric variable form, and Kozak (2004) is a variable-exponent taper equation. The basic model form is shown in Table 3.
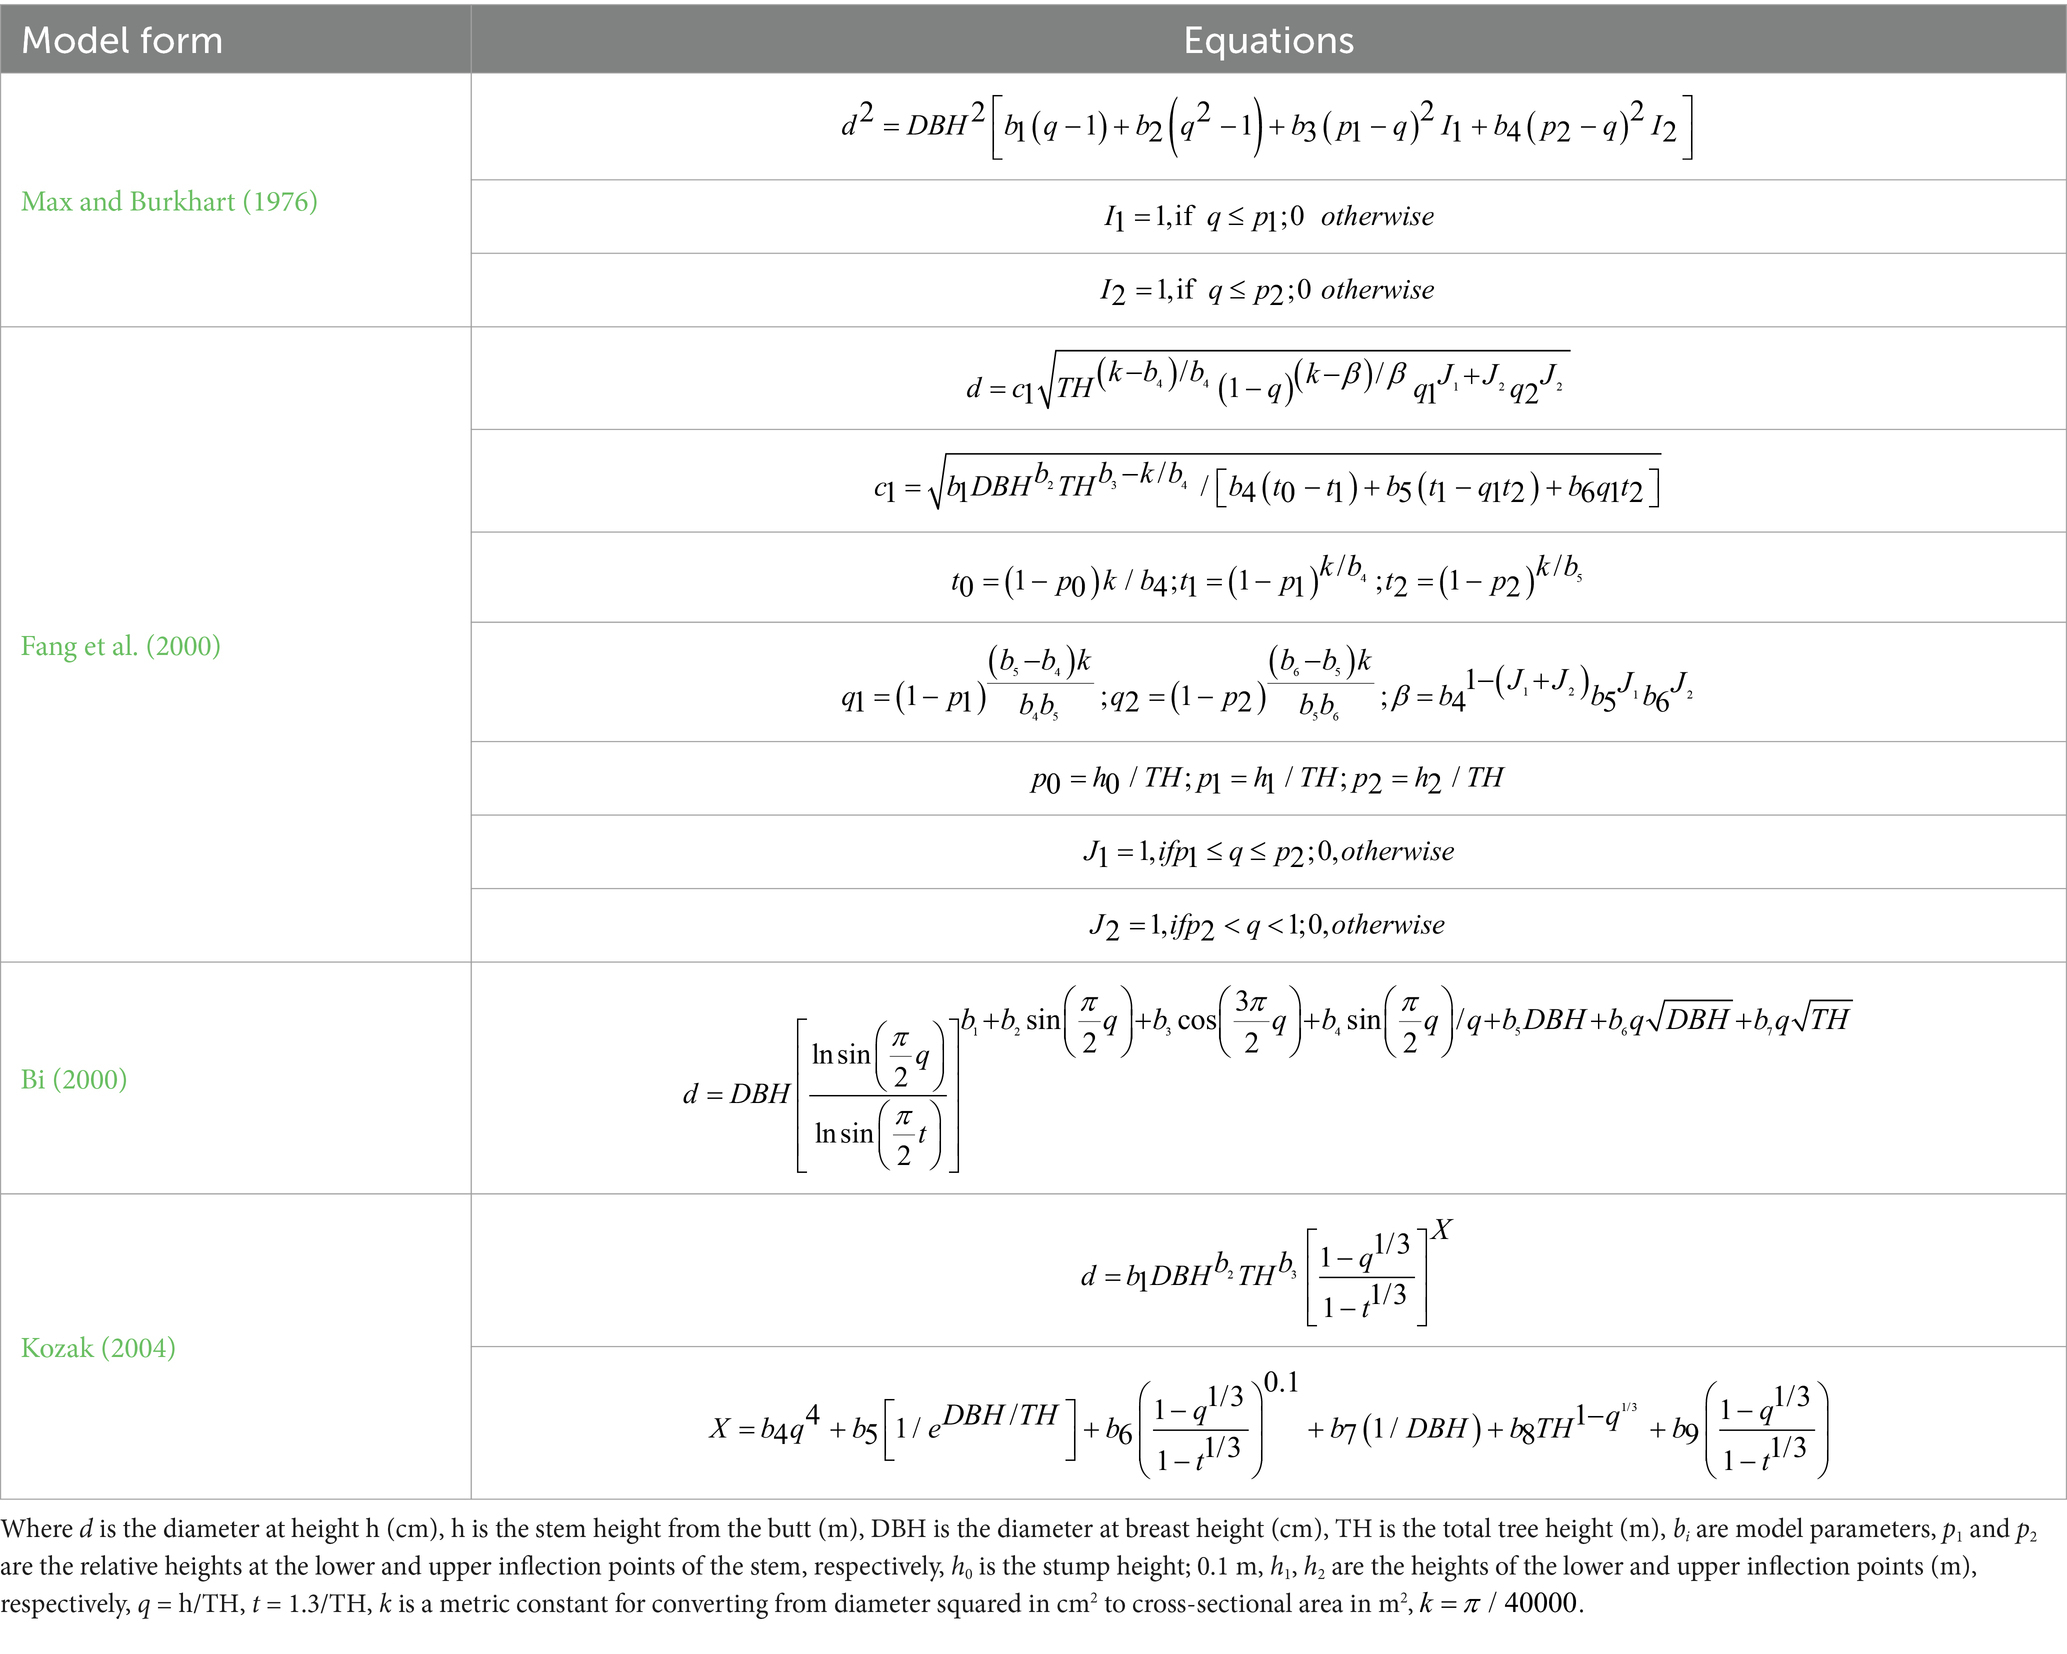
Table 3. Base taper model forms.
This study first established taper models for each thinning intensity of the stand initiation and stem exclusion stages based on the data obtained from the TLS. The SAS PROC MODEL procedure was used to fit the model, seemingly unrelated regression (SUR) was used to estimate the parameters, and the model with the highest accuracy according to the goodness-of-fit statistics was selected as the basic taper equation (SAS Institute Inc, 2020).
There may be some differences in stem form among plants of different ages and under different treatments. To improve the generality and applicability of the equation, a dummy variable method was used to construct a larch taper equation that could consider both age group and thinning intensity. Dummy variable processing is a method of treating qualitative factors or categorical variables and is widely used in forestry modeling (Zeng et al., 2011; Zhao et al., 2022a). For the optimal base taper model, a dummy variable S was constructed to represent the two age groups (Equation 2), and three dummy variables (P1, P2, P3) were set to identify the four thinning treatments (CK, L, M, H) (Equations 3–5):
In each thinning treatment of the stand initiation and stem exclusion stages, 80% of the samples were randomly selected for dummy model fitting, and the remaining 20% of the independent samples were used for validation. The coefficient of determination (R2, Equation 6), mean square error (MSE, Equation 7), root mean square error (RMSE, Equation 8), mean error (ME, Equation 9) and mean absolute bias (MAB, Equation 10) were used for model comparison and validation.
where and are the TLS-measured and TLS-predicted diameters at different heights, respectively; n is the total number of observations; is the mean of ; and p is the number of estimated parameters in a model.
This study directly used the data obtained from the TLS data (880 trees) from the thinning plots to calculate differences between trunk variables of different thinning intensities, including trunk size and form attributes such as DBH, TH, volume, slenderness (Equation 11), stem taper (Equation 12), form factor at breast height (Equation 13), and form quotient (Equation 14). In general, denser stands have greater slenderness and smaller stem tapers, as well as more plump trunks. The stem taper refers to the degree to which the diameter decreases with increasing height (Li, 2019). Both the form factor at breast height and the form quotient disregard the influence of tree size, directly revealing changes in stem shape. The form quotient is the ratio of the central diameter ( ) of the trunk to the DBH relative to the form factor, and it can be directly measured. In this study, tree volume was calculated via numeric integration of the taper model with dummy variables. Analysis of variance (ANOVA) and Tukey’s honest significance test were used to check for statistically significant differences (p value <0.05) in stem size and form attributes between different thinning treatments in the stand initiation and stem exclusion stages.
where DBH is the diameter at breast height (cm), TH is the total tree height (m), is the diameter (cm) of the tree at stump height (0.1 m), is the diameter at 50% of tree height, and is the stump height, 0.1 m.
3 Results
3.1 Stem form measurements with TLS
The stem diameters captured by TLS were in close agreement with the field stem analysis data (Figure 2A), and the error range of each relative height was −2 cm to 2 cm (Figure 2B), except for some positions at 0 m and a relative height of 2%. The error range of the DBH was −0.57 cm to 0.59 cm, the mean bias was 0.12 cm, and the identification precision was 99.24%. The error range of the tree height was −0.36 m to 0.71 m, the mean bias was 0.13 m, and the identification precision was 99.29%. Compared with those of the field stem analysis, the slope and R2 of the measurements captured with the TLS were 0.899 and 0.9695, the mean bias was 0.14 cm, and the identification precision was 98.05%. There was a slight negative bias in the bottom diameter and a slight positive bias in the upper diameter, which resulted in TLS underestimating the bottom stem and overestimating the upper stem. The stumps in contact with the ground swelled, resulting in a large bias (greater than 3 cm). There were gradual decreases in the total number of diameter measurements as height and therefore distance from the laser scanner increased. On average, in the stand initiation stage, the study was able to measure the stem diameter to a relative height of approximately 70% of the way up the stem, and in the stem exclusion stage, the study was able to measure the diameter to a height of approximately 80%. Overall, TLSs accurately and reliably estimate stem diameter, suggesting that they can be used for measuring stem size and form.

Figure 2. One-to-one plot showing the diameters captured via TLS via stem analysis (A) and the errors at each relative height (B).
3.2 Parameter estimation and evaluation of the base taper model
Taper models were developed for the stand initiation and stem exclusion stages of each thinning treatment. The model parameters and fitting criteria are shown in Tables 4, 5. For the Max and Burkhart (1976) segmented taper model, the lower inflection point in the stand initiation stage was greater than that in the stem exclusion stage (the lower inflection point of the stand initiation stage was greater than 6% of the relative height, and the lower inflection point of the stand initiation stage was less than 6% of the relative height), and the upper inflection point was not much different. For the Fang et al. (2000) segmented taper model, the inflection points of the stand initiation and stem exclusion stages were almost the same. The lower and upper inflection points of the Fang et al. (2000) equation were generally lower than those of Max and Burkhart (1976), where the difference in upper inflection points was approximately 10% of the trunk. Overall, two parameters (b7 and b8) of the Bi (2000) model were not significant in the stand initiation stage.
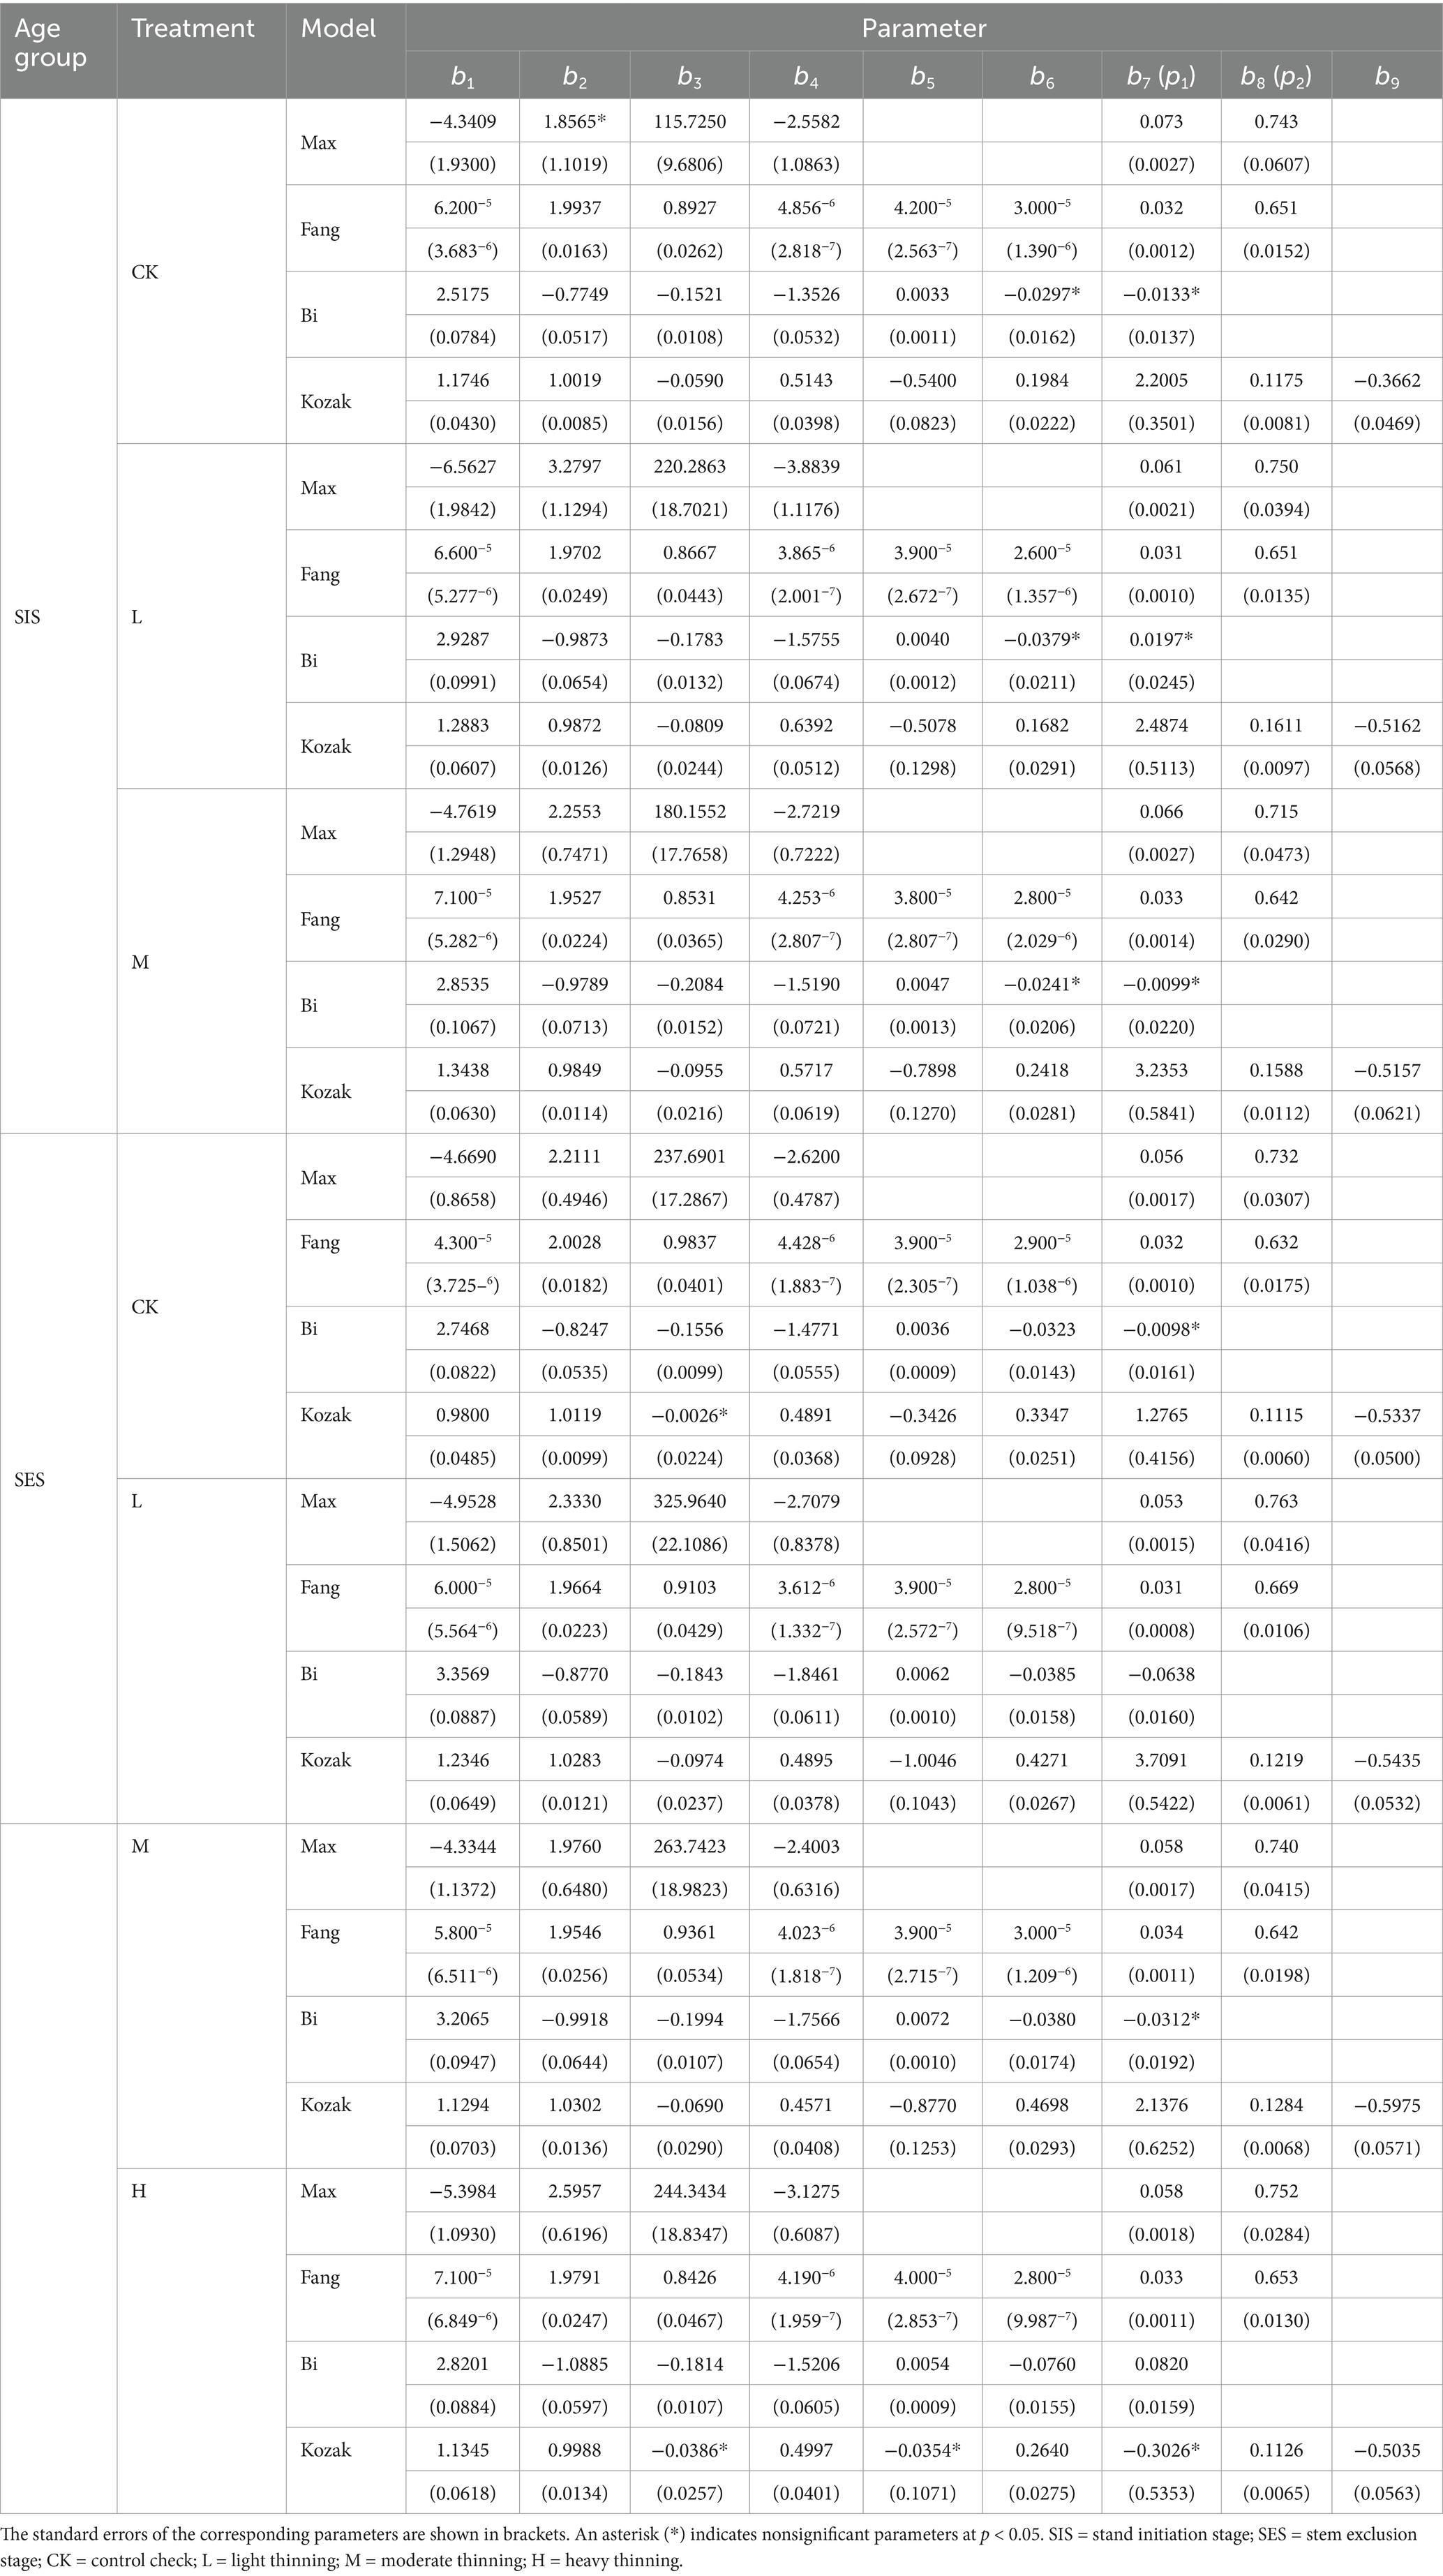
Table 4. Parameter estimates (standard errors) for taper models based on datasets from the stand initiation and stem exclusion stages of different thinning treatments.
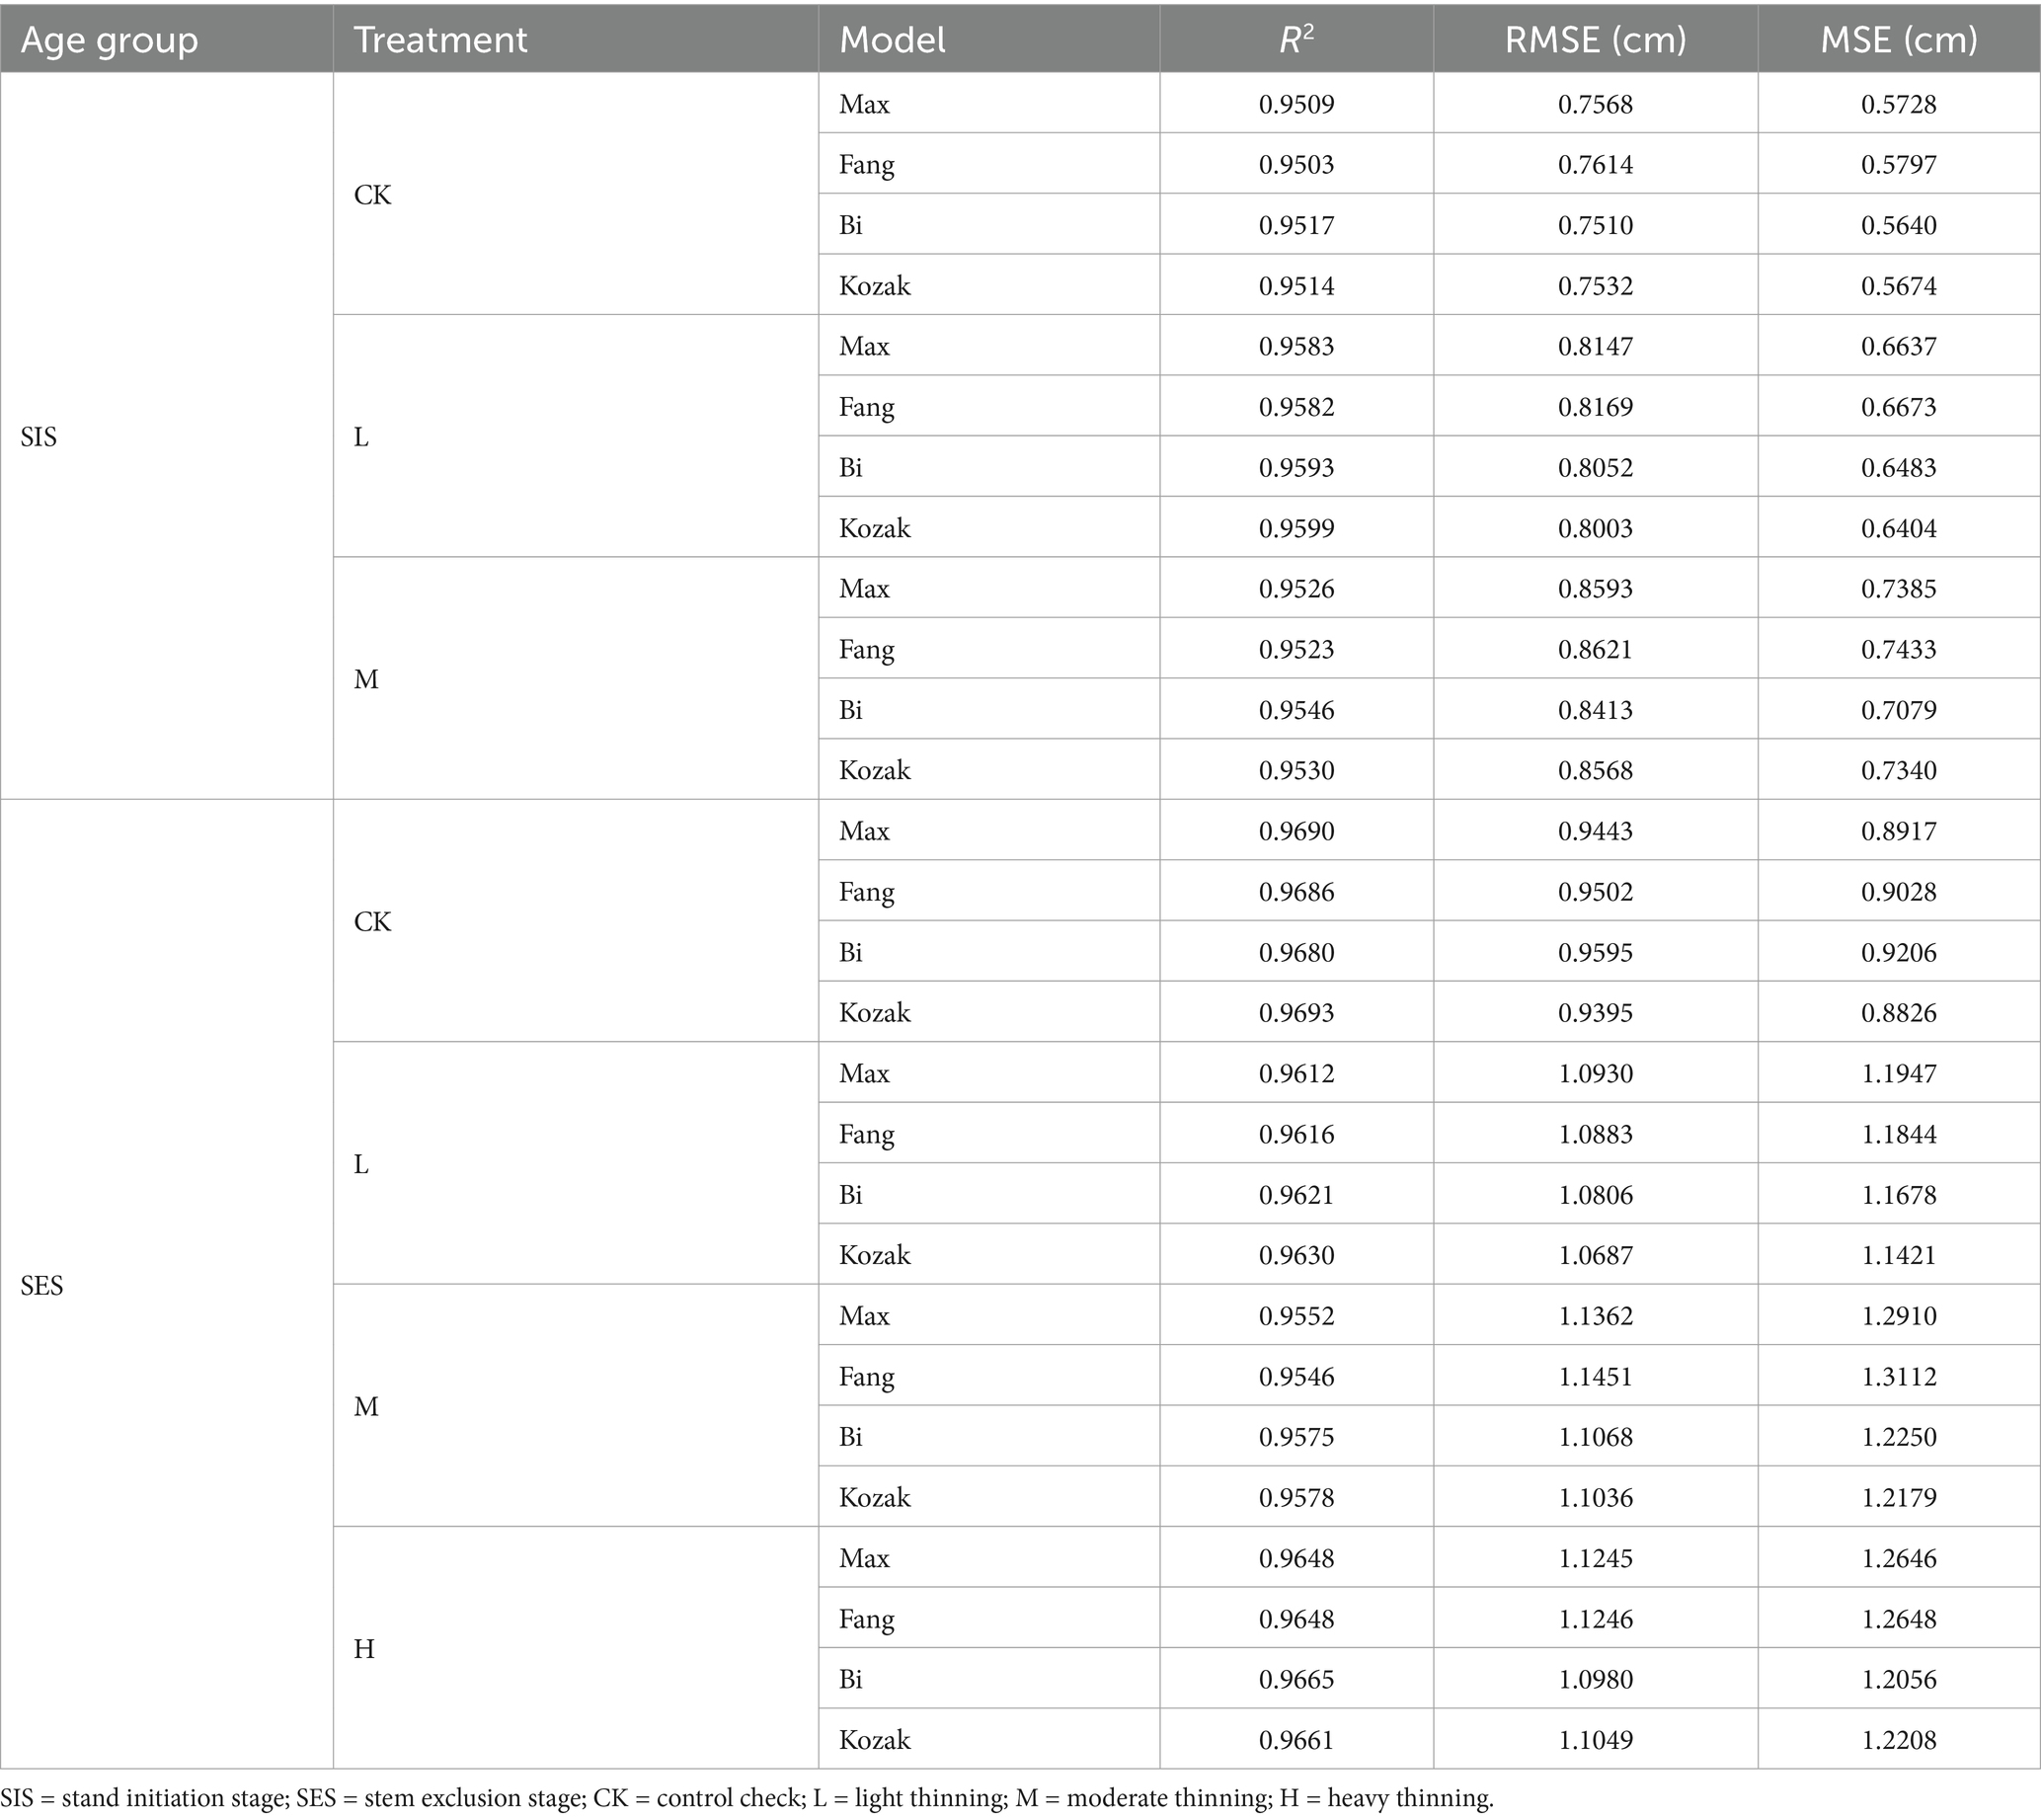
Table 5. Goodness-of-fit statistics of the base taper models analyzed.
In this study, the taper models for all age groups and thinning treatments provided good data fit and explained more than 95% of the variation in stem diameter (Table 5). The R2 values of the stem exclusion stage (except for moderate thinning) were generally greater than those of the stand initiation stage. The Kozak, 2004 and Bi (2000) equations exhibited good fitting effects and generally outperformed segmented models. In the stand initiation stage, the RMSE was less than 0.9 cm, while in the stem exclusion stage, it was approximately 1 cm. The RMSE and MSE gradually increased with increasing DBH.
3.3 Performance of dummy variable models
Dummy variable taper models considering age group and thinning treatment were developed based on the Kozak (2004) and Bi (2000) equations with high fitting accuracy and tested with samples not involved in the modeling. The nonsignificant parameters were removed (p value >0.05), and the final parameter estimates and evaluation statistics of the model are shown in Table 6. R2, MSE, and RMSE measure goodness-of-fit, while ME and MAB are test indicators. The table shows that the performance of the dummy variables model was slightly better than that of the basic model of the stand initiation stage and not much different from that of the base model of the stem exclusion stage. Both dummy variable models explained more than 96% of the stem shape variation, but the Kozak (2004) equation performed slightly better than Bi (2000) (Kozak (2004): R2 = 0.9659; Bi (2000): R2 = 0.9657). The ME of the test indices was greater than 0, indicating that the diameter predictions were underestimated. After combining these results, this study selected Kozak (2004) as the optimal taper model for larch.
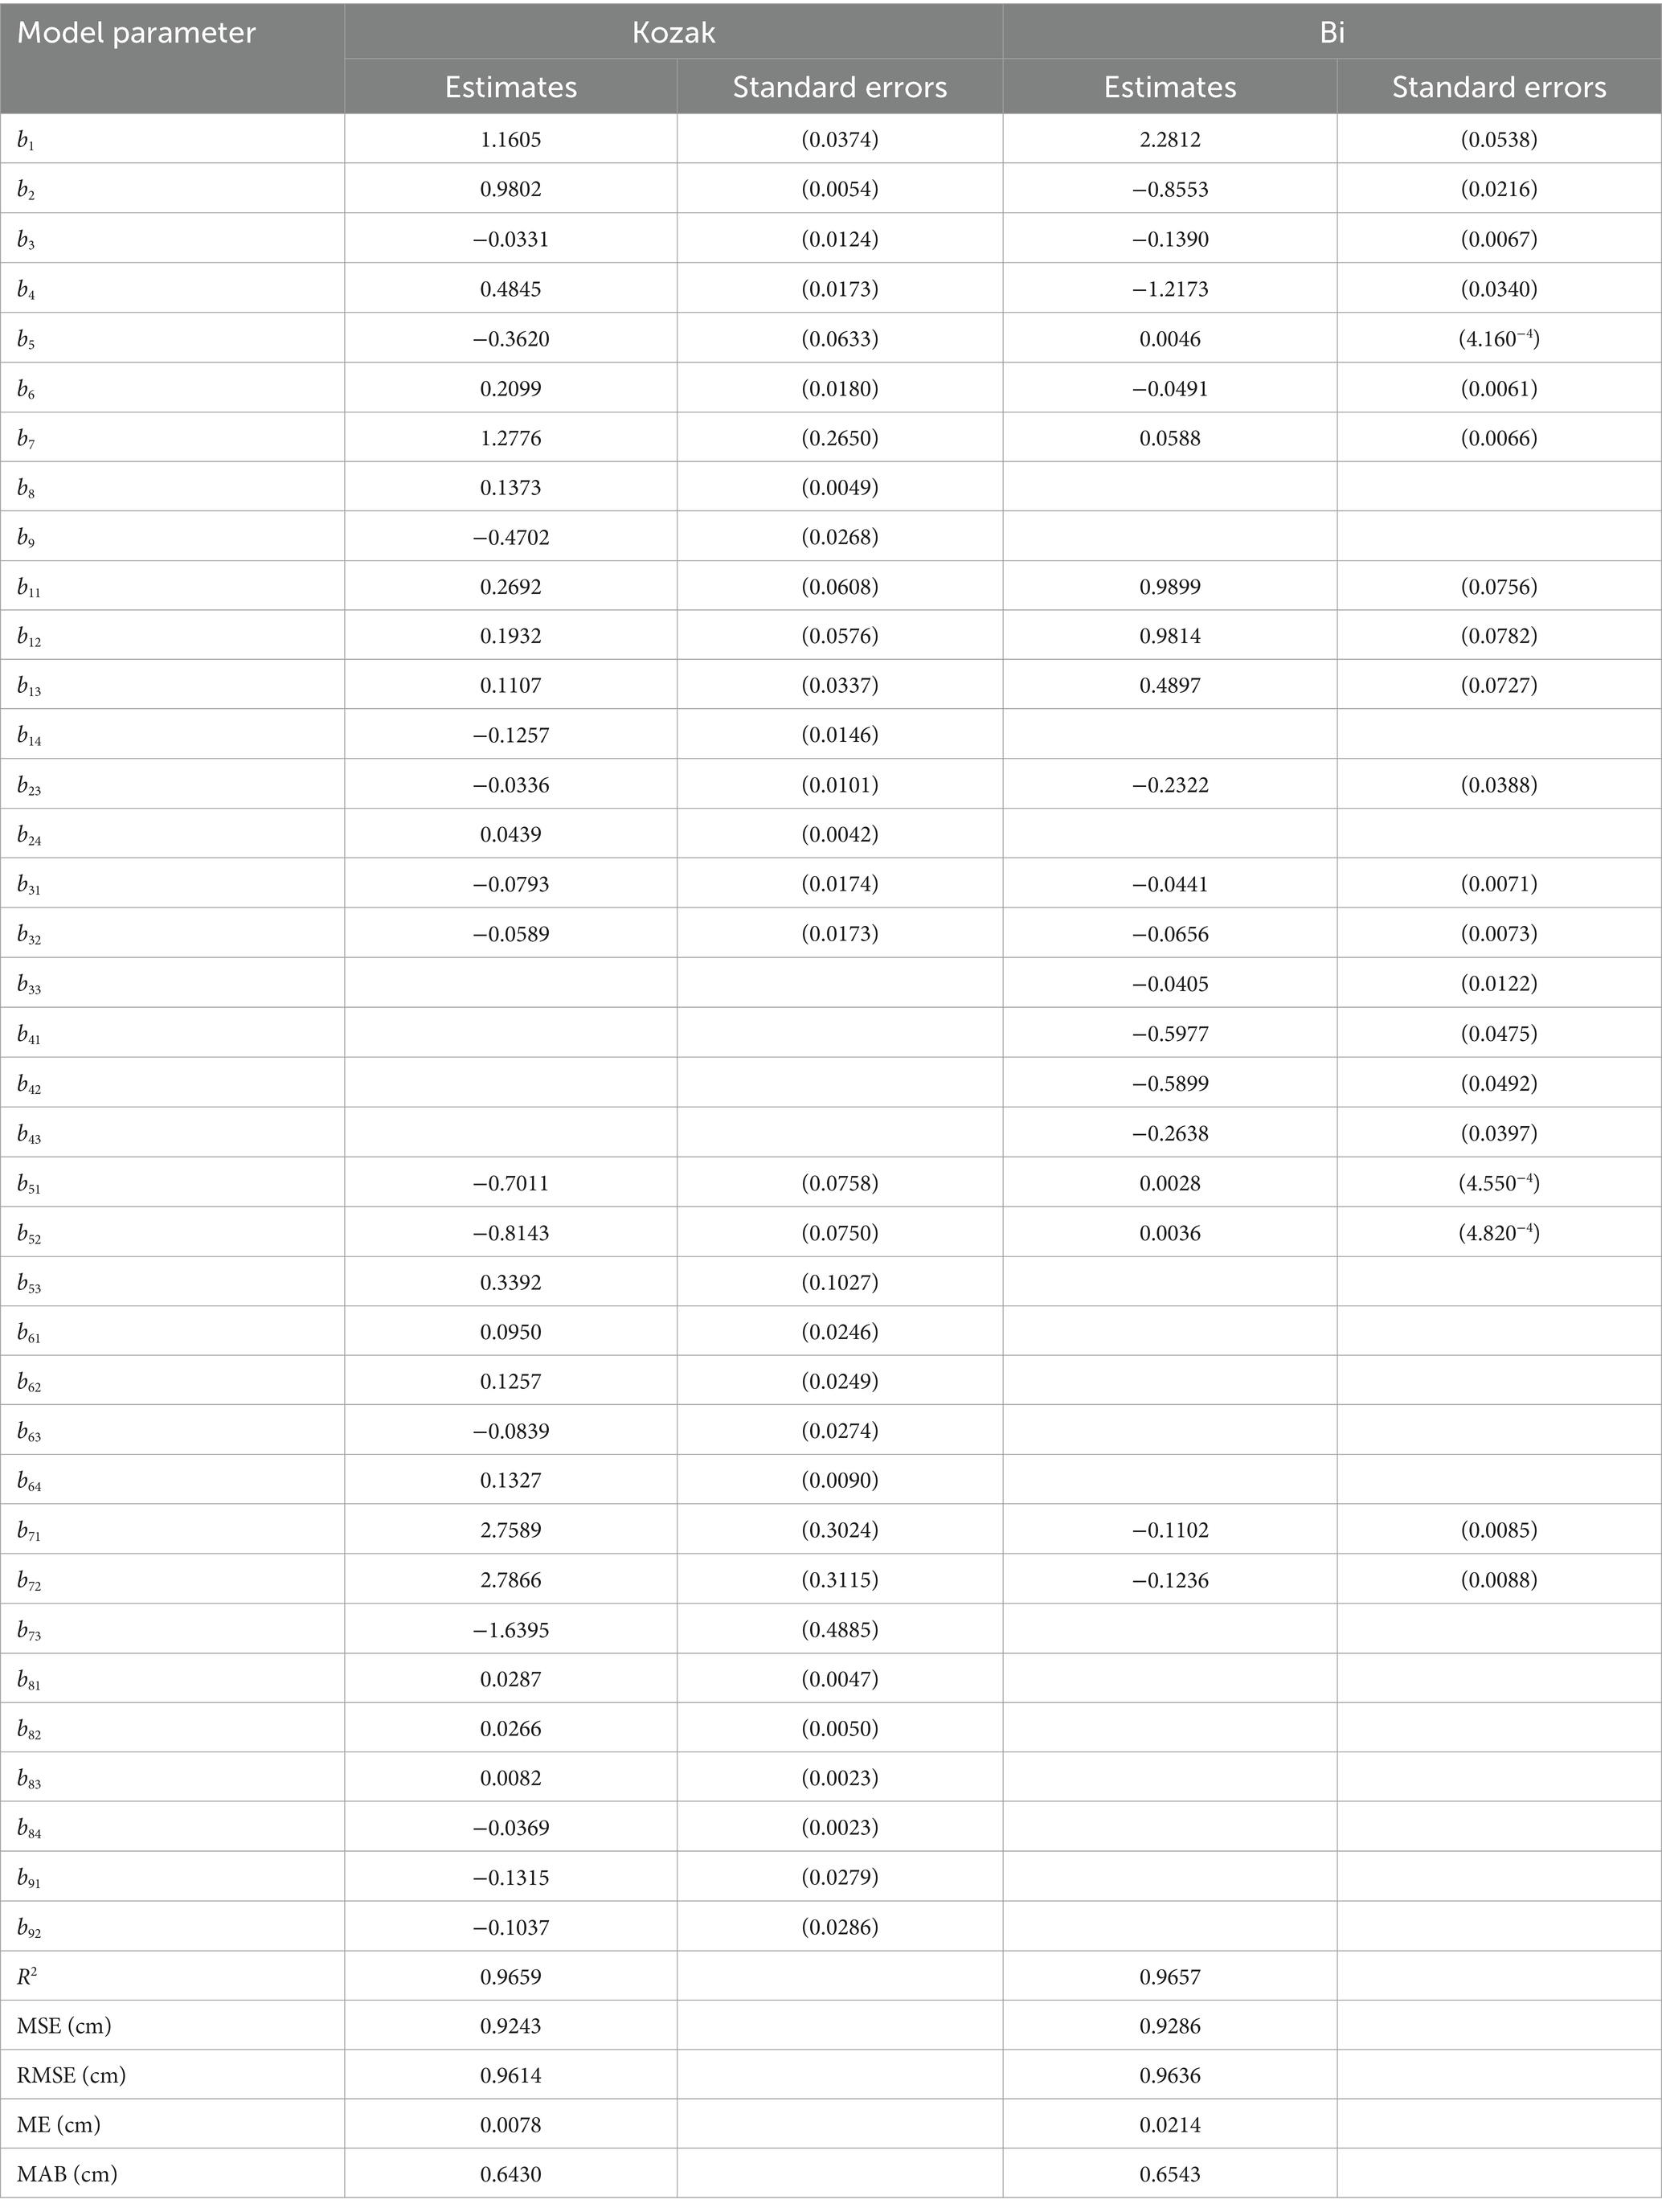
Table 6. Correlation parameters and evaluation statistics of the dummy variable models.
Overall, there was a homogeneous distribution of the residuals of the dummy variable model (Figure 3), and no heteroscedasticity was detected, indicating that the model yielded good predictions. Consistent with the results of the basic model, the residual distributions of moderate thinning in the stand initiation stage and control stage of the stem exclusion stage were more concentrated, indicating that the generalized dummy variable model this study developed had the same performance as the model fitted separately for each thinning intensity in the different age groups.
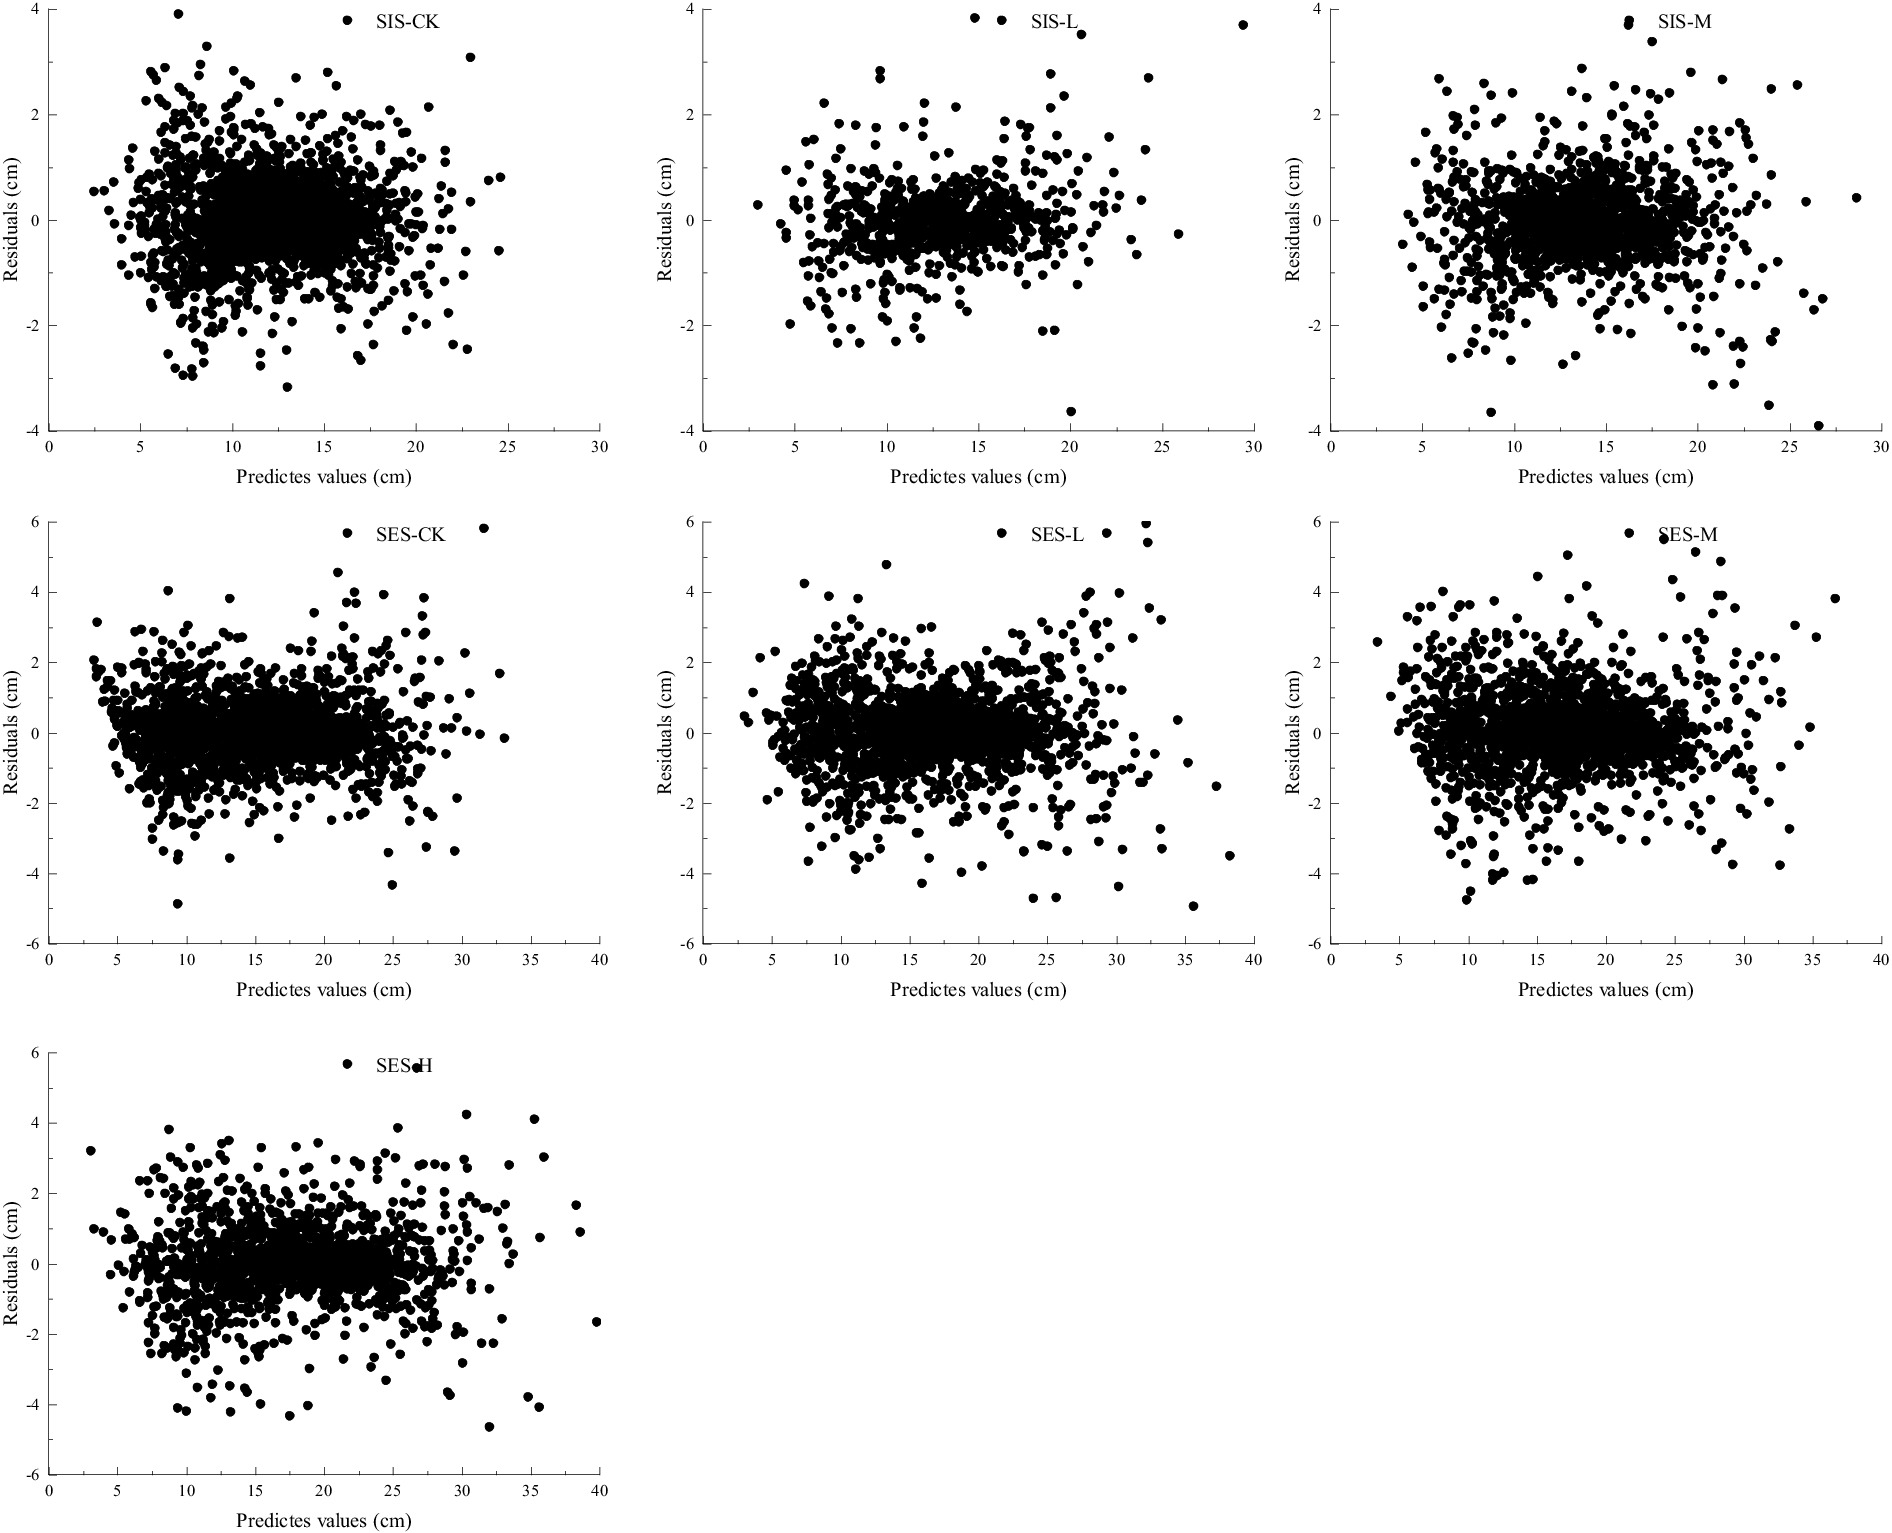
Figure 3. Residual scatterplot of estimated diameter by age group and thinning intensity class of the Kozak (2004) dummy variable model analyzed. SIS = stand initiation stage; SES = stem exclusion stage; CK = control check; L = light thinning; M = moderate thinning; H = heavy thinning.
3.4 Stem size and form
The stem size and form at the stand initiation and stem exclusion stages under the different thinning intensities are shown in Figure 4. Single tree volume was calculated by numeric integration using the parameters of the Kozak (2004) dummy variable model. Thinning significantly promoted tree growth, and DBH gradually increased with increasing thinning intensity. Thinning affected the height growth of small trees, and light thinning and moderate thinning had similar effects on tree height and volume in the stem exclusion stage. Trees in the stand initiation stage are in a period of vigorous growth, and there was no significant difference in individual tree volume for different thinning intensities. In the stem exclusion stage, the growth rate of both diameter and height peaked, and the effect of thinning on tree size was obvious; that is, compared with the control conditions, thinning promoted the growth of DBH, TH and volume, with greater thinning intensity leading to greater growth.
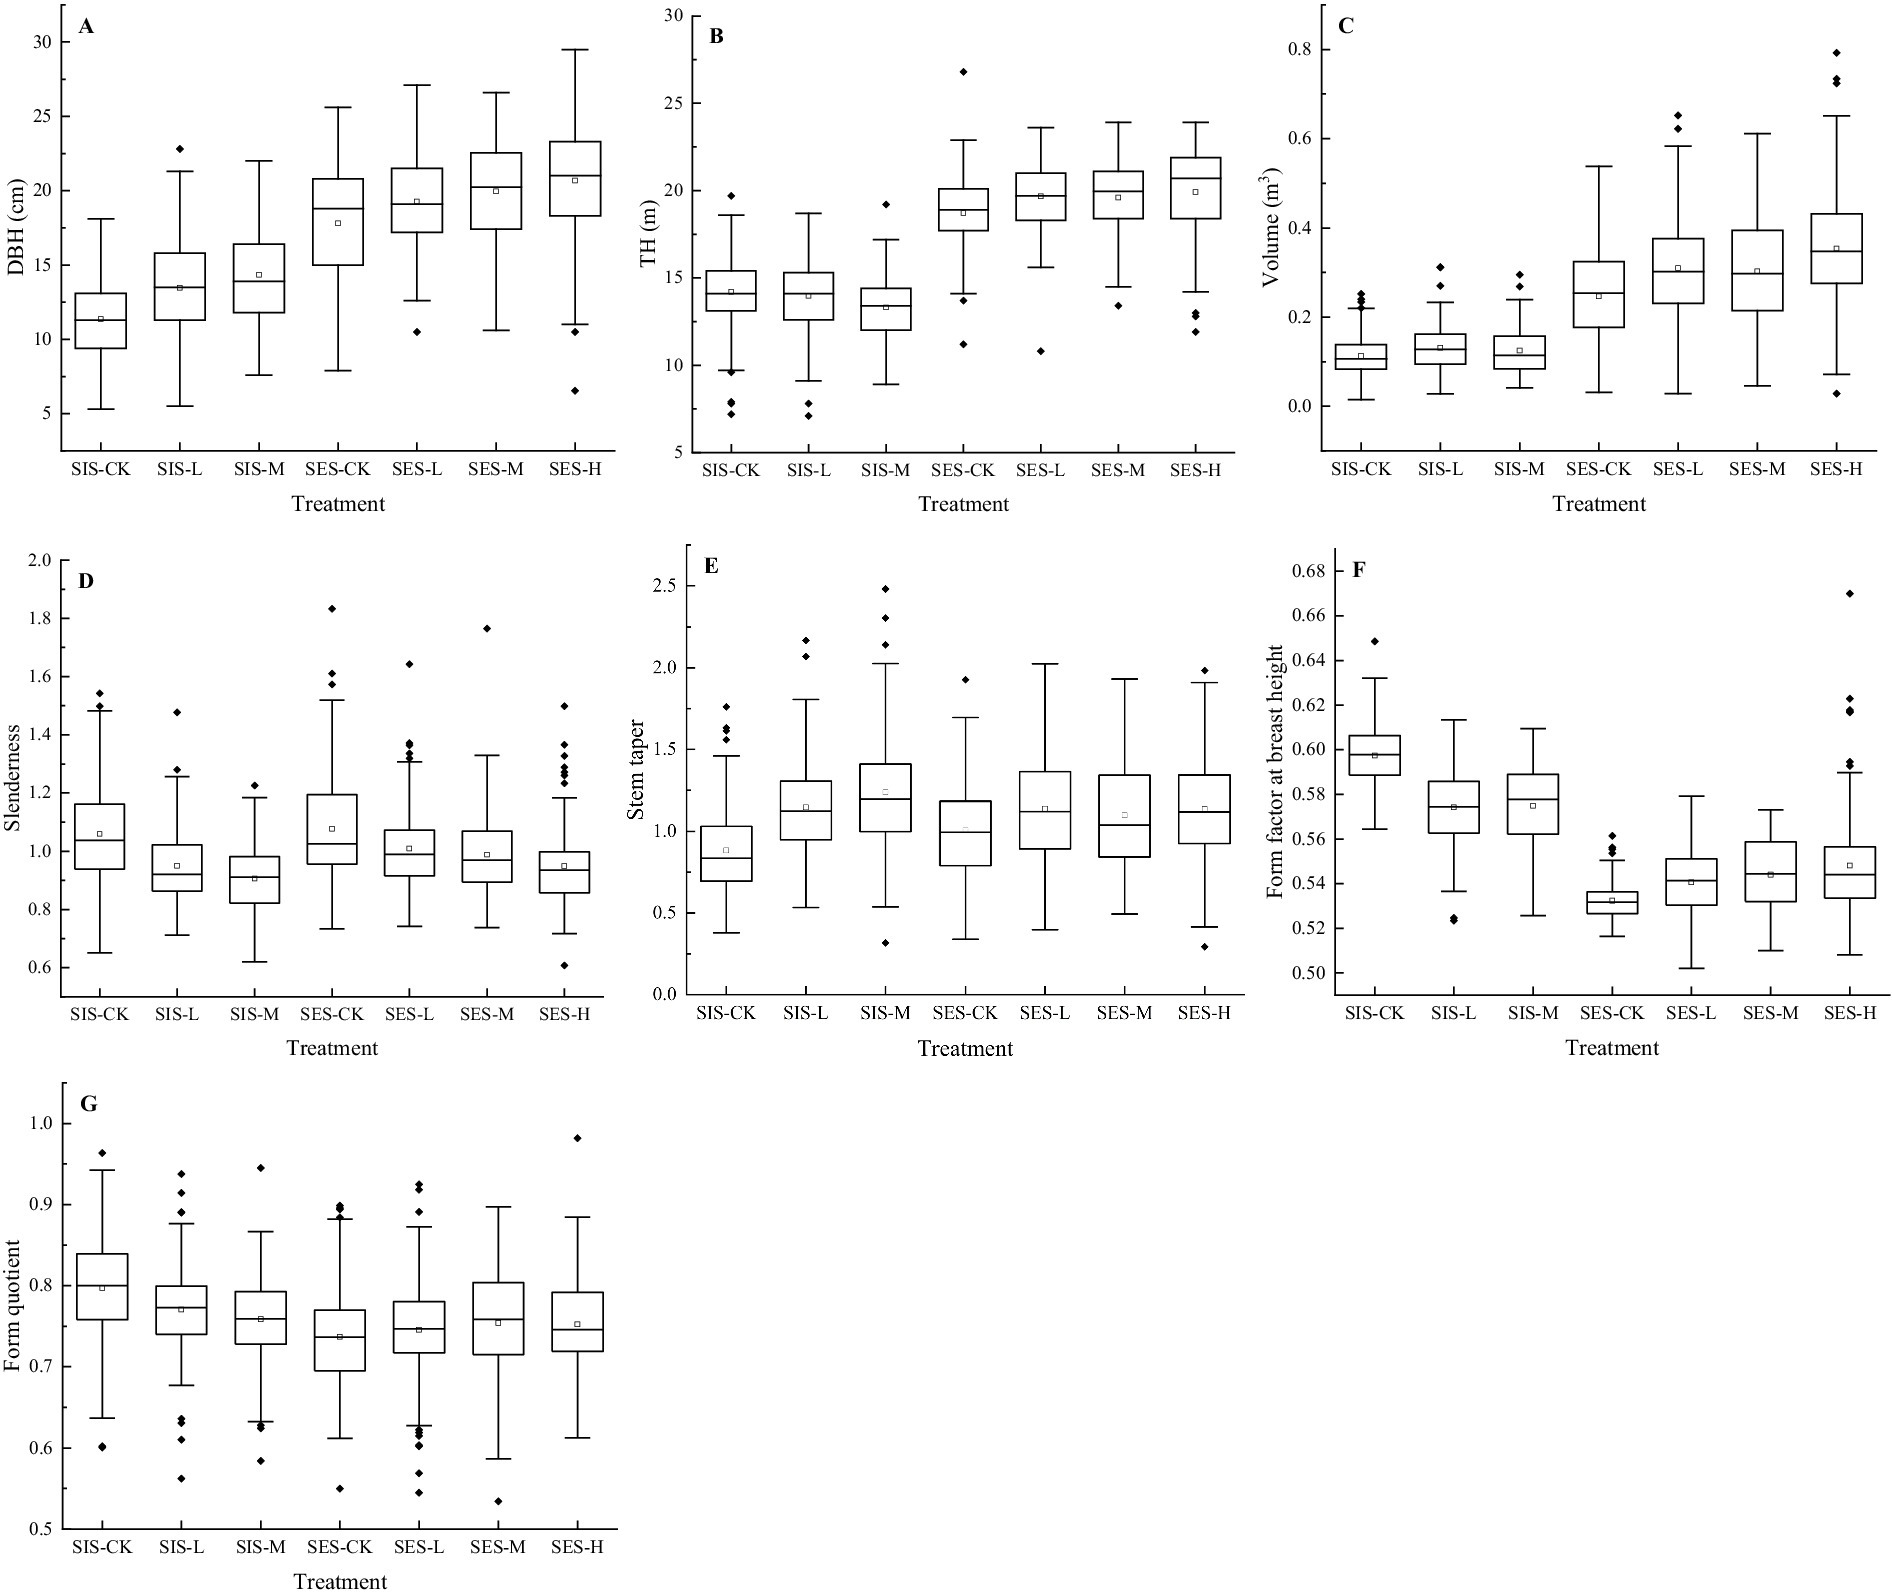
Figure 4. Stem attributes [DBH (A), TH (B), volume (C), slenderness (D), stem tapering (E), form factor at breast height (F), and form quotient (G)] caused by each thinning treatment in the stand initiation and stem exclusion stages. SIS = stand initiation stage; SES = stem exclusion stage; CK = control check; L = light thinning; M = moderate thinning; H = heavy thinning.
As found in previous studies (Mäkinen and Isomäki, 2004), the slenderness increased with increasing stand density; that is, the greater the thinning intensity was, the lower the slenderness was, and thinning intensity had a significant impact on the slenderness, especially in the stem exclusion stage. In terms of the effect of thinning intensity on stem form, the stem taper response was more sensitive at the stand initiation stage, and the stem taper value significantly increased with thinning, while the stem exclusion stage also increased, but the difference was slight (Table 7 and Figure 4). The form factor at breast height of small trees is generally greater than that of large trees, but their response to thinning is different: thinning reduces the breast height of small trees and increases the breast height of large trees. The form quotient appeared to be greater in small trees than in large trees, while no statistically significant difference between different thinning intensities in the stem exclusion stage was found.
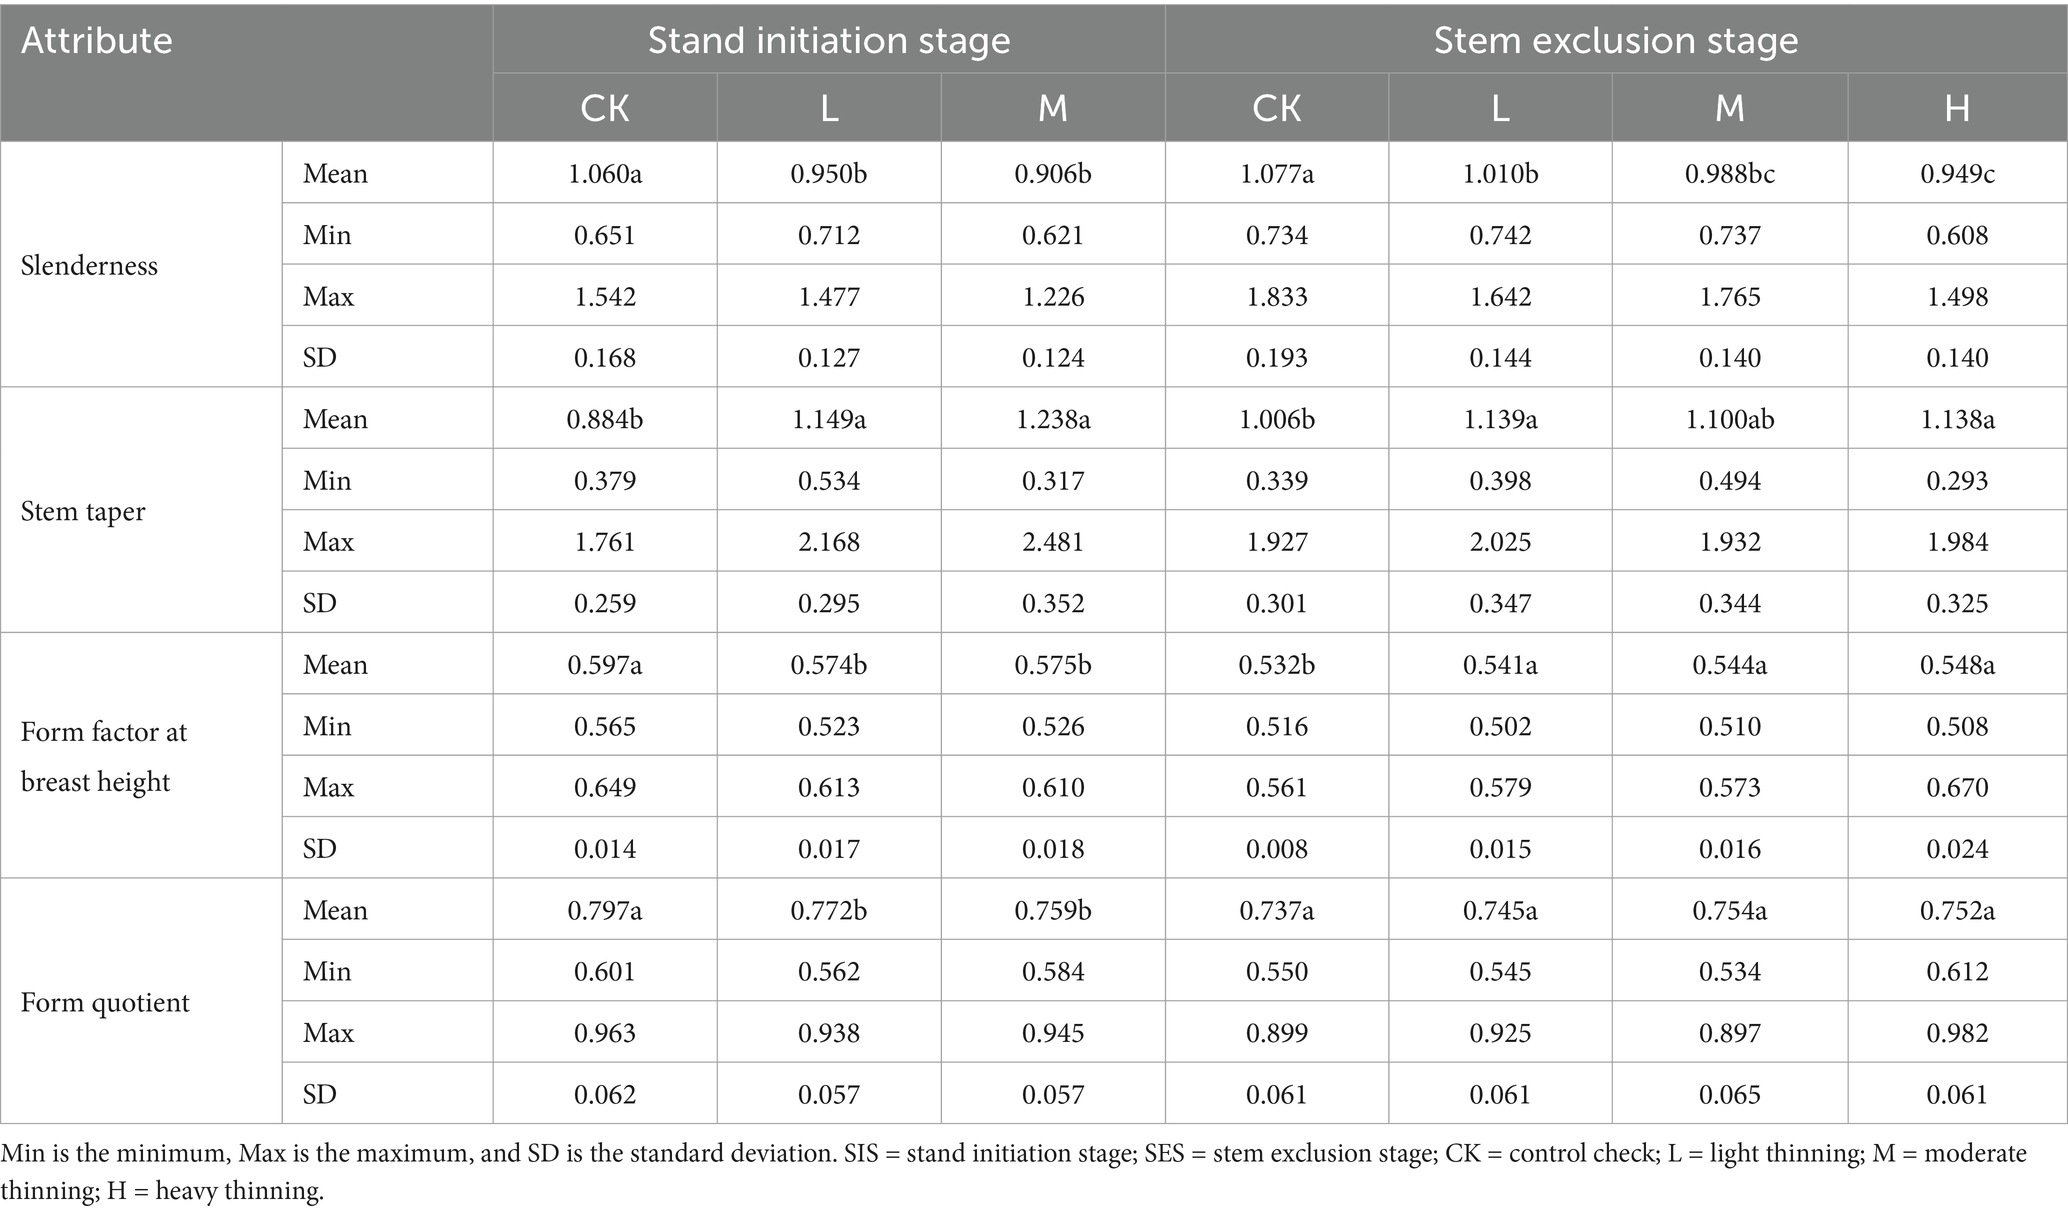
Table 7. Mean, minimum, maximum and standard deviation of stem attributes (slenderness, stem taper, form factor at breast height, and form quotient) between thinning treatments in the stand initiation and stem exclusion stages.
The stem curves were simulated using the parameters of the dummy variable model and the stand’s mean DBH and mean tree height (from TLS measurements) of each thinning treatment for the stand initiation and stem exclusion stages (Figure 5). For the stand initiation stage, compared with the control, light and moderate thinning resulted in larger stem bottoms (below a relative height of 60%). Light thinning resulted in a more slender stem form than moderate thinning because at the top of the stem, the upper stem diameter decreased more slowly. During the stem exclusion stage, thinning promoted an increase in the diameter of the middle section (relative height of 10–70%), and heavy thinning increased the sensitivity of the upper stem; above a relative height of 80%, the diameter under heavy thinning was smaller than that under moderate thinning; above a relative height of 90%, the diameter under heavy thinning was even smaller than that under light thinning. The stem form under light thinning was similar to that under moderate thinning, and the stem size under moderate thinning was slightly larger than that under light thinning.
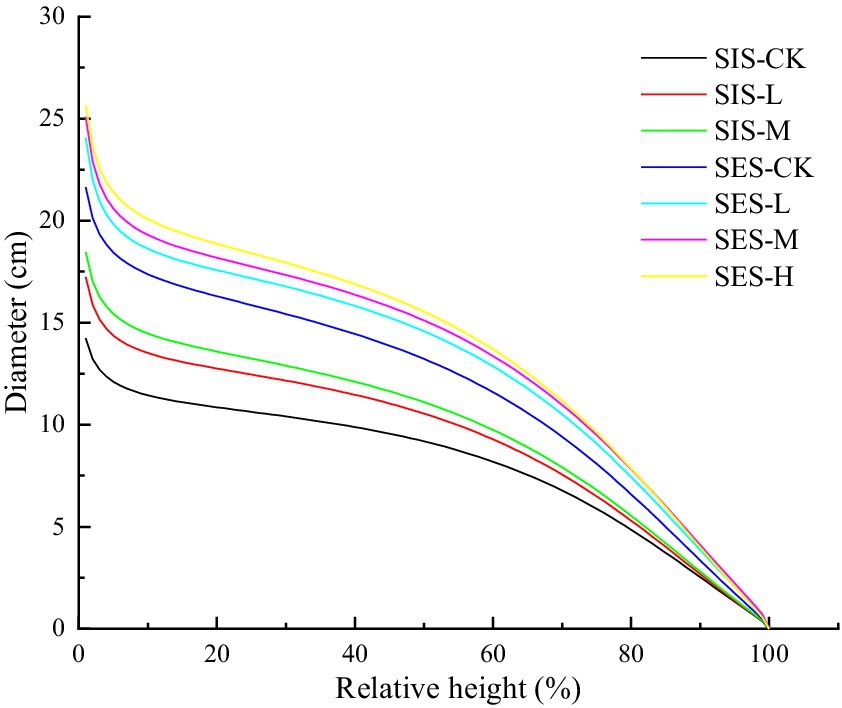
Figure 5. Stem curves of each thinning treatment for the stand initiation and stem exclusion stages. SIS = stand initiation stage; SES = stem exclusion stage; CK = control check; L = light thinning; M = moderate thinning; H = heavy thinning.
4 Discussion
This study used the least squares method to manually extract diameters because the study objects were larch plantations during the stand initiation and stem exclusion stages with more small trees and relatively complex understory vegetation, so the visual interpretation method could be used to effectively identify more targets. This study also applied the Hough transformation to extract the diameter automatically (Simonse et al., 2003), but the results were not satisfactory. Compared with those in the stand initiation stage, the understory conditions in the stem exclusion stage are relatively simple, and the tree size is larger. Therefore, the height and accuracy of stem diameter acquisition in these stands were better than those in the stand initiation stage, which was reflected in the fitting of the base taper model; that is, the goodness-of-fit of the stem exclusion stage was greater than that of young forests. This is consistent with the findings of Stovall et al. (2023), who reported that TLSs had good characteristics of two-thirds of the stem form and tended to slightly underestimate the diameter. Adequate capture of the upper stem by TLSs is challenging due to occlusion by branches, leaves, and understory shrubs. On average, in the stand initiation stage, it was able to measure stem diameter to a relative height of approximately 70% of the way up the stem of a tree, and in the stem exclusion stage, it was able to measure up to 80%. The measurement error gradually increased with increasing height from the ground.
TLS can rapidly capture forest 3D scenes and, in most cases, produces very accurate stem diameter data, so this study used four taper models to characterize the form of large and small trees. The fitting effects of the four taper models on the stand initiation and stem exclusion stages with varying thinning treatments were similar. In the stand initiation stage, light thinning had the greatest goodness-of-fit, and the control conditions had the greatest effect in the stem exclusion stage. This study found that larger trees fit better than smaller trees, probably because the occlusion effect in complex scenes in the stand initiation stage leads to uncertainty in diameter acquisition, which, in turn, leads to bias in model predictions. In previous studies (Corral-Rivas et al., 2007; Hussain et al., 2020), segmented models usually outperformed the variable-exponent model and trigonometric form model because they used destructive sampled data with complete trunk diameters (especially upper stem diameters). In this study, the segmented model was unable to accurately predict the upper inflection point due to insufficient data on the upper stem diameter (relative height of 80–100%). The Kozak (2004) and Bi (2000) models are highly flexible and robust and are more suitable for developing stem taper models of larch captured by TLS than are the other two examined models (Bi, 2000; McTague and Weiskittel, 2021). The dummy variable model considering age and thinning intensity can be used to explain the diameter variation of large and small trees well, with a smaller ME (less than 0.01 cm) when implemented with the Kozak (2004) model compared to the Bi (2000) model. The residual scatterplot shows that the prediction performance of the Kozak (2004) dummy variable model for each thinning intensity of large and small trees was consistent with that of the base model. In other words, the dummy variable model this study developed can reduce the modeling process for different scenarios with reliable prediction accuracy.
In this study, the TLS measurements were conducted in the seventh year after the thinning treatment, and the thinning effect on the trees was clearly visible (Benedetti-Ruiz et al., 2023). This research confirms earlier findings that thinning promotes tree growth and that stands with high thinning intensity and low density have greater individual tree growth. During the stand initiation stage, the rate of increase in DBH was greater. Although moderate thinning reduces competition among trees, it seems to have a negative impact on the increase in tree height. As trees grow, branches and leaves are maintained, and more biomass is invested in stems (Qu et al., 2022). When the forest reaches the stage of stem exclusion, the tree height growth rate also reaches its peak, and the tree size in this phase is positively correlated with thinning intensity; that is, the greater the thinning intensity is, the faster the subsequent growth rate. From the perspective of volume estimation, the volume of a single tree in the moderate thinning stage was greater than that in the moderate thinning stage, and the difference between the light and moderate thinning stages in the stem exclusion stage was slight, but the difference in the heavy thinning stage was significantly greater than that in the other treatments. As shown in Figure 4D,E, slenderness and the stem taper did not appear to be strongly related to age but were significantly correlated with thinning intensity, with denser stands having sharper trunks. The form factor at breast height was smaller in the stem exclusion stage because most of the volume of large trees was concentrated in the lower part of the stem, and the cumulative volume from stump to tip was more sensitive to the bottom part of the stem (Stovall et al., 2023). The present study found that thinning intensity had no significant effect on the form quotient, except for the control in the stand initiation stage, which was consistent with the results of Saarinen et al. (2020). Other studies have reported similar findings (Saarinen et al., 2020; Wagle et al., 2022; Benedetti-Ruiz et al., 2023).
Compared with the control check, thinning resulted in greater stem growth in the bottom part of the stand initiation stage and the intermediate section of the stem exclusion stage. Moreover, a greater thinning intensity led to a greater diameter of the taper curve in the bottom part of the stand initiation stage and the intermediate section of the stem exclusion stage. In other words, more volume and biomass can be expected to be allocated to stems than to branches and leaves in plots with high thinning intensity (Saarinen et al., 2020; Qu et al., 2022). In terms of stem diameter, high-intensity thinning resulted in larger stems in both the stand initiation and stem exclusion stages. However, in terms of stem form, the overall stem properties under light and moderate thinning were better. Excessive thinning may result in a lower average stem diameter of all the trees (standing and removed combined), a larger taper, and thicker branches in the lower parts (Mäkinen and Isomäki, 2004; Zhang et al., 2009).
5 Conclusion
Traditional destructive tree stem analyses are laborious. The present study obtained satisfactory results for detecting stem size and form using TLS data, indicating that TLS provides a nondestructive, accurate, and cost-effective means of measuring stem variables. The results showed that TLS yielded more accurate measurements for large trees with simple understory conditions and lower accuracies for small trees in the stand initiation stage with many shrubs and branches and leaves. This study illustrates that the Kozak (2004) variable-exponent taper model has broader applicability in situations when TLS fails in measuring upper stem diameters. This study suggests using the dummy variable approach for modeling the stem shape of different age groups and thinning treatments, as this method is more cost-effective than simulating each thinning treatment individually while ensuring accuracy.
In the stand initiation stage, moderate thinning led to a larger stem taper, while in the stem exclusion stage, light thinning had a greater effect. This study found that the slenderness decreased with increasing thinning intensity, which was independent of age. The form factor at breast height was significantly correlated with age but not with thinning intensity; that is, small trees had a larger form factor at breast height, while larger trees had a smaller form factor. The effect of thinning on stem volume was mainly in the bottom and intermediate parts of the stem, indicating that thinning influenced the allocation of tree component biomass to stem growth and that more carbon was sequestered in the stem. In summary, TLS exhibited better performance than traditional destructive sampling approaches in developing stem taper models and detecting stem shape and size and is the preferred instrument of choice for nondestructive and precise forest inventories and management decisions. This study was performed in only two age groups, and in the future, it would be interesting to further investigate the response of the understory reinitiation and the old-growth stages to various thinning treatments to meet the needs of thinning management for larch throughout its life cycle.
Data availability statement
The raw data supporting the conclusions of this article will be made available by the authors, without undue reservation.
Author contributions
DL: Data curation, Investigation, Software, Visualization, Writing – original draft, Writing – review & editing, Methodology. WJ: Conceptualization, Formal analysis, Funding acquisition, Methodology, Supervision, Writing – review & editing, Project administration, Validation. FL: Conceptualization, Formal analysis, Methodology, Writing – review & editing. HG: Data curation, Investigation, Methodology, Software, Writing – review & editing, Validation. FW: Data curation, Investigation, Validation, Writing – review & editing. XZ: Investigation, Methodology, Software, Writing – review & editing.
Funding
The author(s) declare that financial support was received for the research, authorship, and/or publication of this article. This work was supported by the China National Key Research and Development Program (grant no. 2023YFD2200802) and the Special Fund Project for Basic Research in Central Universities (grant no. 2572019CP08).
Acknowledgments
We thank the Linkou Forestry Bureau and its staff for their help in the field activities. We would like to thank the editor, associate editor, and all reviewers for their helpful feedback and valuable suggestions.
Conflict of interest
The authors declare that the research was conducted in the absence of any commercial or financial relationships that could be construed as a potential conflict of interest.
Publisher’s note
All claims expressed in this article are solely those of the authors and do not necessarily represent those of their affiliated organizations, or those of the publisher, the editors and the reviewers. Any product that may be evaluated in this article, or claim that may be made by its manufacturer, is not guaranteed or endorsed by the publisher.
References
Abegg, M., Bösch, R., Kükenbrink, D., and Morsdorf, F. (2023). Tree volume estimation with terrestrial laser scanning—testing for bias in a 3D virtual environment. Agric. For. Meteorol. 331:109348. doi: 10.1016/j.agrformet.2023.109348
Albrecht, A., Hanewinkel, M., Bauhus, J., and Kohnle, U. (2012). How does silviculture affect storm damage in forests of South-Western Germany? Results from empirical modeling based on long-term observations. Eur. J. For. Res. 131, 229–247. doi: 10.1007/s10342-010-0432-x
Alvarez, J. A., Villagra, P. E., Villalba, R., and Debandi, G. (2013). Effects of the pruning intensity and tree size on multi-stemmed Prosopis flexuosa trees in the Central Monte, Argentina. For. Ecol. Manag. 310, 857–864. doi: 10.1016/j.foreco.2013.09.033
Beadle, C., Barry, K., Hardiyanto, E., Irianto, R., Junarto,, Mohammed, C., et al. (2007). Effect of pruning Acacia mangium on growth, form and heart rot. For. Ecol. Manag. 238, 261–267. doi: 10.1016/j.foreco.2006.10.017
Benedetti-Ruiz, S., Loewe-Muñoz, V., Del Río, R., Delard, C., Barrales, L., and Balzarini, M. (2023). Effect of thinning on growth and shape of Castanea sativa adult tree plantations for timber production in Chile. For. Ecol. Manag. 530:120762. doi: 10.1016/j.foreco.2022.120762
Bi, H. (2000). Trigonometric variable-form taper equations for Australian eucalypts. For. Sci. 46, 397–409. doi: 10.1093/forestscience/46.3.397
Bogdanovich, E., Perez-Priego, O., El-Madany, T. S., Guderle, M., Pacheco-Labrador, J., Levick, S. R., et al. (2021). Using terrestrial laser scanning for characterizing tree structural parameters and their changes under different management in a Mediterranean open woodland. For. Ecol. Manag. 486:118945. doi: 10.1016/j.foreco.2021.118945
Bornand, A., Rehush, N., Morsdorf, F., Thürig, E., and Abegg, M. (2023). Individual tree volume estimation with terrestrial laser scanning: evaluating reconstructive and allometric approaches. Agric. For. Meteorol. 341:109654:109654. doi: 10.1016/j.agrformet.2023.109654
Corral-Rivas, J. J., Diéguez-Aranda, U., Rivas, S. C., and Dorado, F. C. (2007). A merchantable volume system for major pine species in El Salto, Durango (Mexico). For. Ecol. Manag. 238, 118–129. doi: 10.1016/j.foreco.2006.09.074
del Río Gaztelurrutia, M., Oviedo, J. A. B., Pretzsch, H., Löf, M., and Ruiz-Peinado, R. (2017). A review of thinning effects on scots pine stands: from growth and yield to new challenges under global change. For. Syst. 26:9. doi: 10.5424/fs/2017262-11325
Fang, Z., Borders, B. E., and Bailey, R. L. (2000). Compatible volume-taper models for loblolly and slash pine based on a system with segmented-stem form factors. For. Sci. 46, 1–12. doi: 10.1093/forestscience/46.1.1
Forrester, D. I. (2019). Linking forest growth with stand structure: tree size inequality, tree growth or resource partitioning and the asymmetry of competition. For. Ecol. Manag. 447, 139–157. doi: 10.1016/j.foreco.2019.05.053
Giana, F. E., Martínez-Meier, A., Mastrandrea, C. A., García, M., De Los, Á., Caniza, F. J., et al. (2023). Intensity and number of thinning operations affect the response of Eucalyptus grandis to water availability and extreme drought events. For. Ecol. Manag. 529:120635. doi: 10.1016/j.foreco.2022.120635
Hirigoyen, A., Navarro-Cerrillo, R., Bagnara, M., Franco, J., Requin, F., and Rachid-Casnati, C. (2021). Modelling taper and stem volume considering stand density in Eucalyptus grandis and Eucalyptus dunnii. IForest Biogeosci. For. 14, 127–136. doi: 10.3832/ifor3604-014
Hussain, A., Shahzad, M. K., He, P., and Jiang, L. (2020). Stem taper equations for three major conifer species of Northeast China. Scand. J. For. Res. 35, 562–576. doi: 10.1080/02827581.2020.1843703
Jacobs, M., Rais, A., and Pretzsch, H. (2020). Analysis of stand density effects on the stem form of Norway spruce trees and volume miscalculation by traditional form factor equations using terrestrial laser scanning (TLS). Can. J. For. Res. 50, 51–64. doi: 10.1139/cjfr-2019-0121
Karlsson, K. (2000). Stem form and taper changes after thinning and nitrogen fertilization in Picea abies and Pinus sylvestris stands. Scand. J. For. Res. 15, 621–632. doi: 10.1080/02827580050216879
Kontogianni, A., Tsitsoni, T., and Goudelis, G. (2011). An index based on silvicultural knowledge for tree stability assessment and improved ecological function in urban ecosystems. Ecol. Eng. 37, 914–919. doi: 10.1016/j.ecoleng.2011.01.015
Kozak, A. (2004). My last words on taper equations. For. Chron. 80, 507–515. doi: 10.5558/tfc80507-4
Larson, P. R. (1963). Stem form development of Forest trees. For. Sci. 9, a0001–a0042. doi: 10.1093/forestscience/9.s2.a0001
Lehtonen, A., Leppä, K., Rinne-Garmston, K. T., Sahlstedt, E., Schiestl-Aalto, P., Heikkinen, J., et al. (2023). Fast recovery of suppressed Norway spruce trees after selection harvesting on a drained peatland forest site. For. Ecol. Manag. 530:120759. doi: 10.1016/j.foreco.2022.120759
Li, D., Guo, H., Jia, W., and Wang, F. (2021). Analysis of taper functions for Larix olgensis using mixed models and TLS. Forests 12:196. doi: 10.3390/f12020196
Li, D., Jia, W., Guo, H., Wang, F., Ma, Y., Peng, W., et al. (2023). Use of terrestrial laser scanning to obtain the stem diameters of Larix olgensis and construct compatible taper-volume equations. Trees 37, 749–760. doi: 10.1007/s00468-022-02381-2
Li, S., Wang, T., Hou, Z., Gong, Y., Feng, L., and Ge, J. (2021). Harnessing terrestrial laser scanning to predict understory biomass in temperate mixed forests. Ecol. Indic. 121:107011. doi: 10.1016/j.ecolind.2020.107011
Li, R., Weiskittel, A., Dick, A. R., Kershaw, J. A. Jr., and Seymour, R. S. (2012). Regional stem taper equations for eleven conifer species in the Acadian region of North America: development and assessment. North. J. Appl. For. 29, 5–14. doi: 10.5849/njaf.10-037
Liu, Y., Trancoso, R., Ma, Q., Yue, C., Wei, X., and Blanco, J. A. (2020). Incorporating climate effects in Larix gmelinii improves stem taper models in the greater Khingan Mountains of Inner Mongolia, northeast China. For. Ecol. Manag. 464:118065. doi: 10.1016/j.foreco.2020.118065
Mäkinen, H., and Isomäki, A. (2004). Thinning intensity and long-term changes in increment and stem form of Norway spruce trees. For. Ecol. Manag. 201, 295–309. doi: 10.1016/j.foreco.2004.07.017
Max, T. A., and Burkhart, H. E. (1976). Segmented polynomial regression applied to taper equations. For. Sci. 22, 283–289. doi: 10.1093/forestscience/22.3.283
McTague, J. P., and Weiskittel, A. (2021). Evolution, history, and use of stem taper equations: a review of their development, application, and implementation. Can. J. For. Res. 51, 210–235. doi: 10.1139/cjfr-2020-0326
Meng, X. (1982). Studies of taper equations and the table of merchantable volumes. J. Nanjing For. Univ. Sci. Ed., 6, 122–133. doi: 10.3969/j.jssn.1000-2006.1982.01.008
Mette, T., Falk, W., Uhl, E., Biber, P., and Pretzsch, H. (2015). Increment allocation along the stem axis of dominant and suppressed trees in reaction to drought-results from 123 stem analyses of Norway spruce, scots pine and European beech. Austrian J. For. Sci. 132, 223–238.
Morley, T., and Little, K. (2012). Comparison of taper functions between two planted and coppiced eucalypt clonal hybrids, South Africa. New For. 43, 129–141. doi: 10.1007/s11056-011-9275-7
Muhairwe, C. K. (1994). Tree form and taper variation over time for interior lodgepole pine. Can. J. For. Res. 24, 1904–1913. doi: 10.1139/x94-245
Newton, P. F. (2022). Development of a climate-sensitive structural stand density management model for red pine. Forests 13:1010. doi: 10.3390/f13071010
Nigh, G., and Smith, W. (2012). Effect of climate on lodgepole pine stem taper in British Columbia, Canada. For. Int. J. For. Res. 85, 579–587. doi: 10.1093/forestry/cps063
Pape, R. (1999). Effects of thinning regime on the wood properties and stem quality of Picea abies. Scand. J. For. Res. 14, 38–50. doi: 10.1080/02827589908540807
Peng, W., Pukkala, T., Jin, X., and Li, F. (2018). Optimal management of larch (Larix olgensis A. Henry) plantations in Northeast China when timber production and carbon stock are considered. Ann. For. Sci. 75:63. doi: 10.1007/s13595-018-0739-1
Qu, Y., Wang, H., Dean, T. J., Zhang, J., and Zhang, X. (2022). Growth dominance and growth efficiency in response to thinning treatments in Chinese fir plantations with long-term spacing trials. For. Ecol. Manag. 521:120438. doi: 10.1016/j.foreco.2022.120438
Rais, A., Uhl, E., van de Kuilen, J.-W. G., and Pretzsch, H. (2021). Short-term reaction of European beech stem taper due to weather extremes. For. Ecol. Manag. 480:118653. doi: 10.1016/j.foreco.2020.118653
Saarinen, N., Kankare, V., Yrttimaa, T., Viljanen, N., Honkavaara, E., Holopainen, M., et al. (2020). Assessing the effects of thinning on stem growth allocation of individual scots pine trees. For. Ecol. Manag. 474:118344. doi: 10.1016/j.foreco.2020.118344
Simonse, M., Aschoff, T., Spiecker, H., and Thies, M. (2003). Automatic determination of forest inventory parameters using terrestrial laser scanning. Freiburg: Institute for Forest Growth, 252–258.
Stovall, A. E. L., MacFarlane, D. W., Crawford, D., Jovanovic, T., Frank, J., and Brack, C. (2023). Comparing mobile and terrestrial laser scanning for measuring and modelling tree stem taper. For. Int. J. For. Res. 96, 705–717. doi: 10.1093/forestry/cpad012
Sun, Y., Liang, X., Liang, Z., Welham, C., and Li, W. (2016). Deriving merchantable volume in poplar through a localized tapering function from non-destructive terrestrial laser scanning. Forests 7:87. doi: 10.3390/f7040087
Tao, S., Wu, F., Guo, Q., Wang, Y., Li, W., Xue, B., et al. (2015). Segmenting tree crowns from terrestrial and mobile LiDAR data by exploring ecological theories. ISPRS J. Photogramm. Remote Sens. 110, 66–76. doi: 10.1016/j.isprsjprs.2015.10.007
Tasissa, G., and Burkhart, H. E. (1998). An application of mixed effects analysis to modeling thinning effects on stem profile of loblolly pine. For. Ecol. Manag. 103, 87–101. doi: 10.1016/S0378-1127(97)00179-5
Teste, F. P., and Lieffers, V. J. (2011). Snow damage in lodgepole pine stands brought into thinning and fertilization regimes. For. Ecol. Manag. 261, 2096–2104. doi: 10.1016/j.foreco.2011.03.003
Wagle, B. H., Weiskittel, A. R., Kizha, A. R., Berrill, J.-P., D’Amato, A. W., and Marshall, D. (2022). Long-term influence of commercial thinning on stand structure and yield with/without pre-commercial thinning of spruce-fir in northern Maine, USA. For. Ecol. Manag. 522:120453. doi: 10.1016/j.foreco.2022.120453
Wang, J., Wang, Y., Tian, D., Wang, W., and Jiang, L. (2023). Modeling response of tree slenderness to climate, soil, diversity, and competition in natural secondary forests. For. Ecol. Manag. 545:121253. doi: 10.1016/j.foreco.2023.121253
Yu, S., Zhang, W., You, J., Deng, L., Huang, C., Xing, Z., et al. (2017). Effect of thinning on Quercus wutaishanica trees form quality by the analytic hierarchy process in Huanglong Mountains. Sci. Silvae Sin. 53, 104–113. doi: 10.11707/j.1001-7488.20171112
Zeng, W., Tang, S., Xia, Z., Zhu, S., and Luo, H. (2011). Using linear mixed model and dummy variable model approaches to construct generalized single-tree biomass equations in Guizhou. For. Res. 24, 285–291. doi: 10.13275/j.cnki.lykxyj.2011.03.011
Zhang, S., Chauret, G., and Tong, Q. (2009). Impact of precommercial thinning on tree growth, lumber recovery and lumber quality in Abies balsamea. Scand. J. For. Res. 24, 425–433. doi: 10.1080/02827580903124392
Zhang, J., Wang, J., Dong, P., Ma, W., Liu, Y., Liu, Q., et al. (2022). Tree stem extraction from TLS point-cloud data of natural forests based on geometric features and DBSCAN. Geocarto Int. 37, 10392–10406. doi: 10.1080/10106049.2022.2034988
Zhao, D., Bullock, B. P., Montes, C. R., and Wang, M. (2022a). Production, tree size inequality and growth dominance in loblolly pine plantations under different silvicultural management regimes. For. Ecol. Manag. 526:120594. doi: 10.1016/j.foreco.2022.120594
Zhao, X., Guo, Q., Su, Y., and Xue, B. (2016). Improved progressive TIN densification filtering algorithm for airborne LiDAR data in forested areas. ISPRS J. Photogramm. Remote Sens. 117, 79–91. doi: 10.1016/j.isprsjprs.2016.03.016
Zhao, D., Kane, M., and Borders, B. E. (2011). Growth responses to planting density and management intensity in loblolly pine plantations in the southeastern USA lower coastal plain. Ann. For. Sci. 68, 625–635. doi: 10.1007/s13595-011-0045-7
Zhao, D., Kane, M., Teskey, R., Markewitz, D., Greene, D., and Borders, B. (2014). Impact of management on nutrients, carbon, and energy in aboveground biomass components of mid-rotation loblolly pine (Pinus taeda L.) plantations. Ann. For. Sci. 71, 843–851. doi: 10.1007/s13595-014-0384-2
Zhao, D., Montes, C. R., Bullock, B. P., Wang, M., Dale Greene, W., and Borders, B. (2022b). Effects of intensive fertilization, complete competition control and site quality on aboveground net primary production (ANPP) dynamics of loblolly pine plantations. For. Ecol. Manag. 506:119986. doi: 10.1016/j.foreco.2021.119986
Keywords: terrestrial laser scanning, thinning, stand initiation and stem exclusion stages, stem form, taper equation
Citation: Li D, Jia W, Li F, Guo H, Wang F and Zhang X (2025) Assessing effects of thinning on the stem form in larch during the stand initiation and stem exclusion stages using terrestrial laser scanning. Front. For. Glob. Change. 8:1418334. doi: 10.3389/ffgc.2025.1418334
Edited by:
Weipeng Jing, Northeast Forestry University, ChinaReviewed by:
Zoran Govedar, University of Banja Luka, Bosnia and HerzegovinaKrishna Kumar Tamta, Uttarakhand Open University, India
Copyright © 2025 Li, Jia, Li, Guo, Wang and Zhang. This is an open-access article distributed under the terms of the Creative Commons Attribution License (CC BY). The use, distribution or reproduction in other forums is permitted, provided the original author(s) and the copyright owner(s) are credited and that the original publication in this journal is cited, in accordance with accepted academic practice. No use, distribution or reproduction is permitted which does not comply with these terms.
*Correspondence: Weiwei Jia, amlhd3cyMDAyQDE2My5jb20=; Fengri Li, ZmVuZ3JpbGlAbmVmdS5lZHUuY24=