 Fetriyuna Fetriyuna1,2,3*
 Ratna Chrismiari Purwestri3,4
 Sri Murniani Angelina Letsoin5,6*Ignasius Radix A. P. Jati7*Fajar Rahmawan8Nia Novita Wirawan9Budhi Setiawan10
 Miroslav Hájek4David Herák5
- 1Department of Food Technology, Faculty of Agro-Industrial Technology, Universitas Padjadjaran, Jatinangor, Indonesia
- 2Study Center for the Sustainable Development of Agroindustry, Faculty of Agro-Industrial Technology, Universitas Padjadjaran, Jatinangor, Indonesia
- 3Institute of Nutritional Science, University of Hohenheim, Stuttgart, Germany
- 4Faculty of Forestry and Wood Sciences, Czech University of Life Sciences, Suchdol, Czechia
- 5Department of Mechanical Engineering, Faculty of Engineering, Czech University of Life Sciences, Suchdol, Czechia
- 6Faculty of Engineering, University of Musamus, Merauke, Indonesia
- 7Department of Food Technology, Widya Mandala Surabaya Catholic University, Surabaya, Indonesia
- 8INTSIA Foundation of Papua Province, Jayapura, Indonesia
- 9Department of Nutrition, Faculty of Health Sciences, Universitas Brawijaya, Malang, Indonesia
- 10Department of Pharmacology, Faculty of Medicine, Universitas Wijaya Kusuma Surabaya, Surabaya, Indonesia
Sago (Metroxylon spp.), a traditional staple food that naturally grows in Papuan forests, plays a vital role in the food security of local inhabitants and is equally important in food and non-food industries. Changes in forest cover to other land uses might lead to shifts in the sago ecosystem, which could also affect sago production and nutrients. Currently, there is a lack of studies correlating vegetation changes and nutrient profiles. This research article aims to explore the vegetation area changes and their potential relationship to the sago forest ecosystem and nutrient profiles of the sago. NDVI information was collected from Mappi and Merauke Regency, Papua Province of Indonesia in 1990, 1996, 2012, 2018, and 2020. Sago samples were gathered from selected sites in Mappi and Merauke. No statistically significant changes in NDVI degradation classes or sago habitat area classifications were observed over the years in each regency. NDVI degradation classes in Merauke showed a significantly higher proportion of degraded areas (>76%) and a more pronounced yellowish color than in Mappi (8%). Approximately 90% of areas in Mappi were categorized as having an increase in trees and no degradation, which was significantly higher than in Merauke (<5%). Sago in Merauke exhibited significantly higher macro and micronutrient content than Mappi. Findings from GLM predictor analysis showed that higher carbohydrate, protein, Ca, Cu, Mg, and Na content of sago samples were positively and significantly associated with collected samples in Merauke. An increase in carbohydrate levels was also positively associated with a higher percentage of NDVI classes related to the yellowish color. The results indicated that sago palms in Merauke are more mature, and therefore, the samples were harvested at an older age than those in Mappi. NDVI can be used to monitor area degradation and predict nutritional quality.
Introduction
In Asian countries, such as Indonesia, wild sago palms thrive in swampy forests and shrub areas, particularly stands in Southern Papua forests in Indonesia. Sago (Metroxylon spp.) or so-called “sagu” locally, plays a vital role in both food and non-food industries and has other beneficial features (Koonlin, 1979; Letsoin et al., 2020). In contrast, the expansion of settlements or industrial growth along with an increased population might cause a significant decline in forest services, as experienced by the Southern Papua Province. In 1990, Merauke, one of the regions in Southern Papua Province, was covered by approximately 50% forests. Papuan forests consist of a high diversity of flora and fauna species. Some of these wild plants are considered essential for food consumption of the local people, such as wild breadfruit (Artocarpus sp. or “sukun hutan,” paddy oats (Gnetum gnemon L. or “melinjo”), wild yam (Dioscorea sp.1 or “umbi hutan”), and island lychee (Pometia pinnata or “matoa”), in addition to sago (Van Heist et al., 2015; Nurhasan et al., 2022). Sago has been a staple in the diet and part of the local cuisine of the population in the studied area for generations and plays a pivotal role in various aspects of life in sago-growing areas, including rituals, feasting, and other cultural activities (Van Heist et al., 2015; Ehara et al., 2018). Furthermore, sago-based foods, which are combined with other plant-or animal-based ingredients, have a significant position in culinary agro-industries nationally and regionally, such as sago cake and sago bread (Mofu and Abbas, 2015). However, by 2019, the forest cover had decreased by approximately 8% over the 30-year period. For instance, in the Merauke region, among the 20 districts, 12 experienced a loss of sago palm habitat as a consequence of the reduced forest cover. However, there has been no prior report on the assessment of forest cover in that area. These conditions can serve as an indicator of a decline in forest ecosystems, thus necessitating an evaluation of changes in forest cover and its societal implications (Vogelmann et al., 2009; Letsoin et al., 2020).
Remote sensing instruments have been used in data acquisition, monitoring, and identification through various distant platforms, encompassing airborne, spaceborne, and ground-based methods. Airborne and spaceborne methods include unmanned aerial vehicles (UAVs), manned airplanes, and satellites. Meanwhile, handheld or vehicle-mounted devices are included in ground-based platforms (Shanahan et al., 2001). Presently, various satellite imageries, such as Landsat, Sentinel, Moderate Resolution Imaging Spectroradiometer (MODIS), Pleiades, and other applicable satellites, are made for different purposes such as natural resources mapping, ocean and coastal implementation, assessment of vegetation cover, or detecting forest cover changes. For instance, the detection of decreased oak in the Mark Twain National Forest in the United States was done using Landsat data imagery (Wang et al., 2007), while in the European region, it was achieved through the Coordination of Information on the Environment (CORINE) Land Cover (LC) dataset (Ramankutty and Foley, 1999; Waser and Schwarz, 2006; Feranec et al., 2016). Forests contribute to a wide range of societal advantages. For example, European countries, such as the Czech Republic, covered by ca. 33% of woodland, provide not only wood and non-wood products but also cultural and social services that encourage a forest bio-economy approach (Šodková et al., 2019; Purwestri et al., 2020). Forest ecosystem services (FES) have become valuable since their function is to protect biodiversity for both biotic and abiotic systems and develop clean drinking water while regulating the water circulation system for flood prevention (Huertas Bernal et al., 2021).
Recently, new opportunities have been established to combine remotely sensed data with non-spatial data. Non-spatial data, commonly known as attribute data, refer to descriptive information about objects or phenomena that lack geographic coordinates (Huertas Bernal et al., 2021). Spatial and non-spatial data represent fundamental components within contemporary data-driven decision-making frameworks. Spatial data, fundamentally comprising geographical information, provide crucial insights regarding locations, distances, and patterns across various areas and landscapes. This form of data is indispensable across multiple sectors, including real estate, logistics, urban planning, and environmental research, facilitating geospatial analysis and visualization to enhance decision-making outcomes. Conversely, non-spatial data, which lack geographical context, are instrumental in elucidating patterns and correlations within datasets such as demographic statistics, transaction records, or behavioral information. Non-spatial data serve as the foundational element for statistical analysis, data mining, predictive modeling, and machine learning applications across a wide array of disciplines. The effective integration of both data types can yield comprehensive insights that support intelligent, evidence-based decision-making solutions. Hence, non-spatial data nowadays, associated with various methods and platforms, such as Forest-BioGeochemical Cycles (BGC), a lifecycle model to estimate the emissions of carbon, nitrogen, and water through the ecosystem, for example, assessment on the relationship between land cover land-use changes and water retention in the ecosystem (Huang et al., 2022). Other current studies are incorporating biochemical data, for instance, fresh weight moisture and chlorophyll content, to evaluate forest stress (Xi et al., 2021), or combining AI learning algorithms and spatial indices, for example, vegetation indices to estimate the macronutrient category in palm oil and the growth of paddy fields using Sentinel, Modis Imagery, and vegetation indices (VI) (Ramadhani et al., 2020; Kok et al., 2021). Remote sensing images can be processed to generate the Normalized Difference Vegetation Index (NDVI), a key parameter for measuring vegetation vitality and recognizing modification in forest cover, typically using the value 0–1 (Pettorelli et al., 2005; Meneses-Tovar, 2011). Due to their effectiveness in enhancing signal waves from vegetation and eliminating unforeseen discordances such as clouds, atmospheric circumstances, or a different angle of observation, NDVI has also been widely used in other yield estimation, crop monitoring, and forest cover. The selection of preferred vegetation indices (VIs) was made by assessing the VIs outlined in a comprehensive review of remote sensing and vegetation index studies (Bannari et al., 1995).
To date, research examining the relationship between remote sensing data and non-spatial plant nutrient information, particularly, is still quite limited. This theoretical connection arises from the fact that plants contain chlorophyll, which governs the greenness of their leaves and as an indicator of a plant’s health (Gitelson and Merzlyak, 1997; Xu et al., 2000; Steele et al., 2008). Yoder and Waring (1994) conducted greenhouse experiments on small Douglas-fir seedlings and reported that healthy plants absorb more visible light for photosynthesis while reflecting more NIR light, resulting in higher NDVI (Normalized Difference Vegetation Index) values during the growing phase. Conversely, stress, disease, or poor soil conditions can reduce a plant’s chlorophyll content, leading to increased reflection of visible light and decreased reflection of NIR light, which lowers NDVI values (Farrar et al., 1994; Wang et al., 2016; Beisel et al., 2018). While many studies linking NDVI with plant greenness and health have been conducted in controlled laboratory or plot-specific environments, remote sensing-derived NDVI can be used to assess the level of greenness or degradation over larger areas (Pettorelli et al., 2005; Meneses-Tovar, 2011; Yengoh et al., 2015). Additionally, NDVI can be correlated with a plant’s nutrient uptake, as plant health is closely tied to nutrient availability and absorption. Healthy plants with higher NDVI values typically have more efficient nutrient uptake due to better-developed root systems and photosynthesis. Therefore, plants with higher NDVI values are likely to access essential nutrients such as nitrogen, phosphorus, and potassium from the soil, promoting growth and development. A drop in NDVI values may signal nutrient deficiencies, resulting in poor plant growth (Farias et al., 2023). Thus, high NDVI values indicate healthy plants with optimal nutrient uptake, which contributes to improved plant tissue nutrient content, such as higher protein, vitamin, and mineral concentrations. NDVI indirectly aids in improving crop yield and nutritional quality by providing insights into the optimization of nutrient uptake from the soil.
In the case of sago, studying the relationship between NDVI and the nutrient profile of sago presents challenges due to its natural growth conditions in the tropical forests of Papua. As such, changes in sago-growing areas often need to be manually recorded. Then, the production also needs to be manually estimated, however, there is a lack of study on the quality of sago in relation to the area changes. Recent approaches to monitoring these changes (degradations or gains) included predicting potential sago-growing areas through land cover class conversions using remote sensing imagery (Letsoin et al., 2020), and more recently, deep learning techniques have been employed to recognize sago palm leaves and flowers over other similar palm trees in the Papuan forests (Letsoin et al., 2022b). In this article, we explored NDVI class changes (in degradation and potential sago habitats) derived from remote sensing imagery over the observed years in two selected regions of Papua and associated the NDVI classifications with the quality of sago, as indicated by selected nutrient profiles of the samples collected from the same areas.
We developed two research questions (RQs) to answer this objective:
RQ1: Are there significant changes in NDVI degradation classes and NDVI classifications of sago habitat areas over the observed years in two selected regions of Papua?
RQ2: What are the potential predictors, besides the NDVI classes (degradation and potential sago habitat area), which affect the selected nutrient profiles of sago (e.g., carbohydrate, Mg, and Ca)?
We hypothesized, first, that significant shifts in NDVI classes, including degradation and potential sago habitat areas, have occurred over the observed years. Second, the NDVI classifications are significantly associated with the nutrient profiles of sago, which, in turn, has implications for people’s wellbeing.
Materials and methods
Study area and research overview
Two regencies located in the southern region of Papua Province were selected as study sites due to their distinctive characteristics in infrastructure and rural development. Merauke, the easternmost city in Indonesia, holds the title of being the largest regency in the Papua Province, with 20 districts (Figure 1). Over the past decade, Merauke has experienced a population growth of approximately 18.28%, with approximately 1.20 million individuals actively engaged in the field of agriculture. Based on a previous study (Letsoin et al., 2020), significant shifts were found in forested to non-forested regions in Merauke over the past two decades. Meanwhile, Mappi, a newly established regency (formerly part of Merauke Regency), provides a clearer perspective on rural development and land-use changes, particularly forest cover, which setting it apart from Merauke.
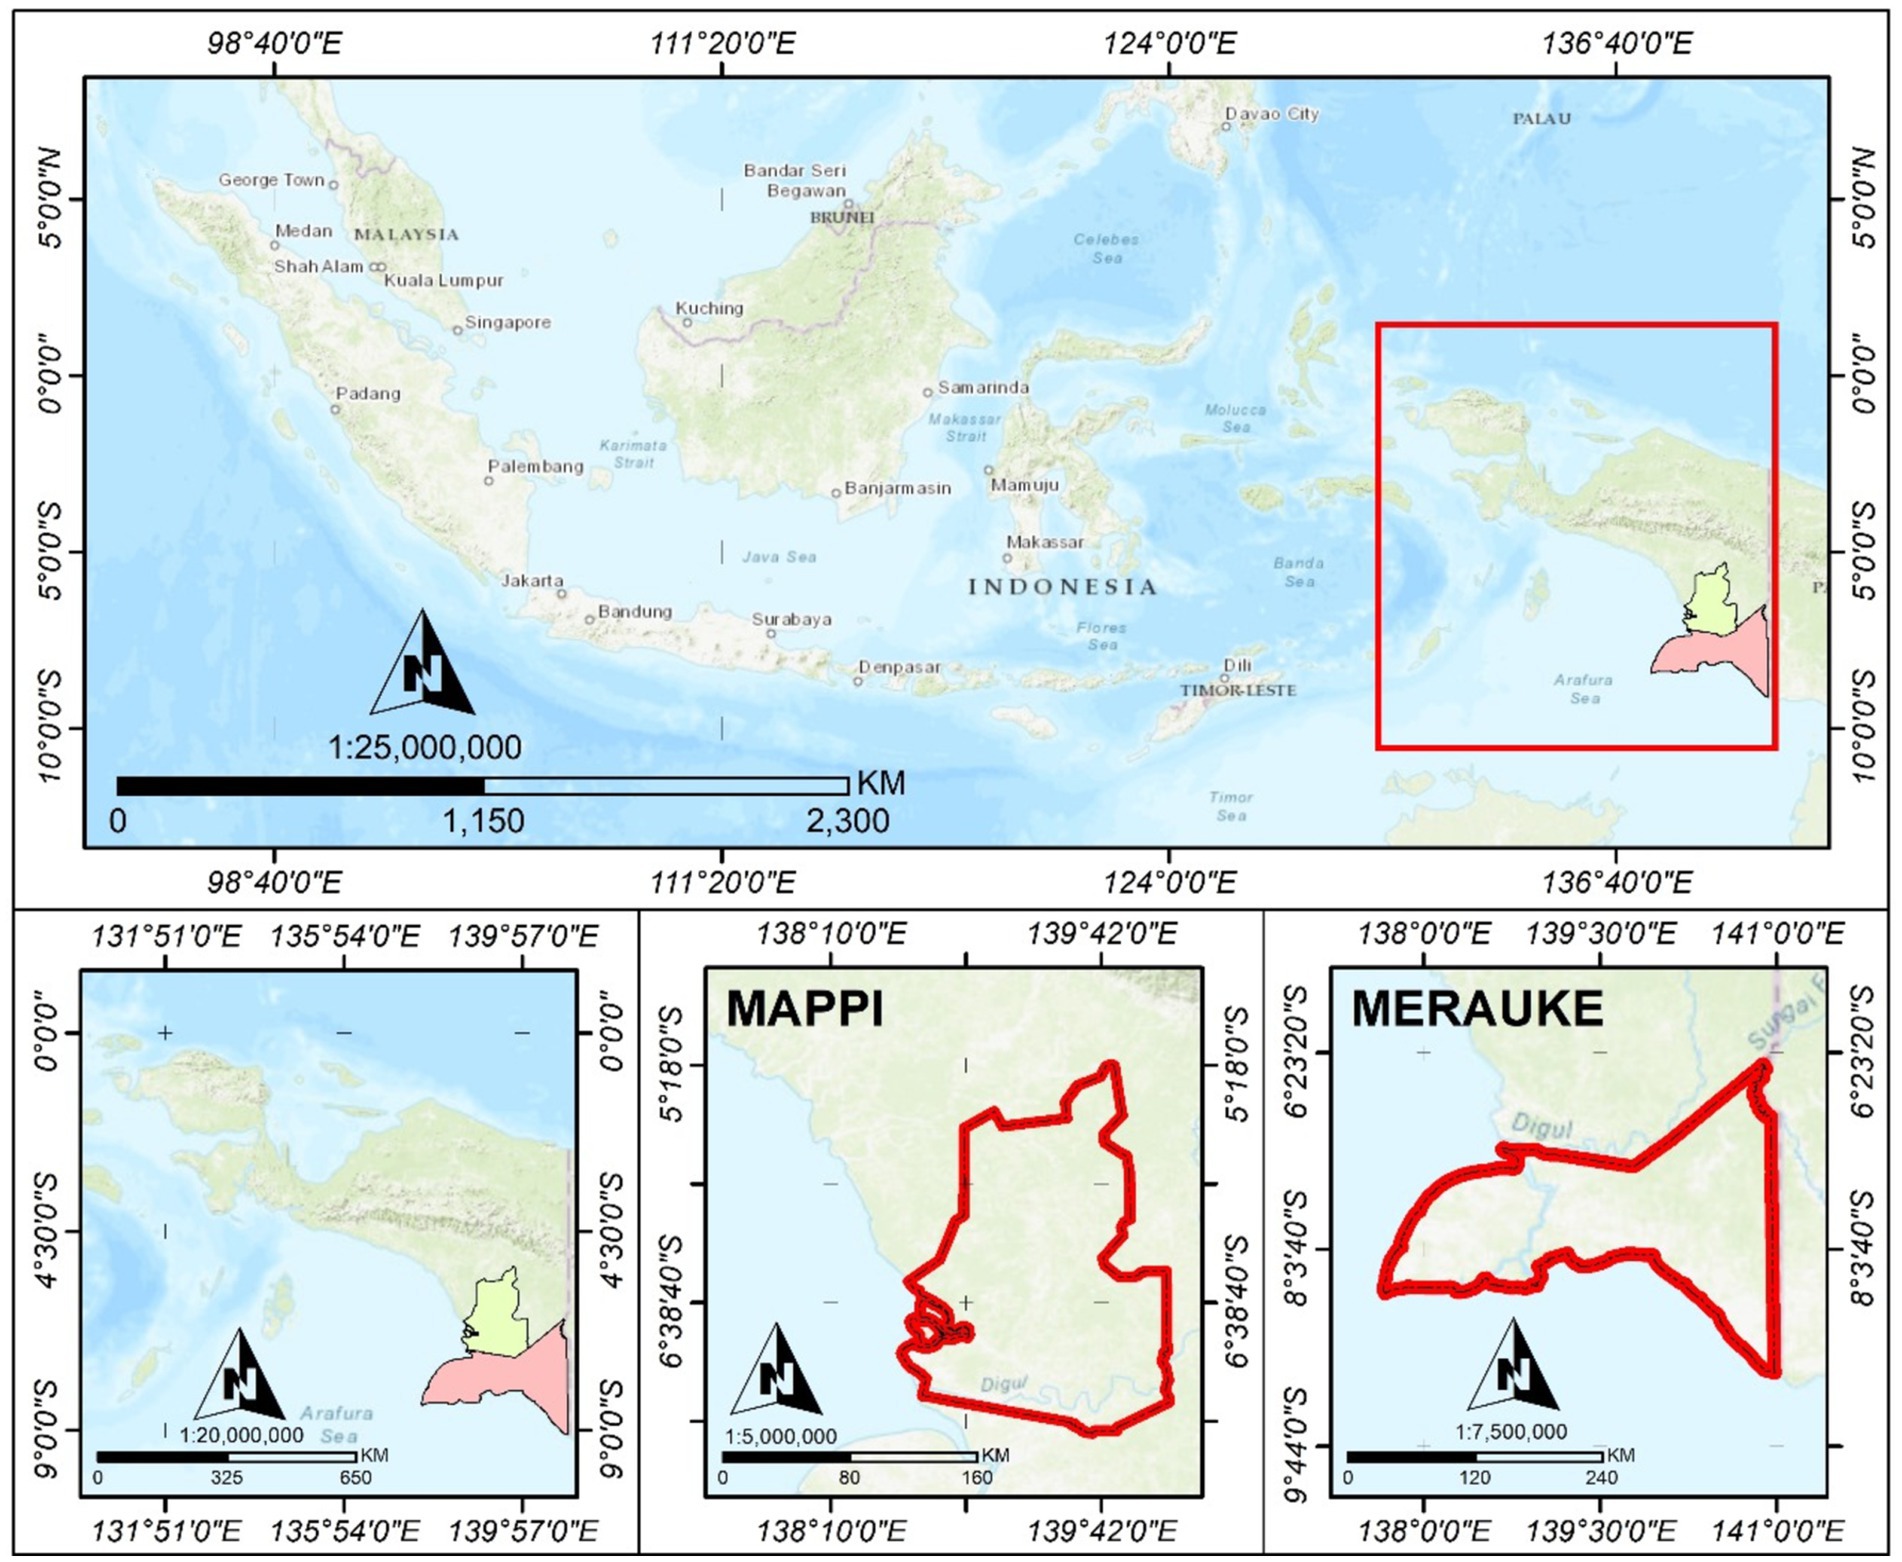
Figure 1. Map of the study areas.
Mappi Regency, which is positioned between 138°30′ E–140°10′ E and 5°10′ S–7°30′ S, has a total area of 24,188.22 km2 and encompasses 15 districts with substantial food crops and horticulture commodities, such as paddy fields, cassava, sweet potatoes, betel nut, and coconuts. The area of sago palm covered approximately 818,178 ha in 2019 (BPS-Statistics of Mappi Regency, 2021). Meanwhile, Merauke Regency spans from a longitude range of 137°38′52.9692″ E to 141°0′13.3233″ E and a latitude range of 6°27′50.1456″ S to 9°10′1.2253″ S. According to weather statistics, the average annual temperature varies between 16 and 32°C, and the average annual rainfall is 2,900 mm. The relative humidity ranges from 62 to 95% (BPS-Statistics of Merauke Regency, 2020; BPS-Statistics of Papua Province, 2020).
Native Papuan in Mappi and Merauke primarily engage in hunting and fishing wild animals, as well as gathering forest plants. In particular, Murdjoko et al. (2016) reported that various forest plants are grown wildly in the forests of South Papua, with trees being the most abundant, followed by shrubs, herbs, vines, ferns, palms, orchids, rattans, and pandan. Among these, sago palms, a traditional staple food, have been used by local communities for generations. In addition to sago, local people have also gathered from forests and traditionally cultivated various tubers for their alternative staples, such as wild yam and sweet potato, respectively. Furthermore, Merauke experienced an expansion of agriculture, that is, paddy fields and transmigration settlements (a national government program to move farmers from crowded islands to less developed regions) since 1990, as part of an effort to establish this regency as a rice producer. As a result, rice has been introduced as an alternative staple food alongside sago and tubers. Another significant land cover transformation related to land cover in both study regions was the establishment of estate crop plantations managed by private companies Appendix Table A1. presents land cover shifts in Mappi and Merauke from 1990 to 2020.
A comprehensive overview of the data collection and analysis process for the sago nutrient and NDVI study is displayed in Figure 2, which illustrates the multistep process involved in the remote sensing study of sago palm habitats and nutrient profiling in South Papua. Starting with field measurement, GPS data are collected to identify specific sampling points, which informs the NDVI analysis conducted via satellite imagery processed with Google Earth Engine and ArcGIS for enhanced spatial analysis. Concurrently, sago starch is collected from selected regions. The samples were analyzed in the laboratory to determine their micro and macronutrient content. This rigorous process ensures a thorough validation of NDVI class changes (Meneses-Tovar, 2011; Santillan et al., 2012a, 2012b; Yengoh et al., 2015; Farias et al., 2023) and investigates the potential correlation with nutrient variations in sago palms, providing insight into land cover’s impact on sago quality.

Figure 2. Methodological pipeline for correlating NDVI and sago palm nutrient variability in Mappi and Merauke.
Data imagery
In this study, supervised classification of multitemporal Landsat images, including Thematic Mapper (TM), Enhanced Thematic Mapper (ETM+), and Operational Land Imager (OLI), at a resolution of 30 m, was used to construct remote sensing data. The data were collected with a cloud cover of less than 50% at a height of 705 km. For image acquisition, various Landsat were used for this study, namely Landsat-4, Landsat-5, Landsat-7, and 8 Operational Land Imager/Thermal Infrared Sensor (OLI/TIRS) imaging (Table 1). The Landsat-8 satellite, which was introduced in 2013, is equipped with a Thermal Infrared Sensor and an Operational Land Imager, providing image scenes in nine spectral bands. These bands include Band-1 (blue: 0.45–0.51 m), Band-2 (blue-green: 0.45–0.51 m), Band-3 (green: 0.53–0.59 m), Band-4 (red: 0.64–0.67 m), Band-5 (near infrared, NIR: 0.85–0.88 m), Band-6 (shortwave infrared 1, SWIR1: 1.57–1.65 m), and Band-7 (SWIR2: 2.11–2.29 m). These spectral bands give spatial resolutions of 30 m, 15 m for panchromatic wavelengths (pan), and 100 m for thermal infrared (IR).
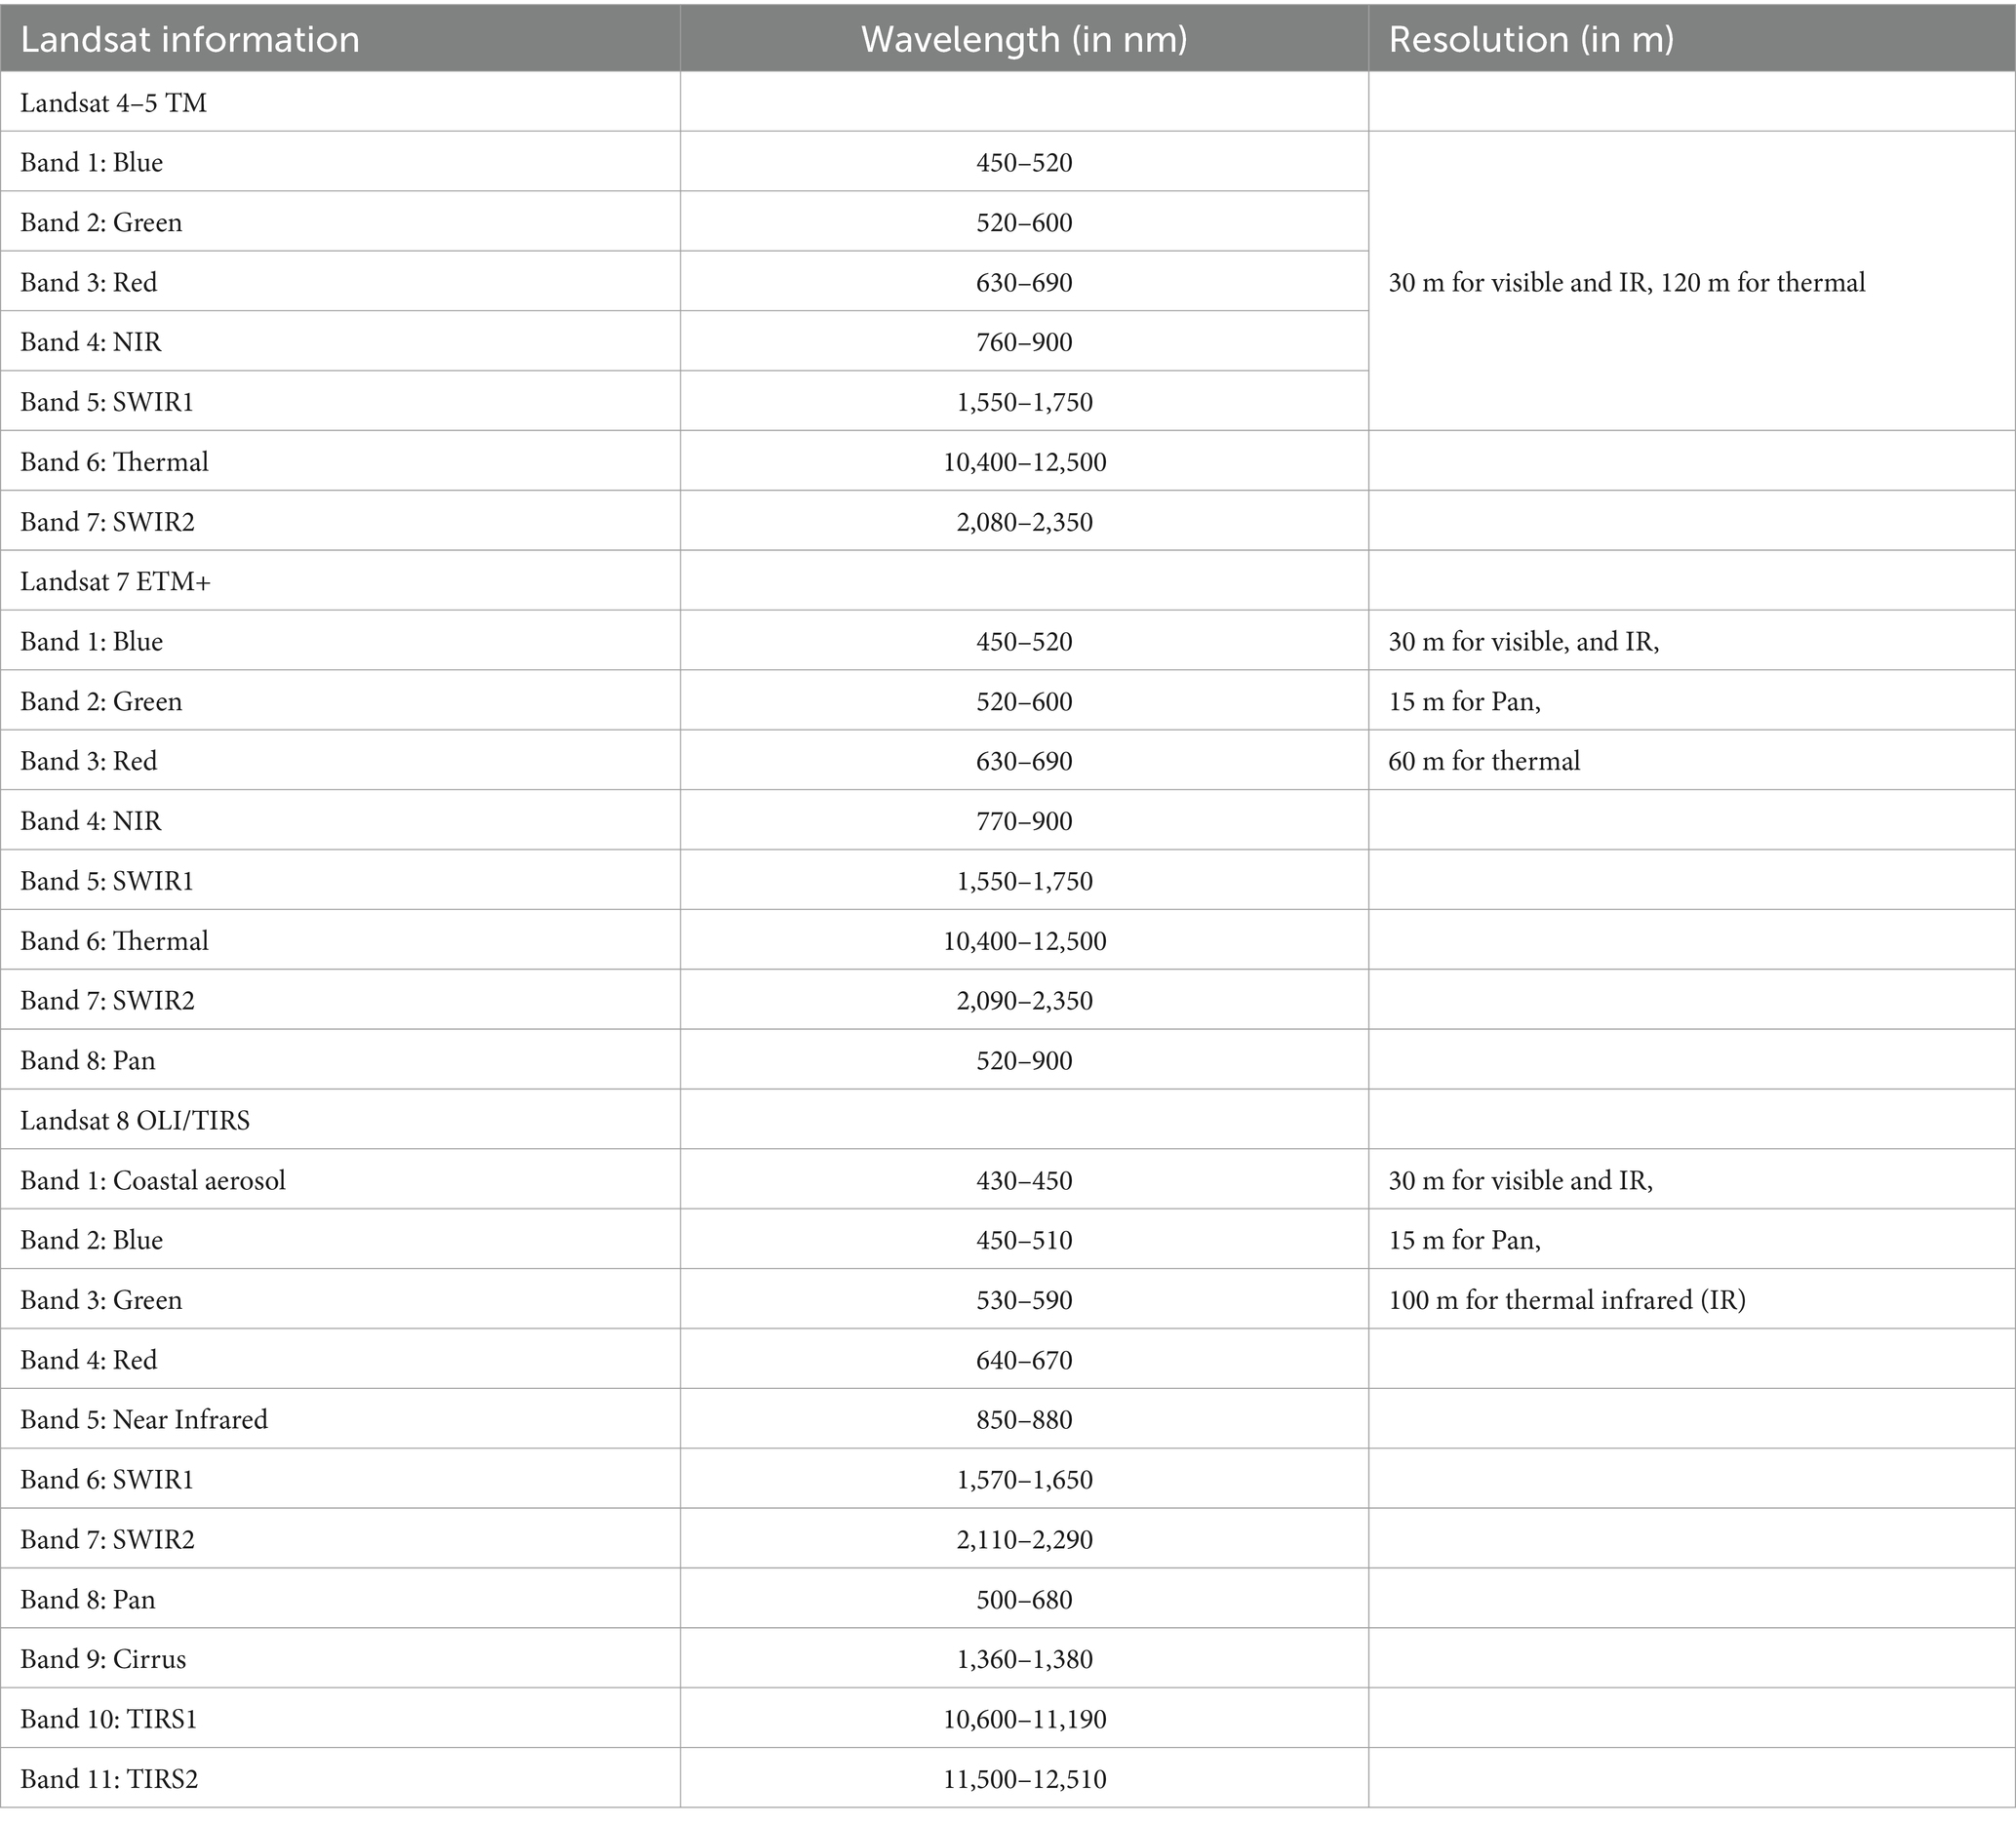
Table 1. Spatial and spectral resolution of different landsat programs.
The United States Geological Survey (USGS) archives, which are reachable at https://earthexplorer.usgs.gov, provided all the Landsat data used in this study. In addition to the present investigation, the Google Earth Engine played an instrumental role in acquiring, processing, and analyzing satellite imagery data with a particular emphasis on the Landsat missions and analyzing vegetation density. These images were processed to generate the NDVI. To add this, global positioning system (GPS) technology was employed during fieldwork to ensure precise spatial accuracy. Global positioning system (GPS) apparatuses were utilized to systematically capture the accurate coordinates of sago palm specimens and various relevant land cover classifications, thus supplying vital ground-truth information. The GPS data were integrated into Geographical Software Systems to produce comprehensive maps, thereby creating a spatial framework for interpreting the implications of land cover transformations on sago nutrients.
The workflow for vegetation mapping using Landsat data was divided into five distinct stages (Appendix Figure A1). First, in the Data Input stage, Landsat-4 and Landsat-5 data from the years 1990–2000 were used, while Landsat-7 data were used for the years 2000–2012 and Landsat-8 OLI/TIRS data were used for the years 2013–2020. The Landsat satellite recording data encompass the period from January 1 to December 31 of the specific year. Remote sensing information, including regional maps, ground truth information (Appendix Figure A2), and land cover classification data, as detailed in (Letsoin et al., 2020), that is, from the Ministry of Forestry and Environment from the years 1990–2020 were also incorporated. Following this, in the Data Preprocessing stage, activities such as data retrieval, radiometric calibration, and geometric correction were carried out to prepare and refine the Landsat data for use. In the Data Processing stage, after obtaining image data and ground-truth samples, shape files were imported into Geographical Software Systems (GSS) such as ArcMap, ArcGIS, and QGIS. QGIS and SAGA were the primary tools used for all data processing, involving supervised classification, followed by vegetation index (VI) calculations and classification. In the Data Validation stage, every site used 450 ground-truth samples to distinguish land cover classes. The ground-truth sample is depicted in Appendix A. In the field data, the geographic coordinates, which include latitude and longitude, were collected as ground truth, also the starch of sago and sago waste specifically sago rough hampas, while Google Earth Engine (GEE) aided in the interpretation of classifications and validation of results. Finally, in the Analysis stage, the aim was to conduct statistical evaluations of the outcomes. Land cover (LC) refers to the physical material presents on the surface of the earth, which includes various types of vegetation, water bodies, urban areas, bare soil, and other surface features. In the study, LC denotes the classification of different types of land cover observed in the study regions, such as forested areas, agricultural land, or sago palm habitats. Understanding the LC is crucial for assessing how changes in the landscape, such as deforestation or agricultural expansion, impact the environment and local ecosystems. Vegetation index (VI) is a quantitative measure that assesses the presence, density, and health of vegetation in a specific area. VI values are used to monitor vegetation dynamics, detect changes in land cover, and assess the health of plant life in the study area. Clip band means that specific spectral bands of satellite imagery are being extracted and restricted to a defined geographic area. This allows us to investigate only the relevant part of the data.
The NDVI was classified using the following formula (Wiegand et al., 1991):
NIRi represents the reflectance of band i within the NIR spectral range, spanning from 760 nm to 900 nm for Landsat data from 4 to 5 and 7. For Landsat 8, which has a 30-m ground resolution, the NIR range is 850–880 nm. REDj denotes the reflectance of band j within the red spectral region, and m denotes NDVI measured to obtain the NDVI levels. Six degradation levels from NDVI values in 1990, 1996, 2012, 2018, and 2020 were categorized in this research, as follows:
1. Less than and equal to 0 = no vegetation = artificial areas
2. More than 0–0.2 = severe degradation
3. More than 0.2–0.4 = moderate degradation
4. More than 0.4–0.6 = slight degradation
5. More than 0.6–0.8 = addition of vegetation
6. More than 0.8 = no degradation
Land cover classes, that is, primary and secondary dryland forest, primary and secondary swamp forest, bush/shrub, grassland, swamp shrub, and swamp were identified as suitable ecosystems of sago (Bintoro et al., 2018; Letsoin et al., 2020). According to the land cover data for Merauke from 1990 to 2019, the greatest loss occurred in primary swamp forests (approximately 40%), followed by primary dryland forests (approximately 27%) (Letsoin et al., 2020). When overlaying the land cover results with the NDVI classifications, areas with moderate degradation corresponded to a loss of green, particularly forest areas, between 20 and 40%, while severe degradation referred to more than 40%. Thus, a reduction in green areas by less than 20% is classified as slight degradation.
In this article, no vegetation is defined as artificial areas. The addition of vegetation refers to areas that have been planted or have naturally grown in addition to the existing vegetation, or areas where reforestation or afforestation efforts have taken place and where natural tree growth has occurred due to favorable environmental conditions or changes in land-use practices. Hereafter, additional trees pertain to trees that are not included within the original or preexisting vegetation cover. This encompasses three categories, namely newly planted trees, that is, trees that have been intentionally introduced as components of reforestation or afforestation initiatives. Then, naturally regenerated trees define trees that have emerged spontaneously, without direct human involvement, potentially due to alterations in environmental conditions that promote natural regeneration. Thus, increased tree density includes regions where the concentration of trees has augmented, either through natural processes or anthropogenic activities, resulting in a greater number of trees than previously existed.
Furthermore, prediction on sago habitat areas was also derived from collected data points in 1990 and 2020. Four classes of sago habitat areas in this article were as follows:
1. Less than and equal to 0 = non-potential sago habitat
2. More than 0–0.3 = degraded sago habitat
3. More than 0.3–0.6 = newly established sago habitat
4. More than 0.6 = potential sago habitat
Potential sago habitat is derived from all land classes suitable for the growth of sago, in contrast to non-potential sago forests, such as rice-field, estate crop plantations, and artificial areas. The green area or potential sago habitat refers to areas where ecological conditions favor the growth of sago palm, signifying that these sites have the necessary hydrological resources, for instance, in swampy areas, soil properties, and climatic attributes crucial for the natural expansion of sago forests.
The research incorporated secondary data sources to enhance the accuracy and scope of the demarcation process. These data sources encompassed historical satellite imagery, climate data, and land-use maps, which were accessible in diverse formats, including raster (spatial) and tabular (non-spatial) datasets. The raster datasets delivered spatially explicit information regarding vegetation cover, whereas the tabular data provided valuable insights into environmental conditions and land-use practices. The combination of these data types allowed for an extensive exploration of sago forest areas, addressing both present and historical patterns. The demarcation methodology utilized an integration of NDVI maps in conjunction with the Land cover map, applying established thresholds to differentiate areas marked by increased NDVI values that signify sago forests, concurrently validating these insights with empirical field data and historical references. This approach guaranteed that the identified sago forests were not merely accurate in their present extent but also representative of their ecological importance across historical timelines. Information on land-use classification areas was gathered from remote sensing secondary data reported by the INTSIA Foundation of Papua Province.
Selected macro and micronutrient analysis of sago and the nutrient fulfillment
The sago palm tree primarily serves as a source of starch for food production. Sago starch is derived from the Metroxylon spp. plant, which comprises two species: Thorny Sago (Metroxylon rumpii) and Spineless Sago (Metroxylon sago). The process of obtaining starch from these trees involves several stages. The readiness of sago palms for harvest can be determined by observing changes in their leaves, shoots, stems, and thorns. Sago plants are often ready for harvesting when the leaves are slightly swelled but they have not yet blossomed. In addition, compared to young trees, the thorns diminish, and the leaf sheaths become cleaner and smoother. Cutting, bark removal, and trunk collection are the steps involved in harvesting suitable trees. Sago starch is typically extracted from the stem’s pith by crushing and kneading the stem to liberate the starch, then washing and filtering the mixture to remove the fibrous residue (Fetriyuna et al., 2024). After being suspended in water, the raw starch is allowed to settle before being dried. Figure 3 depicts traditional sago processing resulting in sago starch and sago waste.
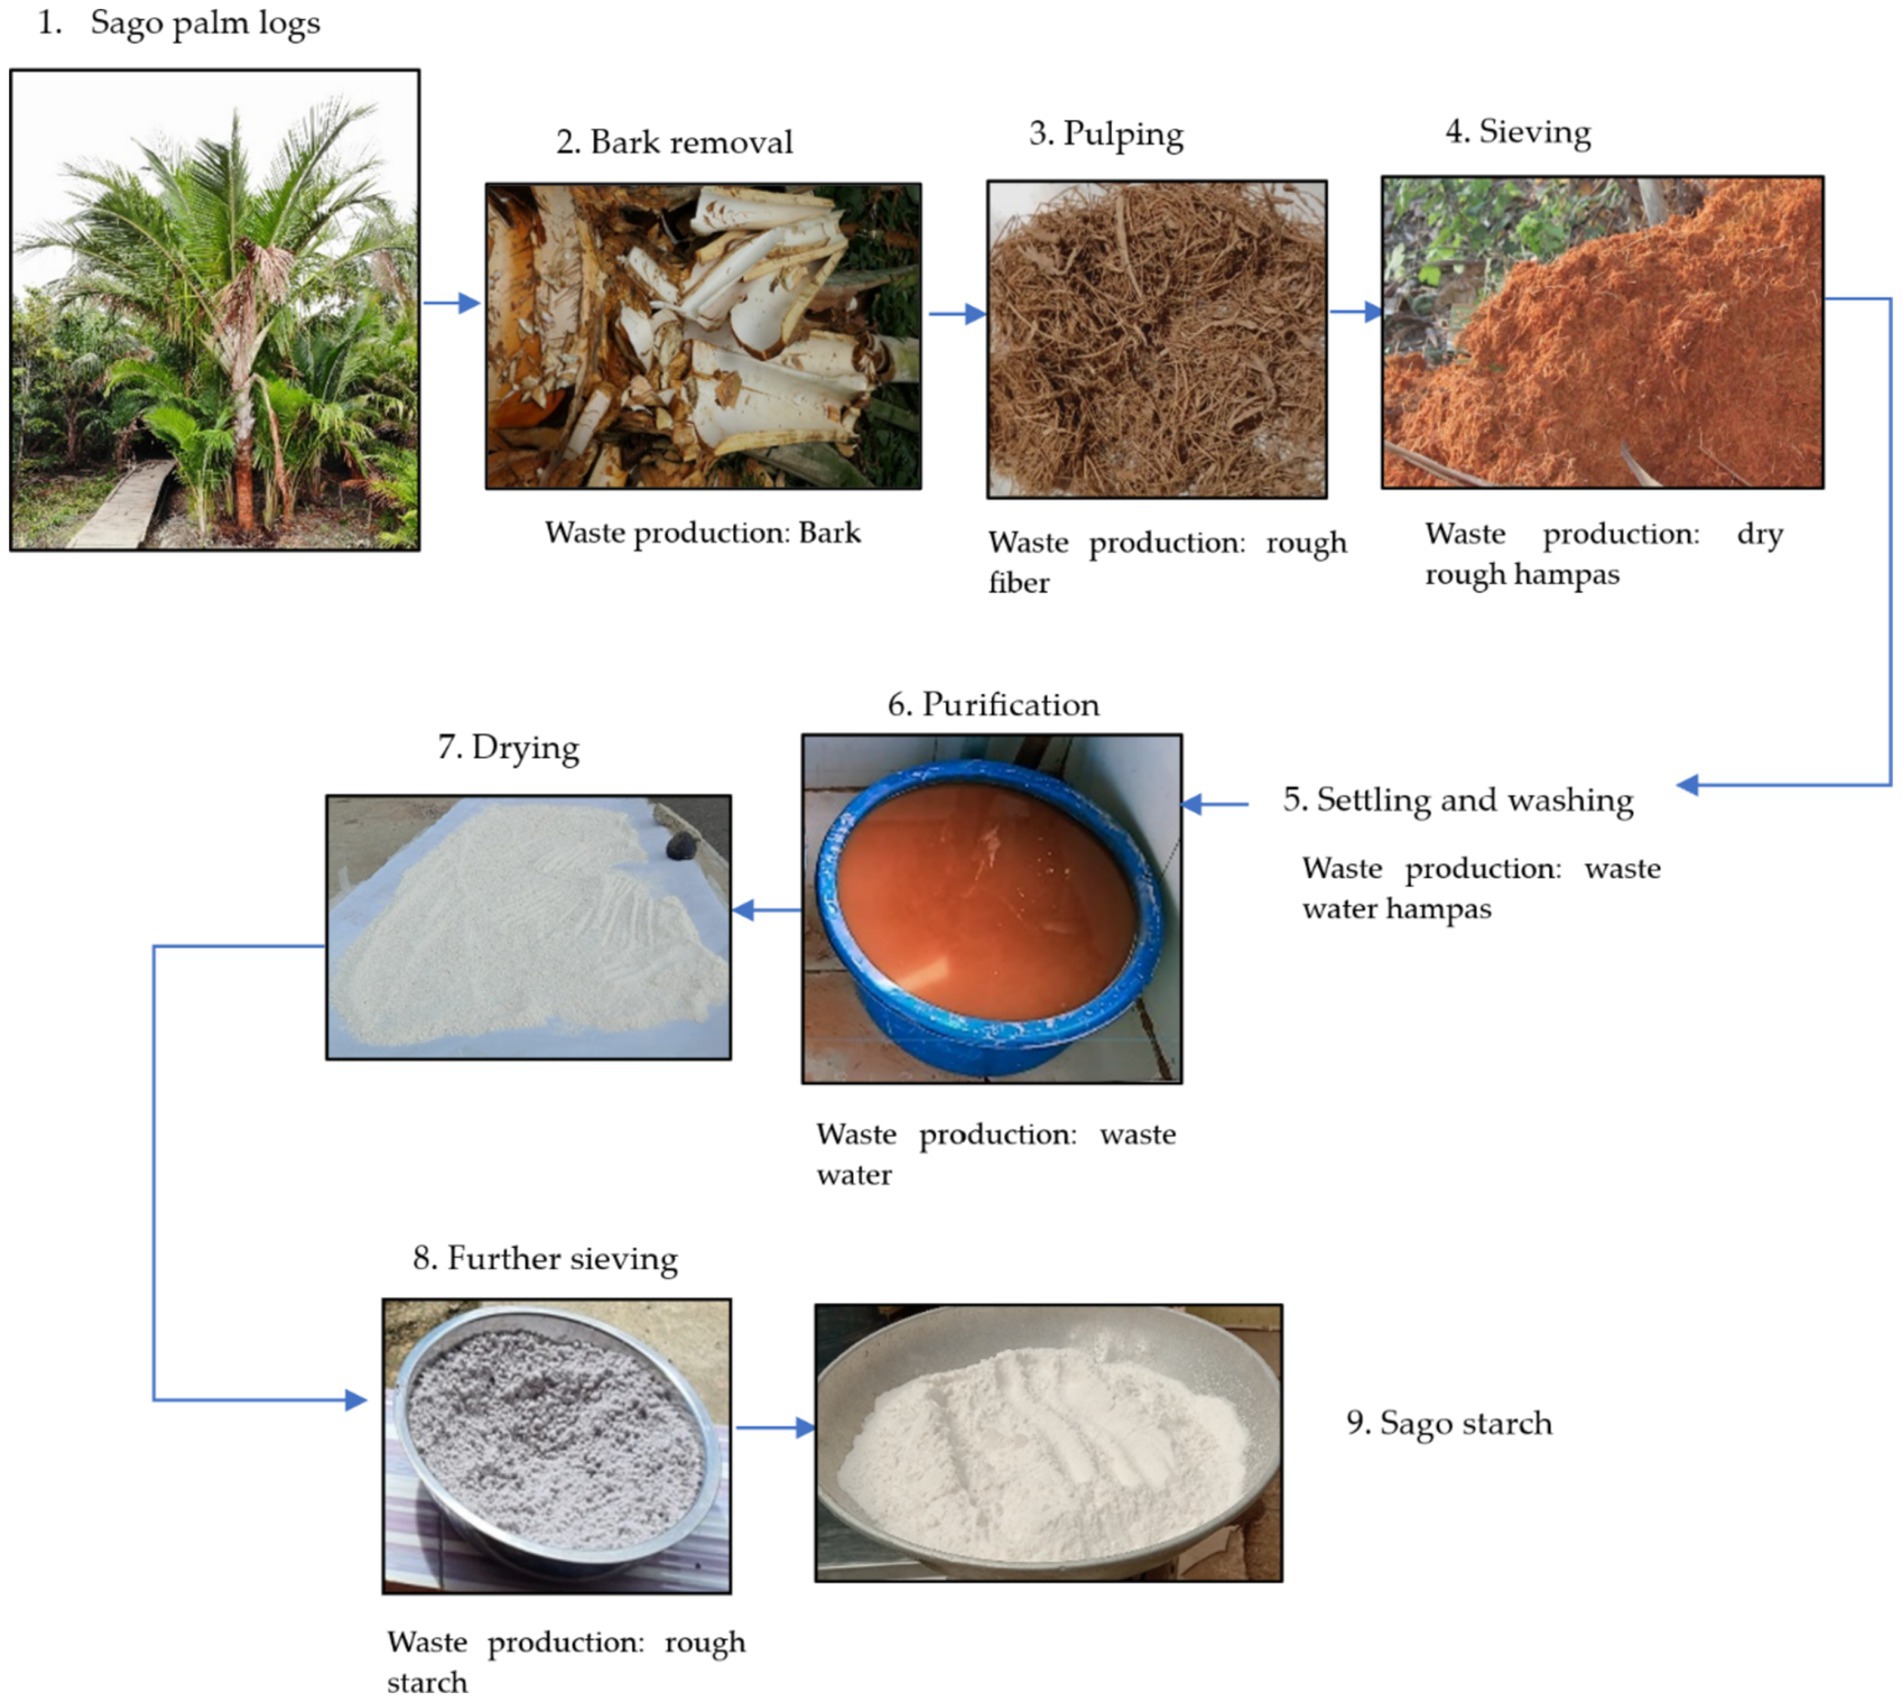
Figure 3. Traditional sago starch production (developed by author: S.M.A. Letsoin).
Sago starch samples, manually extracted by sago farmers (Figure 3), were collected according to the habitats. In this study, four main sago habitats were selected: dryland and swamp forests, as well as swamp and bushland (Bintoro et al., 2018; Letsoin et al., 2020). Approximately 1 kg of sago starch was collected from each selected habitat within the study regencies, during the summer period from August to September 2020. After collection, sago samples were packed in plastic, sealed, and stored in a refrigerator, before being transported to the laboratory.
The packed and sealed samples were analyzed for macronutrients at the Central Laboratory of Life Sciences (Laboratorium Sentral Ilmu Hayati), Universitas Brawijaya, Indonesia. Moisture, fat, and ash content analyses were conducted in duplicate following the national standards of Indonesia, as outlined in the “Standard Nasional Indonesia” (Badan Standarisasi Nasional, 1992). Protein content was analyzed using the Inhouse Method (IKP/1.0.4.04/LSIH), while carbohydrate content was calculated by subtracting the total volume of macronutrients from the initial sample volume of macronutrients (MacLean et al., 2003).
The samples were also subjected to freeze-drying for 24 h using a LyoQuest-85 apparatus from Azbil Telstar Technologies S.L.U., Spain, until a stable weight was achieved. Subsequently, they were transferred to Falcon tubes and stored in a freezer at -80°C. These freeze-dried samples were sent to the Institute of Nutritional Science at the University of Hohenheim, Germany, where they were analyzed in duplicate for their micronutrient content. Selected minerals, including iron (Fe), zinc (Zn), magnesium (Mg), potassium (K), calcium (Ca), sodium (Na), phosphorus (P), and copper (Cu), were analyzed following the regulations set by the European Commission (EC) (European Commission, 2009). The minerals Ca, Mg, K, Na, P, Fe, Zn, and Cu were analyzed using atomic-emission spectrometers (VistaPRO ICP-OES from Varian Inc., Palo Alto, CA, United States). Meanwhile, iodine content was measured using the ICP-MS NexION 300X instrument from PerkinElmer, Inc., Boston, MA, United States.
Data analysis
The Kolmogorov–Smirnov normality test was initially used to examine the data distribution. The general characteristics of vegetation index classification for Mappi and Merauke Regency were presented in terms of total area and percentage. The paired t-test was employed to compare all areas and the percentage of NDVI classes across the observed years within each regency. Moreover, NDVI values indicating degradation (in degradation classes) were combined and compared between two regencies using the independent t-test. The relationship between the NDVI values of potential sago habitat and NDVI degradation level areas was assessed using Spearman’s rank correlation test.
Sago nutrients and their fulfillment in Mappi and Merauke were compared using the Mann–Whitney non-parametric test. The selected nutrients from 100 g of sago samples were compared with that of the daily recommended nutrient intake of Indonesian non-lactating and non-pregnant women (aged 19–64 years), which was considered as young and middle-aged adults (Ministry of Health of Republic of Indonesia, 2019). Women were selected because of their significant roles in the family life cycle (United Nation System Standing Committee on Nutrition, 2006; Langer et al., 2015). The analysis principally assessed the percentage of daily fulfillment of these selected nutrients when consuming 100 g of sago.
Furthermore, predictors of selected nutrients in sago samples (non-categorical and non-normally distributed data) were associated using the generalized linear model (GLM) (Dobson and Barnett, 2002). For macronutrients, carbohydrate and protein content in sago samples were selected as the independent variables (Grace and Henry, 2020; Setiawan et al., 2022). Additionally, minerals related to the growth of sago, that is, Ca, Cu, Fe, Mg, Na, and P were included as the outcome variables (Yadav and Mahyuddin, 1991; Stenbaek and Jensen, 2010; Grace and Henry, 2020). Based on the examination of the sago growth stage, NDVI values ≤0.4 indicate fruit ripening (Santillan et al., 2012b; Letsoin et al., 2022b). In this article, NDVI values equal to and less than 4 were in between moderate and severe degradation levels. Moreover, the percentage of NDVI classes was used as one of the predictors, instead of its absolute values due to the differences in the total areas of the study regencies, as the area of the Merauke Regency is approximately double the size of Mappi. Only information from 2020 was used for the predictor analysis, as the sago samples were collected during this year. Hence, independent variables included in the first predictor analysis were the regency (1 = Merauke), NDVI classes (1 = combined moderate and severe degradation, toward yellowish color), and percentage of areas in NDVI degradation classes. The second predictor analysis of selected nutrients in sago samples was conducted using similar methods, except that the NDVI classes and percentages used were related to the potential of sago habitat areas. Only independent variables with significant association with the selected nutrients were presented. All analyses were considered statistically significant if the p-value was less than 0.10, using the IBM SPSS statistics version 27 (IBM Corp., Armonk, NY, United States).
Results
Over the years, Mappi and Merauke have experienced land-use transformation because of population and economic growth. Between 2003 and 2017/2018, the population in Mappi increased by approximately 27% to 96,671 persons, while the population in Merauke increased by approximately 23% to 223,289 persons. An increase in population density was also observed from 2.90 to 3.32/km2 in Mappi and from 3.77 to 4.77/km2 in Merauke (BPS-Statistics of Merauke Regency, 2003, 2018; BPS-Statistics of Mappi Regency, 2006, 2018). Approximately, in 1990, the total natural forest and non-forest areas (cropland, grassland, settlements, water and barren land) in Mappi were 1,554,724 and 615,211 ha, respectively; meanwhile, the areas in Merauke were 2,440,396 and 2,411,320 ha, respectively. The larger areas of Merauke than Mappi are also shown on the total estimated sago habitat region, 4,074,407 vs. 1,909,358 ha in 1990, as well as 3,476,030 vs. 1,940,267 ha in 2020, respectively (Appendix Table A1).
After the introduction of rice to the local people, consumption of sago has decreased in the last few decades. Unlike sago and some tubers that are naturally grown or cultivated, rice is primarily distributed regularly as food aid by the government or should be bought in the local market. This condition has caused a dependency on rice, especially among the new generations (Purwestri et al., 2019; Nurhasan et al., 2022). With the growing population, the local government’s promotion of consuming diverse staple foods (Food Security Agency, 2020), and the supporting food security among local households, it is crucial to monitor sago forest area changes and predict the production.
Vegetation indices in Mappi and Merauke during the observed years
Table 2 presents the vegetation index changes in Mappi and Merauke that were recorded from Landsat satellite data, encompassing the period from January 1 to December 31 of 1990, 1996, 2012, 2018, and 2020. No statistically significant differences in NDVI class area conversions across the observed years were found in each regency.
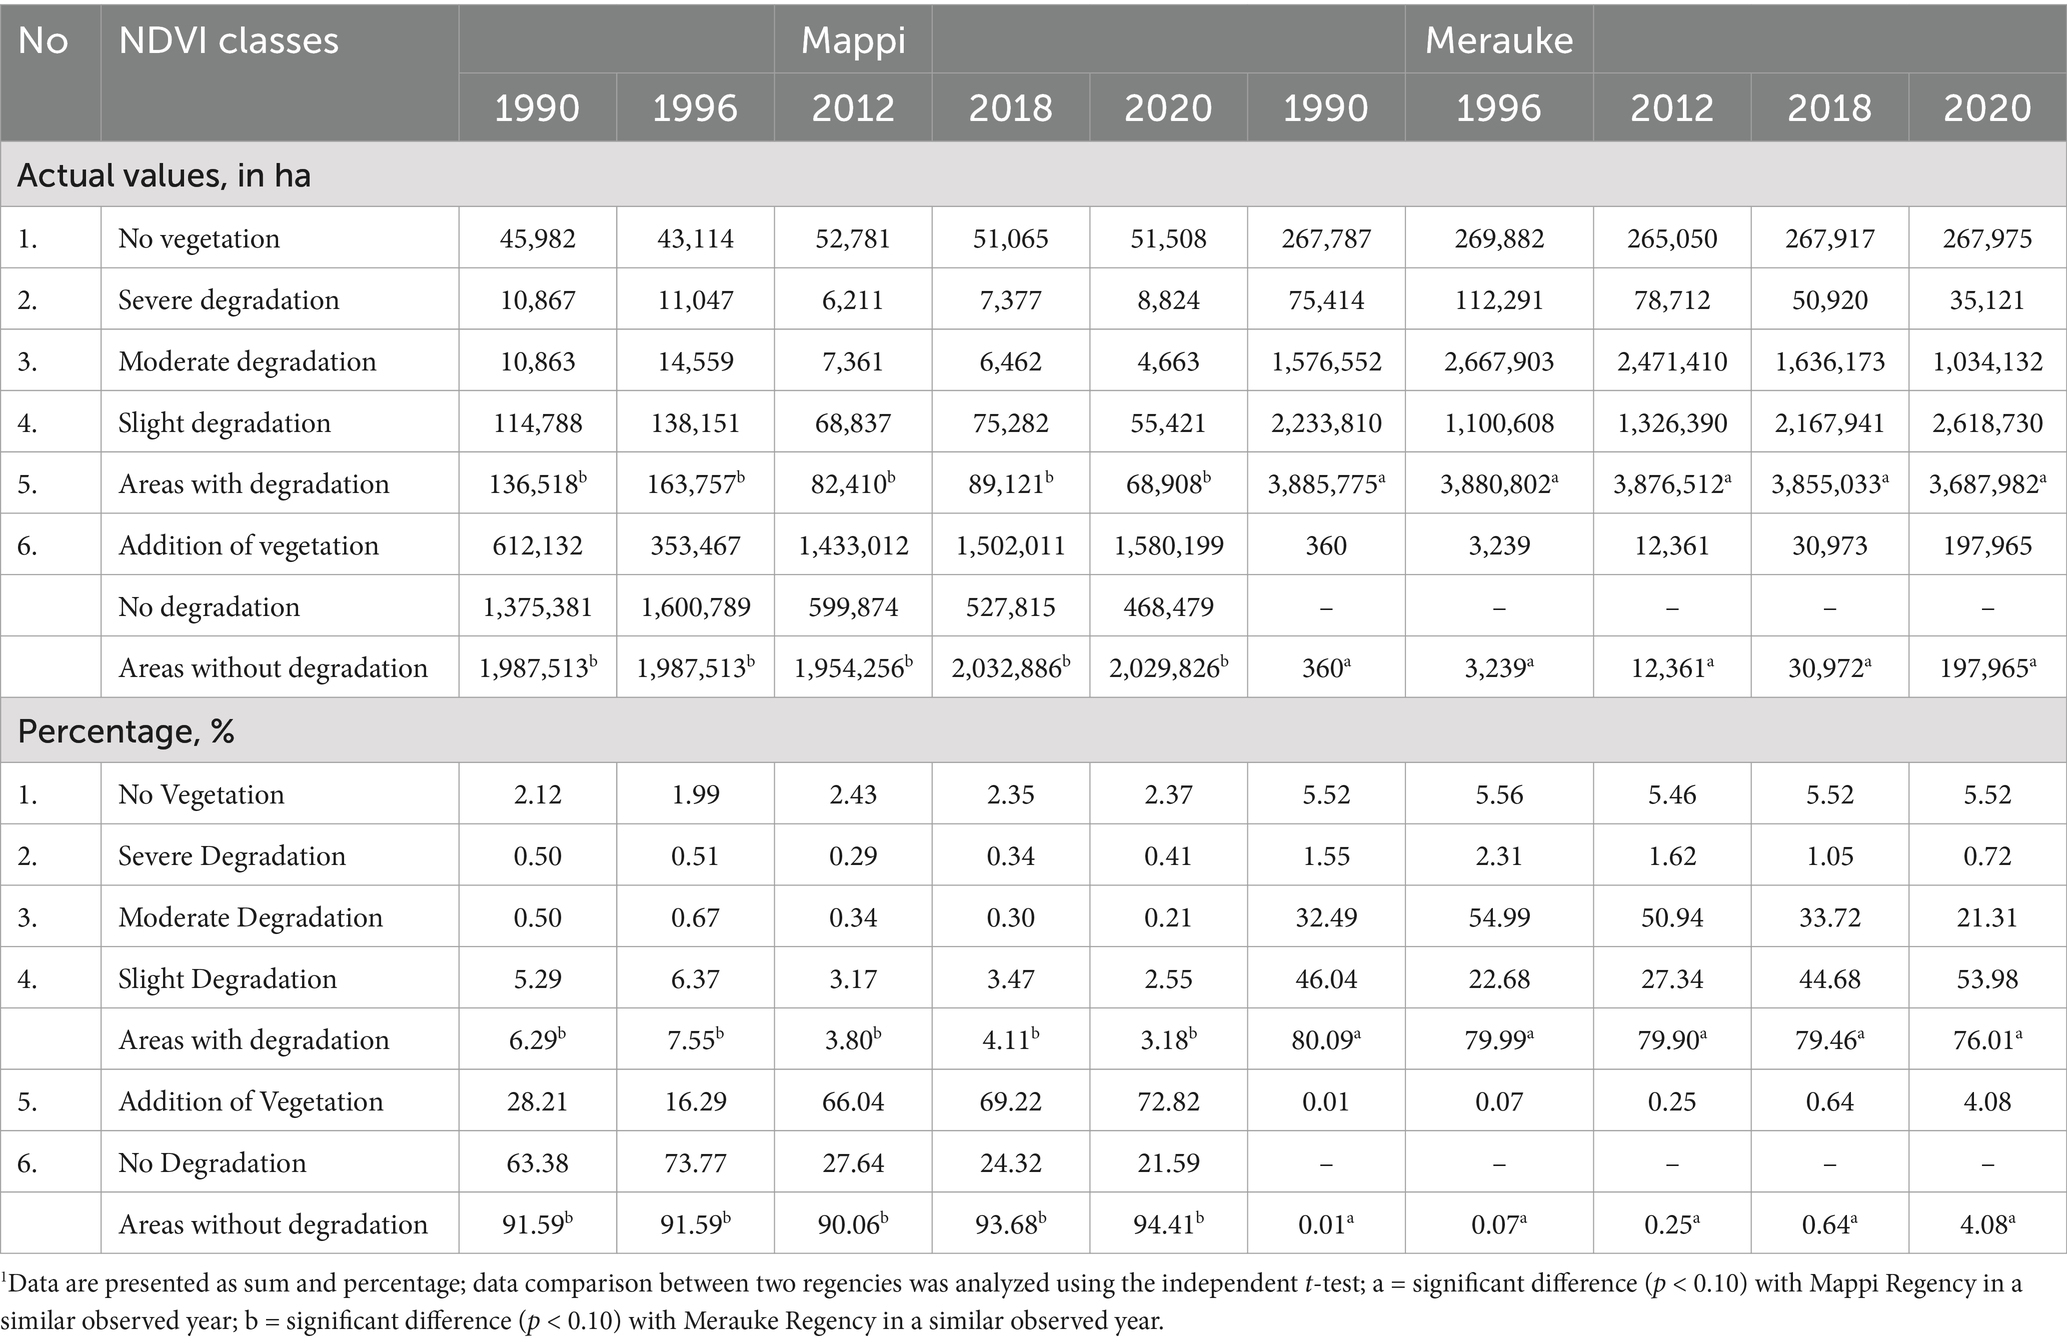
Table 2. NDVI degradation area changes in Mappi and Merauke Regencies in the observed years1.
More than 76% of the total area in Merauke experienced degradation (slight, moderate, or severe) over the observed years, which was significantly higher than in Mappi, where less than 8% of the area was affected (p < 0.10). In Merauke Regency, moderate degradation was more prominent in 1996 and 2012 (approximately 55 and 50%, respectively), whereas slight degradation became more pronounced in 2018 and 2020 (approximately 33 and 21%, respectively), indicating a decrease in degradation level, as also depicted in Figure 4.
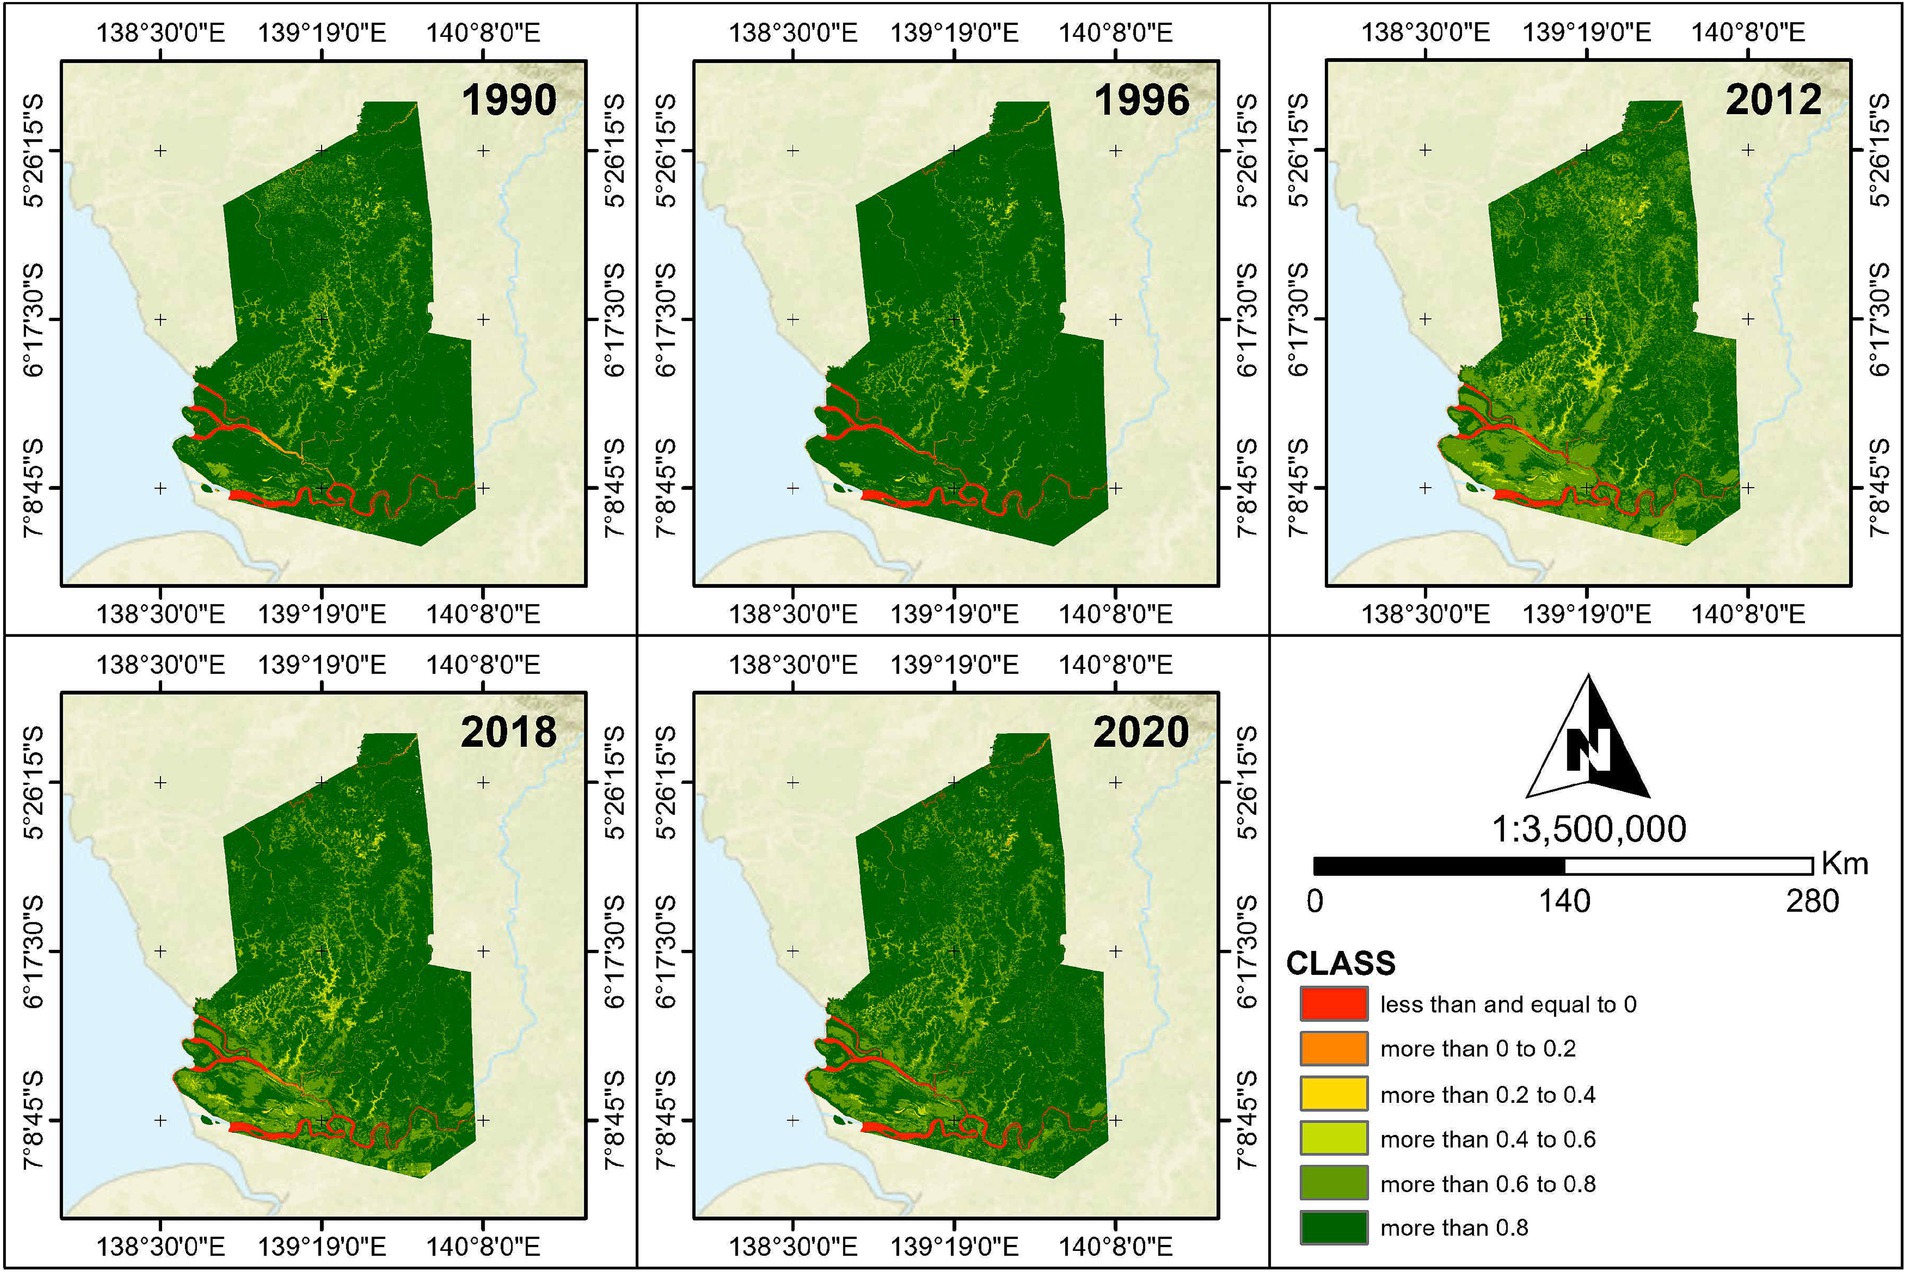
Figure 4. Changes of NDVI degradation classes in Mappi Regency from 1990 to 2020.
Although Merauke occupies a larger forested region, percentages of NDVI classes without degradation in Mappi were higher (approximately 90%) than that in Merauke (less than 5%) (p < 0.10; Table 2). The degraded forested regions in 2012, 2018, and 2020 in Mappi were approximately two times less than in 1990 and 1996, resulting in a darker green color (The NDVI value approaching 1) of the NDVI image in the later years (Figure 5). In Merauke, approximately 700,000 ha, or approximately 14% of the total area, could not be captured due to cloud cover. In contrast, areas with no data in Mappi accounted for less than 5% of the total area.
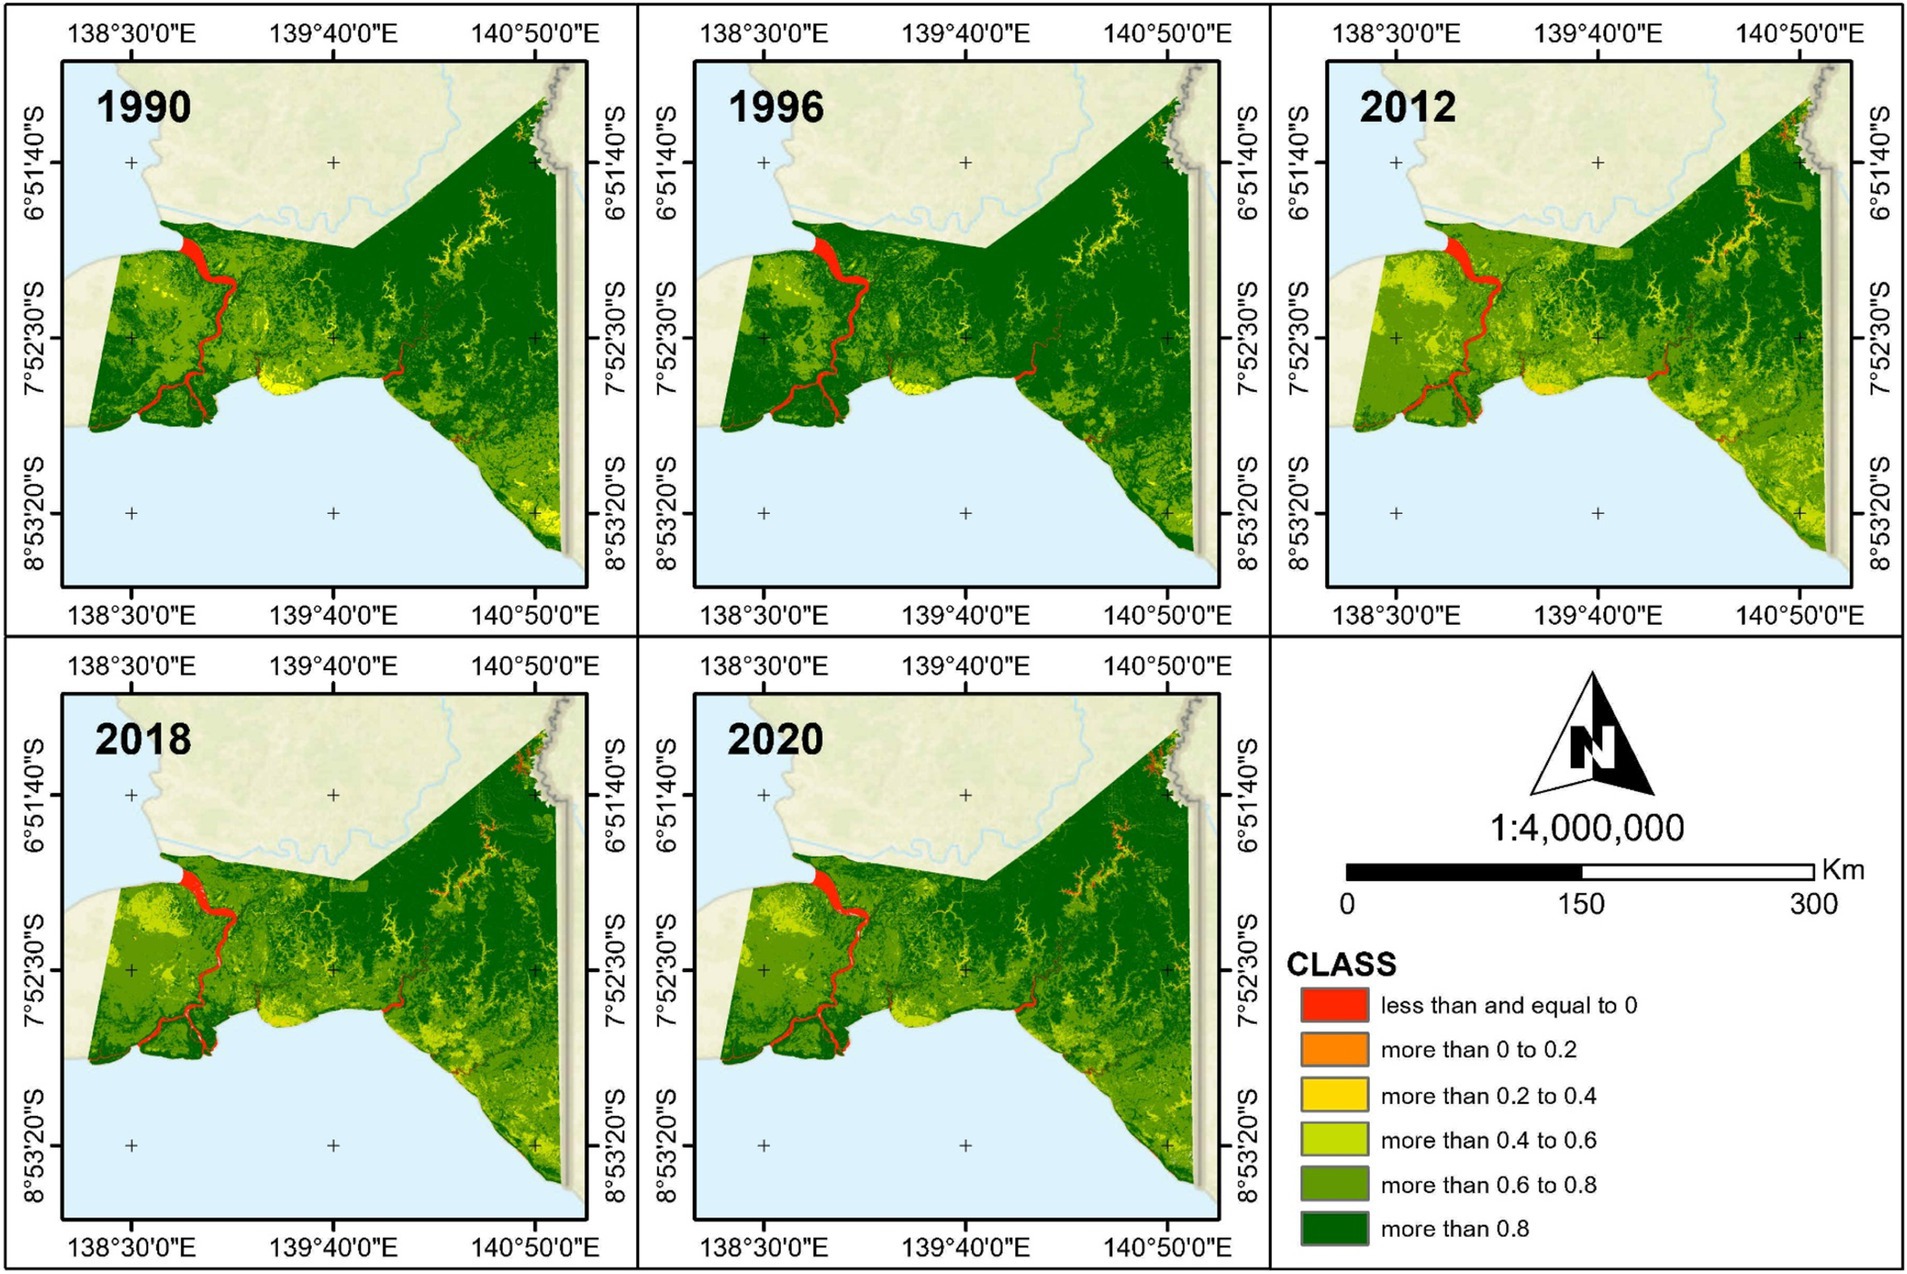
Figure 5. Changes of NDVI degradation classes in Merauke Regency from 1990 to 2020.
As a consequence of the larger forested landscape, the total potential sago areas in Merauke were almost doubled than in Mappi (Appendix Table A1). Overall, approximately 80% of sago habitats were preserved, with the rate of sago area degradation ranging from 3.4 to 4.7% over the 30-year period. Table 3 shows the conversion of potential sago habitat areas and their proportions over the observed years (1990 vs. 2020) and between the study regions (Mappi vs. Merauke) based on the NDVI classifications. Although statistically significant differences between the examined years and the two regencies were not established, a trend of decreasing sago areas can be observed, as also depicted in Figure 6.
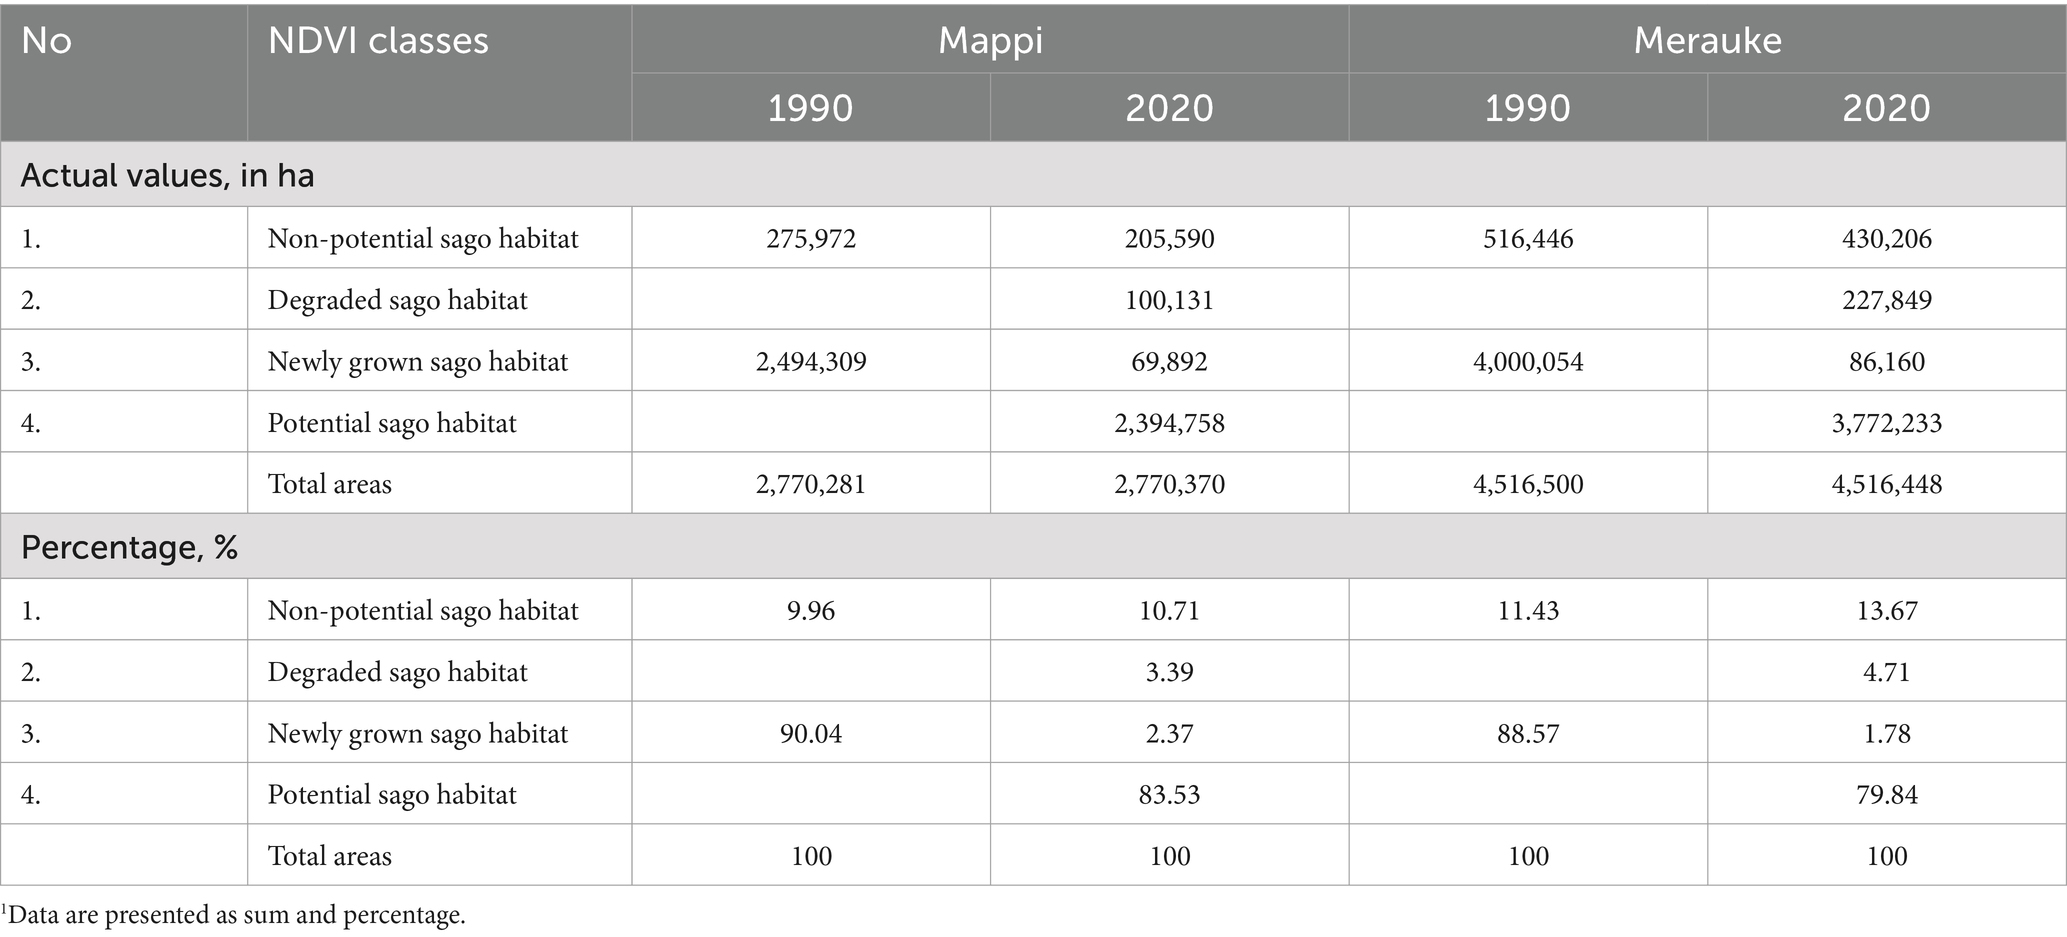
Table 3. NDVI potential sago habitat changes in Mappi and Merauke Regencies in the observed years1.
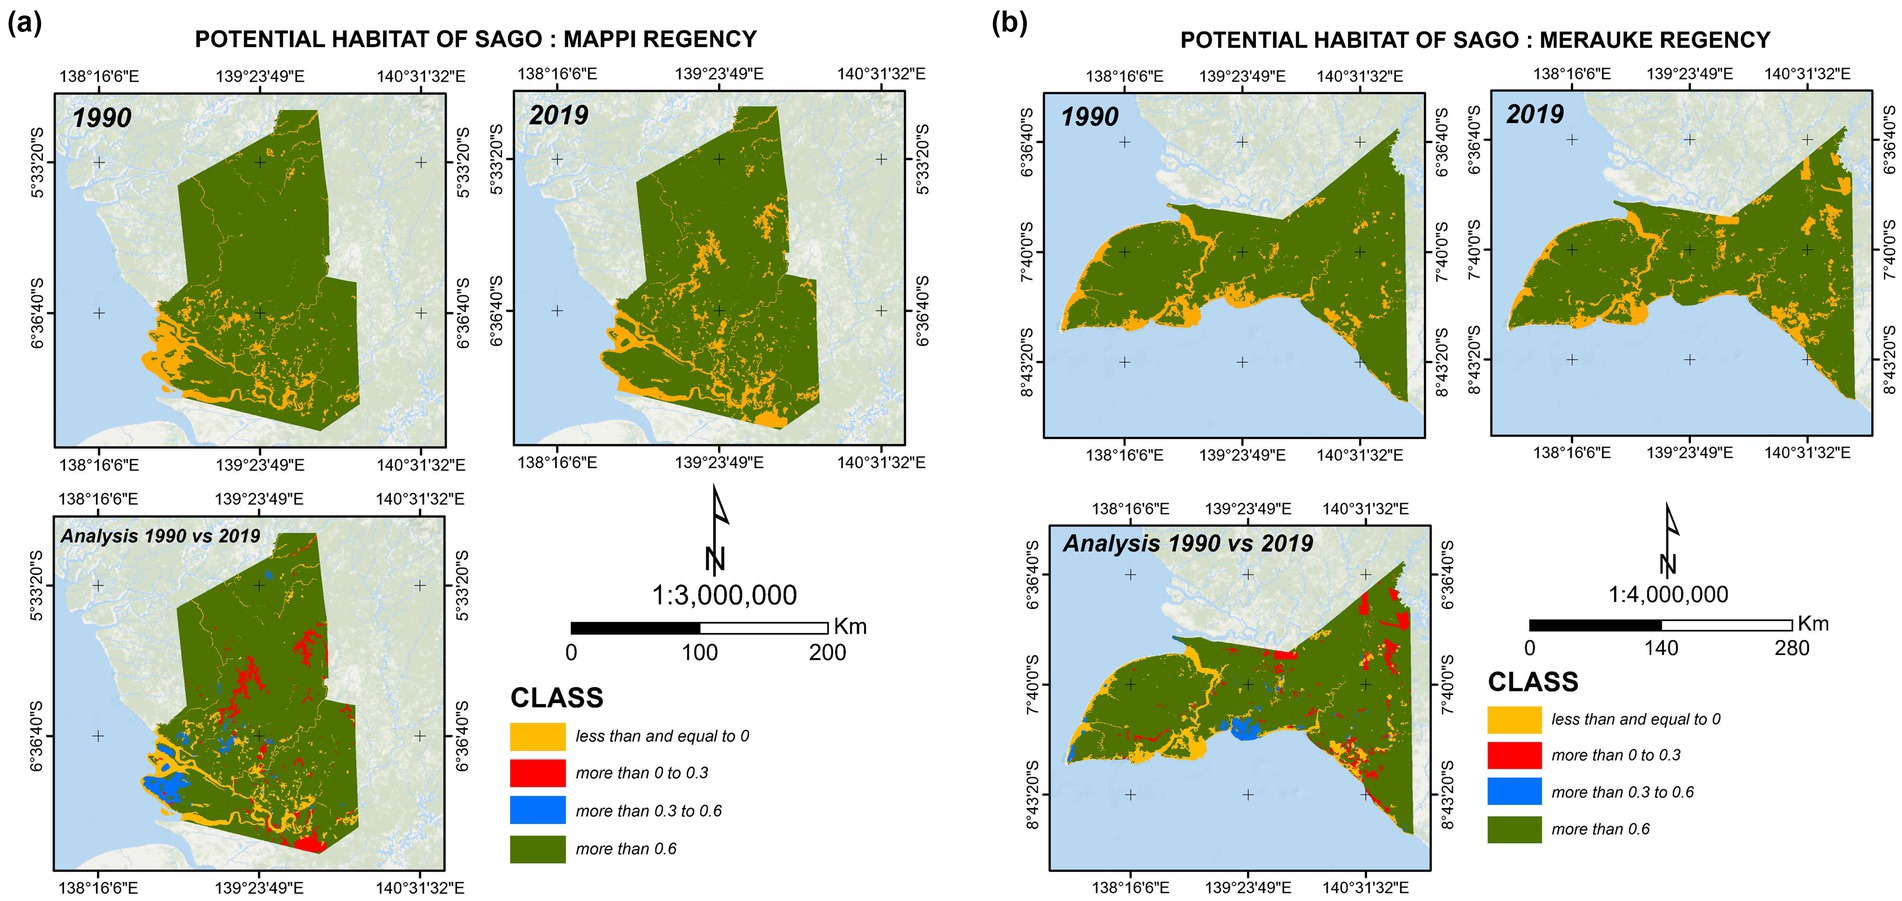
Figure 6. Changes in potential sago habitat: (A) Mappi Regency and (B) Merauke Regency.
The results from the overlayed analysis showed that, of the total 2,494,309 ha of potential sago forests in 1990 in Mappi, approximately 100 thousand hectares have been degraded (Table 3). Meanwhile, of the 275,972 ha of non-potential areas, nearly 70 thousand hectares were newly established as sago forests by 2020. Furthermore, 277,849 ha of sago forests in Merauke have been degraded, while about 86 thousand hectares of non-potential areas became sago forests. There was no significant association between the changes in estimated sago habitat regions (Table 3) and degradation level based on NDVI (Table 2), based on the results of Spearman’s rank correlation test.
The blue area, or additional sago habitat, represents regions acknowledged as nascent or developing sites where sago palms could potentially prosper, despite their previous designation as inappropriate environments for sago cultivation. The advancement of these regions may arise from either natural growth or human-induced factors, encompassing reforestation projects or endeavors aimed at transforming non-sago territories into sago plantations. However, regions where the environmental conditions are not conducive to sago palm growth, which could be due to poor soil quality, water supply, or climatic conditions that do not support the growth of sago, are represented by orange areas or no potential sago habitat. Meanwhile, regions that were previously conducive to the cultivation of sago palms have experienced environmental degradation, making them less capable of supporting sago palm populations. This degradation may be attributed to deforestation and the conversion of land for agricultural or plantation purposes.
Nutritional profile of sago
Table 4 presents the macro and micronutrient content of sago starch from Mappi, compared to that from Merauke Regency. Sago from both sites presented high carbohydrate content but very low levels of carotenoids and riboflavin. The protein, Ca, Cu, Mg, Na, and K content of sago from Mappi were significantly lower than those from Merauke.

Table 4. Nutrient profiles of sago samples and the fulfillment based on the recommended dietary intake of Indonesian adult women aged 19–64 years (Ministry of Health of Republic of Indonesia, 2019).
Sago is recognized as a carbohydrate source, with 100 g of sago fulfilling approximately 24–27% of the recommended daily intake for adult Indonesian women (Table 4). The sago samples contain between 1 and 2 mg of iron per 100 g, fulfilling approximately 9–15% of the daily iron requirement for adult women. The protein, fat, and selected vitamins, as well as most mineral content, do not provide sufficient amounts for the recommended intake per day.
The results of GLM predictor analyses indicated that higher values of the nutrients, such as carbohydrates, Ca, Cu, Mg, and Na, were positively and significantly associated with the location of the collected sago samples (Merauke) (Table 5). Changes in carbohydrate levels were positively associated with the percentage of NDVI combined degradation classes (towards yellowish color) (p = 0.078). No significant association was found between the selected predictors and Fe or P. Only those factors with p < 0.10 are shown in Table 5.

Table 5. Results of predictors analysis of selected nutrients of sago assessed by the generalized linear model.
Discussion
Papuan forests, similar to those in most other Asian and African countries, play a crucial role in the wellbeing and food security of local communities by providing a rich variety of nutrient-dense wild animals and plants (Ickowitz et al., 2014; Powell et al., 2015; Setiawan et al., 2022; Nurhasan et al., 2022; Fetriyuna et al., 2022). Sago serves as a staple food in the local communities of Papua Island and other regions in the eastern part of Indonesia (Sonia et al., 2015), holding considerable socio-cultural and economic importance, particularly in the Papua region (Hisa et al., 2019). Between 2018 and 2019, sago palms grown on approximately 818 hectares (ha) in Mappi produced 0.82 tons per year (BPS-Statistics of Mappi Regency, 2021). Meanwhile, to date, there is no available information concerning the sago production in Merauke. As sago palms in Papuan forests grow wildly (Bintoro et al., 2018), production information was mostly not recorded; hence, monitoring forest cover information becomes essential to track the potential forest provision, both in quantity and quality of sago.
The definition of degradation level using NDVI values typically involves assessing changes in vegetation health and density over time, as well as assessing ecological responses to environmental changes (Pettorelli et al., 2005). It provides essential insights into how climate fluctuations, habitat degradation, and other environmental factors impact ecosystems (Pettorelli et al., 2005; Meneses-Tovar, 2011). Linking NDVI to vegetation dynamics and trophic interactions underscores the importance of predicting future ecological changes and guiding effective environmental management. It is applied to establish correlations between NDVI’s impact on population growth and the environment, as demonstrated by studies such as Li et al. (2022) and Xue et al. (2023).
Overall, the NDVI dynamic changes in Mappi Regency displayed an improvement toward greening (Figure 5) from 1990 to 2020 implying that the regency is covered by healthy plants (Yengoh et al., 2015), especially during their growth phase indicated by high chlorophyll level (Yoder and Waring, 1994; Kizilgeci et al., 2021). Conversely, in Merauke Regency, slight and moderate degradation classes have significantly taken place since 1990 (Table 2). The barren land and forest areas converted into settlements for housing or industry may have affected a consolidation of green areas in Merauke (Letsoin et al., 2022a).
NDVI derived from remote sensing data has also been employed to generate a sago map in the Philippines (Santillan et al., 2012a). The sago maps created were used to determine the availability of sago to support an extensive commercial industry of sago starch in the region. NDVI is also used to detect sago areas in another region of Indonesia (Hidayat et al., 2018). In our study, the NDVI was also used to monitor potential sago habitat areas that can be used for managing forests and preventing them from further forest cover degradation. No statistically significant changes were found in NDVI for potential sago habitats, although an additional habitat area was observed over the examined years in Mappi and Merauke (Table 3). In contrast, Letsoin et al. (2020) revealed a considerable decrease in natural forest classes in Merauke and an increase in estate crop plantation, indicating that NDVI could detect the changes in greenness, but not the type of land use related to sago habitats, or the species of the vegetation.
Optical remote sensing frequently has a considerable amount of missing information due to extreme atmospheric conditions, such as clouds (Letsoin et al., 2023a, 2023b). As radar data are unaffected by clouds, they can be combined with the NDVI to be computed optically by satellite, which also underscores the limitation of this study.
Various studies have included NDVI with a chlorophyll index for agricultural applications (Kizilgeci et al., 2021; Kim et al., 2022). NDVI information has also been correlated with leaf-tissue nutrients to predict sugarcane yield (Pinheiro Lisboa et al., 2018). To our knowledge, this is the first article that connected NDVI values on a regional scale with the nutrient content of sago. When the association between NDVI and the vegetation phase of sago was examined, Letsoin et al. (2022b) found that the harvested age of sago was indicated by less green color due to flowering and fruit ripening. Additionally, NDVI values for the fruit ripening were found to be 0.4 or lower, trending toward a yellowish color (Santillan et al., 2012b). Consistent with these findings, the results from the GLM analysis presented that higher values in carbohydrates were significantly associated with the sample collection location (Merauke) (Table 5) and an increased percentage of NDVI classes, specifically the yellowish areas (Table 2; Figure 6). Moreover, based on a study in Malaysia, amylose and amylopectin, two primary sources of carbohydrates in sago starch found in the samples of sago in different growth stages, gradually increased together with age (Tie et al., 2008). Sago palm maturity is characterized by the attainment of the highest starch content in the trunk, typically occurring at the age of 9–12 years (Bintoro et al., 2018).
The results from the nutrient profile of sago also showed a considerably higher Mg content in sago samples from Merauke than in those from Mappi (p = 0.010), as confirmed by the findings from GLM analysis (Table 5), indicating the abundant chlorophyll that was shown by the green color of leaves. Chlorophyll has Mg as its core mineral content (Stenbaek and Jensen, 2010). Chlorophyll activity in binding protein might influence the protein in sago, contributing to considerably higher protein content in sago from Merauke than from Mappi (p = 0.010; Stenbaek and Jensen, 2010). Furthermore, significantly higher Ca, Cu, and Na content (Ca, Cu, and Na) in sago from Merauke than in those from Mappi (Table 4), which was corroborated by GLM predictor analysis (Table 5), was likely due to the different growth stages of the collected samples (Matsumoto et al., 1998).
Laboratory findings in nutrient profiling of sago implied that harvesting sago at an appropriate harvested age might result in a better carbohydrate and selected mineral content. Sago palm takes various age ranges, between 8 and 12 years, to reach maturity (Jong, 2018; Ming et al., 2018). Sago palms in the Papuan forests are wild stands and not managed (Bintoro et al., 2018); therefore, the NDVI results implied the more mature age of collected sago samples in Merauke than in Mappi, indicating the importance of monitoring to ensure the sago production in quantity and quality. In connection with the nutrient content of sago, our findings showed that areas with a high proportion of yellowish color (Merauke) can indicate a mature stage of sago palms ready for harvest (Santillan et al., 2012b); hence, the NDVI application proves to be practical for use in large areas, like the two study regions. Moreover, NDVI has been utilized to investigate factors such as crop yield production, biomass, and chlorophyll content (Naser et al., 2020; Savasli et al., 2023). In this case, as sago palms grow wild in the forests, there is limited information on their production, especially in Merauke. Therefore, ongoing monitoring of the sago habitat using NDVI is recommended not only to detect the degradation but also to predict the production.
Sago starch has a carbohydrate content per 100 g that is approximately 75–85%, about similar to sweet potatoes (86%) (Grace and Henry, 2020), yet considerably higher than white rice (34%). Uthumporn et al. (2014) found that sago starch concentration can reach 97.9% during specific growth phases, indicating a rich starch composition. The starch has a greater resistant starch concentration than tapioca or wheat starch (Hisa et al., 2019). Sago is also gluten-free and can be used for those who are intolerant to gluten, unlike rice and corn (Kumari, 2019). As sago is a carbohydrate-rich staple food but low in other macronutrients, the higher value in, for example, the protein of sago from Merauke than from Mappi is considered insignificant (Grace and Henry, 2020).
Applying NDVI to examine the potential nutrient content of harvested sago at various stages to enhance its nutritional values can be beneficial to improve the quality. However, the high carbohydrate content and low presence of other nutrients in sago samples (Table 4) suggest that consuming sago should be complemented with other animal-and plant-based foods (such as beans, vegetables, and fruits) to meet the daily recommended intake for local women.
Conclusion
Overall, no statistically significant changes were found in NDVI degradation classes or sago habitat area classifications over the observed years within each regency. However, a significantly higher proportion of degraded areas (>76%) in Merauke was found, with a more pronounced yellowish color than in Mappi (8%). Meanwhile, approximately 90% of areas in Mappi were categorized as having an increase in trees and no degradation, indicating a healthier forested region, than in Merauke (less than 5%).
Despite having categorization under less green areas, findings from GLM predictor analyses showed that higher carbohydrate, protein, Ca, Cu, Mg, and Na content of sago samples were positively and significantly associated with collected samples in Merauke. An increase in carbohydrate levels was also positively and significantly associated with a higher percentage of NDVI classes related to the yellowish color. The results indicated that sago palms in Merauke are more likely from a more mature growth stage, and therefore, the samples were harvested at an older age than those in Mappi. Thus, sago harvested at its mature age is associated with a higher level of carbohydrate, protein, and the selected minerals.
NDVI could indicate the presence of degradation or addition of trees in Mappi and Merauke Regency; however, it could not differentiate between primary forests with mature stages of estate crop plants, nor could it identify certain species. Nevertheless, we suggest ongoing monitoring of the sago habitat using NDVI to detect degradation, predict production, and examine the potential nutrient content of harvested sago at various stages to enhance its nutritional quality.
Data availability statement
The raw data supporting the conclusions of this article will be made available by the authors, without undue reservation.
Author contributions
FF: Conceptualization, Data curation, Formal analysis, Funding acquisition, Investigation, Methodology, Writing – original draft, Writing – review & editing, Validation. RP: Conceptualization, Data curation, Funding acquisition, Investigation, Supervision, Writing – original draft, Writing – review & editing. SL: Conceptualization, Data curation, Formal analysis, Funding acquisition, Investigation, Project administration, Software, Visualization, Writing – original draft, Writing – review & editing. IJ: Conceptualization, Investigation, Methodology, Validation, Visualization, Writing – original draft, Writing – review & editing. FR: Formal analysis, Investigation, Methodology, Software, Validation, Visualization, Writing – review & editing. NW: Data curation, Formal analysis, Investigation, Writing – review & editing. BS: Data curation, Validation, Writing – review & editing. MH: Supervision, Writing – review & editing. DH: Supervision, Writing – review & editing.
Funding
The author(s) declare that financial support was received for the research, authorship, and/or publication of this article. This research was funded by the non-project research of the Faculty of Forestry and Wood Sciences, Czech University of Life Sciences Prague and the Directorate of Research and Community Services (DRPM) of Universitas Padjadjaran (UNPAD) for financing the APC.
Acknowledgments
The authors appreciate the Directorate of Research and Community Services (DRPM) of Universitas Padjadjaran (UNPAD) for supporting this research. The authors also wish to acknowledge the valuable feedback of the reviewers.
Conflict of interest
The authors declare that the research was conducted in the absence of any commercial or financial relationships that could be construed as a potential conflict of interest.
Generative AI statement
The authors declare that Generative AI was used in the creation of this manuscript. During the preparation of this work the authors used ChatGPT in order to check the correctness of the English grammar. After using this tool/service, the authors reviewed and edited the content as needed and take full responsibility for the content of the publication.
Publisher’s note
All claims expressed in this article are solely those of the authors and do not necessarily represent those of their affiliated organizations, or those of the publisher, the editors and the reviewers. Any product that may be evaluated in this article, or claim that may be made by its manufacturer, is not guaranteed or endorsed by the publisher.
Supplementary material
The Supplementary material for this article can be found online at: https://www.frontiersin.org/articles/10.3389/ffgc.2025.1373768/full#supplementary-material
References
Badan Standarisasi Nasional (1992). SNI 01-2973-1992. Syarat Mutu dan Cara Uji Biskuit. Jakarta: Badan Standarisasi Nasional.
Bannari, A., Morin, D., Bonn, F., and Huete, A. (1995). A review of vegetation indices. Remote Sens. Rev. 13, 95–120. doi: 10.1080/02757259509532298
Beisel, N. S., Callaham, J. B., Sng, N. J., Taylor, D. J., Paul, A. L., and Ferl, R. J. (2018). Utilization of single-image normalized difference vegetation index (SI-NDVI) for early plant stress detection. Appl. Plant Sci. 6:e01186. doi: 10.1002/aps3.1186
Bintoro, M. H., Nurulhaq, M. I., Pratama, A. J., Ahmad, F., and Ayulia, L. (2018). Growing area of sago palm and its environment. In Sago palm: Multiple contributions to food security and sustainable livelihoods. (Eds.) H. Ehara, Y. Toyoda, and D. V. Johnson (Singapore: Springer Open), 17–69.
BPS-Statistics of Mappi Regency (2006). Mappi regency in figures 2006. Mappi, Papua, Indonesia: BPS-Statistics of Mappi Regency.
BPS-Statistics of Mappi Regency (2018). Mappi regency in figures 2018. Mappi, Papua, Indonesia: BPS-Statistics of Mappi Regency.
BPS-Statistics of Mappi Regency (2021). Mappi regency in figures 2020. Mappi, Papua, Indonesia: BPS-Statistics of Mappi Regency.
BPS-Statistics of Merauke Regency (2003). Merauke regency in figures 2003. Merauke, Papua, Indonesia: BPS-Statistics of Mappi Regency.
BPS-Statistics of Merauke Regency (2018). Merauke Regency in Figures 2018. Merauke, Papua, Indonesia: BPS-Statistics of Mappi Regency.
BPS-Statistics of Merauke Regency (2020). Merauke Regency in Figures 2020. Merauke, Papua, Indonesia: BPS-Statistics of Merauke Regency.
BPS-Statistics of Papua Province (2020). Papua Province in figures 2020. Jayapura, Papua, Indonesia: BPS-Statistics of Papua Province.
Dobson, A. J., and Barnett, A. G. (2002). An introduction to generalized linear models. Texts in statistical science series. Boca Raton, FL: Chapman and Hall/CRC.
Ehara, H., Toyoda, Y., and Johnson, D. V. (2018). Sago palm: Multiple contributions to food security and sustainable livelihoods. Berlin: Springer Nature.
European Commission (2009). Commission Regulation (EC) No 152/2009 of 27 January 2009. Laying down the methods of sSampling and analysis for the official control of feed. Official. Journal of the European Union 6, 1–130.
Farias, G. D., Bremm, C., Bredemeier, C., de Lima Menezes, J., Alves, L. A., Tiecher, T., et al. (2023). Normalized difference vegetation index (NDVI) for soybean biomass and nutrient uptake estimation in response to production systems and fertilization strategies. Front. Sustain. Food Syst. 6:681. doi: 10.3389/fsufs.2022.959681
Farrar, T. J., Nicholson, S. E., and Lare, A. R. (1994). The influence of soil type on the relationships between NDVI, rainfall, and soil moisture in semiarid Botswana. II. NDVI response to soil moisture. Remote Sens. Environ. 50, 121–133. doi: 10.1016/0034-4257(94)90039-6
Feranec, J., Soukup, T., Hazeu, G., and Jaffrain, G. (2016). European landscape. Dynamics: CORINE Land Cover Data, CRC Press.
Fetriyuna, F., Letsoin, S. M. A., Jati, I. R. A. P., and Purwestri, R. C. (2024). Potential of underutilized sago for bioenergy uses. Int. J. Adv. Sci. Eng. Inf. Technol. 14, 144–150. doi: 10.18517/ijaseit.14.1.19202
Fetriyuna, F., Letsoin, S. M. A., Jati, I. R. A., Purwestri, R. C., Setiawan, B., Wirawan, N. N., et al. (2022). Potential uses of underutilized sago to support the sustainability of food supply and bioeconomy. Res. Mil. 12, 1398–1415.
Food Security Agency. (2020). Roadmap Diversifikasi Pangan 2020–2024. (food diversification roadmap 2020–2024″) edition: 2020–2024. Food Security Agency.
Gitelson, A. A., and Merzlyak, M. N. (1997). Remote estimation of chlorophyll content in higher plant leaves. Int. J. Remote Sens. 18, 2691–2697. doi: 10.1080/014311697217558
Grace, N. C., and Henry, C. J. (2020). The physicochemical characterization of unconventional starches and flours used in Asia. Food Secur. 9:182. doi: 10.3390/foods9020182
Hidayat, S., Matsuoka, M., Baja, S., and Rampisela, D. A. (2018). Object-Based image analysis for sago palm classification: the Most important features from high-resolution satellite imagery. Remote Sens. 10:1319. doi: 10.3390/rs10081319
Hisa, L., Mahuze, A., and Arka, I. W. (2019). Dokumentasi etnobotani-linguistik tumbuhan sagu: laporan awal dari etnis marori di taman nasional wasur merauke. Linguist. Indones. 35, 187–200. doi: 10.26499/li.v35i2.69
Huang, B., Yang, Y., Li, R., Zheng, H., Wang, X., Wang, X., et al. (2022). Integrating remotely sensed leaf area index with biome-BGC to quantify the impact of land use/land cover change on water retention in Beijing. Remote Sens. 14:743. doi: 10.3390/rs14030743
Huertas Bernal, D. C., Purwestri, R. C., Perdana, M. C., Hájek, M., Tahri, M., Palátová, P., et al. (2021). Societal implications of Forest and water body area evolution in Czechia and selected regions. Remote Sens. 13:4019. doi: 10.3390/rs13194019
Ickowitz, A., Powell, B., Salim, M. A., and Sunderland, T. C. H. (2014). Dietary quality and tree cover in Africa. Glob. Environ. Chang. 24, 287–294. doi: 10.1016/j.gloenvcha.2013.12.001
Kim, K. H., Shawon, M. R. A., An, J. H., Lee, H. J., Kwon, D. J., Hwang, I. C., et al. (2022). Effect of shade screen on sap flow, chlorophyll fluorescence, NDVI, plant growth and fruit characteristics of cultivated paprika in greenhouse. Agriculture 12:1405. doi: 10.3390/agriculture12091405
Kizilgeci, F., Yildirim, M., Islam, M. S., Ratnasekera, D., Iqbal, M. A., and Sabagh, A. E. L. (2021). Normalized difference vegetation index and chlorophyll content for precision nitrogen Management in Durum Wheat Cultivars under semi-arid conditions. Sustain. For. 13:3725. doi: 10.3390/su13073725
Kok, Z. H., Shariff, A. R. B. M., Khairunniza-Bejo, S., Kim, H. T., Ahamed, T., Cheah, S. S., et al. (2021). Plot-Based classification of macronutrient levels in oil palm trees with Landsat-8 images and machine learning. Remote Sens. 13:2029. doi: 10.3390/rs13112029
Konuma, H., Susanto, S., Mizota, C., et al. (2000). Growing area of sago palm and its environment. Metroxylon Sagu.
Koonlin, T. (1979). The palm economy, in particular the swamp sago economy in Southeast Asia. JATBA 26, 129–146. doi: 10.3406/jatba.1979.3794
Kumari, S. (2019). Development and quality assessment of gluten-free bread prepared by using Rice flour, Corn starch and Sago flour. Pharm. Innov. 8, 39–43. doi: 10.22271/tpi.2019.v8.i9a.3955
Langer, A., Meleis, A., Knaul, F. M., Atun, R., Aran, M., Arreola-Ornelas, H., et al. (2015). Women and health: the key for sustainable development. Lancet 386, 1165–1210. doi: 10.1016/S0140-6736(15)60497-4
Letsoin, S. M. A., Guth, D., Herak, D., and Purwestri, R. C. (2023a). Analyzing maize plant height using unmanned aerial vehicle (UAV) based on digital surface models (DSM). IOP Conference Series: Earth and Environmental Science.
Letsoin, S. M. A., Herak, D., and Purwestri, R. C. (2022a). Evaluation land use cover changes over 29 years in Papua Province of Indonesia using remote sensing data. IOP Conf. Ser. Earth Environ. Sci. 1034:012013. doi: 10.1088/1755-1315/1034/1/012013
Letsoin, S. M. A., Herak, D., Rahmawan, F., and Purwestri, R. C. (2020). Land cover changes from 1990 to 2019 in Papua, Indonesia: results of the remote sensing imagery. Sustain. For. 12:6623. doi: 10.3390/su12166623
Letsoin, S. M. A., Purwestri, R. C., Perdana, M. C., Hnizdil, P., and Herak, D. (2023b). Monitoring of Paddy and Maize fields using Sentinel-1 SAR data and NGB images: a case study in Papua, Indonesia. Processes 11:647. doi: 10.3390/pr11030647
Letsoin, S. M. A., Purwestri, R. C., Rahmawan, F., and Herak, D. (2022b). Recognition of sago palm trees Based on transfer learning. Remote Sens. 14:4932. doi: 10.3390/rs14194932
Li, Y., Gong, J., Zhang, Y., and Gao, B. (2022). NDVI-Based greening of alpine steppe and its relationships with climatic change and grazing intensity in the Southwestern Tibetan plateau. Land 11:975. doi: 10.3390/land11070975
MacLean, W. C., and Warwick, P.Food and Agriculture Organization of the United Nations (2003). Food energy: Methods of analysis and conversion factors: Report of a technical workshop, Rome, 3–6 December 2002. Rome: Food and Agriculture Organization of the United Nations.
Matsumoto, M., Osaki, M., Nuyim, T., Jongskul, A., Eam-on, P., Kitaya, Y., et al. (1998). Nutritional characteristics of sago palm and oil palm in tropical peat soil. J. Plant Nutr. 21, 1819–1841. doi: 10.1080/01904169809365526
Ming, R. Y. C., Sobeng, Y., Zaini, F., and Busri, N. (2018). Suitability of peat swamp areas for commercial production of sago palms: the Sarawak experience, vol. 91. Singapore: Springer Singapore.
Ministry of Health of Republic of Indonesia. (2019). Peraturan Menteri Kesehatan Republik Indonesia Nomor 28 Tahun 2019 Tentang Angka Kecukupan Gizi Yang Dianjurkan Untuk Masyarakat Indonesia. Available at: http://hukor.kemkes.go.id/uploads/produk_hukum/PMK_No__28_Th_2019_ttg_Angka_Kecukupan_Gizi_Yang_Dianjurkan_Untuk_Masyarakat_Indonesia.pdf. (Accessed Nov 1, 2021).
Mofu, S. S., and Abbas, B. (2015). Development of sago palm research and agroindustry in University of Papua. Proceeding of the 12th international sago symposium in Tokyo, Japan. Japan Society for the Promotion Science.
Murdjoko, A., Marsono, D., Sadono, R., and Hadisusanto, S. (2016). Plant species composition and their conspecific association in natural tropical rainforest, South Papua. Biosaintifika 8, 33–46. doi: 10.15294/biosaintifika.v8i1.5217
Naser, M., Khosla, R., Longchamps, L., and Dahal, S. (2020). Using NDVI to differentiate wheat genotypes productivity under dryland and irrigated conditions. Remote Sens. 12:824. doi: 10.3390/rs12050824
Nurhasan, M., Maulana, A. M., Ariesta, D. L., Usfar, A. A., Napitupulu, L., Rouw, A., et al. (2022). Toward a sustainable food system in West Papua, Indonesia: exploring the links between dietary transition, food security, and forests. Front. Sustain. Food Syst. 5:186. doi: 10.3389/fsufs.2021.789186
Pettorelli, N., Vik, J. O., Mysterud, A., Gaillard, J. M., Tucker, C. J., and Stenseth, N. C. (2005). Using the satellite-derived NDVI to assess ecological responses to environmental change. Trends Ecol. Evol. 20, 503–510. doi: 10.1016/j.tree.2005.05.011
Pinheiro Lisboa, I., Melo Damian, J., Roberto Cherubin, M., Silva Barros, P. P., Ricardo Fiorio, P., Cerri, C. C., et al. (2018). Prediction of sugarcane yield Based on NDVI and concentration of leaf-tissue nutrients in fields managed with straw removal. Agronomy 8:196. doi: 10.3390/agronomy8090196
Powell, B., Thilsted, S. H., Ickowitz, A., Termote, C., Sunderland, T., and Herforth, A. (2015). Improving diets with wild and cultivated biodiversity from across the landscape. Food Sec. 7, 535–554. doi: 10.1007/s12571-015-0466-5
Purwestri, R. C., Hájek, M., Šodková, M., and Jarský, V. (2020). How are wood and non-wood Forest products utilized in the Czech Republic? A preliminary assessment of a Nationwide survey on the bioeconomy. Sustain. For. 12, 1–12. doi: 10.3390/su12020566
Purwestri, R. C., Powell, B., Rowland, D., and Wirawan, N. (2019). From growing food to growing cash: Understanding the drivers of food choice in the context of rapid agrarian change in Indonesia. Available at: https://www.cifor.org/knowledge/publication/7360/. (Accessed May 16, 2022).
Ramadhani, F., Pullanagari, R., Kereszturi, G., and Procter, J. (2020). Automatic mapping of rice growth stages using the integration of sentinel-2, mod13q1, and sentinel-1. Remote Sens. 12:3613. doi: 10.3390/rs12213613
Ramankutty, N., and Foley, J. A. (1999). Estimating historical changes in global land cover: croplands from 1700 to 1992. Glob. Biogeochem. Cycles 13, 997–1027. doi: 10.1029/1999GB900046
Santillan, J. R., Santillan, M. M., and Francisco, R. (2012a). Using remote sensing to map the distribution of sago palms in NORTHEASTERN MINDANAO, Philippines: Results BASED on LANDSAT ETM+ image analysis. Thailand: Pattaya.
Santillan, M. M., Santillan, J. R., and Japitana, M. V. (2012b). Analysis of in-situ spectral reflectance and vegetation indices of sago palms for empirical estimation of structural attributes: Implications for estimation using Worldview-2 imagery. Thailand: Pattaya.
Savasli, E., Önder, O., Dayıoglu, R., Belen, S., Çakmak, M., Çekiç, C., et al. (2023). Estimating grain and biomass yield of bread wheat genotypes by optical sensors. Eur. J. Agron. 150:126923. doi: 10.1016/j.eja.2023.126923
Setiawan, B., Fetriyuna, F., and Angelina, S. M. (2022). A sago positive character: a literature review. J. Ilmiah Kedokteran Wijaya Kusuma 11, 145–155. doi: 10.30742/jikw.v11i2.2443
Shanahan, J. F., Schepers, J. S., Francis, D. D., Varvel, G. E., Wilhelm, W. W., Tringe, J. M., et al. (2001). Use of remote-sensing imagery to estimate corn grain yield. Agron. J. 93, 583–589. doi: 10.2134/agronj2001.933583x
Šodková, M., Purwestri, R. C., Riedl, M., Jarský, V., and Hájek, M. (2019). What drives the forest visit? Results of a national survey in Czech Republic. Manuscript in preparation.
Sonia, S., Witjaksono, F., and Ridwan, R. (2015). Effect of cooling of cooked white rice on resistant starch content and glycemic response. Asia Pac. J. Clin. Nutr. 24, 620–625. doi: 10.6133/apjcn.2015.24.4.13
Steele, M., Gitelson, A. A., and Rundquist, D. (2008). Nondestructive estimation of leaf chlorophyll content in grapes. Am. J. Enol. Vitic. 59, 299–305. doi: 10.5344/ajev.2008.59.3.299
Stenbaek, A., and Jensen, P. E. (2010). Redox regulation of chlorophyll biosynthesis. Phytochemistry 71, 853–859. doi: 10.1016/j.phytochem.2010.03.022
Tie, A. P., Karim, A. A., and Manan, D. M. A. (2008). Physicochemical properties of starch in sago palms (Metroxylon sagu) at different growth stages. Starch Stärke 60, 408–416. doi: 10.1002/star.200700707
United Nation System Standing Committee on Nutrition (2006). The double burden of malnutrition - a challenge for cities worldwide: SCN statement. Canada: Vancouver.
Uthumporn, U., Wahidah, N., and Karim, A. A. (2014). Physicochemical properties of starch from sago (Metroxylon sagu) palm grown in mineral soil at different growth stages. IOP Conf. Ser. Mater. Sci. Eng. 62, –12026. doi: 10.1088/1757-899X/62/1/012026
Van Heist, M., Liswanti, N., Boissière, M., Padmanaba, M., Basuki, I., and Sheil, D. (2015). Exploring local perspectives for conservation planning: a case study from a remote Forest Community in Indonesian Papua. Forests 6, 3278–3303. doi: 10.3390/f6093278
Vogelmann, J. E., Tolk, B., and Zhu, Z. (2009). Monitoring forest changes in the southwestern United States using multitemporal Landsat data. Remote Sens. Environ. 113, 1739–1748. doi: 10.1016/j.rse.2009.04.014
Wang, R., Cherkauer, K., and Bowling, L. (2016). Corn response to climate stress detected with satellite-Based NDVI time series. Remote Sens. 8:269. doi: 10.3390/rs8040269
Wang, C., Lu, Z., and Haithcoat, T. L. (2007). Using landsat images to detect oak decline in the mark twain national forest, Ozark highlands. For. Ecol. Manag. 240, 70–78. doi: 10.1016/j.foreco.2006.12.007
Waser, L. T., and Schwarz, M. (2006). Comparison of large-area land cover products with national forest inventories and CORINE land cover in the European Alps. Int. J. Appl. Earth Obs. Geoinf. 8, 196–207. doi: 10.1016/j.jag.2005.10.001
Wiegand, C. L., Richardson, A. J., Escobar, D. E., and Gerbermann, A. H. (1991). Vegetation indices in crop assessments. Remote Sens. Environ. 35, 105–119. doi: 10.1016/0034-4257(91)90004-P
Xi, G., Huang, X., Xie, Y., Gang, B., Bao, Y., Dashzebeg, G., et al. (2021). Detection of larch Forest stress from Jas’s larch inchworm (Erannis jacobsoni Djak) attack using hyperspectral remote sensing. Remote Sens. 14:124. doi: 10.3390/rs14010124
Xu, W., Rosenow, D. T., and Nguyen, H. T. (2000). Stay green trait in grain sorghum: relationship between visual rating and leaf chlorophyll concentration. Plant Breed. 119, 365–367. doi: 10.1046/j.1439-0523.2000.00506.x
Xue, X., Wang, Z., and Hou, S. (2023). NDVI-Based vegetation dynamics and response to climate changes and human activities in Guizhou Province, China. Forests 14:753. doi: 10.3390/f14040753
Yadav, D. P., and Mahyuddin, M. (1991). NUTRITIVE EVALUATION OF SAGO FIBRE. Asian Australas. J. Anim. Sci. 4, 177–182. doi: 10.5713/ajas.1991.177
Yengoh, G. T., Dent, D., Olsson, L., Tengberg, A. E., Tucker, C. J., Yengoh, G. T., et al. (2015). “Applications of NDVI for land degradation assessment” in Use of the normalized difference vegetation index (NDVI) to assess land degradation at multiple scales (Cham: Springer International Publishing).
Keywords: NDVI, remote sensing, macronutrient, micronutrient, sago
Citation: Fetriyuna F, Purwestri RC, Letsoin SMA, Jati IRAP, Rahmawan F, Wirawan NN, Setiawan B, Hájek M and Herák D (2025) Exploring the implication of changes in forest cover on sago nutrients: insights from monitoring in selected regions of Papua, Indonesia. Front. For. Glob. Change. 8:1373768. doi: 10.3389/ffgc.2025.1373768
Edited by:
Manoj Kumar, Indian Council of Forestry Research and Education (ICFRE), IndiaReviewed by:
Sumit Chakravarty, Uttar Banga Krishi Viswavidyalaya, IndiaOka Karyanto, Gadjah Mada University, Indonesia
Copyright © 2025 Fetriyuna, Purwestri, Letsoin, Jati, Rahmawan, Wirawan, Setiawan, Hájek and Herák. This is an open-access article distributed under the terms of the Creative Commons Attribution License (CC BY). The use, distribution or reproduction in other forums is permitted, provided the original author(s) and the copyright owner(s) are credited and that the original publication in this journal is cited, in accordance with accepted academic practice. No use, distribution or reproduction is permitted which does not comply with these terms.
*Correspondence: Fetriyuna Fetriyuna, ZmV0cml5dW5hQHVucGFkLmFjLmlk, Sri Murniani Angelina Letsoin, bGV0c29pbkB1bm11cy5hYy5pZA== Ignasius Radix A. P. Jati, cmFkaXhAdWt3bXMuYWMuaWQ=