 Jake Barker
 Jimmy Voorhis
 Sinéad M. Crotty
- 1Carbon Containment Lab, New Haven, CT, United States
- 2The Forest School at the Yale School of the Environment, New Haven, CT, United States
- 3Kodama Systems, Sonora, CA, United States
Pile burning of thinned residues is a critical tool to dispose of fuels and to reduce wildfire risk in overstocked, fire-prone forests globally. However, cost estimates of pile burning are limited. In the Western United States, where fuel reduction and pile burning are key strategies to mitigate risk of severe wildfire, previous reports estimate that the average cost of pile burning after machine treatment is $543 ac−1 ($1,343 ha−1). There is, however, limited information on the costs of hand thinning and pile burning. In response, this study quantified the costs of cutting and yarding, piling, and burning residues via two pathways: the USDA Forest Service (USFS) Activity Tracking System (FACTS) database, and interviews with 11 USFS fire management professionals from California, Oregon, and Washington. Interviews highlighted cost drivers, implementation constraints, and opportunities for efficiency improvements. The average costs of piling and burning machine piles as determined from the interviews were $735 ± $464 ac−1 ($1,817 ± $1,146 ha−1; all mean ± SD), 80% higher than reported in the FACTS database and 35% higher than previous reports. The average costs of piling and burning hand piles as determined from the interviews were $1,291 ± $717 ac−1 ($3,190 ± $1,722 ha−1), 135% higher than reported in the FACTS database. Interview participants reported proximity to roads and terrain as key cost drivers, and described common practices, challenges, and constraints to pile burning. Geospatial analyses supported interviewee-identified cost drivers, district road density (a proxy for accessibility) and district maximum elevation (a proxy for terrain). Simulations of direct emissions from pile burning on National Forests included in this study indicated annual emissions of 11,322 metric tons (MT) of particulate matter (PM), 8,029 MT of PM10, and 6,993 MT of PM2.5 across the study area. In addition, pile burning on these National Forests annually emits >1.7 million MT CO2, 61,515 MT of carbon monoxide, 3,823 MT of methane, and 3,211 MT of non-methane hydrocarbons. Given the economic, human health, and climate implications of current pile burning practice, removing residues as feedstocks for carbon-negative utilizations is recommended as a near-term priority. Policy mechanisms, such as feedstock production, transport, or offtake subsidies of a similar magnitude to such avoided costs, could efficiently incentivize residue removal and support such climate-positive utilizations.
1 Introduction
Climate change exacerbates wildfire behavior and increases risks and costs for communities, requiring complex and often costly management (Marshall et al., 2023; Filkov et al., 2020; Higuera and Abatzoglou, 2021). Rising temperatures and intense drought conditions are fueling atypically severe and damaging wildfire seasons in forests around the world, including in the western United States (e.g., 2020 Wildfire Season; Higuera and Abatzoglou, 2021), Australia (e.g., 2019–2020 Black Summer fires; Nolan et al., 2021), Canada (e.g., 2023 fire season with hotspots in British Columbia, Alberta, the Northwest Territories, and Quebec; Jain et al., 2024), the Mediterranean (e.g., 2021 and 2023 wildfires in Greece, Turkey, and Italy; Giannaros and Papavasileiou, 2023; Statista, 2021), and Siberia (e.g., 2021 wildfires in Yakutia; Tomshin and Solovyev, 2022). These severe wildfires release greenhouse gases and criteria air pollutants into the atmosphere and have long-term environmental impacts, such as driving ecological transitions (Burton et al., 2022; Lasslop et al., 2019). Managing fire through mitigation, suppression, and recovery is often expensive for governments and scrutinized by the public (Penman and Cirulis, 2020). Hazardous fuel management–a critical component of reducing fire risk in addition to suppression and recovery costs–requires multi-year planning and budgeting and is becoming a key task for forest managers around the world (Marshall et al., 2023; Elia et al., 2016).
The U.S. West stands out globally as a region experiencing a surge in extreme wildfire events, with fire activity that diverges sharply from natural fire behavior. Historically, fire shaped the structure and composition of forests in the western U.S. for thousands of years (Wright and Heinselman, 1973; Knight et al., 2022). In addition to natural wildfires, intentional broadcast burning by Indigenous peoples served to remove fuels and reduce wildfire risk since the entry of early hunting cultures during the Pleistocene Epoch (Shinn, 1980). In the early 20th century, however, the U.S. government shifted policy toward fire suppression. In combination with the harvest of larger, merchantable trees, this policy led to a buildup of small-diameter fuels across forested landscapes (Busenberg, 2004). Meanwhile, over the past several decades drought frequency and intensity has increased with climate change (Strzepek et al., 2010; Abatzoglou and Williams, 2016). The result is 10’s of millions of acres of forestland overstocked with small-diameter trees, a situation which presents a high risk of catastrophic fire.
In response to mounting fire risk, the USDA Forest Service (USFS) and cooperating agencies are increasing the pace and scale of forest management aimed at the reduction of hazardous fuels across the landscape (USDA Forest Service, 2022a, 2022b). During hazardous fuels treatments, forest managers and cooperating contractors can use a range of methods to remove understory vegetation (i.e., surface fuels), small trees (i.e., ladder fuels), and carefully selected larger trees. In doing so, the remaining trees are more resilient to wildfire by reducing fuel continuity and creating more defensible conditions (Peterson et al., 2005; Agee and Skinner, 2005).
Strategies to address these hazardous fuels include managed wildfire, prescribed fire, and ecological thinning. Managed wildfire involves the deliberate use of naturally ignited wildfires to achieve specific land management objectives under predetermined conditions. Unlike suppression efforts aimed at extinguishing all fires, managed wildfires are allowed to burn in areas where they can reduce fuel loads, promote ecological health, and decrease the risk of future severe wildfires (Kreider et al., 2024). In contrast, prescribed fire, including pile burning and broadcast burning, is the intentional ignition of a fire under specific environmental conditions to reduce excess vegetation and mitigate the risk of more severe wildfires (Figure 1). This method is used to manage ecosystems by mimicking natural fire regimes, thereby enhancing habitat diversity, promoting the growth of fire-adapted species, and reducing fuel loads (Block et al., 2016).
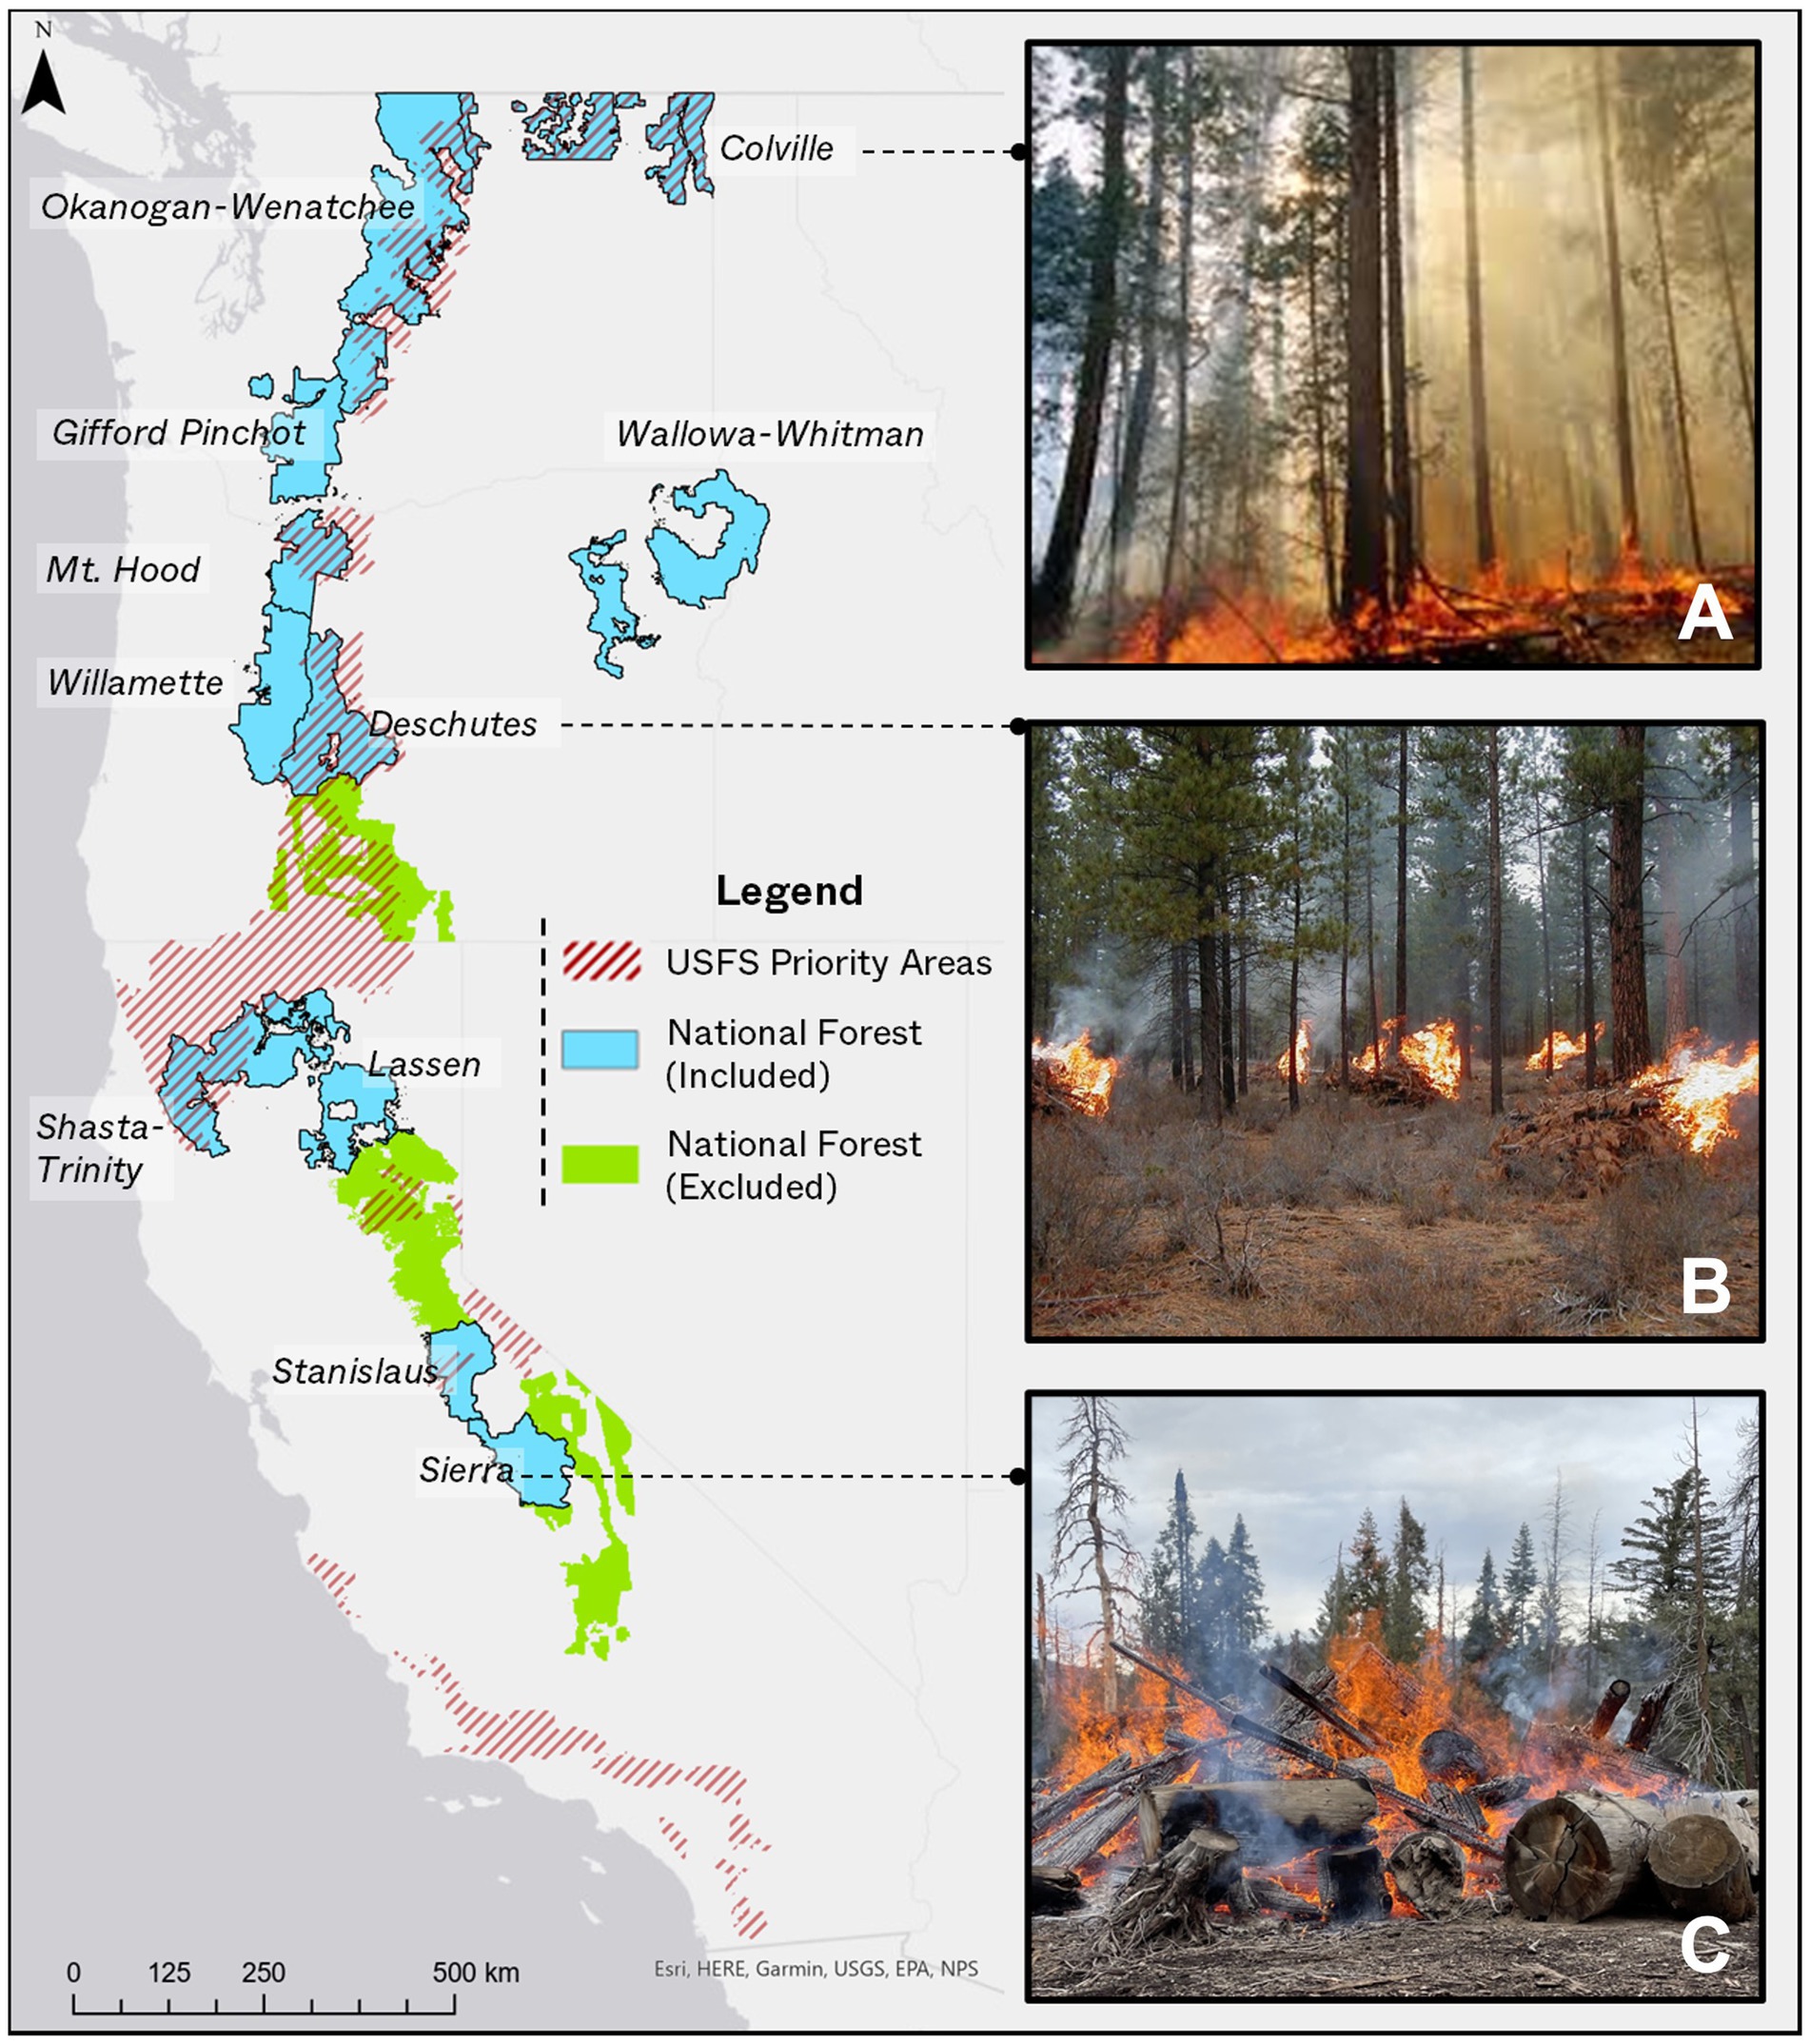
Figure 1. Map of National Forests in the study region. Forests included in the study are shown in blue while excluded forests which fit our study criteria are shown in green. The map also shows USFS priority areas for the Wildfire Crisis Implementation Strategy (in red). Photos included in the figure show different types of prescribed burning: (A) broadcast burning on the Colville National Forest (photo credit Colville National Forest), (B) hand pile burning on the Deschutes National Forest (photo credit Deschutes National Forest), and (C) machine pile burning at a landing on the Sierra National Forest (photo credit Sierra National Forest).
Given the high fuel loads, risk of escaped fire, and expansion of human populations into the wildland urban interface (WUI), ecological thinning often needs to occur prior to any managed or prescribed fire (Brodie et al., 2024). Ecological thinning—a forest management technique where specific trees, shrubs, and other vegetation are selectively removed—can be conducted by hand or by machine. Hand thinning is conducted by crews with chainsaws and is deployed near sensitive infrastructure, cultural sites, and ecosystems, or where access or operation of forestry machines is impossible due to terrain or limited road access. Residues generated by hand thinning are typically aggregated into small piles distributed across the landscape. In contrast, mechanical, or machine, thinning is generally applied in areas with relatively flat or gently sloping terrain where machinery can operate effectively without causing significant soil disturbance or damage to residual trees. During mechanical thinning, merchantable materials such as sawlogs or clean wood chips may be transported offsite to wood products markets, while residual materials without markets (e.g., “slash” materials including small or low-quality logs, limbs, branches, and needles) are typically aggregated into larger, centralized piles at landings or masticated into chips and scattered across the forest floor.
In order to achieve goals of wildfire risk mitigation, each of these strategies requires a disposal mechanism for the fuels slated for reduction. During managed wildfire and prescribed fire, fuels are disposed of into the atmosphere as smoke, which includes carbon dioxide (CO2), carbon monoxide (CO), methane (CH4), and non-methane hydrocarbons (NMHCs), in addition to water vapor and particulate matter (Liu et al., 2017). However, high fuel loads, fire complexity, and air quality restrictions limit the implementation of large-scale prescribed fire (Wright et al., 2010). Therefore, it is increasingly important to consider pathways for disposal or utilization of residues generated by hand and mechanical thinning activities. Disposal of residues from ecological thinning occurs via natural decay (i.e., masticate and scatter), prescribed fire (i.e., pile burning), or downstream utilization (e.g., bioenergy generation). Given the higher fire hazard associated with scattered, masticated residues, it is not the primary approach considered in high wildfire risk forests in the U.S. West. We therefore focus the remainder of our analysis on the prescribed burning of hand and machine piles and the alternative of residue utilization.
Prescribed burning of hand and machine piles, hereafter “pile burning,” is a multi-step, typically multi-year process. Whether done by hand or by machine, this process typically involves three discrete steps: cutting and yarding, which involves the felling and haulage of selected live or dead fuels and movement to where they will be piled; piling, which involves the stacking of green material by hand or with a shovel loader or excavator; and burning, which involves combustion of dried piles. Depending on the environment, piles must dry for at least one, but often several, seasons to enable efficient burning (Mott et al., 2021). The act of burning itself requires environmental risk controls, including but not limited to, low winds and pending precipitation. Once piles are ignited, they must be monitored until they are fully combusted or out cold.
Though pile burning is a common and important disposal mechanism for residues, to our knowledge there have been only five studies which evaluate implementation costs for piling and burning (Table 1). A recent meta-analysis by Campbell and Anderson (2019) examined 21 studies across western states for costs of fuel treatments, of which three included piling and burning costs. For the three studies that overlap with our study area (Arriagada et al., 2008; Hartsough et al., 2008; Jain et al., 2012), only one study (Jain et al., 2012) reported pile burning costs of $476 ac−1 ($1,175 ha−1). Belavenutti et al. (2022) provided costs for machine pile burning, but did not specify costs for piling. Additional modeling efforts by Loomis et al. (2019) to generate a “high” and “low” cost in California found that counties with significant WUI areas had a higher cost. Costs in California for machine cutting and yarding costs ranged from $281 to $582 ac−1 ($694 to $1,439 ha−1), and piling and burning costs ranged from $406 to $878 ac−1 ($1,004 to $2,169 ha−1).
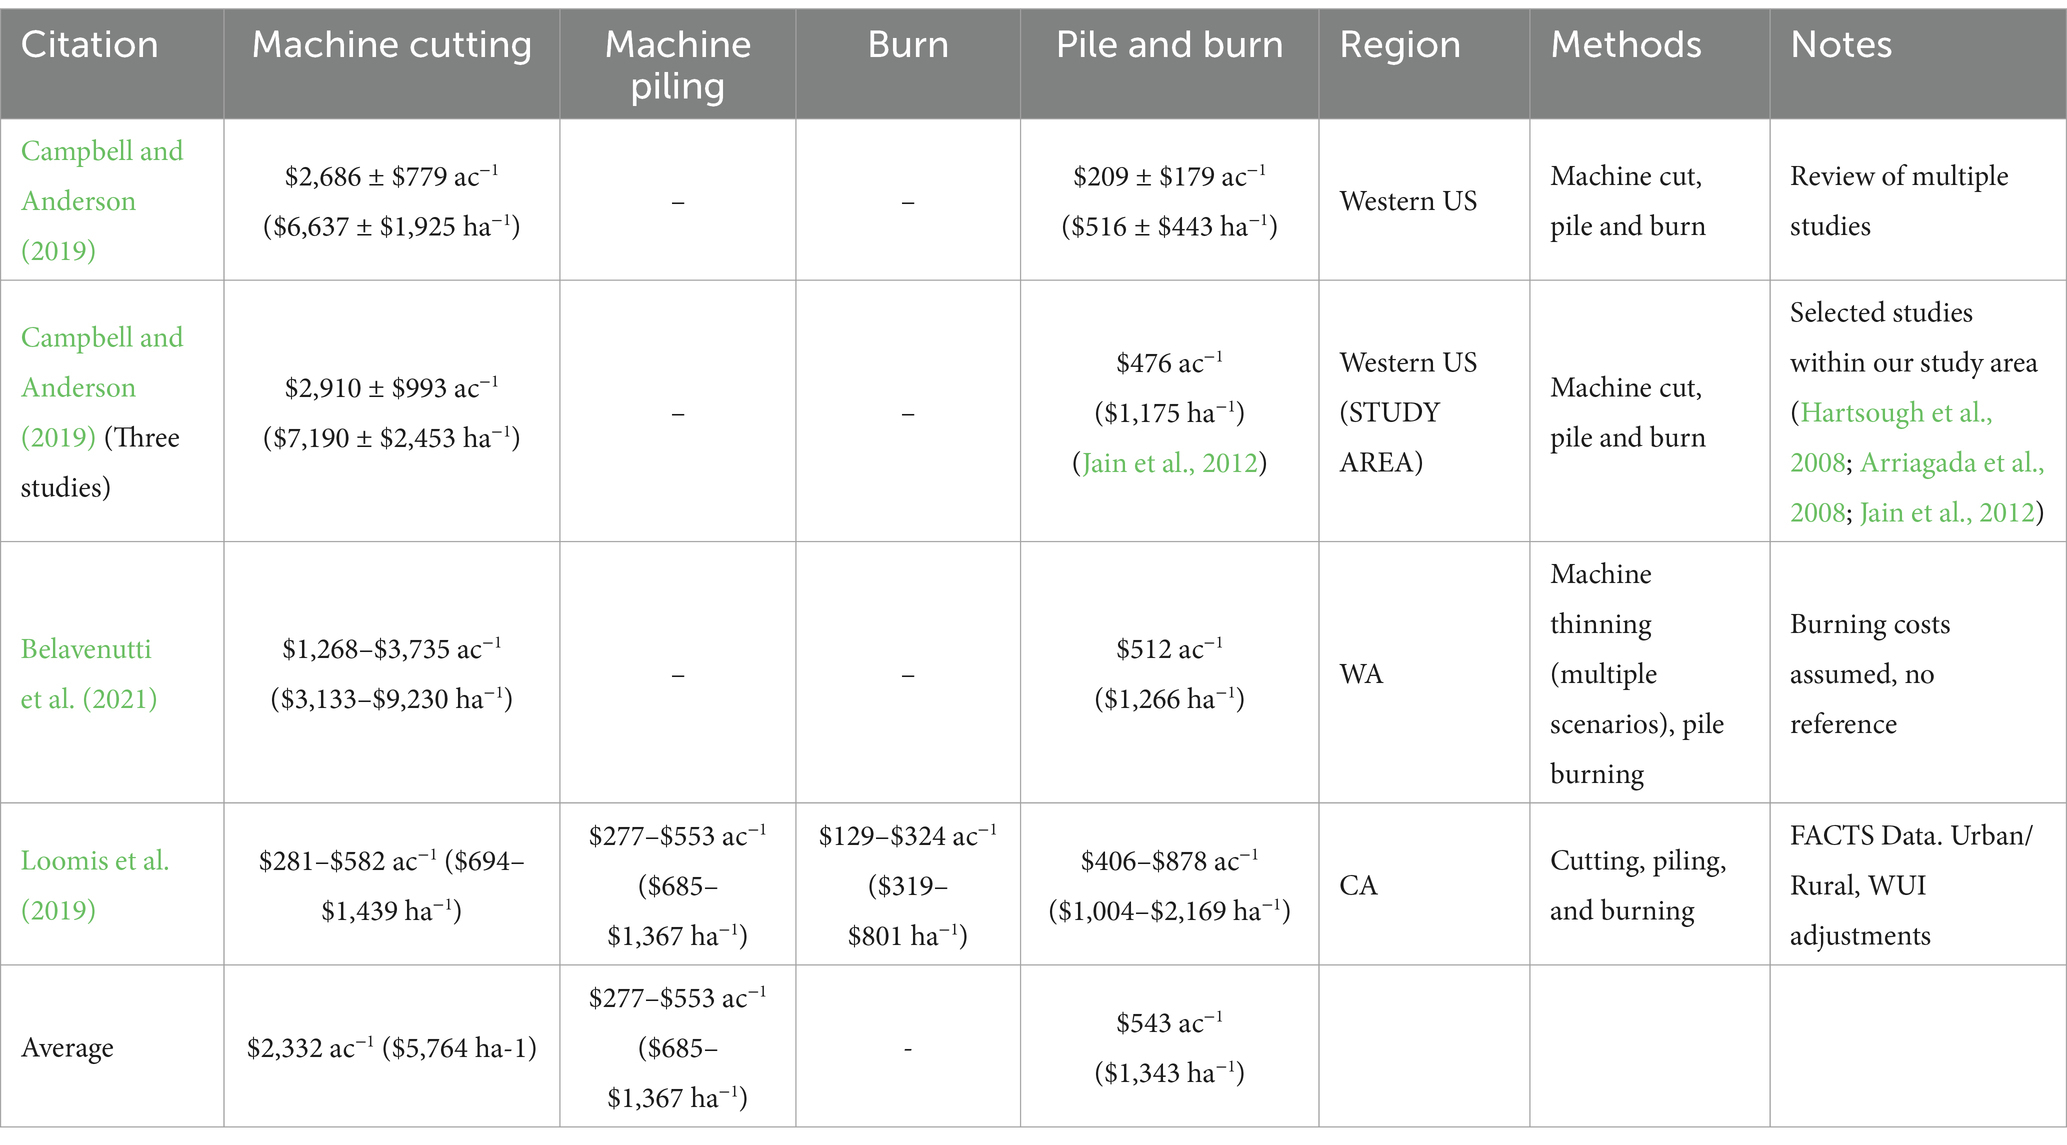
Table 1. Summarized costs for piling and burning as reported in relevant literature, in 2024 dollars.
Quantifying such costs is necessary to evaluate the relative costs of disposal by pile burning versus removal for disposal or utilization elsewhere. In response to this literature gap, we employed a three-step process to assess costs across landscapes within National Forests in California, Oregon, and Washington. First, we compile and review costs as reported to the USFS Activity Tracking System (FACTS) database from 2019 to 2023 for our study area (USDA Forest Service, 2024). Next, we interview USFS fire management professionals (FMPs) responsible for planning and implementing fuels reduction treatments across National Forests in our study area. During interviews, we ask participants to provide information on costs as well as practices, challenges, and constraints involved in planning and implementing treatments. Finally, we generate a series of geospatial variables representative of the geographic constraints reported in the interviews and analyze relationships between these constraint variables and reported costs.
Instead of a generalized “pile burning” cost, we separate costs by treatment type (hand or machine) and further categorized costs by project phase (cutting and yarding, piling, and burning). We compare the results from our FACTS analysis with the results from interview analysis and estimate long-term and day-of burn planning costs based on interview responses. We then quantify the greenhouse gas and criteria air pollutant emissions associated with historical pile burning activities on a per hectare and per annum basis and compare pile burning’s carbon cycle influence against alternative residue utilizations. Based on our results, we propose a novel framework for incentivizing residue removal and utilization, thereby reducing the need for pile burning in machine-thinned treatment areas.
2 Methods
2.1 Study area
Our study considered National Forests in California, Oregon, and Washington, falling within the ecological region “Northwestern Forested Mountains” (Level 1 EPA Ecological Regions). Within this region, we focus on National Forests with dry mixed conifer and ponderosa pine forest types found on the eastern slopes of the Sierra and Cascade mountains (Figure 1; Supplementary Table S1). When eligible National Forests spanned other ecological regions, we focused on districts with the drier forest type.
These forests have low mean annual precipitation (<1,000 mm) and historically low severity fire regimes but are variable based on topography and local climate (Stephens and Collins, 2004; Noss et al., 2006; Franklin and Dyrness, 1988). Past logging, land use, and fire suppression have led to dense forests and higher fire risk, resulting today in sustainable harvesting and fuels reduction work prioritizing reducing fuels for fire risk and creating merchantable products (Welch et al., 2016).
Districts in the study area have hazardous fuels programs designed to address fuels buildup while also managing for other objectives, like wildlife habitat, ecological restoration, and forest products. Dedicated permanent employees on the fuels teams plan, conduct, and administer hazardous fuels work in coordination with silvicultural teams.
2.2 Assessment of USDA Forest Service activity tracking system (FACTS)
The USFS has used the FACTS database to track per-acre costs, location, and other data for treatment projects annually since 2005 (Adams and Charnley, 2018). While it is a valuable source of data for agency and public use, FACTS is not a financial-tracking system, and there are data quality issues due to mismatches and inconsistencies. Reported costs may be blank or $0 for income-generating activities (like commercial thinning) or may be folded into earlier stages of the contract sequence. While contracts and contract history are a more reliable source of financial records, they are not shared with the public (USFS FACTS Coordinator, personal communication, October 2024).
We downloaded activity records from the FACTS database associated with hazardous fuels treatments, including cutting and yarding, piling, and burning across our study area during the period from 2019 to 2023. Activity records with blank cost data (n = 568), $0 (n = 2,051), or $0–$1 (n = 484) were excluded from the analysis. The three most frequently used fund codes for excluded records were: “harvest activity” (n = 1,811), “timber products” (n = 374), and “hazardous fuels reduction” (n = 328). Both “harvest activity” and “timber products” are income-generating activities and costs are usually not reported to FACTS. In the case of “hazardous fuels reduction,” costs may have been recorded at an earlier stage of the contracting sequence (FACTS Coordinator, personal communication, October 2024).
In total, we analyzed 9,423 records with cost data recorded. To better differentiate between hand and machine activities, we recategorized thinning and piling (Supplementary Table S2). Thinning activities, which included commercial thinning, precommercial thinning, and hazardous fuels thinning, were recategorized based on equipment type (Supplementary Table S3). Burning records did not specify hand or machine and were treated as one cost item.
For each activity record, we calculated total cost by multiplying the reported per-acre costs by the number of acres completed in each record. We then summed the total costs across each forest and activity to determine the cutting and yarding, piling, and burning costs for each forest. We then summed total acres completed across records for each state and finally calculated the average cost-per-acre for each district, forest, and state.
2.3 Interviews with active fire management professionals
2.3.1 IRB protocol and determination
The research protocol for the study was submitted to the Human Research Protection Program and the Institutional Review Boards at Yale University under IRB Protocol ID 2000035654. The Institutional Review Board approved the study and provided an exemption determination.
2.3.2 Interview and analysis methods
The study population consisted of federal employees responsible for planning and implementation of cutting, piling, and burning of thinned residues on National Forests in our study area (Fire Management Officers or specialists, abbreviated here as Fire Management Professionals, FMPs). FMPs are subject-matter experts on fuels management in Western U.S. National Forests. We used the U.S. Office of Personnel Management General Schedule (GS) classification for experience level screening. GS grades range from 1 (low) to 15 (high), with the agency determining a position’s grade based on difficulty, responsibility, and experience required. Without experience, candidates with: high school diplomas typically qualify for GS-2; undergraduate degrees typically qualify for GS-5; and Master’s degrees typically qualify for GS-9 (U.S. Office of Personnel Management, 2024a). For the purposes of our studies, we considered FMPs with classifications between GS-8 and GS-12, indicating relevant education and experience, responsibility, and familiarity with fire management and hazardous fuels reduction. Individuals who responded or who were interested were asked to fill out a pre-screening questionnaire and a consent form prior to the interview.
The participant outreach involved a combination of purposive and snowball sampling. We began by identifying 10–15 current FMPs from National Forests in our study area via strategic online searches. Potential participants were emailed, called, or a combination of both methods. When participants were unable to participate, we used snowball sampling whereby we asked for a referral to others who would be more knowledgeable or available to participate in our study. In total, we contacted 55 FMPs by email and phone across our study area over a period of 7 months (September 2023 to March 2024), ultimately interviewing 11 participants. The number of interviews conducted falls within the range for qualitative research saturation (Hennink and Kaiser, 2022).
Six participants worked at the district level and four worked at the supervisor’s office level. One participant was previously a USFS FMP, but currently is employed at another federal agency. Their responses were included in cost estimation but excluded from the geospatial analysis.
We provided participants a costing and personnel estimation spreadsheet and a list of questions prior to the interview (available in Supplementary material). Interviews lasted 1 h and were conducted, recorded, and transcribed using the teleconferencing service Zoom.
Responses to the costing and personnel estimation spreadsheet were applied as inputs to a cost model of pile burning activities. Participants reported cutting and yarding, piling, and burning costs on a per-acre basis. Participants also estimated personnel hours for long range and day-of planning activities. Planning costs were calculated using personnel hour estimates and the cost of government services based on the 2024 General Scale hourly rate (U.S. Office of Personnel Management, 2024b). As there are 10 step rates within each grade that represent a salary increase of 3%, we used the hourly rate for step five employees for our calculations (U.S. Office of Personnel Management, 2024b). This was divided by the total acreage for a planning area reported by interviewees, which was either a specific acreage for annual burning or the full acreage of the district. For day-of planning, participants provided an average acreage covered in a single day of burning. When participants did not report a pile burning area, we assumed 150 acres, the average acreage reported by other participants.
The costs of cutting and yarding, piling, and burning were gathered for each interviewee. We provided equal weight to costs reported by each interviewee and calculated an average per-acre cost for each state. We report averages by state to compare to FACTS results, and to ensure participant confidentiality.
Transcriptions supported manifest (explicitly stated) and latent (implicit) content analysis (Payne and Payne, 2004; Bengtsson, 2016). The study team reviewed interview transcripts to identify common practices, challenges, and constraints within the themes of cutting and yarding, piling, burning, planning, and alternatives to burning, and summarized interview results into a narrative format along those themes.
2.4 Geospatial analysis
Given the limitations associated with a relatively low sample size (n = 11) and to contextualize results and patterns beyond specific National Forests included in this study, we assessed the relative importance of three cost drivers identified in interviews (accessibility, proximity to humans, and stand density) with reported costs of cutting and yarding, piling, and burning both hand and machine piles. For this analysis, we identified geospatial predictor variables associated with each element, and assessed the correlation of costs against predictor variable measurements which we calculated over shapefiles representing participants’ geographic footprint (i.e., four National Forests, six specific districts).
To represent accessibility, we generated raster datasets for three predictor variables: maximum elevation, mean slope, and road density (in miles per acre). Maximum elevation was generated using the National Elevation Dataset (NED), a U.S. Geological Survey product with a resolution of 100 meters. Maximum elevation was calculated using Raster Analysis in ArcGIS Pro for each shapefile. A slope raster was generated using the NED raster and the Slope tool within the Spatial Analyst toolbox in ArcGIS Pro. Mean slope was again calculated using Raster Analysis in ArcGIS Pro for each shapefile. To quantify road density, we used a USFS product depicting all existing National Forest System Roads (NFSR) that are under the jurisdiction of the USFS. Road segment lengths contained within the shapefile were summed and divided by the total shapefile area.
To next represent each site’s proximity to humans, we calculated the distance to the nearest High Population Areas (HPAs). The HPA data is a U.S. Department of Transportation (DOT) product derived from the U.S. Census Bureau’s TIGER Urban Areas data layer. HPAs are defined as Urban Areas containing 50,000 or more people with a population density of at least 1,000 people per square mile. To quantify proximity, we used the Near tool within the Proximity toolset in ArcGIS Pro to calculate the shortest distance between any point on the shapefile and the nearest HPA.
Finally, to represent forest density, we used the USFS product Stand Density Index (SDI) derived from 2016 TreeMap data. SDI is a relative measure of stand density for live trees (≥1.0 inch d.b.h./d.r.c.), expressed as a percentage of the maximum stand density index. Mean SDI was calculated using Raster Analysis in ArcGIS Pro within each shapefile.
To assess if any of these geospatial predictor variables (i.e., mean slope, maximum elevation, road density, proximity to HPA, and mean SDI) were correlated with costs of cutting and yarding, piling, and burning for both hand and machine piles, we initially employed multiple linear regression to evaluate the influence of the set of five predictor variables on each dependent variable. We then conducted a stepwise selection process to refine the model, systematically excluding variables that did not contribute significantly to the model’s explanatory power until only statistically significant predictor variables remained (all p < 0.05). This approach minimized multicollinearity and enhanced the interpretability of the results. All analyses were conducted in R version 4.4.1.
2.5 Greenhouse gas and criteria air pollutant emissions
To quantify the broader atmospheric and social impacts of pile burning in our Study Area, we quantified the greenhouse gas (CO2, CH4, and NMHC) and criteria air pollutant (CO, PM, PM10, and PM2.5) emissions resulting from these practices. To do so, we used the Pile Consumption Algorithm within the CONSUME model version 3.0, a fuel consumption and emissions software developed by the USFS (Prichard et al., 2006). Within the Piled Fuels Module, based on Hardy (1996), we used data from the primary literature, the FACTS database, and interviews to estimate: (1) gross volume of single piles, (2) net volume of woody biomass per pile, (3) weighted average density of wood, (4) consumable oven dry mass of wood per pile and per hectare, and (5) mass consumed in each of three combustion phases per pile and per hectare (Prichard et al., 2006). All equations, data sources, and assumptions are reported in Supplementary Table S4.
We note that the combustion of biomass proceeds through three distinct phases: flaming, smoldering, and residual combustion. Each phase differs in terms of temperature, combustion efficiency, and emissions produced. The initial phase is flaming which is characterized by high temperatures and efficient combustion. The lower temperature smoldering phase follows. It is generally less efficient due to limited oxygen supply and incomplete oxidation. The final phase, residual combustion, is characterized by very low temperatures, oxygen availability, and heat output. Previous work demonstrated a 65% error associated with consideration of total fuel consumption rather than breaking the consumption into the aforementioned phases (Sandberg, 1983). We therefore follow the assumptions and guidelines set forth in the CONSUME model to reduce this error.
Fuel consumption in each of the combustion phases (calculated in the Pile Consumption Algorithm) is then multiplied by a combustion phase-specific emission factor to generate an estimate of total emissions on a per hectare basis. We use the CONSUME emission factors reported for Mixed Conifer fuel types (Ward et al., 1989; Prichard and Kennedy, 2012; Supplementary Table S4) for GHG emissions, and the emission factors for particulate matter (PM, PM10, and PM2.5) derived from Hardy (1996). For conservativeness, we assume all hand and machine piles are characterized as clean.
Finally, to derive an estimate of GHG and criteria air pollutant emissions across the 11 National Forests included in the study, we multiplied the per hectare emission estimates by the mean annual treatment area (converted from acres to hectares) reported in the FACTS database between 2019 and 2023. Total annual emissions for each National Forest were then summed for an estimate of the regional emissions associated with this practice.
2.6 CDR efficiency comparisons
As a final step, to compare the relative climate impacts of pile burning as compared with other proposed end uses, we use a metric called carbon dioxide removal (CDR) efficiency (ηCDR, Chiquier et al., 2022). The CDR efficiency (reported in CO2 equivalents) is calculated from two primary components: (1) the carbon content of the biomass feedstock (CDRgross), which equals total CO2 captured during photosynthesis, and (2) the total emissions from the biomass use pathway (Emissions) which includes biogenic and process emissions. These two terms are used to calculate net CDR (CDRnet). We also include emissions displaced via energy production (Displacement), though we note avoided emissions effects depend on the emissions intensity of localized energy resources (e.g., the emissions intensity of solar energy will be different than that of fossil-based generation).
We determine the CDR efficiency, expressed in metric tons of CO₂e (MTCO2e) as (modified from Chiquier et al., 2022):
We note that in some cases, biogenic emissions are in the form of a GHG with a higher GWP (in which case the emissions variable may be higher than it would be if biogenic C were completely oxidized to CO2).
We consolidate multiple proposed end uses of relevance in the western US based on peer reviewed literature (Supplementary Table S5). Alternative pathways included: (1) BECCS, (2) biomass burial, (3) biochar production and agricultural application, and (4) decay.
To estimate the ηCDR of pile burning, we collated results from the CONSUME model for total consumable biomass (BDT yr−1) as well as total emissions of CO2, CO, CH4, and NMHCs. CDRgross was calculated as the consumable biomass (BDMT yr−1) multiplied by 0.50 (carbon content of wood) and by 3.67 (CO2:C conversion). Emissions was calculated by multiplying total emissions of each GHG by their respective GWP100 (CO = 1.5; CH4 = 28; NMHC = 8). We excluded emissions for pile cutting, yarding, and building. Per CONSUME model recommendations, we assumed 90% of biomass is consumed. We assumed no displacement effects for pile burning.
3 Results
3.1 USDA Forest Service activity tracking system (FACTS) cost estimates
Average all-in costs per acre and per hectare for hand and machine methods were calculated and summarized from the FACTS database for 2019–2023. We calculated the normalized total cost for each forest and reported results aggregated to the state level for confidentiality (see Table 2). Across forests, the average costs for hand piles were $257 ± $235 ac−1 ($635 ± $581 ha−1) for cutting and yarding and $450 ± $340 ac−1 ($1,112 ± $840 ha−1) for piling. Average costs for machine piles were $363 ± $369 ac−1 ($897 ± $ 912 ha−1) for cutting and yarding and $311 ± $320 ac−1 ($768 ± 791−1) for piling. Pile burning, which included both hand and machine piles, had an average reported cost of $98 ± $134 ac−1 ($242 ± $331 ha−1).
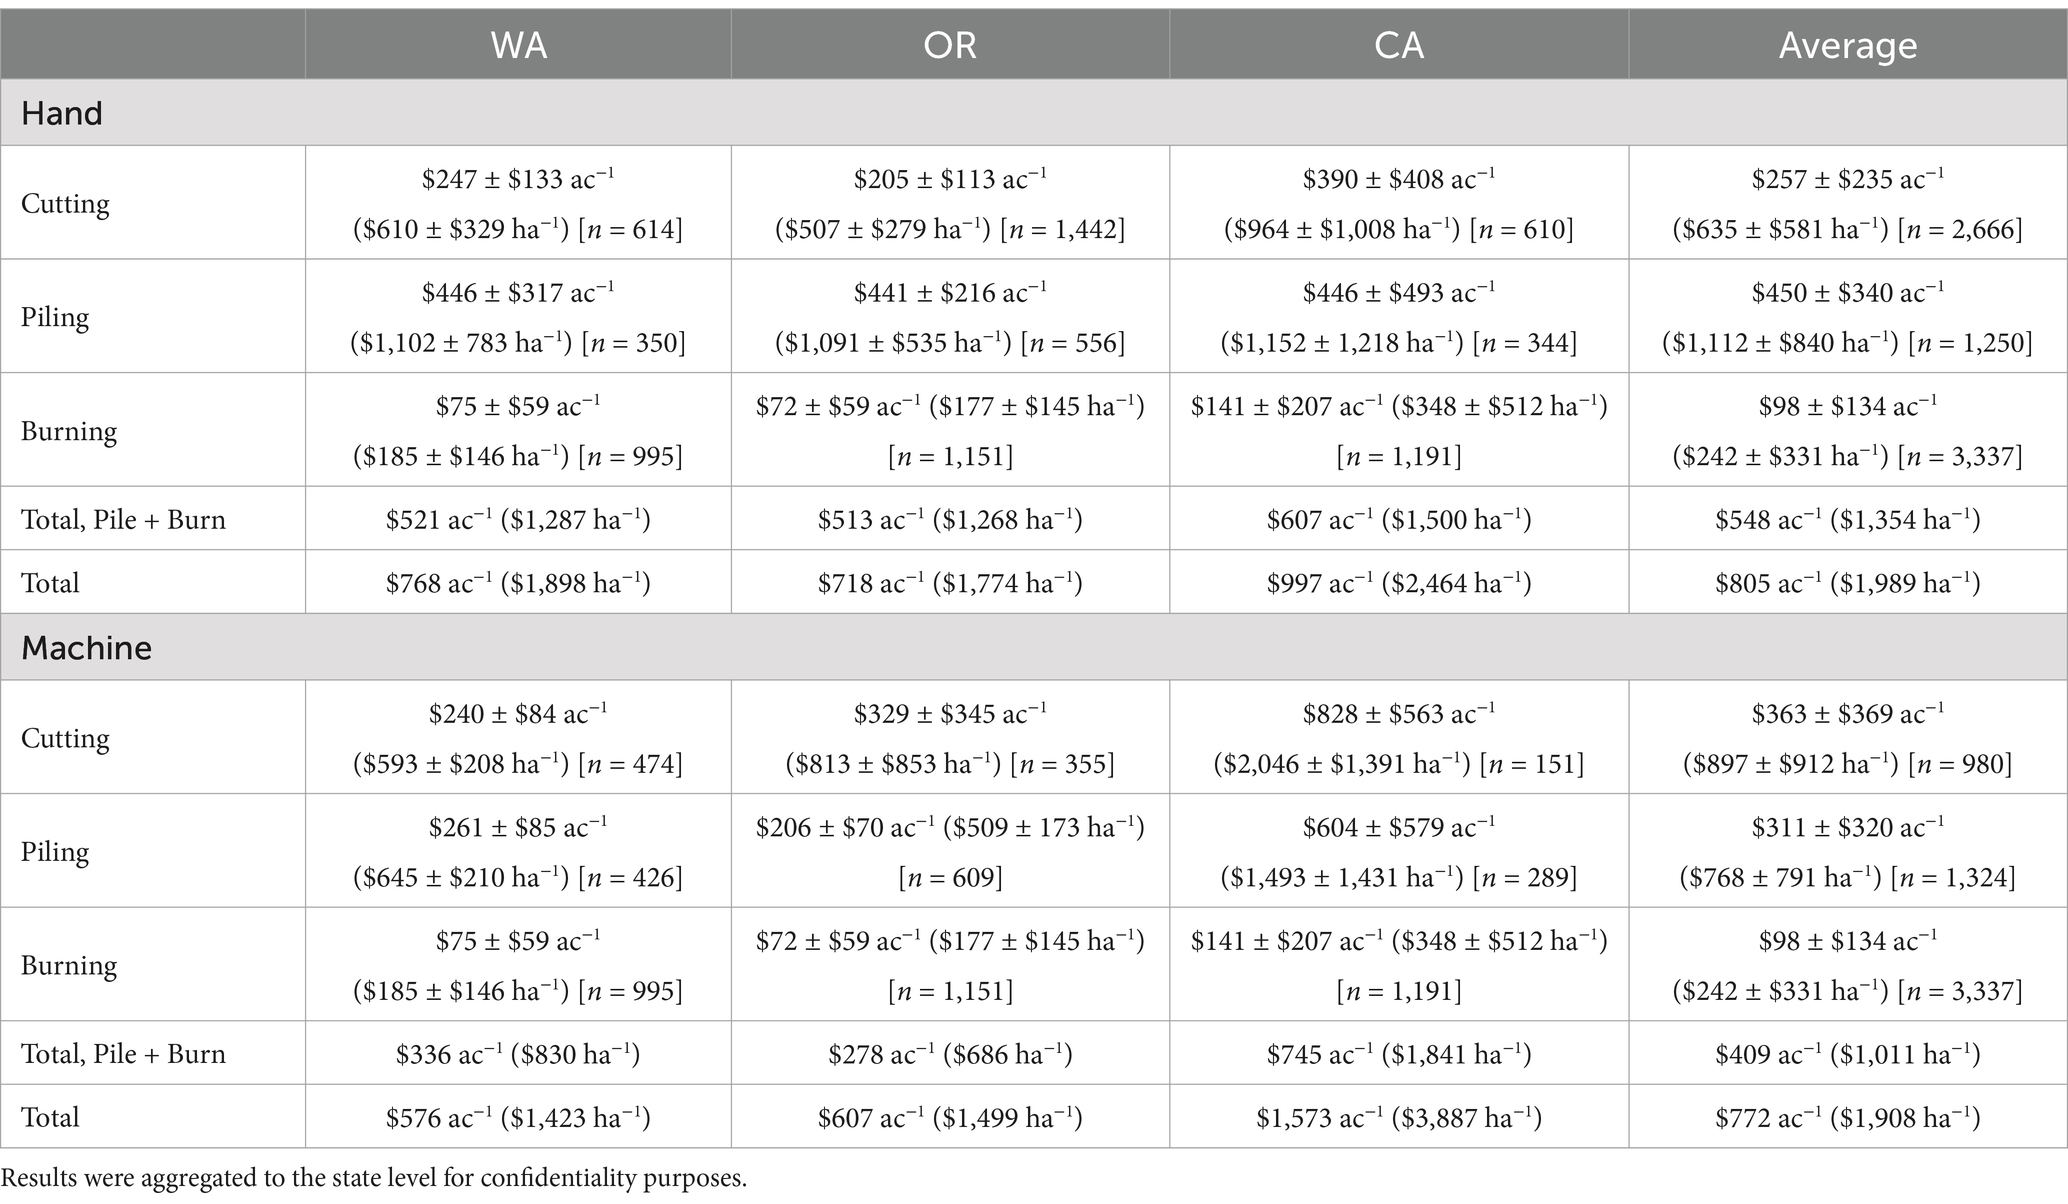
Table 2. Reported average costs for cutting, piling, and burning for hand and machine methods from the FACTS hazardous fuels reduction activity database for forests in our study area from 2019 to 2023.
In California, average cutting and yarding, piling, and burning costs were $997 ac−1 ($2,464 ha−1) for hand piles and $1,573 ac−1 ($3,887 ha−1) for machine piles. In Oregon, average cutting and yarding, piling, and burning costs were $718 ac−1 ($1,774 ha−1) for hand piles and $607 ac−1 ($1,499 ha−1) for machine piles. In Washington, average cutting and yarding, piling, and burning costs were $768 ac−1 ($1,898 ha−1) for hand piles and $576 ac−1 ($1,423 ha−1) for machine piles.
3.2 Interviews with active fire management professionals
3.2.1 Cost estimates
We summarized costs of cutting and yarding, piling, and burning for hand and machine treatments by state (Table 3). Some participants did not report a cost for cutting often because these costs were embedded in contractor agreements. Overall, total costs were higher for hand treatments than for machine treatments.
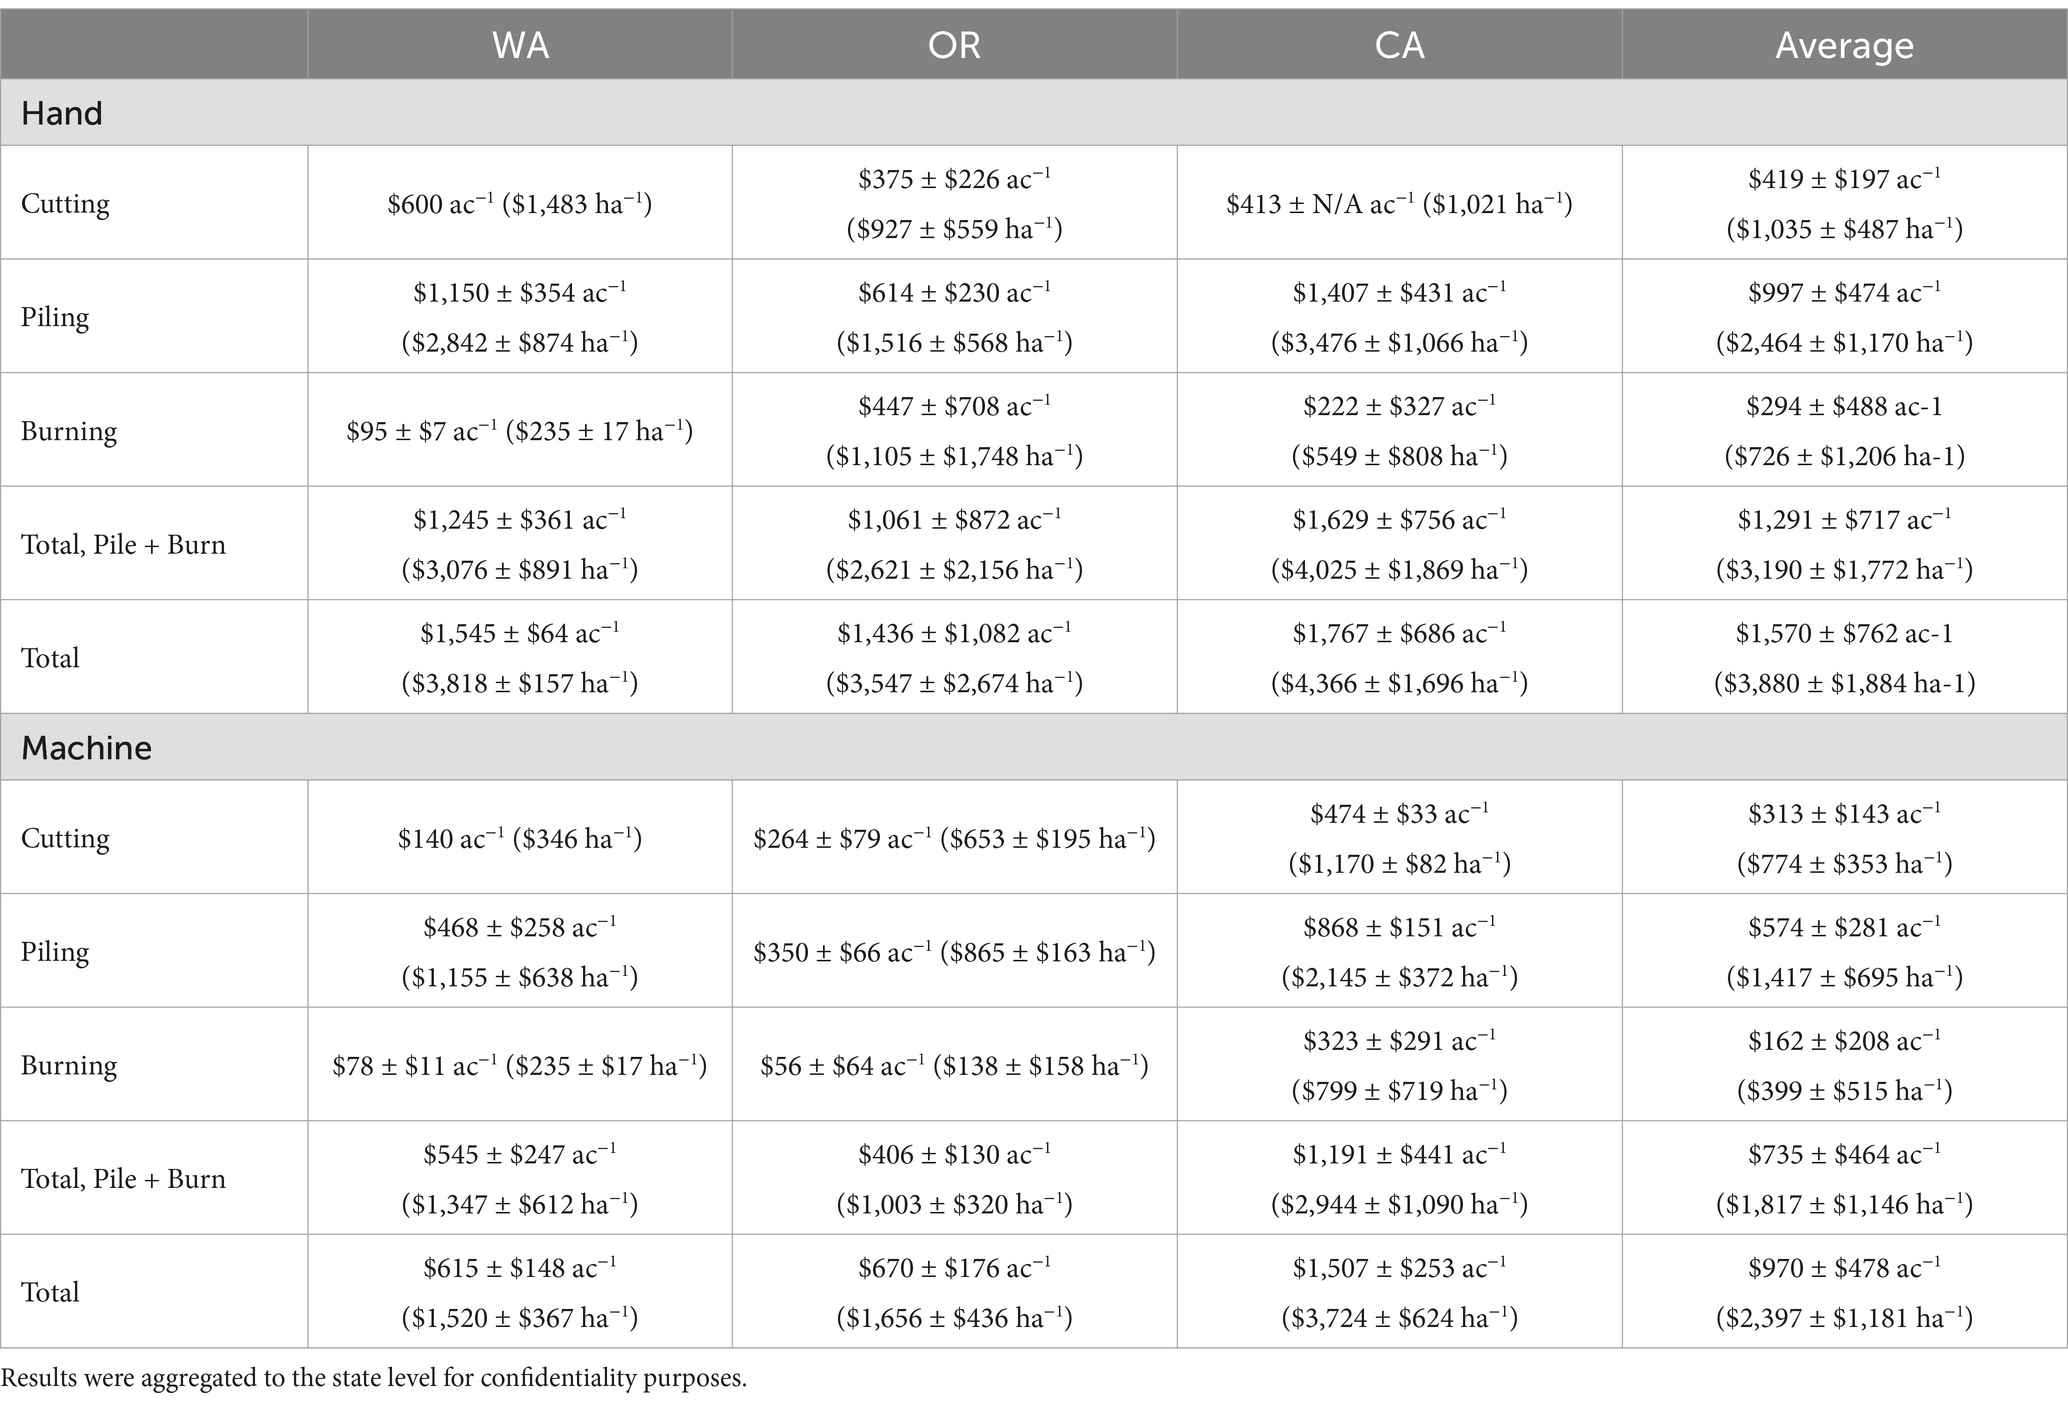
Table 3. Reported costs for hand and machine cutting, piling, and burning by state based on interviews with FMPs.
Estimates of personnel required for long-term planning and day-of implementation were variable (Supplementary Table S6). Participants reported that crew sizes vary significantly during pile burn operations and day-of implementation based on burn complexity, acreage, weather and environmental conditions. Annual long-term plans were reported to cover a range of areas, from 450 acres (182 hectares) to entire districts of up to 795,897 acres (322,058 hectares). Long-term planning costs were $1.45 ± $2.49 ac−1 ($3.59 ± $6.16 ha−1) (n = 11). Day-of burn planning covered 70 to 250 acre (28 to 101 hectare) burn units. Day-of costs were $15.37 ± $7.87 ac−1 ($37.99 ± $19.44 ha−1) (n = 11). These costs include personnel time for burn planning and implementation oversight, not for implementation itself.
3.2.2 Interview summaries
Study participants applied both machine and hand treatments in a variety of contexts, and discussed common practices, challenges, and constraints. A summary of response themes is included in Supplementary material.
3.2.2.1 Cutting and yarding
Cutting for timber harvest and hazardous fuels is done by hand crews with chainsaws, machines such as harvesters or feller bunchers, or some combination of this equipment. In machine thinning, participants noted that materials need to be yarded to a centralized landing after cutting for processing and piling, typically using skidders or forwarders.
Participants noted some clear constraints on where cutting by hand occurred, and where machine treatments were used instead. Participants noted that access and terrain were absolute, physical constraints on use of machines, with most machines unable to operate on anything >30% grade. One participant from California described that approximately half of the Sierra is unable to be mechanically treated, because the slopes are too steep. On that half of the forestland, “The only way to treat that is… through either broadcast burning [by hand] or wildfire… the more likely scenario in a lot of those cases is wildfire.”
Participants reported additional ecological and social constraints to thinning with machines. One participant noted, “If you have a timber sale or service contract, it’ll be machine. If you have got a sensitive area, let us say near a meadow, a riparian [zone], maybe even an archeological site, then that could dictate a hand treatment, just so you do not have the impact of the machines.” Other participants noted that hand treatments were often preferred in areas in the wildland-urban interface or near communities.
3.2.2.2 Piling
Pile construction technique varies by treatment type. Participants (45%) highlighted that pile construction quality is an important factor for efficient disposal.
For hand treatments, materials are dragged and lifted by hand into smaller, dispersed piles. Participants reported that hand piles are typically 4–6 feet in diameter and 4–6 feet high. In wet environments and at high elevations with snow, participants described covering piles with wax paper or Visqueen plastic to promote drying even during wet periods.
For machine piles, shovel loaders or excavators pile material, at large, open landings. Participants reported in-woods piles are typically 10–20 feet in diameter and 10–15 feet high, while landing piles are 8–30 feet in diameter and 30–50 feet high. Due to this size difference, the number of machine piles per acre is often lower than hand piles. A single large landing pile aggregates material from multiple acres.
Participants noted that in timber harvest contracts, costs of pile building are typically folded into the purchaser’s bid amount as part of their contract for post-harvest clean up. In other contract types (stewardship or integrated resource contracts), the USFS may fund a steward to hire a subcontractor, or directly pay a contractor, to conduct cutting and piling for restoration purposes.
Participants explained construction quality was directly related to ease of burning. One participant described the objective of a well-built pile was to be able to burn it regardless of weather conditions, “…when we have contractors come out, I tell them that I want well-built piles – condensed… as big as you can possibly make them. And then I want them covered well… [because we have] a bunch of constraints when it comes to putting fire on the ground… we lose our burn windows relatively quick… [because it gets] too wet or too dry. So we want these piles built to where… it could have rained two inches yesterday but we are still going to go out and burn them…” Another participant described smaller piles (e.g., four foot diameter by four foot tall), are prone to getting crushed by heavy snowpack, but are often required by prescription, “I think we’d like to go with the bigger, especially up in our higher elevations, like the six by six or whatever, because then the snowpack comes down, [and] just breaks them down anyway… a lot of times we have to build them four by four because in that specific project under the NEPA… [however] it’s pain in the butt if you do not get to them for a year or two… the snow will crush them, they kind of pancake down. So you are really struggling to get some to burn even when putting paper or plastic on them.” The same participant noted that NEPA may require smaller piles to reduce flame height during pile burning as to protect nearby trees from crown damage.
3.2.2.3 Burning
Hand and machine piles are burned for disposal in a similar manner, though they face different personnel requirements and constraints. Participants described that due to liability associated with escaped fire on federal lands, USFS crews most often burn piles, though in some cases may provide oversight to contractor or cooperator crews. Pile burning is considered a low complexity prescribed burn and requires a lower minimum qualification of prescribed fire burn boss for implementation than for broadcast burning (National Wildfire Coordinating Group, 2014).
Often, only one person with a drip torch is required to ignite a well-built, dry pile regardless of its size. Drip torches generally use a mixture of 50% gasoline and 50% diesel as fuel. However, wet piles, overly dense piles, poorly built piles, or previously burned piles may require additional material for burning, including alumagel, a type of flammable gel used to enhance ignition. One participant noted that well-built, condensed piles are much easier to ignite than poorly built piles, as they are “…airy where you can sometimes even see through the pile… trying to light that is difficult… [however, once you] condense the pile, we call it dicing, cut it down, make a big giant pile really compact and condensed and that pile goes from really hard to light, to really easy to light…” The participant added that poorly built piles require more ignition substrate, “…[airy piles are] bad for the environment too… you are going to be using alumagel and a bunch more drip mix in an effort to get that going.” Another participant described the challenge of burning post-fire salvage piles with lots of charred wood… “in some of the salvage piles from these larger fires, it’s damn near impossible to burn them, especially with traditional drip torch mix. We’re having to spend [hundreds of dollars] on 25-pound bags of alumagel to even attempt to get them to burn….”
Generally, participants described the monitoring of hand pile burning as easier and simpler than the monitoring of machine pile burning, due to their smaller size, relatively quick and nearly complete consumption of fuels. If conditions permit, hand piles can be lit across multiple acres simultaneously and monitored by a few individuals. By contrast, larger machine piles require more monitoring and mop-up. In some cases, machinery or hand crews need to shovel material back into a pile to prevent “donuts” of partially combusted material from forming. Participants also noted that machine piles can combust downwards into organic material in soils. One participant stated that buried logs near the surface were combusted by a pile burn, “I’ve had landings burn for 3 months and go 15 plus feet deep because they are built on top of a road bed, on top of logs, on top of logs, and just work their way down through the soil.” Another participant noted that machine pile burns required verification that the pile burn was completely suppressed, “…when all of the snow melts, we’ll go out with temperature probes and walk around and actually probe the ground and make sure that there is not any residual heat in the dirt below the pile… if they do have a lot of heat, we’ll go out there with heavy equipment and water tenders and stir them up with like an excavator or a dozer and a water tender.”
Participants outlined that weather, seasonality, and workforce are the most important factors in implementing pile burns. Pile burning requires specific weather conditions to ensure full consumption of fuels and to reduce the risk of escape. When there is a good “burn window” (an optimal combination of temperature, humidity, and wind), districts often call upon as many qualified people as possible to cover as many acres as possible. With the right window and a large workforce, hundreds of acres of piles may be burned in a single day.
Regarding weather’s impacts on pile burns, one participant stated, “…there’s so many variables. It depends, you know, if it’s rained… [or] has sun been on it for a few days? You know, do you have a breeze? It’s not too much, but you know, just enough to kind of just keep that fire going… Same with smoke. If you have an inversion or let us say it’s just cold and foggy and the smoke’s not lifting, it just does not want to burn compared to if it’s a nice clear day and, you know, you are getting good vertical movement, everything just wants to burn.”
Seasonality also plays a role, as most burning occurs in the late fall and winter after the wildfire season. Prioritization often follows an elevation gradient from high to low, with high elevation units burned earlier in fall and lower elevation units burned later in the fall and into the winter. Winter burning may require snowmobile access and excavating piles with snow shovels. One participant noted that a consistent stretch of clear weather is important for using personnel effectively during wintertime, due to the extra time needed for mobilization, “During the winter… it’s not really effective unless we know that we have got a window that’s going to be open for 8–10 days… because if not, we are gonna have people just kind of away from home, spinning their wheels.” Another participant noted that better forecasting tools could help to reduce this inefficiency, by limiting mobilization during suboptimal burn windows.
A third factor influencing pile burning was workforce availability, which largely depends on the activity of the fire season. Fuels personnel have certifications to support wildfire incidents, so they often fight wildfire during the main wildfire season in the summer and fall. Wildfire incidents pay hazard time and overtime pay while the USFS does not generally pay overtime hours for pile burns (as opposed to wildfire incidents). Optimal conditions for pile burning overlaps with the “off-season” for permanent seasonal and seasonal USFS personnel who only work 13 to 18 pay periods each year. As wildfire seasons get longer, and USFS personnel are working incidents later into the fall, the amount of available time for pile burning shrinks.
In regard to the pacing of pile burning by the workforce, one participant shared, “…the big factors are [the length of] fire season, the location of fires, and then really the fatigue in the workforce.” This was a common theme among participants – the longer the fire season, the less availability of personnel during burn windows. Another participant noted that long wildfire seasons are a cause of significant employee fatigue, “We have a lot of people that are burning the candle on both ends of fire. We’re just really rapidly burning out our workforce. And then when they are burnt out, they just go to another agency and we lose those employees and all of that invested training and all the stuff that we have put into those folks… [we are] trying to find a balance with that.”
Wildlife and air quality concerns were also noted as reducing burn windows. Pile burns may be limited for one to several months during wildlife nesting and breeding seasons, typically in the spring. Some participants noted that depending on regional air quality and regulation, pile burning could be curtailed due to air quality concerns near communities or with sensitive downwind receptors.
A common theme among participants was the quick pace of building piles was consistently mismatched with the slower pace of burning piles. One participant summarized, “… now we are actually trying to get at scale and we are a bit over our ski tips… there’s places [where there are]… literally thousands of [hand] piles out there… And then they would take them 5 years, 10 years to get them all burned… it’s really, really easy and common to put more piles on the landscape than you can actually go on and burn.”
3.2.2.4 Planning
Participants outlined two major planning periods: the long-term burn planning for landscapes and day-of planning for individual units.
For long-term planning, participants outlined two core elements of burn planning, a National Environmental Policy Act (NEPA) assessment and an annual burn plan. NEPA is typically a multiyear document for broader restoration projects (possibly including mechanical and hand treatment prescriptions, pile burning, and broadcast burning), and requires coordination with an interdisciplinary team. The NEPA process integrates resource and impact assessments with consultation from multiple specialists including foresters, wildlife biologists, hydrologists, archeologists, etc. After the NEPA process is completed for an area and burning is authorized, burn planning is covered in a district-wide prescribed fire burn plan or in a separate pile burn plan for individual units, which are updated annually. NEPA specialists may be consulted during the burn plan writing when there are areas of concerns for protected species, sensitive areas, archeological sites, etc.
Day-of-burn planning consisted of a deployment meeting with local personnel and resources, followed by a meeting each morning during a burn. District agency administrators are also required to conduct daily check-in meetings to authorize ignitions for a 24-h period based on conditions, contingency resources, and burn plans. These reviews by forest supervisors, district rangers, and fire management officers are now required daily when burning, in response to escaped prescribed burns that became wildfires in 2022. The meeting to obtain “2A Authorization” ranges from 30 min to 1-h and serves as a final “go” or “no-go” for burning operations. Topics to be covered include changing conditions, compliance requirements, burn plan objectives, media release processes, and administrator expectations (USDA Forest Service, 2022b).
More broadly, participants described that fire and fuels reduction are intimately tied and reactive to address emergency situations. One participant noted that there’s no “just-fuels-management” role, but rather a fuels plus fire role, “we do not have people that are just like, hey, your job is to just do fuels, everybody is doing fire too. And, unfortunately in the summertime there’s always fires… a lot of our fuels work slows down a little bit once we start getting fires.” Resources are allocated depending on the needs of the season and the needs of the moment, and even planning staff get pulled into fire work, as the participant continued, “…say there is somebody that’s like, ‘Hey, I’m a NEPA planner.’ And all of a sudden there’s a fire on the district… that NEPA planner is probably going to be doing the wildfire decision system. She’s going to have collateral duties…. to support the team… [regular duties] have to wait because we have got an emergency going on.”
3.2.2.5 Alternatives to burning
Participants were familiar with alternatives to pile burning that were currently used by their forest or district or that had been used in the past, including hauling chips for bioenergy, and producing biochar using mobile pyrolysis units. Several participants indicated that while pile removal is an attractive idea, they had not yet seen technologies which could profitably remove residues at a scale consistent with the disposal needs on their forests. One participant summarized the potential of pile removal to reduce workforce deployment on pile disposal, saying, “…ideally it would free up fire and fuels crews to do underburning, ecological restoration, you know, higher minded goals.”
Mastication was also mentioned as an alternative to pile building, but participants had mixed feedback on the resulting treatment effect. One participant articulated mastication is rapid and easy-to-verify treatment, but difficult to manage during broadcast burning, “…[with mastication] you are rearranging the fuel into a 1 and 10-h fuel load, which is extremely available… a lot of people will burn that mastication way too hot, then there’ll be a lot of subsequent mortality to the overstory… [however] it’s easy for a contractor to implement… And then it’s easy for a contract inspector to go out and see, did they meet the specs? Cause either it’s been masticated or not. It’s very binary….”
The same participant noted that piling and burning followed by underburning, rather than mastication followed by burning, is the preferred treatment method, but mastication was achieving landscape-scale forest structure improvements, “…the tried and true method for restoring stands back to characteristic densities and structures is to pile it, burn the piles once or twice, and then follow that up with a broadcast burn. I’ve seen it over and over again in my career where that can be a little more work intensive, but the end product is just so much better… And now there’s so much money and we are burning this mastication and we are doing it at such a scale that we are still… getting at the macro scale, the heterogeneity that you are looking for.”
3.3 Geospatial analysis results
A majority of the geospatial variables did not have a significant effect on reported costs, especially those in the categories of proximity to humans and stand density. However, geospatial variables in the category of accessibility did significantly influence reported costs and may be useful indicators for estimating costs in other locations.
Linear regression revealed significant correlations between predictor variables: (1) road density (Figures 2A–C) and (2) maximum district elevation (Figures 2D–F) and response variables. Costs of hand cutting and yarding as well as hand pile burning were not correlated with any geospatial variables (all p > 0.05). Road density was, however, negatively correlated with costs of hand piling (F1,8 = 11.8; p < 0.009; Adj R2 = 0.55; Figure 2B), indicating a potential cost dependency on proximity to infrastructure, as identified by a majority of the interview participants.
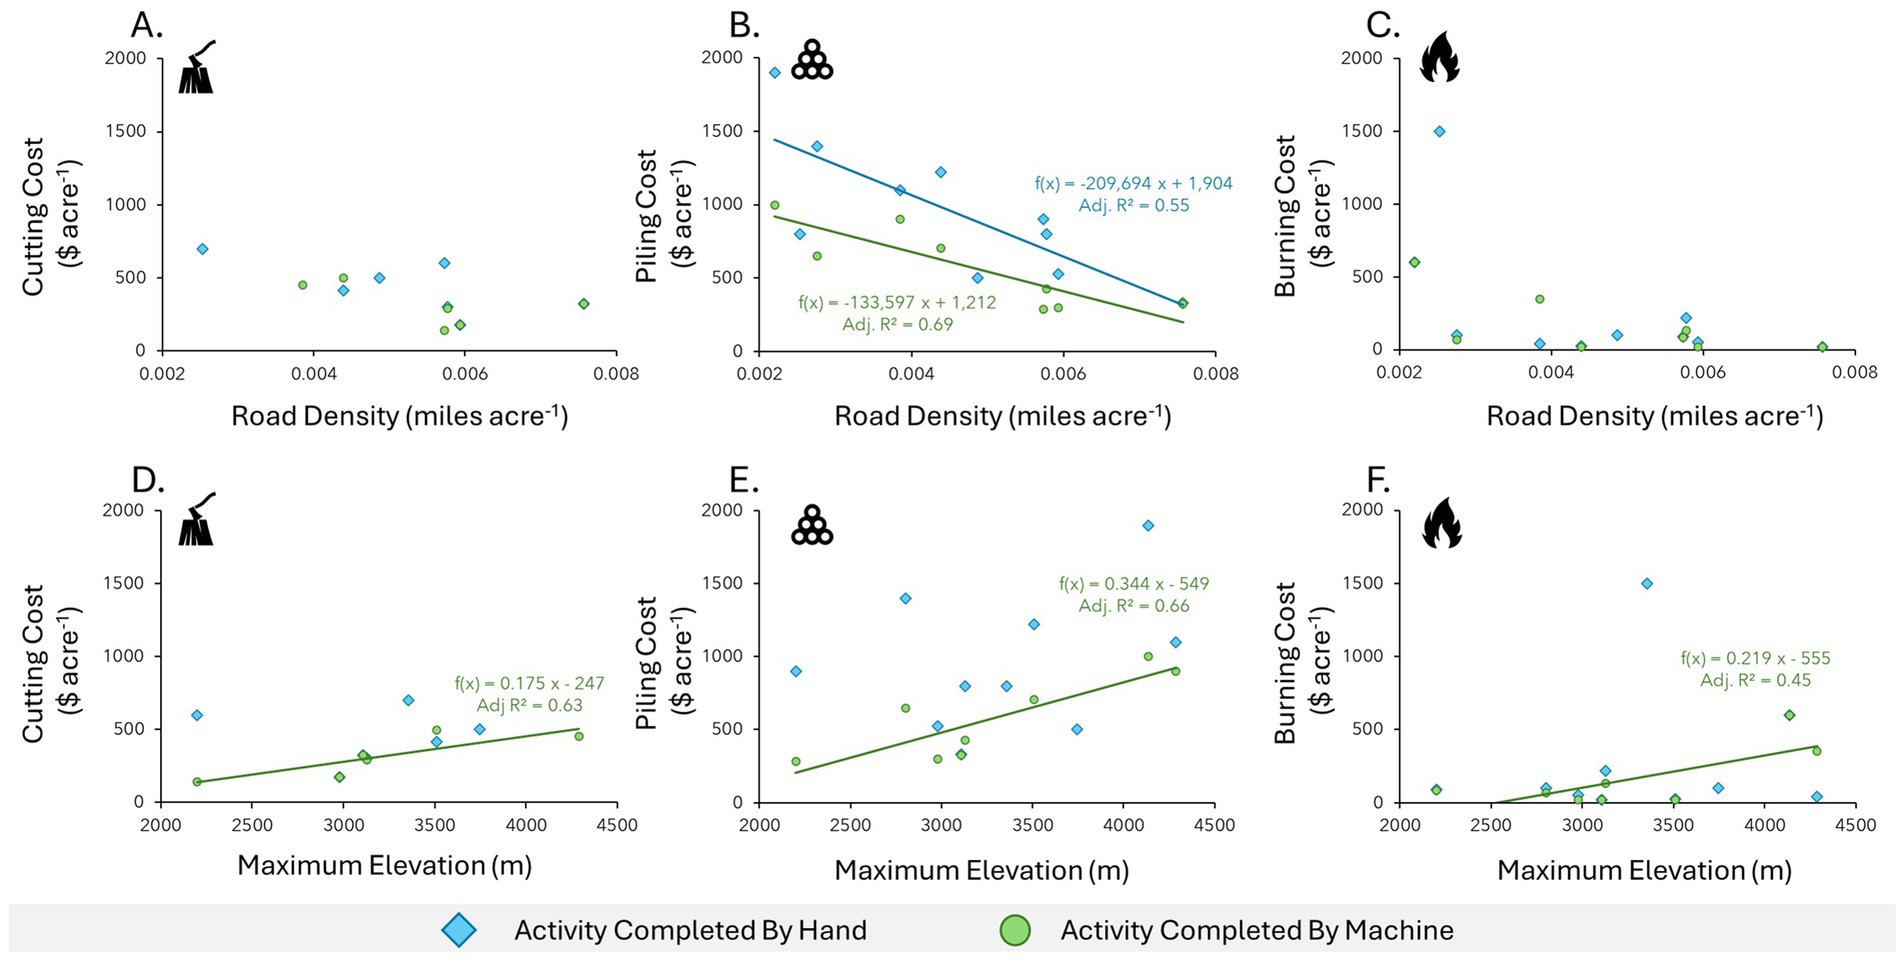
Figure 2. Linear regression plots showing geospatial correlation of costs per acre for activities completed by hand (blue) and activities completed by machine (green). Plots (A–C) show correlation between per-acre costs and proximity to roads. Plots (D–F) show correlation between per-acre costs and maximum district elevation.
Costs of machine activities were more strongly correlated with geospatial variables than activities conducted by hand. Costs of both cutting and yarding and burning machine piles were positively correlated with maximum district elevation (Cutting and Yarding: F1,4 = 3.07, p = 0.04, Adj. R2 = 0.63; Burning: F1,6 = 6.71, p = 0.04, Adj. R2 = 0.45). A positive correlation between elevation and cost may be due to accessibility and terrain constraints. Finally, costs of piling machine piles was negatively correlated with road density and positively correlated with maximum site elevation (Piling: F2,5 = 81.7, p < 0.001; Adj R2 = 0.96)—two key indicators of accessibility in this case. Together, these two geospatial variables explained 96% of the observed variation in cost data for piling machine piles. We suggest that these results and relationships between costs and underlying geospatial data can be conceptually generalized to other forests in the region.
3.4 Greenhouse gas and criteria air pollutant emissions results
The Pile Consumption Algorithm from the CONSUME model version 3.0, populated with data from the FACTS database and interviews with FMPs, suggests substantial criteria air pollutant and GHG emissions associated with pile burning on the National Forests included in this study. These emissions simulations do not include machine emissions associated with cutting and yarding materials, or building piles, only from burning them. Model results suggest that 33.3 ± 5.0 bone dry metric tons (bone dry MT; mean ± SE) of biomass are cut, piled, and burned per hectare of treated areas each year (13.5 ± 2.0 bone dry MT biomass ac−1). Across the 11 National Forests included in this study, the total amount of bone-dry biomass that is cut, piled, and burned is 1,151,046 MT yr−1. Of this material, CONSUME assumes 90% is combusted, with 75% of the combustion occurring during the flaming phase, 15% during the smoldering phase, and 15% during the residual phase.
Multiplying emission factors by fuel consumption in each of the combustion phases allowed us to generate estimates of emissions. For global relevance, we elect to report emissions in metric tons per hectare (for conversion to MT per acre, divide results by 2.47). Emissions of PM (0.33 ± 0.05 MT ha−1; mean), PM10 (0.23 ± 0.04 MT ha−1), and PM2.5 (0.20 ± 0.03 MT ha−1), as well as CO2 (Flaming: 36.3 ± 5.5 MT ha−1; Smoldering: 6.8 ± 1.0 MT ha−1; Residual: 6.8 ± 1.0 MT ha−1), CO (Flaming: 0.55 ± 0.08 MT ha−1; Smoldering: 0.61 ± 0.09 MT ha−1; Residual: 0.61 ± 0.09 MT ha−1), CH4 (Flaming: 3.2 × 10⁻² ± 4.8 × 10⁻³ MT ha−1; Smoldering: 4.0 × 10⁻² ± 6.0 × 10⁻³ MT ha−1; Residual: 4.0 × 10⁻² ± 6.0 × 10⁻³ MT ha−1), and NMHCs (Flaming: 3.3 × 10⁻² ± 5.1 × 10⁻³ MT ha−1; Smoldering: 3.0 × 10⁻² ± 4.5 × 10⁻³ MT ha−1; Residual: 3.0 × 10⁻² ± 4.5 × 10⁻³ MT ha−1) are shown in Figure 3A.
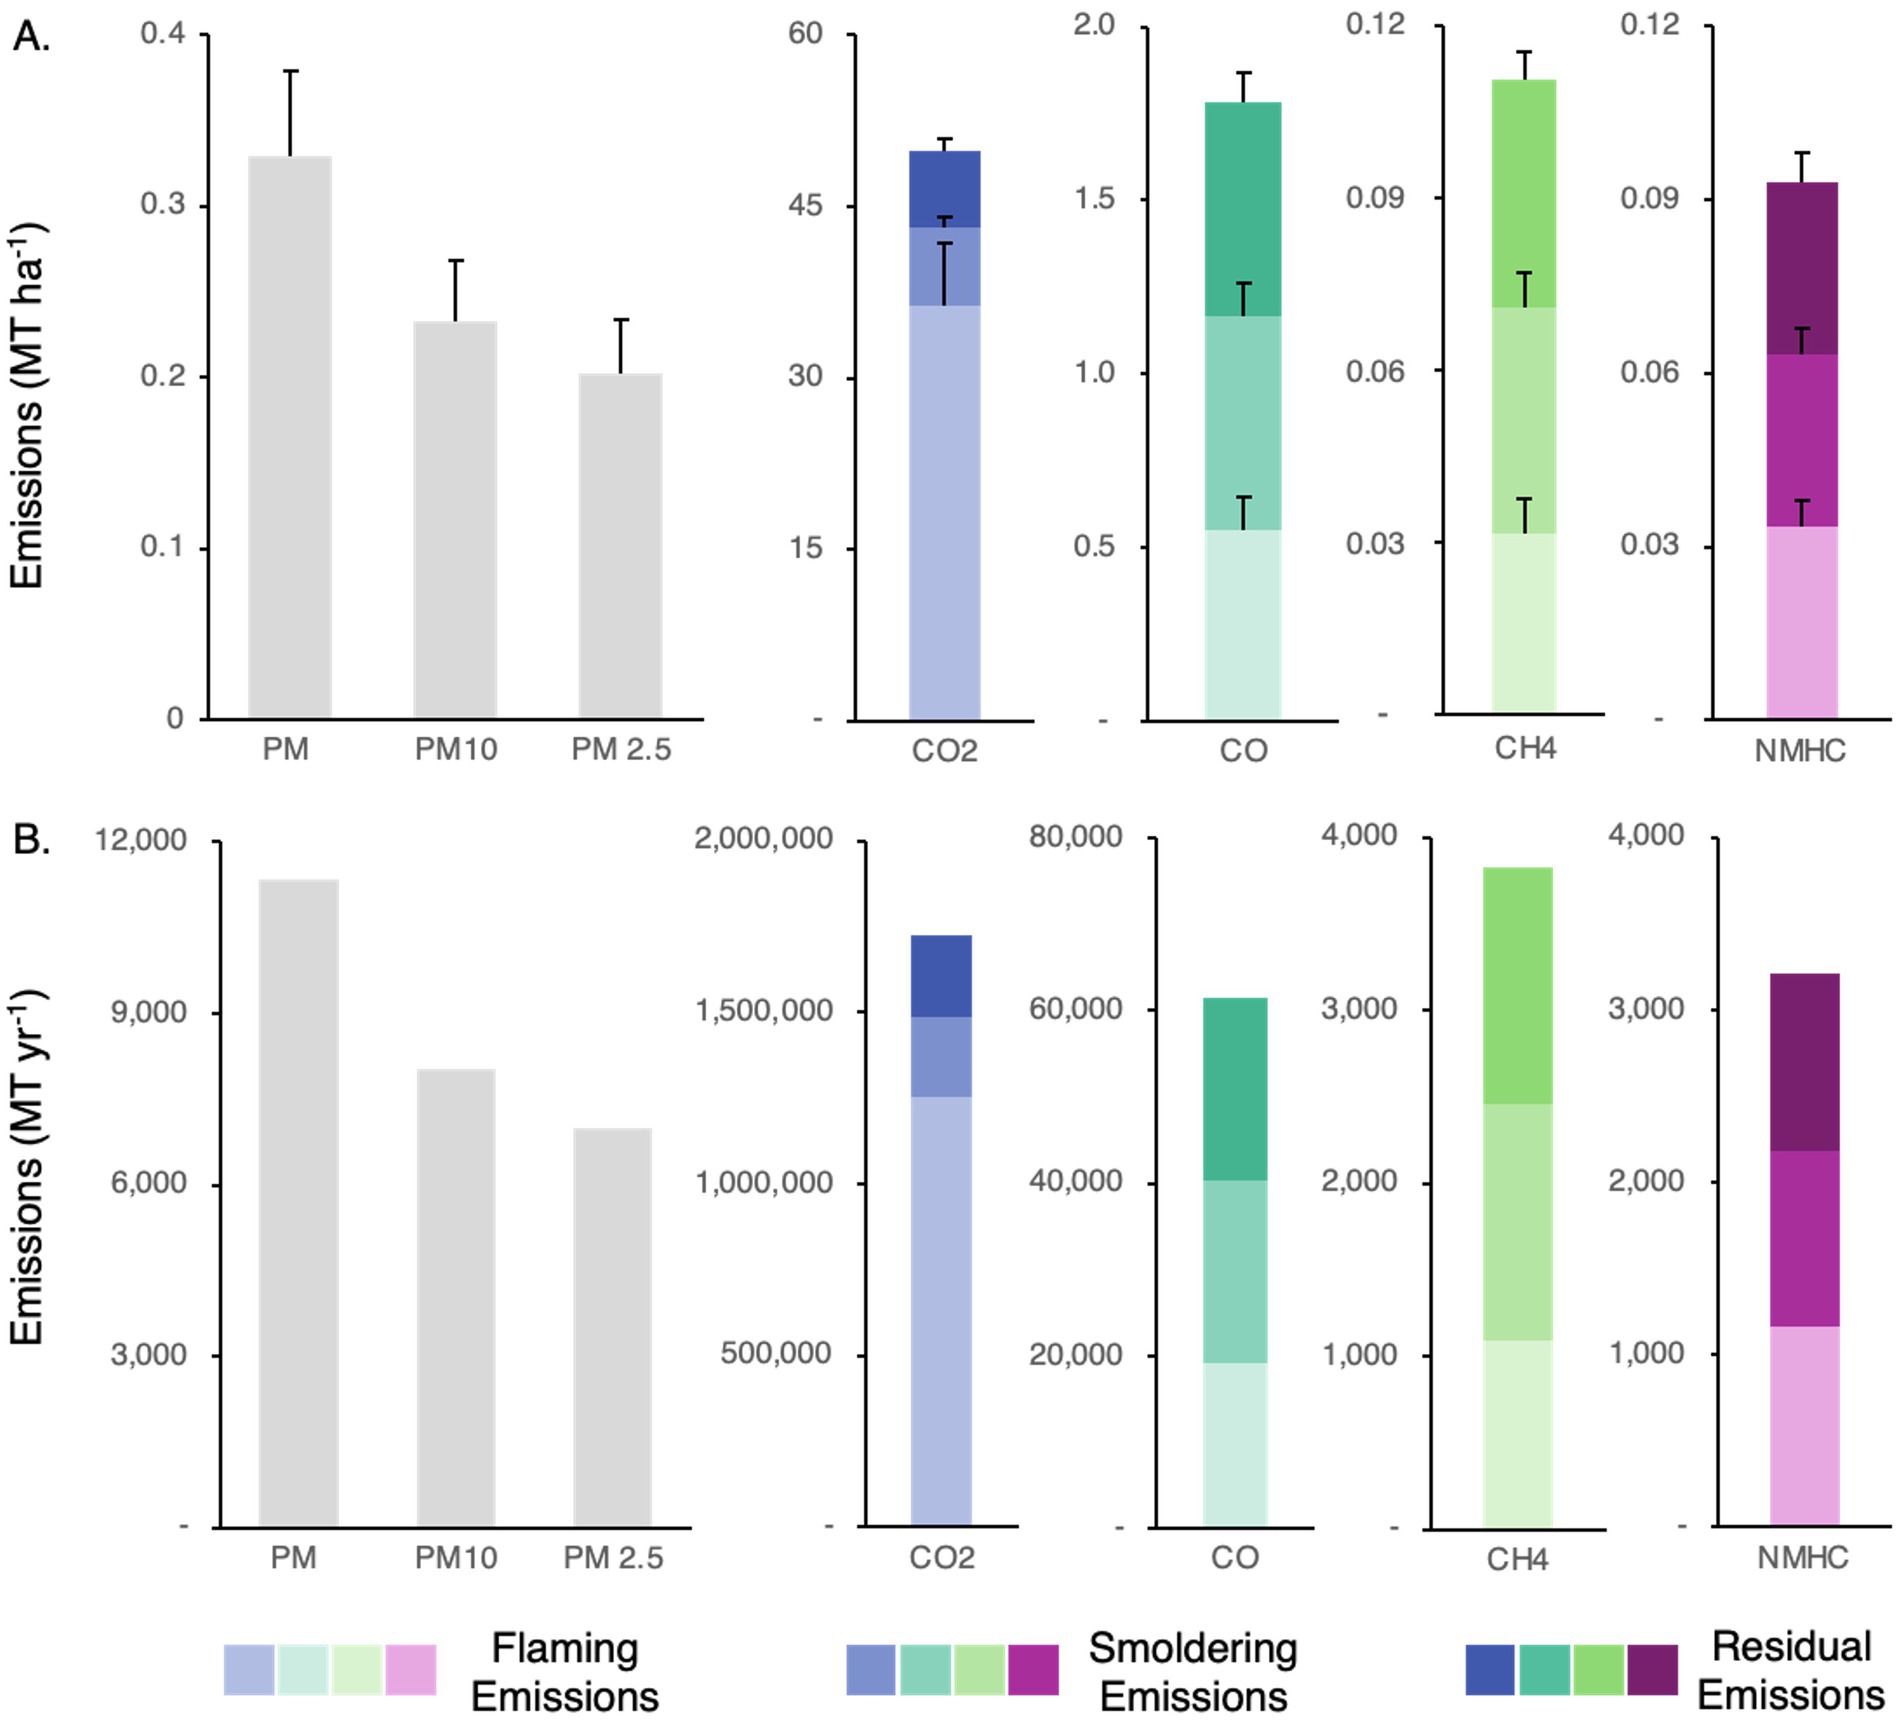
Figure 3. Pile burning emissions as simulated using the CONSUME model and study-derived inputs. (A) Indicates emissions ha−1, while (B) indicates annual emissions for the entire study area. These emissions simulations do not include machine emissions associated with cutting and yarding materials, or building piles, only from burning them.
Across the combustion phases stages, CONSUME estimates that pile burning on just the National Forests included in this study is responsible for 11,322 MT of particulate matter (PM), 8,029 MT of PM10, and 6,993 MT of PM2.5 emissions each year (Figure 3B). In addition to the criteria air pollutants, pile burning in our study area annually emits 1,723,548 MT CO2, 61,515 MT of (CO), 3,823 MT of (CH4), and 3,211 MT of (NMHCs; Figure 3B). Assuming GWP100 of 1.5 for CO, 28 for CH4, and 8 for NMHCs, the total CO2e of pile burning emissions each year is 1,948,546 MT each year. Given the pace and scale of forest restoration that is proposed for the entire U.S. West, we suggest that finding alternate end uses that prioritize carbon storage is a significant opportunity to mitigate a large source of avoidable near-term emissions.
3.5 CDR efficiency comparisons
Calculations of CDR efficiency at 100 years (Figure 4) provide additional motivation to find alternative end uses of forest residues. The ηCDR of pile burning is 8%, which implies that 92% of the CO2e contained in the piled biomass is emitted into the atmosphere. Since this value excludes process emissions from building and burning piles, the actual amount of emissions is likely higher.
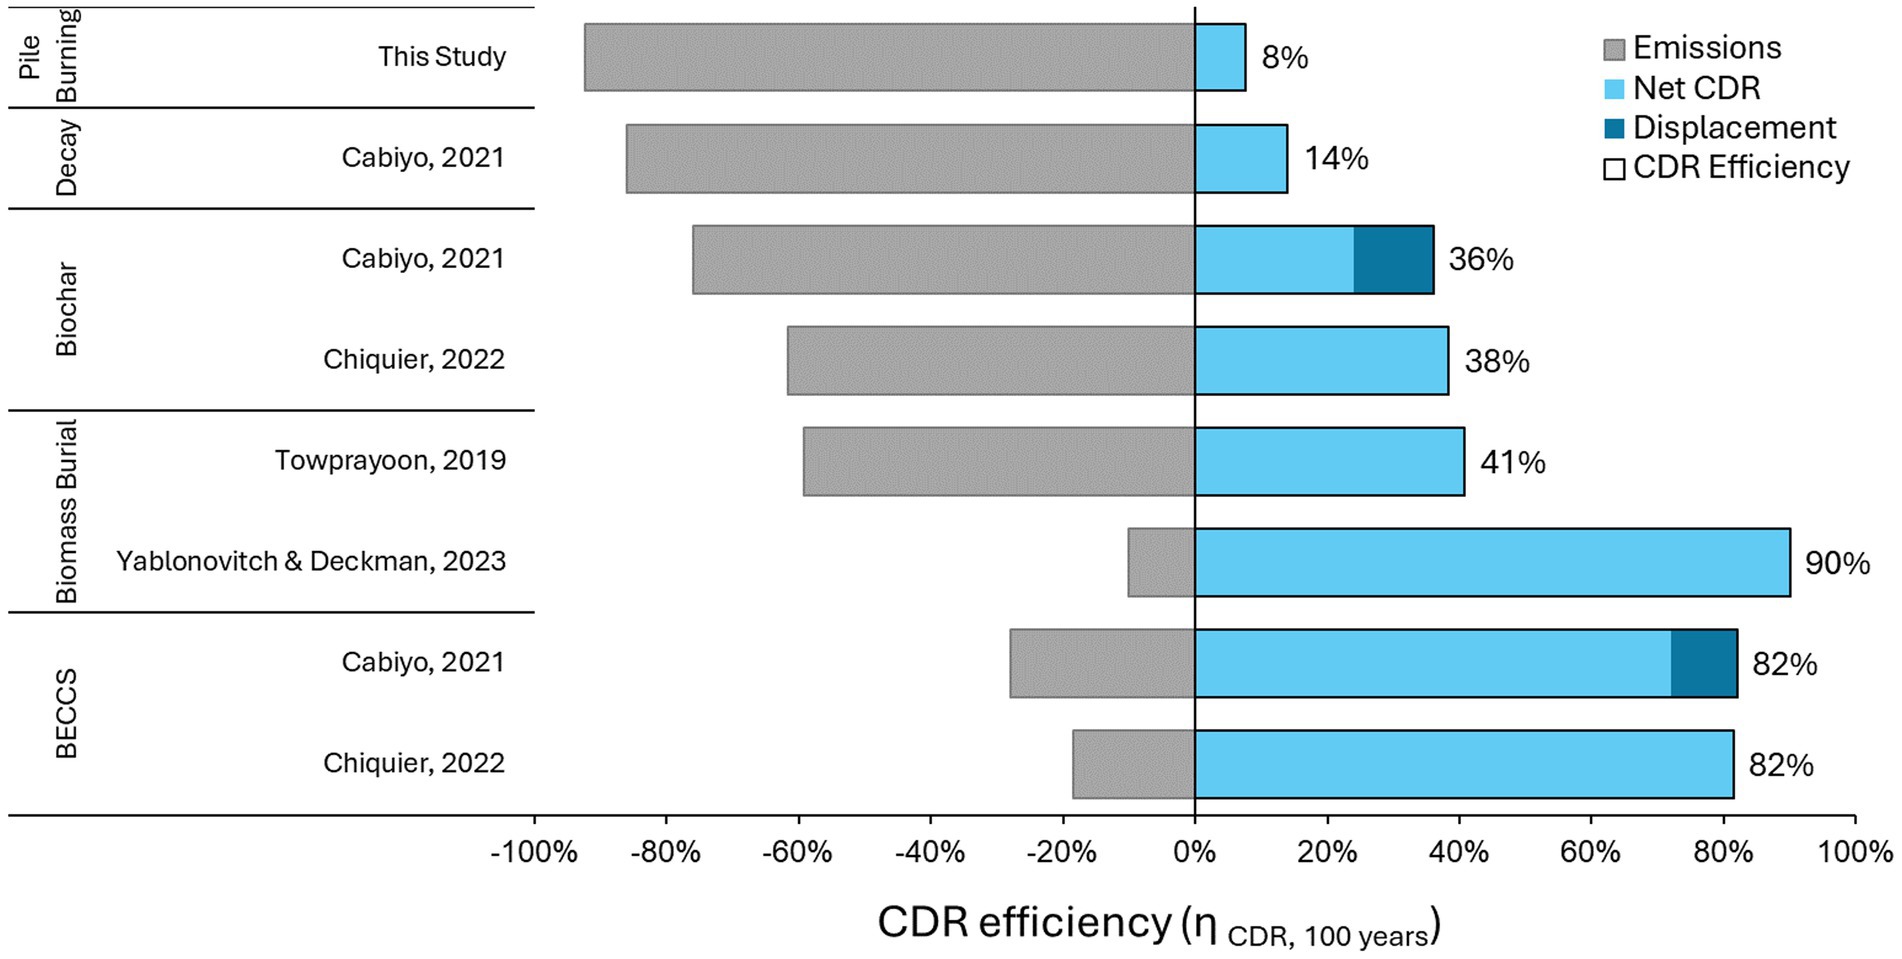
Figure 4. Comparison of CDR Efficiencies (ηCDR) across pile burning as calculated in this study and against four alternative scenarios, including: BECCS, biomass burial, biochar production with agricultural application, and decay.
All alternative uses had higher CDR efficiency than pile burning. Two studies on BECCS (Chiquier et al., 2022; Cabiyo et al., 2021) reported ηCDR of BECCS as 82%. One study on engineered biomass burial (Yablonovitch and Deckman, 2023) reported the lower bound of ηCDR of burial as 90%. Using an IPCC-approved methodology (Towprayoon et al., 2019) for calculating the emissions and carbon storage associated with solid waste disposal, we calculated a second ηCDR for burial of softwoods in anoxic conditions as 41%. We note that if anoxic burial conditions are not maintained, biomass is liable to loss due to further decomposition, and this value could be lower overall. Proper engineering of biomass burial sites are key to their durability. Two studies reported ηCDR of biochar applied in agricultural settings as 36 and 38% (Chiquier et al., 2022; Cabiyo et al., 2021). Finally, decay had a marginally higher ηCDR versus pile burning, at 14% (Cabiyo et al., 2021), though it should be noted that allowing piles to decay leaves fuel risk on the landscape.
Taken altogether, this simple comparison indicates each of the alternative end use pathways could have climate benefits as compared with the current practice of pile burning.
4 Discussion and conclusion
4.1 Comparing literature, FACTS, and interview cost estimates
Pile burning costs from our interviews were higher than reported previously, though our machine cutting costs were lower. We identified six studies which summarize cost of treatment by machine piling, including cutting and yarding, piling, and burning. No studies provided specific costs for hand piling. For just machine piling and burning, previous studies reported an average cost $543 ac−1 ($1,343 ha−1). Our participants reported an average cost of piling and burning machine piles of $735 ± $464 ac−1 ($1,816 ± $1,147 ha−1), 35% higher than costs than previously reported. As for machine cutting costs, participants reported substantially lower costs than the literature. This may indicate unfamiliarity with contract costs for harvest operations, especially for activities that generate revenue.
Planning costs were not a significant cost driver of overall treatment costs. Long-range planning and day-of planning costs were ~ 0.1% and ~ 2%, respectively, of treatment costs across the study area. These values may be influenced by the fact that agency personnel hours are usually a sunk cost and may obscure the actual costs and time required for planning pile burning. However, contracts often span many years and involve multiple programs within a single district, and these costs were not captured in our study. We recognize that our sample size (n = 11) is small relative to the total number of FMPs working on forests across our study area, and that our response rate (20%) was low. These results may introduce potential bias (see Section 4.4: Study Limitations).
When we compared our interview findings to the average costs reported to the FACTS database across each forest, we found variability in reporting costs. Three interviewees reported costs that were higher than those reported to FACTS on their forest, three reported costs that were lower, and two reported similar costs. Several factors contributed to this discrepancy. First, a few but not all participants discussed FACTS reporting. Some participants aggregated costs from recent contracts, while others were estimating averages based on several years of spend. Some participants were deriving costs from different contract structures, which may have led to differential binning or bucketing of cost estimation. We believe that some participants experienced recall bias when providing average costs, which may have impacted accuracy. The variability in reported costs for both FACTS and interviews is in and of itself, a notable result which reflects on-the-ground reality – costs are driven by multiple, overlapping market-driven (e.g., workforce availability, amount of funding available) and environmentally-driven (e.g., weather, terrain) factors.
4.2 Summary of pile burning as a tool for residue disposal
National Forests across our study area vary in forest type and density, disturbance and fire history, and management goals, but consistently implement pile burning as an essential component of hazardous fuels treatments.
Hand treatments are used in sensitive areas or areas inaccessible by machine. Hand piling and burning must continue to be a component of hazardous fuels treatments, especially in steep terrain, near sensitive areas such as wetlands and meadows, and in WUI areas where machines may be a nuisance. Through interviews, participants described that pile construction quality is particularly important for efficient disposal. In particular:
• Larger (e.g., six-foot diameter by six-foot height), well diced piles that do not have air gaps were noted to burn more completely.
• Larger piles also reduced “pancaking” observed in smaller piles during snow compaction. Pancaked piles are difficult to burn.
• Large piles may be restricted based on the scorch height of the piles – remaining crowns could be vulnerable to flames.
• In wet and snowy climates, well-covered piles (with Visqueen or wax paper) allowed piles to be more efficiently burned regardless of recent weather conditions.
• Pile covers degrade over time and may lose their water repellent properties before piles can be burned.
• Old and overly wet piles may require additional drip mix or ignition materials to combust, which can increase equipment costs for burning.
Machine treatments were described as significantly faster than hand treatments, and applicable in areas with good road access at <30% slope. Machine piles are much larger than hand piles, and often only one is built for several acres of thinning. Participants noted that machine piles offer an opportunity for utilization of residues, as where machines can get in typically trucks can too. Where something can be done with residuals, hauling material out of the forest as small logs or chips may significantly reduce pile size (in the case of processing out logs) or eliminate the need to build piles altogether (in the case of chips).
Interview participants described that due to the sheer number of piles built on the landscape, and the slow pace of pile burning resulting from the various constraints to pile burning, it is difficult to match the pace of building piles with the pace of burning piles. Pile burning pace is influenced by fixed environmental factors such as slope and forest density and dynamic factors such as weather and air quality. Workforce availability also reduced ability to implement pile burns. Nothing can be done to improve the weather. However, improving reliability of long-range (e.g., 10-day) weather forecasts may offer an opportunity to more accurately identify optimal burn windows, and facilitate planning and mobilization to accomplish more pile burning during quality burning conditions.
4.3 Policy mechanisms to avoid pile burning and enhance residue utilization
Where access is feasible, removing residues as feedstocks for utilization could reduce costs associated with pile construction and disposal by burning. Utilization would be particularly relevant for contract types that achieve hazardous fuels reduction goals but do not generate income through forest product removal or have integrated brush disposal fees. Traditionally, utilizations have focused on the production of bioenergy and bioproducts from wood. Since residue piles typically consist of low-quality wood, limbs, branches, and needles, they are difficult to use for physical products. The most common use is for conventional bioenergy, however high processing and transportation costs and low energy yields per unit feedstock often makes bioenergy uneconomical without subsidy.
The emerging framework of carbon management, which aims to store carbon permanently underground rather than adding it to the atmosphere, widens the aperture of how residues may be utilized. Since they are rich in carbon (~50% by mass), at relatively low carbon prices of ~$30/bone-dry ton (BDT) the carbon value of the feedstock outstrips the energy value of the same feedstock (Woodall and McCormick, 2022). Therefore, carbon management technologies which seek to use feedstocks produced from residues can valorize contained carbon, in lieu of or in addition to valorizing contained energy. These technologies include BECCS in addition to a broader class of approaches called biomass carbon removal and storage (BiCRS).
One mechanism which could reduce the need for pile burning and support BECCS and BiCRS technologies of all types is a technology-neutral, feedstock removal subsidy. Such a removal subsidy could be pegged to the avoided cost of building and burning piles, which represents a real cost to the USFS. In some cases, pile construction and burning may be included in harvest contracts, so this subsidy would be especially relevant for non-income generating contracts designed to achieve forest restoration or hazardous fuels reduction goals (USFS FACTS Coordinator, personal communication, October 29, 2024). At the agency level, the subsidy would be budget-neutral, with the avoided cost of pile burning offsetting the cost to implement the subsidy.
For example, this study reports piling and burning costs to the USFS ranging from $409 (FACTS) to $735 ac−1 for machine piling and burning. In addition, this study revealed that forest thinning produces on average 13.5 bone dry MT biomass ac−1. Dividing these per-acre costs by the per-acre residue production gives a potential subsidy value of $30-54 per bone dry MT of biomass in locations suitable for machine piling and burning. One simple mechanism for this would be for the USFS to directly pay project developers who utilize the material, to offset contractor costs for chipping and hauling biomass to the developer’s facility. A more advanced version of a subsidy could pay more to developers whose technologies store more carbon or produce more energy per unit feedstock, or could change value based on project or forest-specific costs and biomass yields. Given that hand piling and burning is conducted in more sensitive areas, we suggest that any potential subsidy must first consider the ecological and social effects of truck access and removal prior to implementation.
We suggest this type of subsidy represents a significant opportunity to reduce the number of piles requiring management, mitigate a large source of near-term emissions, and stimulate local biomass economies, all while the USFS pays the same amount as it would to dispose of the material by piling and burning it into the atmosphere.
4.4 Study limitations
This paper has several limitations, which calls to attention a challenging reporting environment within the USFS and likely in other land management agencies.
First, National Forests have unique contracting pathways or structures with different cost reporting requirements. There are over 300 fund codes within FACTS that designate the source of funding, including Brush Disposal (BDBD), Collaborative Forest Landscape Restoration (CFLN), Hazardous Fuels Reduction (NFHF), Cooperative Work Knutson-Vandenberg funds (CWKV), or Harvest Activity (XXXX). Certain fund codes require more precise financial tracking, while others do not require cost inputs (USFS FACTS Coordinator, personal communication, October 2024). This difference in reporting requirements reflects a potential source of error or missing information in our data.
Second, given the small sample size of interview participants, we acknowledge that there may be some missing perspectives not captured in our study. A larger sample of FMPs across our study area would improve findings, especially for the quantitative data. In addition, given the global relevance of fuel reduction treatments for wildfire mitigation, future work should attempt to quantify and compare management approaches and costs across international contexts.
Finally, while our geospatial analysis attempts to investigate how environmental context might predictably shape costs, we do not include metrics reflecting workforce availability, pile building techniques, weather conditions, and planning complexity. We suggest that expanded model frameworks would provide a more nuanced pathway to assessing the relative importance of all of these factors.
5 Conclusions and recommendations for future work
To date, there have been few studies assessing the costs and constraints associated with disposal of forestry residues by pile burning. In response, this study applied a mixed-methods approach combining analysis of a publicly available database, interviews with fire management professionals, and a geospatial analysis, with fuel consumption modeling and high-level life-cycle assessment of pile burning and alternative uses. The goal of this work was to update estimates of the economic and environmental impacts of pile burning and identify constraints and opportunities relative to current practices. Importantly, our results reveal that residue disposal by pile burning is more costly than has been reported in previous work and faces multiple practical constraints to implementation.
We recommend the following as promising directions for future research:
• This work used interviews to establish costs of forest management and pile burning, with a focus on the U.S. West and specifically California, Oregon, and Washington. Additional studies elsewhere in the United States or in other wildfire-prone forests worldwide would enhance our understanding of how costs of fuel management vary across environmental and social contexts.
• Multiple factors influence the cost of pile burning, including workforce availability, weather conditions, and planning complexity. A more robust cost model would incorporate these factors and assess the sensitivity of costs to each.
• A rigorous, field-based experiment involving following crews in the field to collect operational data and measuring size, emissions, and consumption of piles during building and burning would extend understanding of the costs and environmental impact of pile burning.
• The FACTS database contains inconsistencies and missing data, which suggests improvements in data categorization and quality are possible. Making cost reporting more uniform across contract types would ease analysis and potentially support more strategic decision-making.
• Due to emerging willingness-to-pay in carbon markets, carbon management frameworks are a promising area for residue utilization. Additional research on CDR project life-cycle assessment, forest residue counterfactuals (e.g., Fingerman et al., 2023), and data reported from commercial deployments of various BiCRS pathways will improve understanding of the feasibility of each.
Wildfire incidence is increasing globally in response to climate change (Higuera and Abatzoglou, 2021; Nolan et al., 2021; Jain et al., 2024; Giannaros and Papavasileiou, 2023; Tomshin and Solovyev, 2022). Responsible forest management, including thinning, is a necessary tool to reduce risk of wildfire to communities, environment, and public health. Fuel reduction via pile burning is undoubtedly an important tool for forest restoration. However, the cost of pile burning in the U.S. West, both in monetary terms and environmentally, is higher than previously realized. We assert that alternative utilizations can support forest restoration projects—and budgets—to go further, faster, more efficiently, and with superior environmental outcomes, and therefore deserve additional attention.
Data availability statement
The original contributions presented in the study are included in the article/supplementary material, further inquiries can be directed to the corresponding author.
Ethics statement
The studies involving humans were approved by Yale University Institutional Review Board and provided an exemption determination of category 2(ii) as research using interview procedures. The studies were conducted in accordance with the local legislation and institutional requirements. The participants provided their written informed consent to participate in this study.
Author contributions
JB: Writing – original draft, Writing – review & editing. JV: Writing – original draft, Writing – review & editing. SC: Writing – original draft, Writing – review & editing.
Funding
The author(s) declare that financial support was received for the research, authorship, and/or publication of this article. This study was funded by the Carbon Containment Lab and Kodama Systems. Costs include investigator salaries. Salaries will be covered by respective entities for investigator participation in the study. Subscription-based software services, e.g., Zoom and Dropbox, are covered by Yale School of the Environment or the Carbon Containment Lab and considered de minimis.
Acknowledgments
The authors thank Mark Ashton, Andie Creel, and multiple USFS personnel who provided insight on our research questions.
Conflict of interest
JB and SC declare that their contributions were conducted in the absence of any commercial or financial relationships that could be construed as a potential conflict of interest. JV works for and has a financial interest in a technology company developing tools for forest management.
Publisher’s note
All claims expressed in this article are solely those of the authors and do not necessarily represent those of their affiliated organizations, or those of the publisher, the editors and the reviewers. Any product that may be evaluated in this article, or claim that may be made by its manufacturer, is not guaranteed or endorsed by the publisher.
Supplementary material
The Supplementary material for this article can be found online at: https://www.frontiersin.org/articles/10.3389/ffgc.2024.1496190/full#supplementary-material
References
Abatzoglou, J. T., and Williams, A. P. (2016). Impact of anthropogenic climate change on wildfire across western US forests. Proc. Natl. Acad. Sci. 113, 11770–11775. doi: 10.1073/pnas.1607171113
Adams, M. D. O., and Charnley, S. (2018). Environmental justice and U.S. Forest Service hazardous fuels reduction: a spatial method for impact assessment of federal resource management actions. Appl. Geogr. 90, 257–271. doi: 10.1016/j.apgeog.2017.12.014
Agee, J. K., and Skinner, C. N. (2005). Basic principles of forest fuel reduction treatments. For. Ecol. Manag. 211, 83–96. doi: 10.1016/j.foreco.2005.01.034
Arriagada, R. A., Cubbage, F. W., Abt, K. L., and Huggett, R. J. (2008). Estimating harvest costs for fuel treatments in the west. For. Prod. J. 58, 24–30.
Belavenutti, P., Ager, A. A., Day, M. A., and Chung, W. (2022). Designing forest restoration projects to optimize the application of broadcast burning. Ecol. Econ. 201:107558. doi: 10.1016/j.ecolecon.2022.107558
Belavenutti, P., Chung, W., and Ager, A. A. (2021). The economic reality of the forest and fuel management deficit on a fire prone western US national forest. J. Environ. Manag. 293:112825. doi: 10.1016/j.jenvman.2021.112825
Bengtsson, M. (2016). How to plan and perform a qualitative study using content analysis. Nursing Plus Open 2, 8–14. doi: 10.1016/j.npls.2016.01.001
Block, W. M., Conner, L. M., Brewer, P. A., Ford, P., Haufler, J., Litt, A., et al. (2016). Effects of prescribed fire on wildlife and wildlife habitat in selected ecosystems of North America. The wildlife society technical review, 16–01. Bethesda, MD: The Wildlife Society, 69.
Brodie, E. G., Knapp, E. E., Brooks, W. R., Drury, S. A., and Ritchie, M. W. (2024). Forest thinning and prescribed burning treatments reduce wildfire severity and buffer the impacts of severe fire weather. Fire Ecol. 20:17. doi: 10.1186/s42408-023-00241-z
Burton, C., Kelley, D. I., Jones, C. D., Betts, R. A., Cardoso, M., and Anderson, L. (2022). South American fires and their impacts on ecosystems increase with continued emissions. Clim. Res. Sust. 1:e8. doi: 10.1002/cli2.8
Busenberg, G. (2004). Wildfire Management in the United States: the evolution of a policy failure. Rev. Policy Res. 21, 145–156. doi: 10.1111/j.1541-1338.2004.00066.x
Cabiyo, B., Fried, J. S., Collins, B. M., Stewart, W., Wong, J., and Sanchez, D. L. (2021). Innovative wood use can enable carbon-beneficial forest management in California. Proc. Natl. Acad. Sci. 118:e2019073118. doi: 10.1073/pnas.2019073118
Campbell, R. M., and Anderson, N. M. (2019). Comprehensive comparative economic evaluation of woody biomass energy from silvicultural fuel treatments. J. Environ. Manag. 250:109422. doi: 10.1016/j.jenvman.2019.109422
Chiquier, S., Patrizio, P., Bui, M., Sunny, N., and Mac Dowell, N. (2022). A comparative analysis of the efficiency, timing, and permanence of CO2 removal pathways. Energy Environ. Sci. 15, 4389–4403. doi: 10.1039/D2EE01021F
Elia, M., Lovreglio, R., Ranieri, N., Sanesi, G., and Lafortezza, R. (2016). Cost-Effectiveness of Fuel Removals in Mediterranean Wildland-Urban Interfaces Threatened by Wildfires. Forests, 7, 149. doi: 10.3390/f7070149
Filkov, A. I., Ngo, T., Matthews, S., Telfer, S., and Penman, T. D. (2020). Impact of Australia’s catastrophic 2019/20 bushfire season on communities and environment. Retrospective analysis and current trends. J. Safety Sci. Res. 1, 44–56. doi: 10.1016/j.jnlssr.2020.06.009
Franklin, J. F., and Dyrness, C. T. (1988). Natural vegetation of Oregon and Washington (2nd ed.). Corvallis, OR: Oregon State University Press.
Fingerman, K. R., Qiriazi, J., Barrientos, C. L., Blasdel, M., Comnick, J. M., Harris, A. R., et al. (2023). Climate and air pollution impacts of generating biopower from forest management residues in California. Environ. Res. Lett. 18, 034038. doi: 10.1088/1748-9326/acbd93
Giannaros, T. M., and Papavasileiou, G. (2023). Changes in European fire weather extremes and related atmospheric drivers. Agric. For. Meteorol. 342:109749. doi: 10.1016/j.agrformet.2023.109749
Hardy, C. (1996). Guidelines for estimating volume, biomass, and smoke production for piled slash. Gen. Tech. Rep PNW-GTR-364. Portland, OR: U.S. Department of Agriculture, Forest Service, Pacific Northwest Research Station.
Hartsough, B. R., Abrams, S., Barbour, R. J., Drews, E. S., McIver, J. D., Moghaddas, J. J., et al. (2008). The economics of alternative fuel reduction treatments in western United States dry forests: financial and policy implications from the National Fire and fire surrogate study. Forest Policy Econ. 10, 344–354. doi: 10.1016/j.forpol.2008.02.001
Hennink, M., and Kaiser, B. N. (2022). Sample sizes for saturation in qualitative research: a systematic review of empirical tests. Soc. Sci. Med. 292:114523. doi: 10.1016/j.socscimed.2021.114523
Higuera, P. E., and Abatzoglou, J. T. (2021). Record-setting climate enabled the extraordinary 2020 fire season in the western United States. Glob. Chang. Biol. 27, 1–2. doi: 10.1111/gcb.15388
Jain, P., Barber, Q. E., Taylor, S. W., Whitman, E., Castellanos Acuna, D., Boulanger, Y., et al. (2024). Drivers and impacts of the record-breaking 2023 wildfire season in Canada. Nat. Commun. 15:6764. doi: 10.1038/s41467-024-51154-7
Jain, T. B., Battaglia, M. A., Han, H.-S., Graham, R. T., Keyes, C. R., Fried, J. S., et al. (2012). A comprehensive guide to fuel management practices for dry mixed conifer forests in the northwestern United States (RMRS-GTR-292; p. Portland, OR: U.S. Department of Agriculture, Forest Service, Pacific Northwest Research Station.
Knight, C. A., Tompkins, R. E., Wang, J. A., York, R., Goulden, M. L., and Battles, J. J. (2022). Accurate tracking of forest activity key to multi-jurisdictional management goals: a case study in California. J. Environ. Manag. 302:114083. doi: 10.1016/j.jenvman.2021.114083
Kreider, M. R., Higuera, P. E., Parks, S. A., Rice, W. L., White, N., and Larson, A. J. (2024). Fire suppression makes wildfires more severe and accentuates impacts of climate change and fuel accumulation. Nat. Commun. 15:2412. doi: 10.1038/s41467-024-46702-0
Lasslop, G., Coppola, A. I., Voulgarakis, A., Yue, C., and Veraverbeke, S. (2019). Influence of fire on the carbon cycle and climate. Curr. Clim. Chang. Rep. 5, 112–123. doi: 10.1007/s40641-019-00128-9
Liu, X., Huey, L. G., Yokelson, R. J., Selimovic, V., Simpson, I. J., Müller, M., et al. (2017). Airborne measurements of western U.S. wildfire emissions: comparison with prescribed burning and air quality implications. J. Geophys. Res. Atmos. 122, 6108–6129. doi: 10.1002/2016JD026315
Loomis, J., Collie, S., González-Cabán, A., Sánchez, J. J., and Rideout, D. (2019). “Wildfire fuel reduction cost analysis: statistical modeling and user model for fire specialists in California” in Proceedings of the fifth international symposium on fire economics, planning, and policy: Ecosystem services and wildfires. Gen. Tech. Rep. PSW-GTR-261. eds. A. González-Cabán and J. J. Sánchez (Portland, OR: U.S. Department of Agriculture, Forest Service, Pacific Northwest Research Station), 85–95.
Marshall, E., Elliot-Kerr, S., McColl-Gausden, S. C., and Penman, T. D. (2023). Costs of preventing and supressing wildfires in Victoria, Australia. J. Environ. Manage. 344:118606. doi: 10.1016/j.jenvman.2023.118606
Mott, C. M., Hofstetter, R. W., and Antoninka, A. J. (2021). Post-harvest slash burning in coniferous forests in North America: a review of ecological impacts. For. Ecol. Manag. 493:119251. doi: 10.1016/j.foreco.2021.119251
National Wildfire Coordinating Group (2014). Interagency Prescribed Fire Planning and Implementation Procedures Guide. PMS, 484. NWCG Fuels Management Committee, Fire Use Subcommittee.
Nolan, R. H., Bowman, D. M. J. S., Clarke, H., Haynes, K., Ooi, M. K. J., Price, O. F., et al. (2021). What do the Australian black summer fires signify for the global fire crisis? Fire 4:97. doi: 10.3390/fire4040097
Noss, R. F., Franklin, J. F., Baker, W. L., Schoennagel, T., and Moyle, P. B. (2006). Managing fire-prone forests in the western United States. Front. Ecol. Environ. 4, 481–487. doi: 10.1890/1540-9295(2006)4[481:MFFITW]2.0.CO;2
Penman, T. D., and Cirulis, B. A. (2020). Cost effectiveness of fire management strategies in southern Australia. Int. J. Wildland Fire 29:427. doi: 10.1071/WF18128
Peterson, D. L., Johnson, M. C., Agee, J. K., Jain, T. B., McKenzie, D., and Reinhardt, E. D. (2005). Forest structure and fire hazard in dry forests of the Western United States (PNW-GTR-628; p. PNW-GTR-628). Portland, OR: U.S. Department of Agriculture, Forest Service, Pacific Northwest Research Station.
Prichard, S. J., and Kennedy, M. C. (2012). Fuel treatment effects on tree mortality following wildfire in dry mixed conifer forests, Washington state, USA. Int. J. Wildland Fire 21, 1004–1013. doi: 10.1071/WF11121
Prichard, S. J., Ottmar, R. D., and Anderson, G. K. (2006). Consume 3.0 User's guide. Seattle, WA: USDA Forest Service, Pacific northwest Research Station, Pacific wildland fire sciences laboratory, fire and environmental research applications team, 234.
Sandberg, D. V. (1983). “Research leads to less smoke from prescribed fires,” in Proceedings of the 1983 Annual Meeting of the Northwest Forest Fire Council, Olympia, WA, 1–15.
Shinn, D. A. (1980). Historical perspectives on range burning in the inland Pacific northwest. J. Range Manag. 33, 415–423. doi: 10.2307/3898574
Statista. (2021). Turkey, Greece and Italy Battle Historic Fires. Available at: https://www.statista.com/chart/25504/hectares-burned-in-wildfires-in-europe/ (Accessed November 4, 2024).
Stephens, S. L., and Collins, B. M. (2004). Fire regimes of mixed conifer forests in the north-Central Sierra Nevada at multiple spatial scales. Northwest Sci. 78, 12–23.
Strzepek, K., Yohe, G., Neumann, J., and Boehlert, B. (2010). Characterizing changes in drought risk for the United States from climate change. Environ. Res. Lett. 5:044012. doi: 10.1088/1748-9326/5/4/044012
Tomshin, O., and Solovyev, V. (2022). Features of the extreme fire season of 2021 in Yakutia (eastern Siberia) and heavy air pollution caused by biomass burning. Remote Sens. 14:4980. doi: 10.3390/rs14194980
Towprayoon, S., Ishigaki, T., Chiemchaisri, C., and Abdel Aziz, A. O. (2019). “Chapter 3: solid waste disposal,” in 2019 Refinement to the 2006 IPCC Guidelines for National Greenhouse Gas Inventories (Switzerland: IPCC).
U.S. Office of Personnel Management. (2024a). General Schedule (GS) Pay Scale. Available at: https://www.opm.gov/policy-data-oversight/pay-leave/pay-systems/general-schedule/
U.S. Office of Personnel Management. (2024b). General Schedule (GS) Salary Table. Available at: https://www.opm.gov/policy-data-oversight/pay-leave/salaries-wages/salary-tables/pdf/2024/GS_h.pdf
USDA Forest Service. (2022a). Confronting the wildfire crisis. FS-1187a. Available at: https://www.fs.usda.gov/sites/default/files/Confronting-Wildfire-Crisis.pdf (Accessed January 12, 2022).
USDA Forest Service. (2022b). National prescribed fire program review. Office of the Chief. Available at: https://www.frames.gov/documents/usfs/USFS_20220908_National-Prescribed-Fire-Program-Review.pdf (Accessed September 21, 2022).
Ward, D. E., Hardy, C. C., Sandberg, D. V., and Reinhardt, T. E. (1989). “Part III-emissions characterization” in Mitigation of prescribed fire atmospheric pollution through increased utilization of hardwoods, piled residues, and long-needled conifers. eds. D. V. Sandberg, D. E. Ward, and R. D. Ottmar (Seattle, WA: U.S. Department of Agriculture, Forest Service, Pacific Northwest Research Station).comp
Welch, K. R., Safford, H. D., and Young, T. P. (2016). Predicting conifer establishment post wildfire in mixed conifer forests of the north American Mediterranean-climate zone. Ecosphere 7:e01609. doi: 10.1002/ecs2.1609
Woodall, C. M., and McCormick, C. F. (2022). Assessing the optimal uses of biomass: carbon and energy price conditions for the Aines principle to apply. Frontiers in Climate. 4:993230. doi: 10.3389/fclim.2022.993230
Wright, C. S., Balog, C. S., and Kelly, J. W. (2010). Estimating volume, biomass, and potential emissions of hand-piled fuels (PNW-GTR-805; p. PNW-GTR-805). Seattle, WA: U.S. Department of Agriculture, Forest Service, Pacific Northwest Research Station.
Wright, H. E. Jr., and Heinselman, M. L. (1973). The ecological role of fire in natural conifer forests of western and northern North America—introduction. Quat. Res. 3, 319–328. doi: 10.1016/0033-5894(73)90002-1
Keywords: pile burning, hazardous fuels, forest management, prescribed fire, emissions, biomass utilization, biomass carbon removal and storage (BiCRS), carbon dioxide removal (CDR) efficiency
Citation: Barker J, Voorhis J and Crotty SM (2025) Assessing costs and constraints of forest residue disposal by pile burning. Front. For. Glob. Change. 7:1496190. doi: 10.3389/ffgc.2024.1496190
Edited by:
Matthew Sloggy, Pacific Southwest Research Station, Forest Service (USDA), United StatesReviewed by:
Claudio Petucco, Luxembourg Institute of Science and Technology (LIST), LuxembourgSonia Bruck, Southern Research Station, Forest Service (USDA), United States
Copyright © 2025 Barker, Voorhis and Crotty. This is an open-access article distributed under the terms of the Creative Commons Attribution License (CC BY). The use, distribution or reproduction in other forums is permitted, provided the original author(s) and the copyright owner(s) are credited and that the original publication in this journal is cited, in accordance with accepted academic practice. No use, distribution or reproduction is permitted which does not comply with these terms.
*Correspondence: Jake Barker, amFrZS5iYXJrZXJAb3JlZ29uc3RhdGUuZWR1