 Şule Nur Topgül
 Elif Sertel
 Samet Aksoy
 Cem Ünsalan
 Johan E. S. Fransson
94% of researchers rate our articles as excellent or good
Learn more about the work of our research integrity team to safeguard the quality of each article we publish.
Find out more
ORIGINAL RESEARCH article
Front. For. Glob. Change, 06 January 2025
Sec. Planted Forests
Volume 7 - 2024 | https://doi.org/10.3389/ffgc.2024.1495544
Natural and planted forests, covering approximately 31% of the Earth’s land area, are crucial for global ecosystems, providing essential services such as regulating the water cycle, soil conservation, carbon storage, and biodiversity preservation. However, traditional forest mapping and monitoring methods are often costly and limited in scale, highlighting the need to develop innovative approaches for tree detection that can enhance forest management. In this study, we present a new dataset for tree detection, VHRTrees, derived from very high-resolution RGB satellite images. This dataset includes approximately 26,000 tree boundaries derived from 1,496 image patches of different geographical regions, representing various topographic and climatic conditions. We implemented various object detection algorithms to evaluate the performance of different methods, propose the best experimental configurations, and generate a benchmark analysis for further studies. We conducted our experiments with different variants and hyperparameter settings of the YOLOv5, YOLOv7, YOLOv8, and YOLOv9 models. Results from extensive experiments indicate that, increasing network resolution and batch size led to higher precision and recall in tree detection. YOLOv8m, optimized with Auto, achieved the highest F1-score (0.932) and mean Average Precision (mAP)@0.50 Intersection over Union threshold (0.934), although some other configurations showed higher mAP@0.50:0.95. These findings underscore the effectiveness of You Only Look Once (YOLO)-based object detection algorithms for real-time forest monitoring applications, offering a cost-effective and accurate solution for tree detection using RGB satellite imagery. The VHRTrees dataset, related source codes, and pretrained models are available at https://github.com/RSandAI/VHRTrees.
Preserving natural forests is crucial for the environment, as they play a vital role in the global ecosystem, covering approximately 31% of the Earth’s land area and representing 80% of the terrestrial biodiversity (FAO, 2020). They provide essential ecosystem services, including water cycle regulation, soil conservation, carbon storage, and timber production (Beloiu et al., 2023; Safonova et al., 2022; Zhang et al., 2022). Forests are facing various threats like the European spruce bark beetle (Ips typographus), which can cause significant damage to forests during outbreaks (Safonova et al., 2022). Besides from natural causes, there are also human-induced risks for forests, especially with global climate change (Beloiu et al., 2023). Hence, determining the regions that are under risk, and evaluating the strategies for protection is important for forest monitoring (dos Santos et al., 2019). Since traditional forest monitoring techniques are high-cost, time-consuming, and scale-limited, developing new methodologies is vital (Beloiu et al., 2023). Various technologies and methods can be used for forest monitoring. Optical satellite data, such as Landsat 8 OLI, MODIS, and Sentinel-2 MSI, provide extensive imagery coverage for forest applications, particularly when analyzed using machine learning (ML) approaches. Advanced ML and artificial intelligence techniques, such as eXtreme Gradient Boosting (XGBoost) and neural networks, play a critical role in enhancing the accuracy of forest monitoring metrics within modern forest mapping methodologies (Aksoy et al., 2023; Estrada et al., 2023). Detailed and large-scale ecosystem analysis often utilizes deep learning approaches such as convolutional neural networks (CNNs), which are widely used for semantic segmentation of individual trees, classification of tree species, and counting trees (Beloiu et al., 2023). Unmanned aerial vehicles (UAVs) equipped with optical cameras can be used to capture high-resolution aerial imagery for tree detection (Jintasuttisak et al., 2022). Additionally, optical images obtained from airborne systems can be used to identify individual tree species. TreeSatAI is a valuable dataset consisting of data acquired from multiple sensors, including aerial imagery. It is highly suitable for tree species classification tasks because it contains multilayer labels that provide detailed information on tree species across 20 different classes (Ahlswede et al., 2023). Apart from optical images, light detection and ranging (LiDAR) data are also widely used for the accurate assessment and management of forest resources (dos Santos et al., 2019; Sun et al., 2022). Improvements in computer vision techniques, such as object based image analysis (OBIA) contribute to the detection and classification of tree species in natural forests (Sivanandam and Lucieer, 2022; Weinstein et al., 2019). Furthermore, tight integration of deep learning technologies in remote sensing domain, especially with CNNs, lead to more accurate tree detection and species classification tasks (Zhang et al., 2022). For example, Faster R-CNN and Mask R-CNN methods improve the accuracy of object detection and segmentation of tree canopies from very high spatial resolution imagery (Ocer et al., 2020). These diverse technologies and methods provide valuable tools for effectively monitoring and managing forest ecosystems.
RGB imagery data are also high in demand for research due to their cost-effectiveness and accessibility, where satellite and UAV platforms are widely used to collect very high-resolution (VHR) multi-spectral images. You Only Look Once (YOLO) models offer promising object detection capabilities identifying single trees (Beloiu et al., 2023). YOLO models are widely used due to their speed, computational efficiency, and high accuracy. This makes them suitable for real-time applications in various domains, including agriculture, forestry, as well as geospatial object detection such as ship (Kızılkaya et al., 2022) and airplane (Bakırman and Sertel, 2023). For example, the VHRShips and the HRPlanes benchmark datasets utilize YOLO models to showcase their capabilities and provide valuable information about deep learning methodologies in GeoAI applications (Bakırman and Sertel, 2023; Kızılkaya et al., 2022). According to Jintasuttisak et al. (2022), YOLOv1 to YOLOv5 models have been proven to be capable of adaptation for diverse domains in terms of their versatility and effectiveness. Although remote sensing methods often rely on sensors such as LiDAR or multispectral imagery, recent advancements in deep learning, particularly with CNNs, have enabled the development of object detection models using RGB images only. This offers a cost-effective solution for monitoring trees and tree species (dos Santos et al., 2019; Weinstein et al., 2019).
Benchmark datasets are crucial to develop and test new models or methodologies to create a baseline for the focused topic. Generating a benchmark dataset for tree detection using remotely sensed images and automatic quantification of the trees are important for forestry applications, natural resource management as well as for ecological and landscape planning. In the paper by Zamboni et al. (2021), orthophotos with a resolution of 0.10 m were employed, comprising 220 images and detecting a total of 3,382 trees using 21 different models, including both anchor-based and anchor-free deep learning techniques. In contrast, Zheng and Wu (2022) employed Google Earth (GE) images with a resolution of 0.27 m across 600 images, utilizing the YOLOv4-Lite model for tree detection. In the paper by dos Santos et al. (2019), UAV RGB images with a resolution of 0.82 m were employed, and a total of 392 images were analyzed using models such as Faster R-CNN, YOLOv3, and RetinaNet. Furthermore, Beloiu et al. (2023) employed aerial RGB imagery with a resolution of 0.10 m, detecting over 10,000 trees through the use of the Faster R-CNN model. The ReforesTree dataset (Reiersen et al., 2022), comprising solely RGB drone images at 0.02 m resolution, was employed to detect 4,463 trees situated across six agroforestry sites in the central coastal region of Ecuador. This was achieved through the utilization of CNNs, ResNet18 model.
We present a new dataset for tree detection, called VHRTrees, generated using VHR RGB satellite images. The dataset employs GE images with a spatial resolution of 50 cm or better, thereby meeting the high-detail requirements crucial for accurate tree detection. GE platform hosts huge amount of satellite imagery with varying spatial and temporal resolutions from multiple-sensors which is a valuable resource for different applications, including but not limited to forest monitoring, tree detection, and forest inventory analysis. Accessibility to this variety of geospatial big data holds the potential to encourage scalable, large-scale applications for both academic research and industrial practices, particularly in different fields and domains. VHRTrees dataset comprises 1,471 images, a considerably larger dataset compared to many others reviewed, thereby providing a robust foundation for training and testing ML and DL models. Furthermore, the dataset comprises 25,966 trees, which lends it comprehensive and detailed tree characteristics, thereby providing extensive data for effective model training and validation. The VHRTrees dataset employs four different YOLO models (YOLOv5, YOLOv7, YOLOv8, and YOLOv9), which provide diverse methodological approaches that enhance the dataset’s versatility and applicability across various scenarios. A comparison of the Yolov6 and Yolov7 models, on the COCO dataset, revealed that the maximum accuracy of the real-time model YOLOv7-E6E [56.8% Average Precision (AP)] was 13.6% units higher than that of the current most accurate Meituan/YOLOv6-s model (43.2% AP) (Wang et al., 2022). In addition, the Meituan/YOLOv6-n model (35.0% AP, 0.5 ms) is 0.2% lower and 25% slower than the YOLOv7-tiny (35.2% AP, 0.4 ms) model (Wang et al., 2022). The Yolov6 model was not included in this study due to the its common usage for industrial applications and lack of adaptability for research settings, and difficulty detecting small objects like trees because its architecture places more emphasis on speed and efficiency than accuracy in detecting fine details, which is essential for recognizing small trees.
We conducted a comparative analysis of the performance of different YOLO models on the same dataset, thereby facilitating a more profound comprehension of their respective strengths and weaknesses. Our dataset covers various geographical regions across Türkiye, ensuring the integration of various tree species from different ecologic conditions into the dataset, which then fed into the various YOLO models. This contributes to the generalization and transferability of the trained models to similar forest domains. This, in turn, enhances the model’s ability to deliver high performance results. Since the GE platform is an accessible resource for everyone, researchers can implement our model for tree detection in different locations by using GE images of similar resolution. A comparison of the datasets is presented in Table 1.
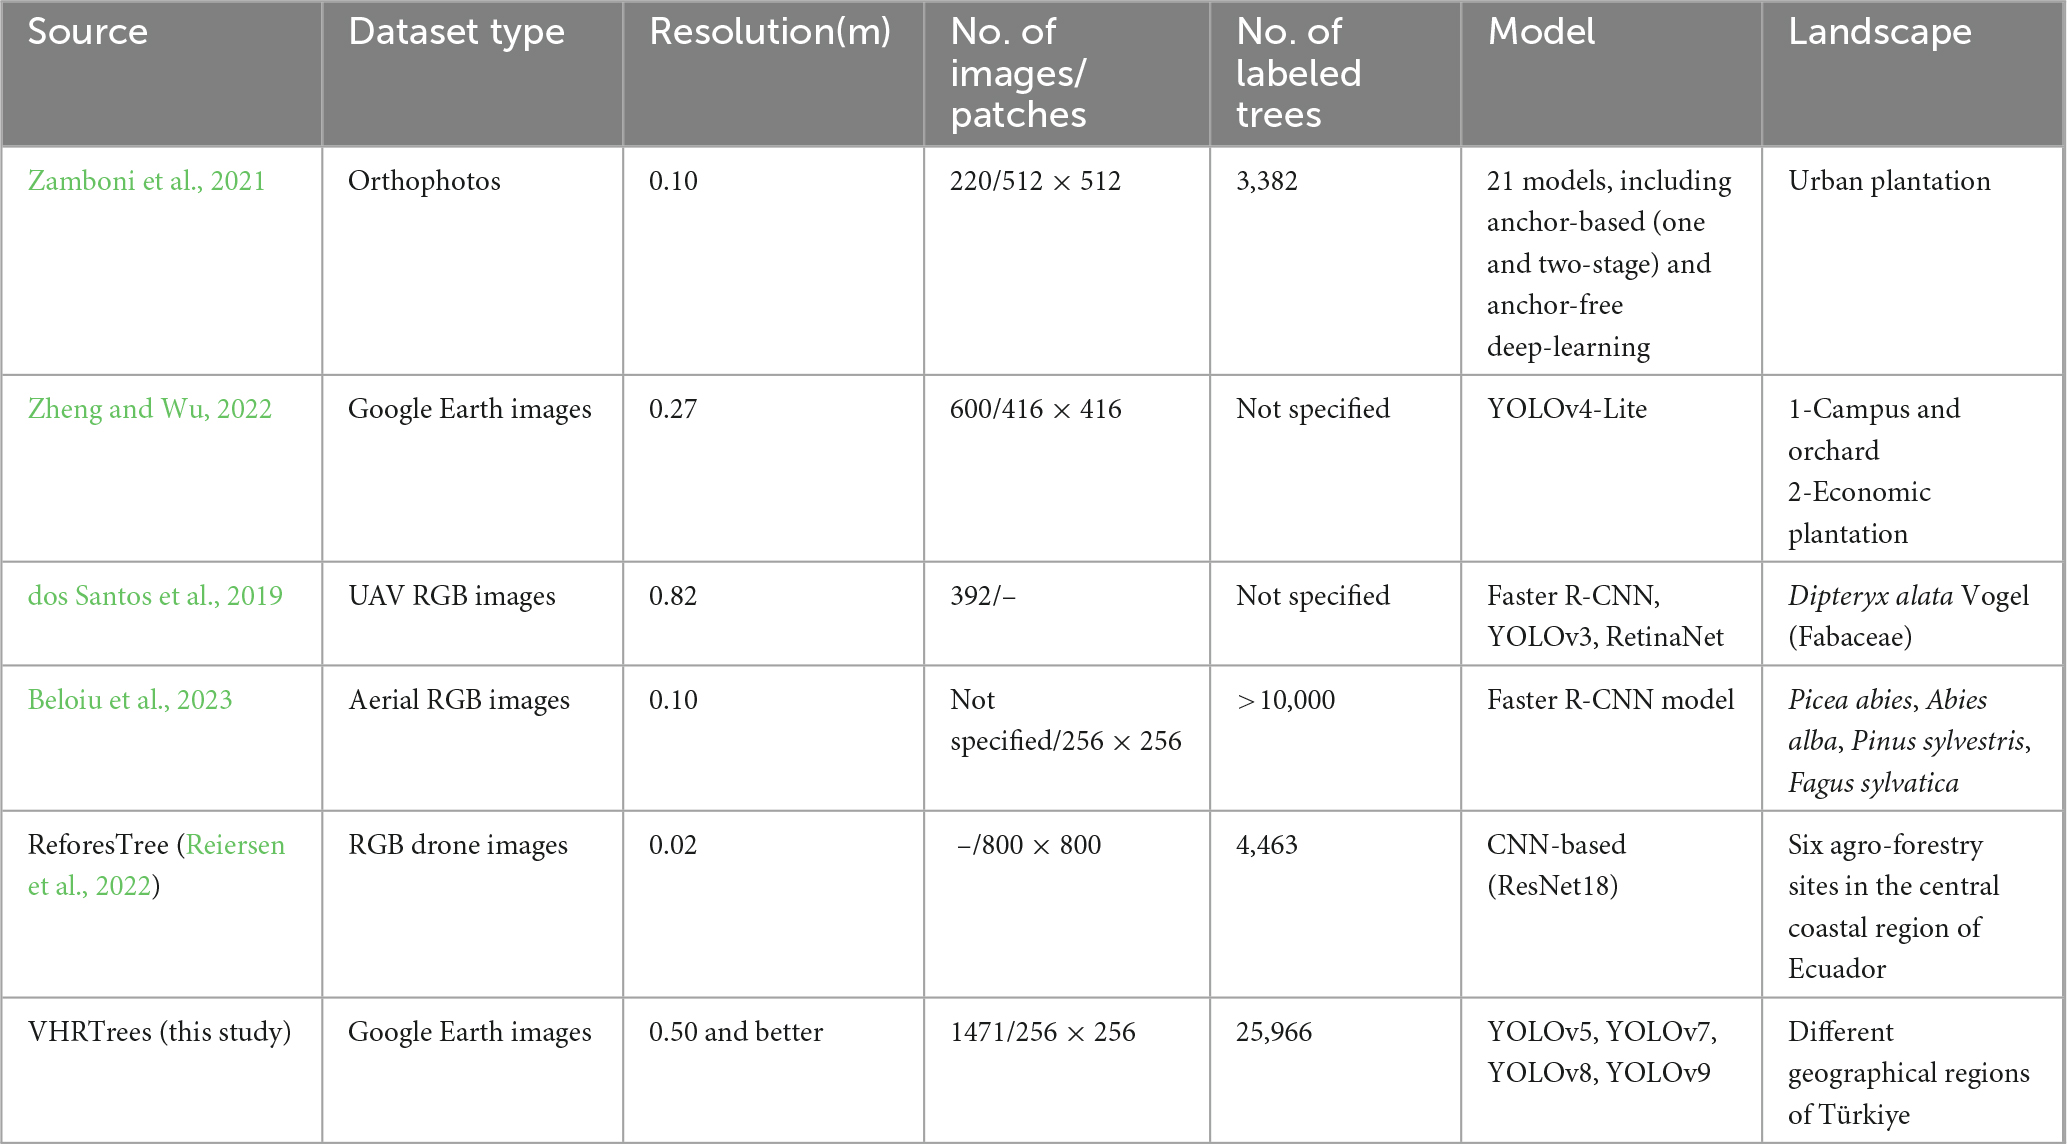
Table 1. Comparison of datasets used in machine learning models.
Our benchmark dataset, comprising delineated individual canopy crowns derived from VHR GE imagery, is designed to facilitate comparisons across methods that utilize different tree canopy types or combinations. It offers flexibility in workflow while standardizing the output format to represent the boundaries of individual canopy tree crowns.
To summarize, while LiDAR-based and multispectral methods have dominated the field of tree detection and forest monitoring, there is a growing interest in leveraging RGB imagery and advanced CNN architectures for these tasks. Object detection algorithms, particularly those based on YOLO, show promising potential for accurately identifying individual trees in diverse environments. Our study aims to contribute to this evolving field by introducing a new tree detection dataset with annotated bounding boxes and evaluating the performance of various YOLO versions on this dataset. Through these efforts, we seek to advance the state-of-the-art in tree detection methodologies and provide valuable insights for future research and applications in forestry and ecological monitoring.
The study areas were selected from five regions in the western part of Türkiye, specifically from the provinces of Bursa and Ýzmir: Karacabey, Dikili, Aliağa, Seferihisar, and Selçuk (Table 2).
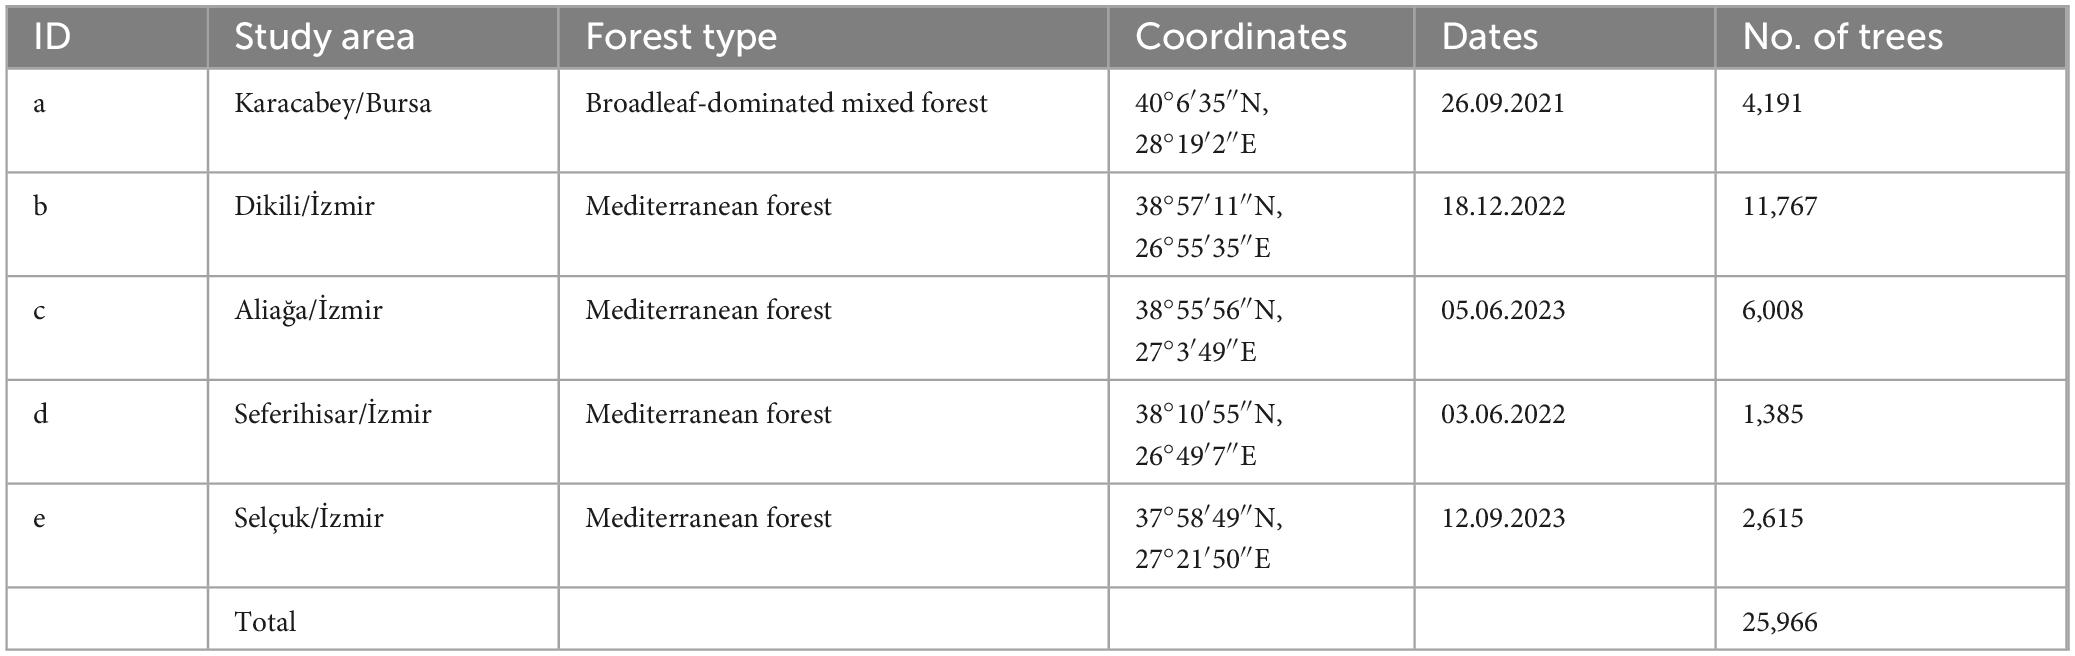
Table 2. Selected study areas with forest type, coordinates, and tree counts.
The climate in Bursa is typically humid subtropical, with hot summers and mild and rainy winters, while Ýzmir experiences a Mediterranean climate characterized by hot and dry summers, and mild and rainy winters. Karacabey features broadleaf-dominated mixed forest with species such as oak (Quercus spp.) and beech (Fagus spp.). Dikili, Aliağa, Seferihisar, and Selçuk are characterized by Mediterranean forests, predominantly comprising pine (Pinus spp.), olive (Olea europaea), and various shrubs. These regions possess diverse forest ecosystems rich in tree communities. Despite the high tree density, individual trees in these areas are easily distinguishable, making them ideal for tree detection studies. The study areas are illustrated in Figure 1.
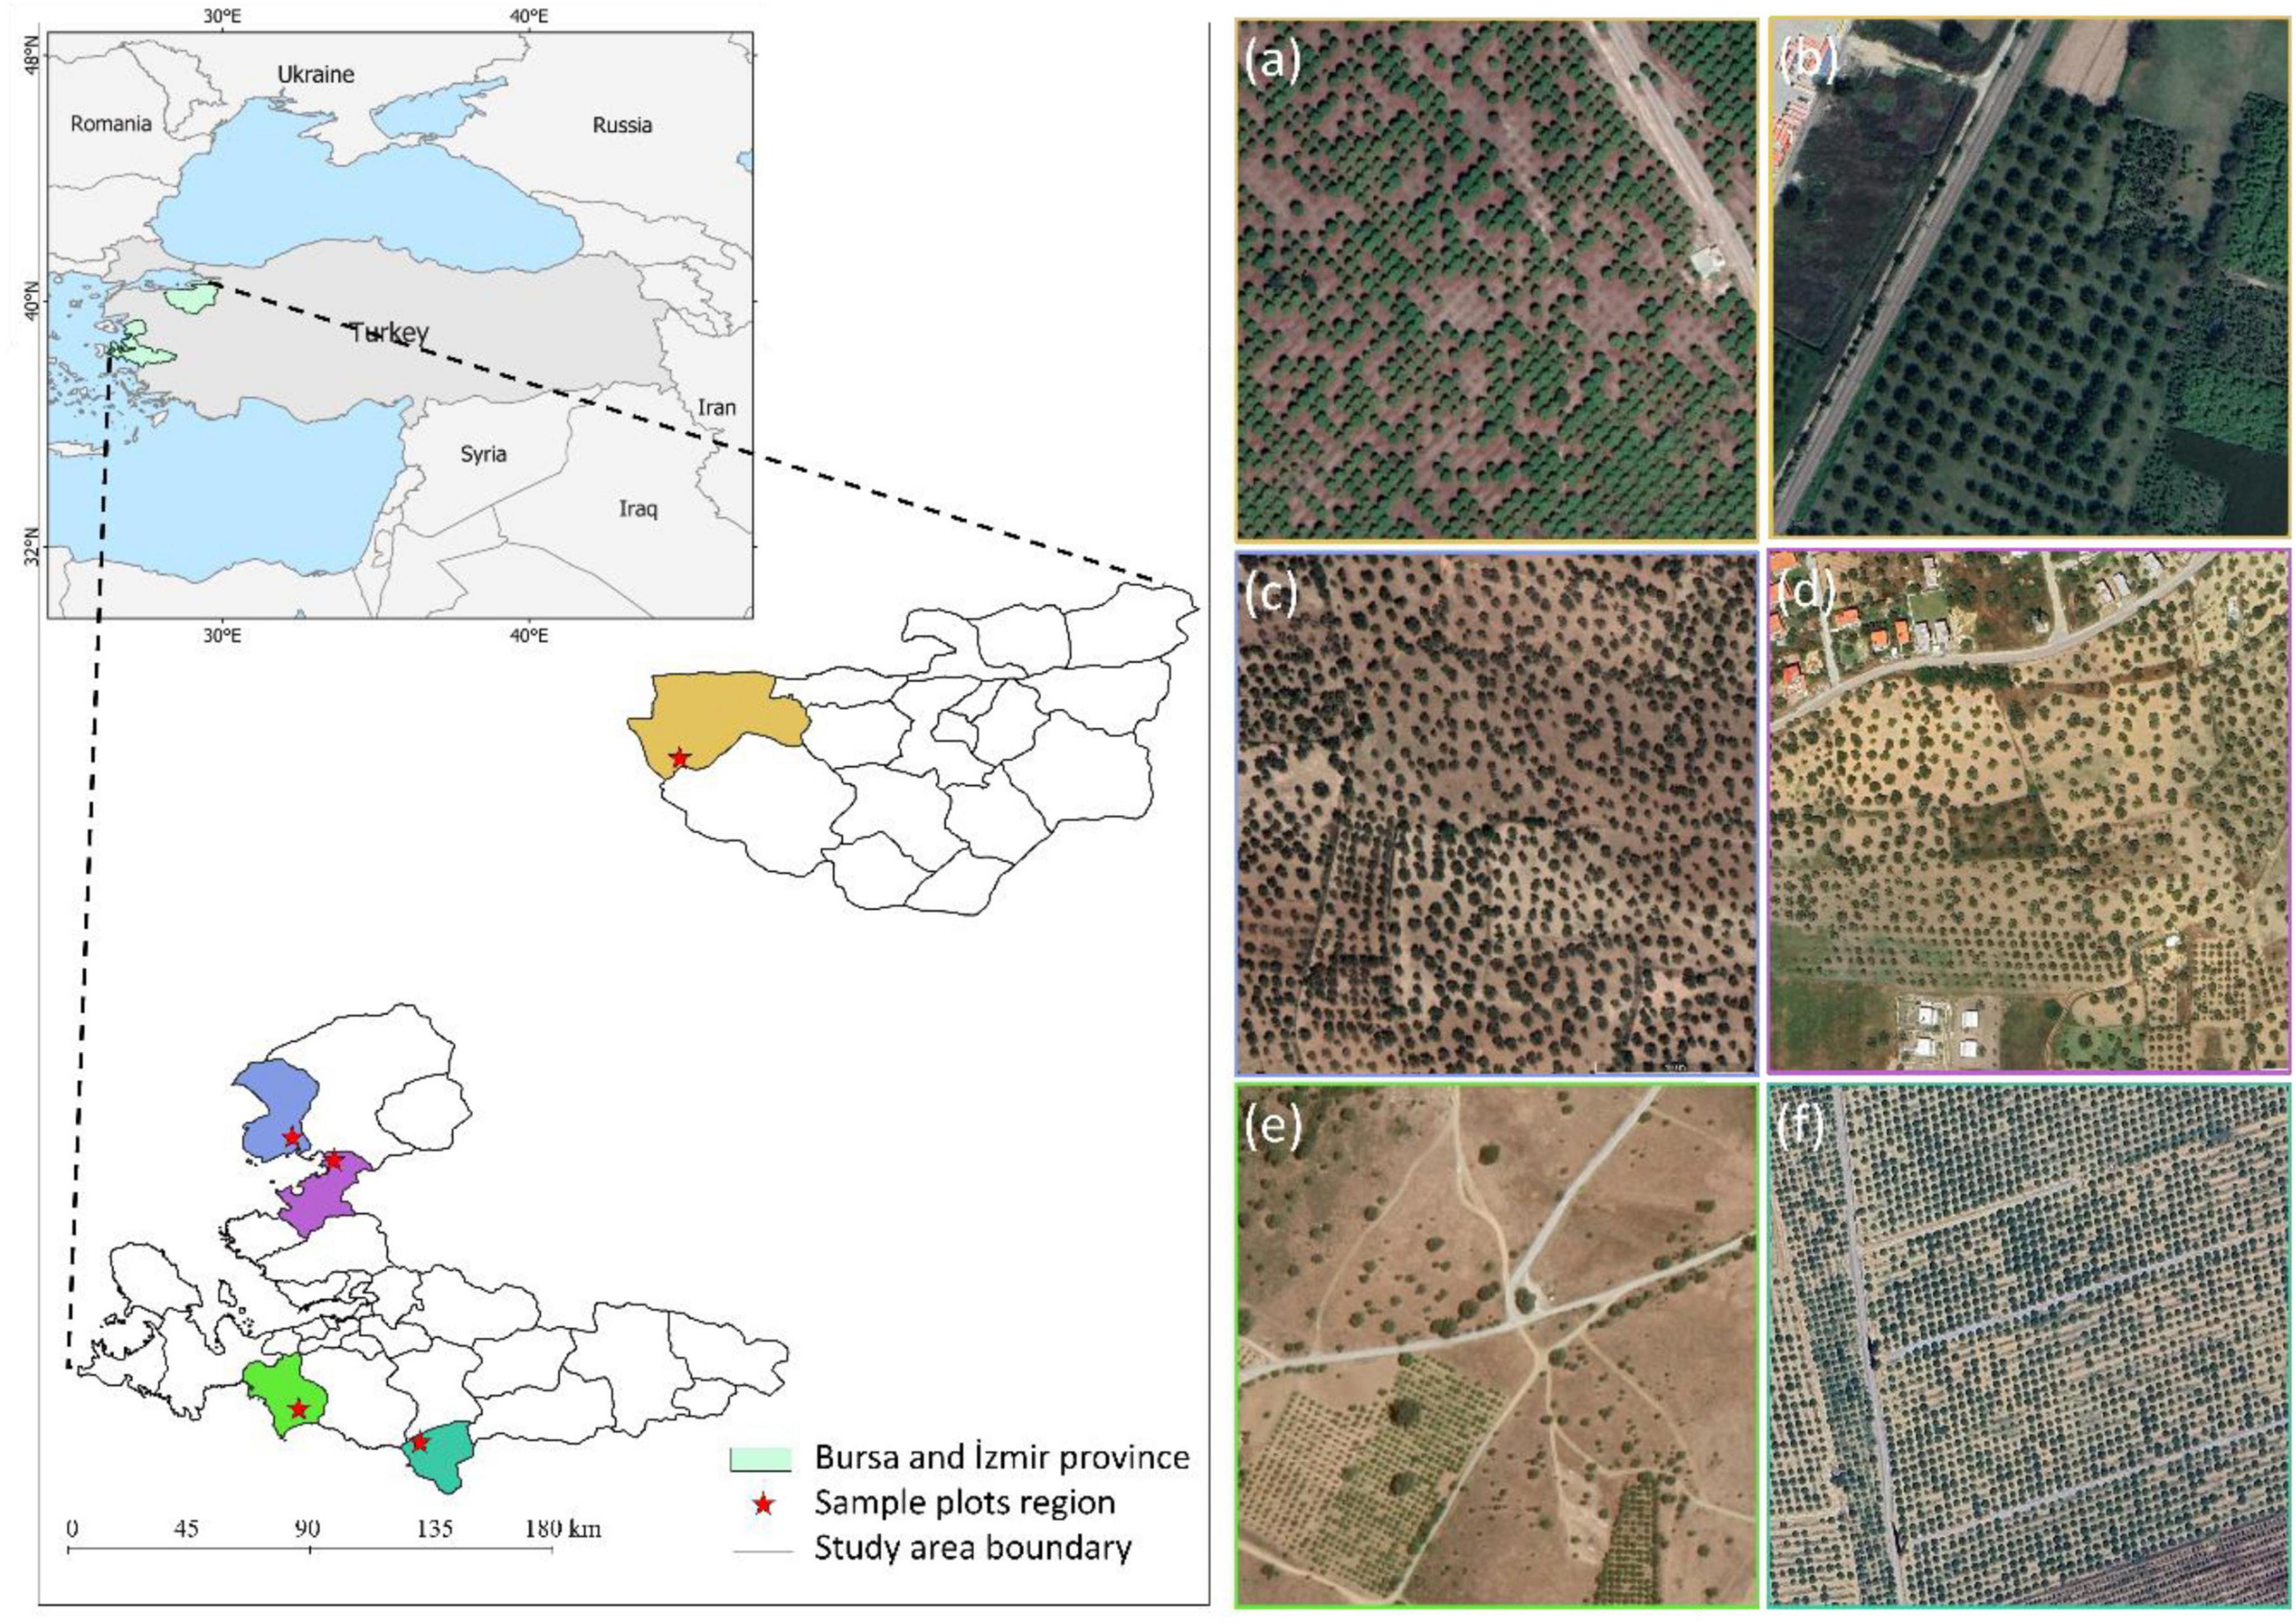
Figure 1. General view of the study areas and its surroundings (left-up), the administrative boundaries of five sites used in the research: Karacabey, marked in golden yellow, panels (A,B), Dikili, marked in light blue, panel (C), Aliağa, marked in purple, panel (D), Seferihisar, marked in bright green, panel (E), and Selçuk, marked in turquoise, panel (F).
In the first step, 218 RGB images were downloaded from GE, each with a size of 1,920 × 1,080 pixels and a ground sample distance (GSD) of 0.5 m or better, covering the study areas of Karacabey, Dikili, Aliağa, Seferihisar, and Selçuk, which are explained in section “2.1 Study areas.” Subsequently, images unsuitable for the dataset were carefully filtered out. This included images where individual trees were not sufficiently visible, could not be annotated, or were obscured by cloud cover during acquisition. After visually analyzing these images, we selected 45 that best represented the dataset in terms of the distinctiveness of individual trees, the number of trees in the image, and overall image quality. Finally, image patches were generated from these selected images.
The initial step in creating a dataset for object detection involved enclosing objects with bounding boxes. Here, the objects are individual trees of varying density and dimension, since our focus is on tree detection. Labeling methods can be classified into three categories: fully manual, semi-automatic, and fully automatic. Fully manual methods, such as using QGIS (Zamboni et al., 2021), involve human annotators drawing bounding boxes, ensuring high accuracy but is labor-intensive. Semi-automatic methods (Lau et al., 2021; Pordel and Hellström, 2015) combine manual input with automated processes to enhance efficiency, whereas fully automatic methods rely entirely on algorithms, such as deep learning-based segmentation and object detection models, to label objects. These methods are highly efficient for processing large datasets, although they may require post-processing to correct inaccuracies. In this study, an automatic method was utilized to label trees. Initially, an automatic segmentation process was conducted in eCognition Developer 64 (Trimble, 2024) on 45 images with a size of 1,920 × 1,080 to extract the boundaries of individual trees. The primary aim of this process was to quickly and accurately determine the most suitable boundaries surrounding trees of varying sizes in the dataset. The principal objective of this process was to rapidly and accurately ascertain the optimal boundaries surrounding trees of disparate sizes within the dataset. The segmentation parameters for this stage were as follows: scale parameter = 30, shape = 0.98, and compactness = 0.02. Subsequently, the resulting image masks from the segmentation were divided into 256 × 256-pixel patches that corresponded to their respective images. The positional information of the segments was converted into bounding boxes using a Python program, and each image was stored in the corresponding vector file. In the final stage, the exact boundaries of trees that were partially visible at the edges of the 256 × 256 images or too small to be automatically delineated could not be determined. Manual corrections for these trees were performed by transferring the images and their corresponding vector labels to the Roboflow platform. Two independent experts conducted a quality checks on the final bounding boxes. As a result, a semi-automatic labeling method was implemented to ensure high accuracy in the final dataset.
Prior to the training phase, images with corresponding labels were divided into smaller, manageable patches through a tiling process to better use the computing resources. The image patches were generated with a size of 256 × 256 pixels, each with corresponding bounding boxes. This process resulted in a total of 2,025 patches. Subsequently, images without label information (i.e., those lacking data) and non-square samples, specifically those image patches obtained from the edged of the larger images, were removed from the dataset as part of the pruning step, resulting in the elimination of 554 problematic patches. This preprocessing method further reduced the training load and allowed the YOLO models to focus on more informative examples. As a result, the final VHRTrees dataset consisted of 1,471 image patches, which were split into 70% (1,023 patches), 15% (226 patches), and 15% (222 patches) for training, validation, and testing, respectively. Sample images with corresponding bounding boxes for individual trees can be seen in Figure 2.
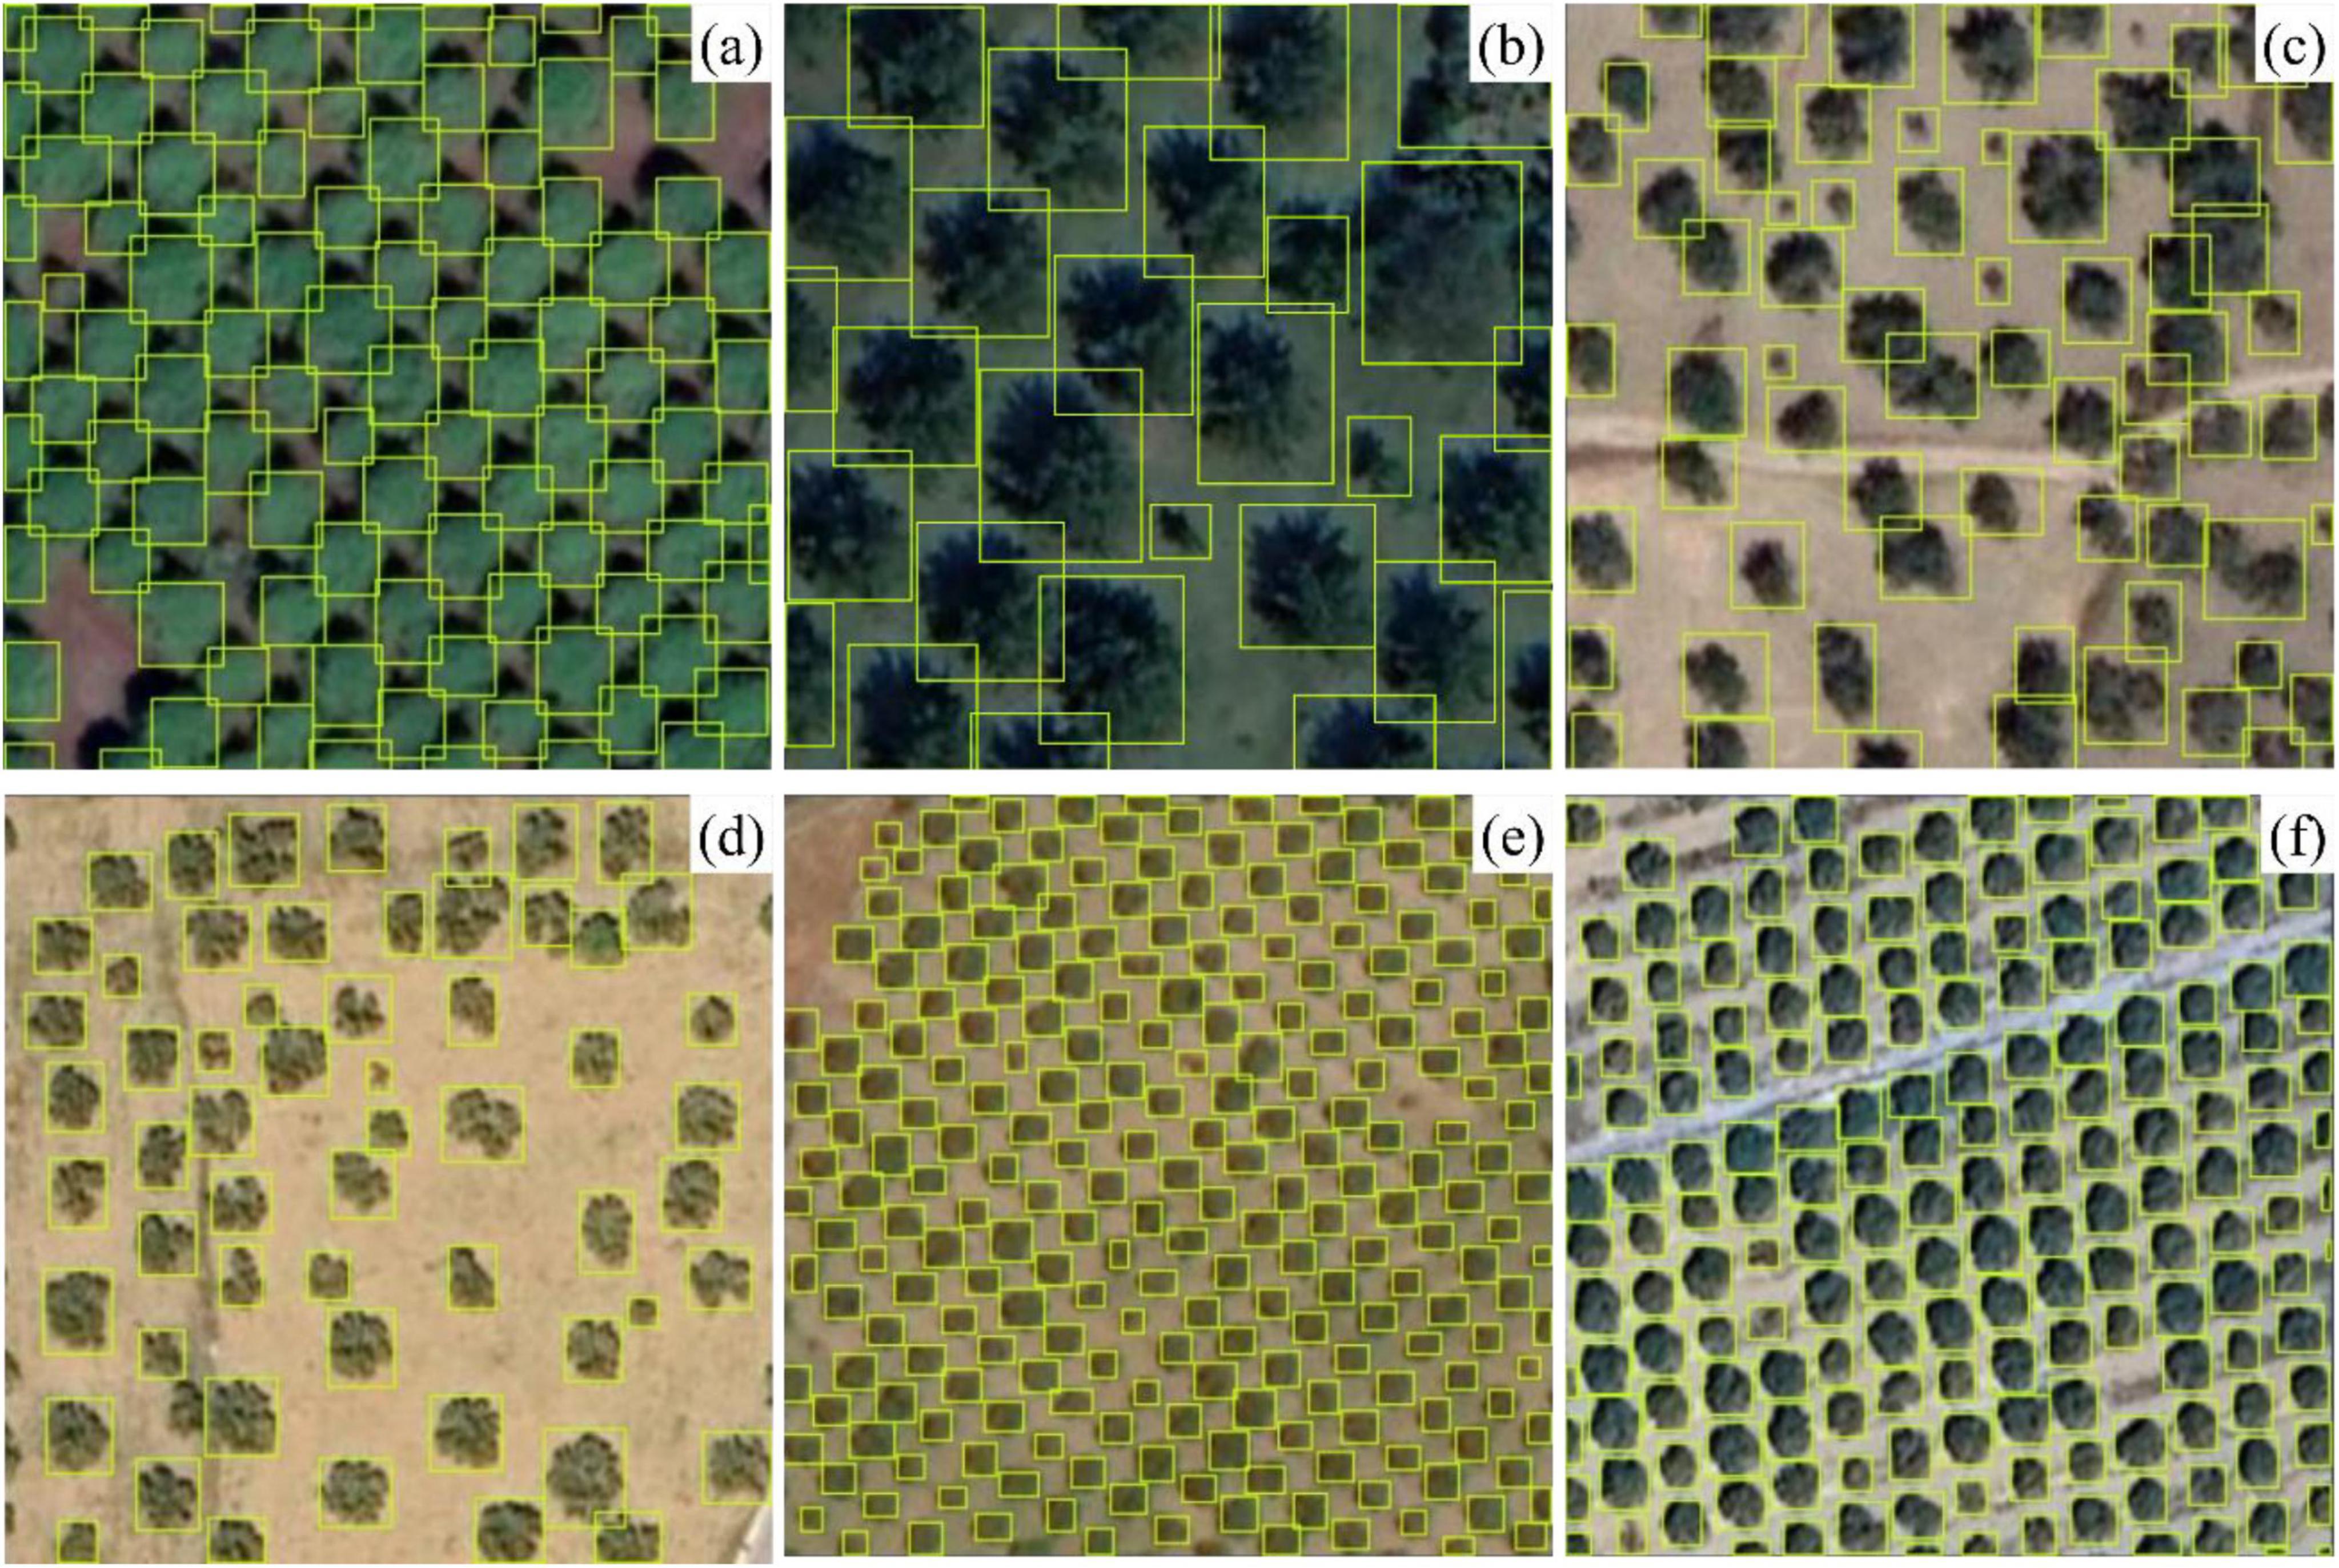
Figure 2. The following sample images, taken from the VHRTrees dataset, are accompanied by corresponding bounding boxes for individual trees from the Karacabey (A,B), Dikili (C), Aliağa (D), Seferihisar (E), and Selçuk (F) regions, respectively with patch sizes of 256 × 256 pixels.
The proposed VHRTrees dataset was utilized to evaluate a series of YOLO models, including YOLOv5 (Jocher et al., 2022), YOLOv7 (Wang et al., 2022), YOLOv8 (Ultralytics, 2024), and YOLOv9 (Wang et al., 2024). The accuracy of each model in detecting individual trees was evaluated using the designated test portion of the dataset (15% of the data), followed by 70% training, 15% validation. Model parameters and characteristics such as the number of layers, backbone architecture, and computational efficiency measured in FLOPs are analyzed for each model. These factors, along with the frameworks used to implement the models, were comprehensively compared. A detailed comparison of the general characteristics of the YOLO models, including their parameters, backbones, and FLOPs, is presented in Table 3. Experimental setups were designed to test various optimizers (SGD, Adam, AdamW, and Auto) and input resolutions (640 × 640 and 960 × 960 pixels) across YOLOv5, YOLOv7, YOLOv8, and YOLOv9 variants. To optimize both performance and computational efficiency, initial experiments were conducted at a resolution of 640 × 640 across all models. Among these, the configurations yielding the highest performance were then tested at an increased resolution of 960 × 960 pixels. This selective approach allowed a targeted exploration of high-resolution performance without the extensive time demands of testing all configurations at 960 × 960. However, for YOLOv8, the availability of the “Auto” optimizer required a more comprehensive examination of potential configurations to enable accurate performance comparisons against other optimizers. Batch sizes were consistently set at 16 for most models, except for YOLOv9 configurations, where a batch size of 8 was used due to computational constraints. Each model configuration was trained for 50 epochs, with the exception of YOLOv9 models, which were trained for 45 epochs.
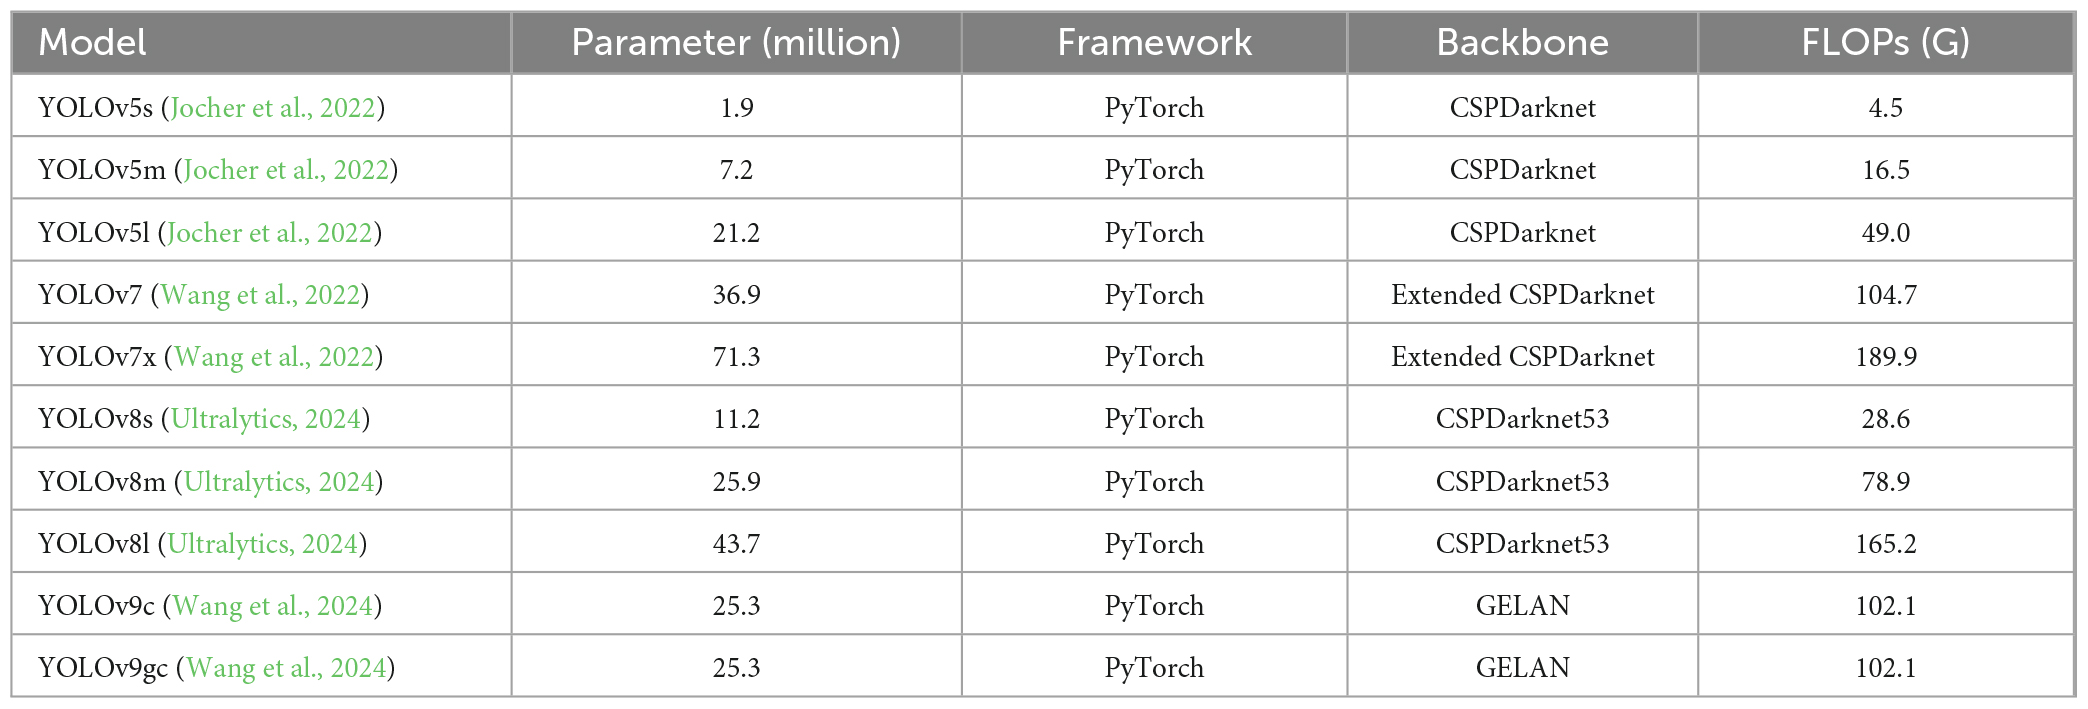
Table 3. General characteristics of YOLO models used in this study.
YOLOv5 (Jocher et al., 2022), developed by Ultralytics in 2020, represents an important evolution in the YOLO series. This new version, based on PyTorch, uses a genetic evolution algorithm and k-means clustering to create the groundbreaking AutoAnchor algorithm, which allows for the structuring of anchor boxes (Terven and Cordova-Esparza, 2023).
Considering the YOLOv5 architecture, it is safe to say that it is built on an enhanced CSPDarknet53 backbone. This backbone includes a stem layer with spatial pyramid pooling fast (SPPF). This stem layer improves computational speed as well as efficiency. The model uses mosaic and mixing (Zhang et al., 2018), techniques to improve training stability as well as performance. YOLOv5 not only meets the needs of many different applications but is also available in different sizes. This scalability, i.e., nano, small, medium, large, and extra-large sizes, is seen as a feature that improves the performance of YOLOv5 in a wide range of object detection missions. In this way, it can be used in resource-constrained environments. Increasing the model size increases the performance in proportion. This shows the compatibility of YOLOv5 in various use cases.
One of the significant innovations in the architecture of YOLOv7 (Wang et al., 2022) is the extended efficient layer aggregation network (E-ELAN). Building on the principles of the original ELAN, E-ELAN enhances the network’s learning capabilities through techniques such as expanding, shuffling, and merging cardinality within computational blocks. This approach maintains the integrity of gradient paths, allowing for effective and stable learning as the network deepens. E-ELAN utilizes group convolution to increase channel capacity, shuffles map features into groups, and merges them, enabling diverse feature extraction while keeping the transition layers unchanged.
Model scaling in YOLOv7 is designed to adjust model attributes to balance inference speed and computational efficiency. Traditional scaling methods, like those used in EfficientNet (Tan and Le, 2020) and scaled-YOLOv4 (Wang et al., 2021), independently adjust width, depth, and resolution. However, for concatenation-based models like YOLOv7, scaling depth affects the input-output channel ratio of subsequent layers, requiring a compound scaling approach. This method simultaneously adjusts both depth and width factors to maintain model efficiency and structural balance. By scaling computational blocks and transition layers in tandem, YOLOv7 ensures optimal performance and hardware utilization across various model sizes. This compound scaling preserves the model’s initial properties, ensuring robust and efficient network performance.
Ultralytics introduced YOLOv8 (Ultralytics, 2024) in 2023, marking a significant advancement in the YOLO series following YOLOv5. YOLOv8 is available in five versions: nano (YOLOv8n), small (YOLOv8s), medium (YOLOv8m), large (YOLOv8l), and extra-large (YOLOv8x). Its architecture builds upon the YOLOv5 backbone with notable enhancements, including the C2f module, which is a cross-stage partial bottleneck featuring dual convolutions. This module enhances detection accuracy by integrating high-level features with contextual data. YOLOv8 adopts an anchor-free approach with a decoupled head that independently processes object detection, classification, and regression tasks, thereby improving overall accuracy through specialized focus on each branch.
In the output layer, YOLOv8 uses a sigmoid activation function for object detection scores and a softmax function for class probabilities, which enhances precision in object detection. The model employs Complete Intersection over Union (CIoU) (Zheng et al., 2020) and distance focal loss (DFL) (Li et al., 2020) for bounding box loss, along with binary cross-entropy for classification loss, significantly boosting performance, especially for smaller objects. Additionally, YOLOv8 introduces the YOLOv8-Seg model for semantic segmentation, utilizing a CSPDarknet53 backbone and the C2f module instead of the traditional YOLO neck. This setup includes two segmentation heads for predicting semantic segmentation masks. The model’s detection heads, comprising five detection modules and a prediction layer, deliver state-of-the-art results across multiple benchmarks, maintaining high speed and efficiency.
YOLOv9 (Wang et al., 2024) represents the second latest iteration in the YOLO series and is an advanced object detection model. Recently introduced, YOLOv9 builds upon its predecessors by incorporating innovative architectural improvements and refined training techniques. Derived from the YOLOv7 architectural framework, the objective of YOLOv9 is to enhance the accuracy of object detection while maintaining real-time inference speeds.
The model architecture is based on a backbone network with an efficient layer aggregation mechanism known as the generalized efficient layer aggregation network (GELAN). This design enables YOLOv9 to achieve superior parameter utilization in comparison to earlier YOLO models, effectively leveraging conventional convolution operators.
The principal innovation introduced by YOLOv9 is the integration of programmable gradient information (PGI), a novel framework that ensures robust gradient propagation and addresses the issue of information loss in deep neural networks. PGI optimizes the training process by providing comprehensive input information for the target task, facilitating better parameter learning and improving overall model performance.
As a consequence of these innovations and improvements, YOLOv9 demonstrably outperforms previous YOLO models in terms of both speed and accuracy. In this study, we evaluated the performance of the YOLOv9 GELAN and the YOLOv9 GELAN-C models (referred to YOLOv9g and YOLOv9gc) on our dataset, both of which yielded effective results compared to other models, especially in challenging scenarios such as overlapping areas of tree crowns.
In the model evaluation stage, we used Precision (1), Recall (2), F1-score (3) (Goutte and Gaussier, 2005), and mean Average Precision (mAP) (4) (Everingham et al., 2010) metrics as follows.
Here, TP, FP, FN, N, and AP represent the total number of true positives, false positives, false negatives, class count, and AP, respectively. Precision measures a model’s ability in accurately pinpointing a specific object from a multitude, thereby enhancing its reliability. Conversely, recall assesses a model’s capacity to correctly identify an individual object irrespective of other elements, thereby augmenting its efficiency (Temenos et al., 2023). The F1-score, which combines the Precision and Recall, provides an overall measure of the model’s accuracy in object detection (Casas et al., 2023). This metric is the harmonic mean of Precision and Recall, which both range between 0 and 1 (Zhao and Li, 2020). The mAP value is also a widely adopted evaluation metric in object detection, assessing the trade-off between Precision and Recall (Casas et al., 2023). It computes the AP for each class and then averages these values across all classes (Casas et al., 2023; Zhu et al., 2020). The value of mAP@0.50:0.95 represents the average of mAP values from IoU of 0.50 to IoU of 0.95 with an increment of 0.05.
Experiments were conducted on Kaggle P100, Colab A100, and NVIDIA Quadro P6000 graphics processing units (GPUs). We conducted an initial experiment in which we tested the impact of different network sizes, such as 416 × 416, 640 × 640, and 960 × 960 pixels on the performance of different YOLO models. The original dataset is comprised 256 × 256 pixels image patches. To accommodate larger network sizes, the aforementioned image patches were resized by stretching them to 640 × 640 pixels, thus aligning them with the input resolution required by the network. This resampling process effectively increases the number of pixels within the patch, thereby enabling the model to process larger input sizes. We observed that the increase in network size improved the model performance. However, the maximum network size that we can use with the available computational power is 960 × 960. Further experiments were, therefore, pursued with the network size of 640 × 640 and 960 × 960 only.
In our problem-specific initial experiments, increasing the batch size did not result in a notable alteration in the performance of the model. Furthermore, due to the considerable number of experiments and computational limitations, the batch size was fixed at 16 for the YOLOv5, YOLOv7, and YOLOv8 models, whereas for YOLOv9, the batch size was set to 8. In the preprocessing stage, three data augmentation techniques were applied: random horizontal flip, rotation between −15° and +15°, and mosaic. These augmentation strategies contributed to improved training outcomes by diversifying the dataset and enhancing model robustness. All experiments were conducted on high-performance GPUs and executed concurrently, resulting in similar durations. The results of the evaluation are presented in Table 4, which depicts the outcomes of experiments conducted without augmentation, and in Table 5, which depicts the outcomes of experiments conducted with augmentation. The tables present the results for Precision, Recall, F1-score, mAP@0.50, mAP@0.50:0.95, and the total time for training (Time) in hours.
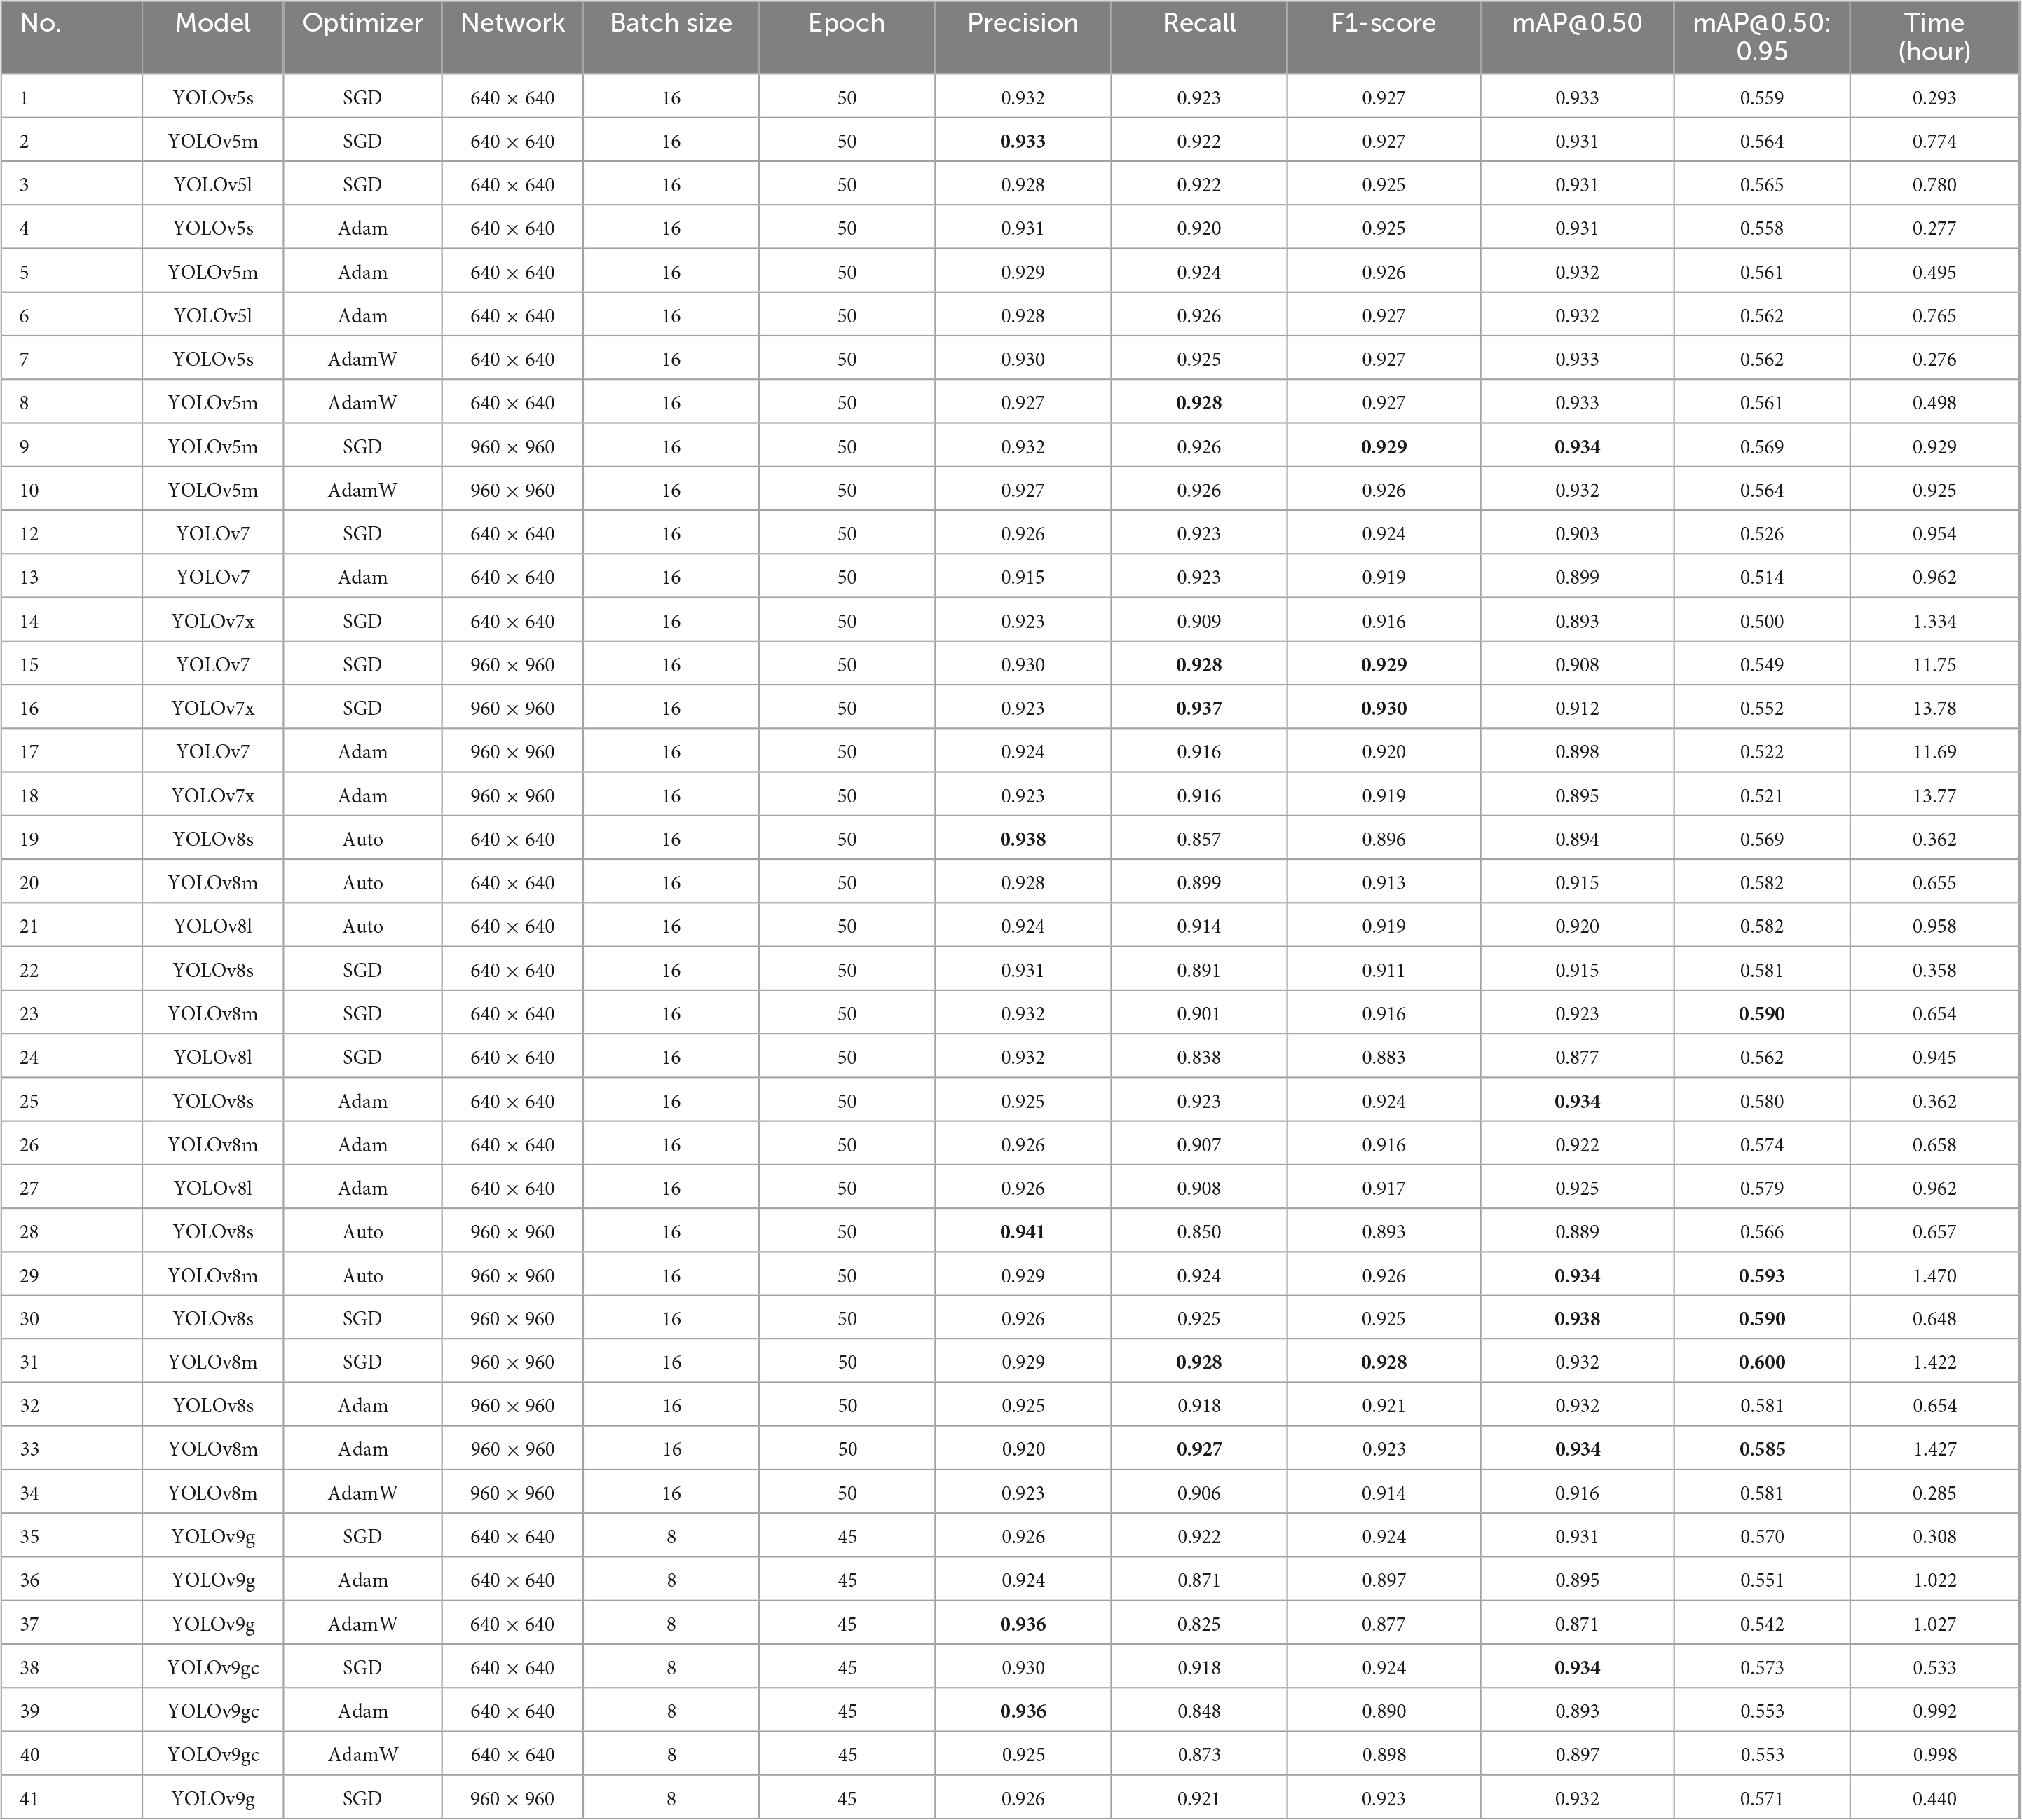
Table 4. Experiment results without augmentation (top five results are shown in bold).
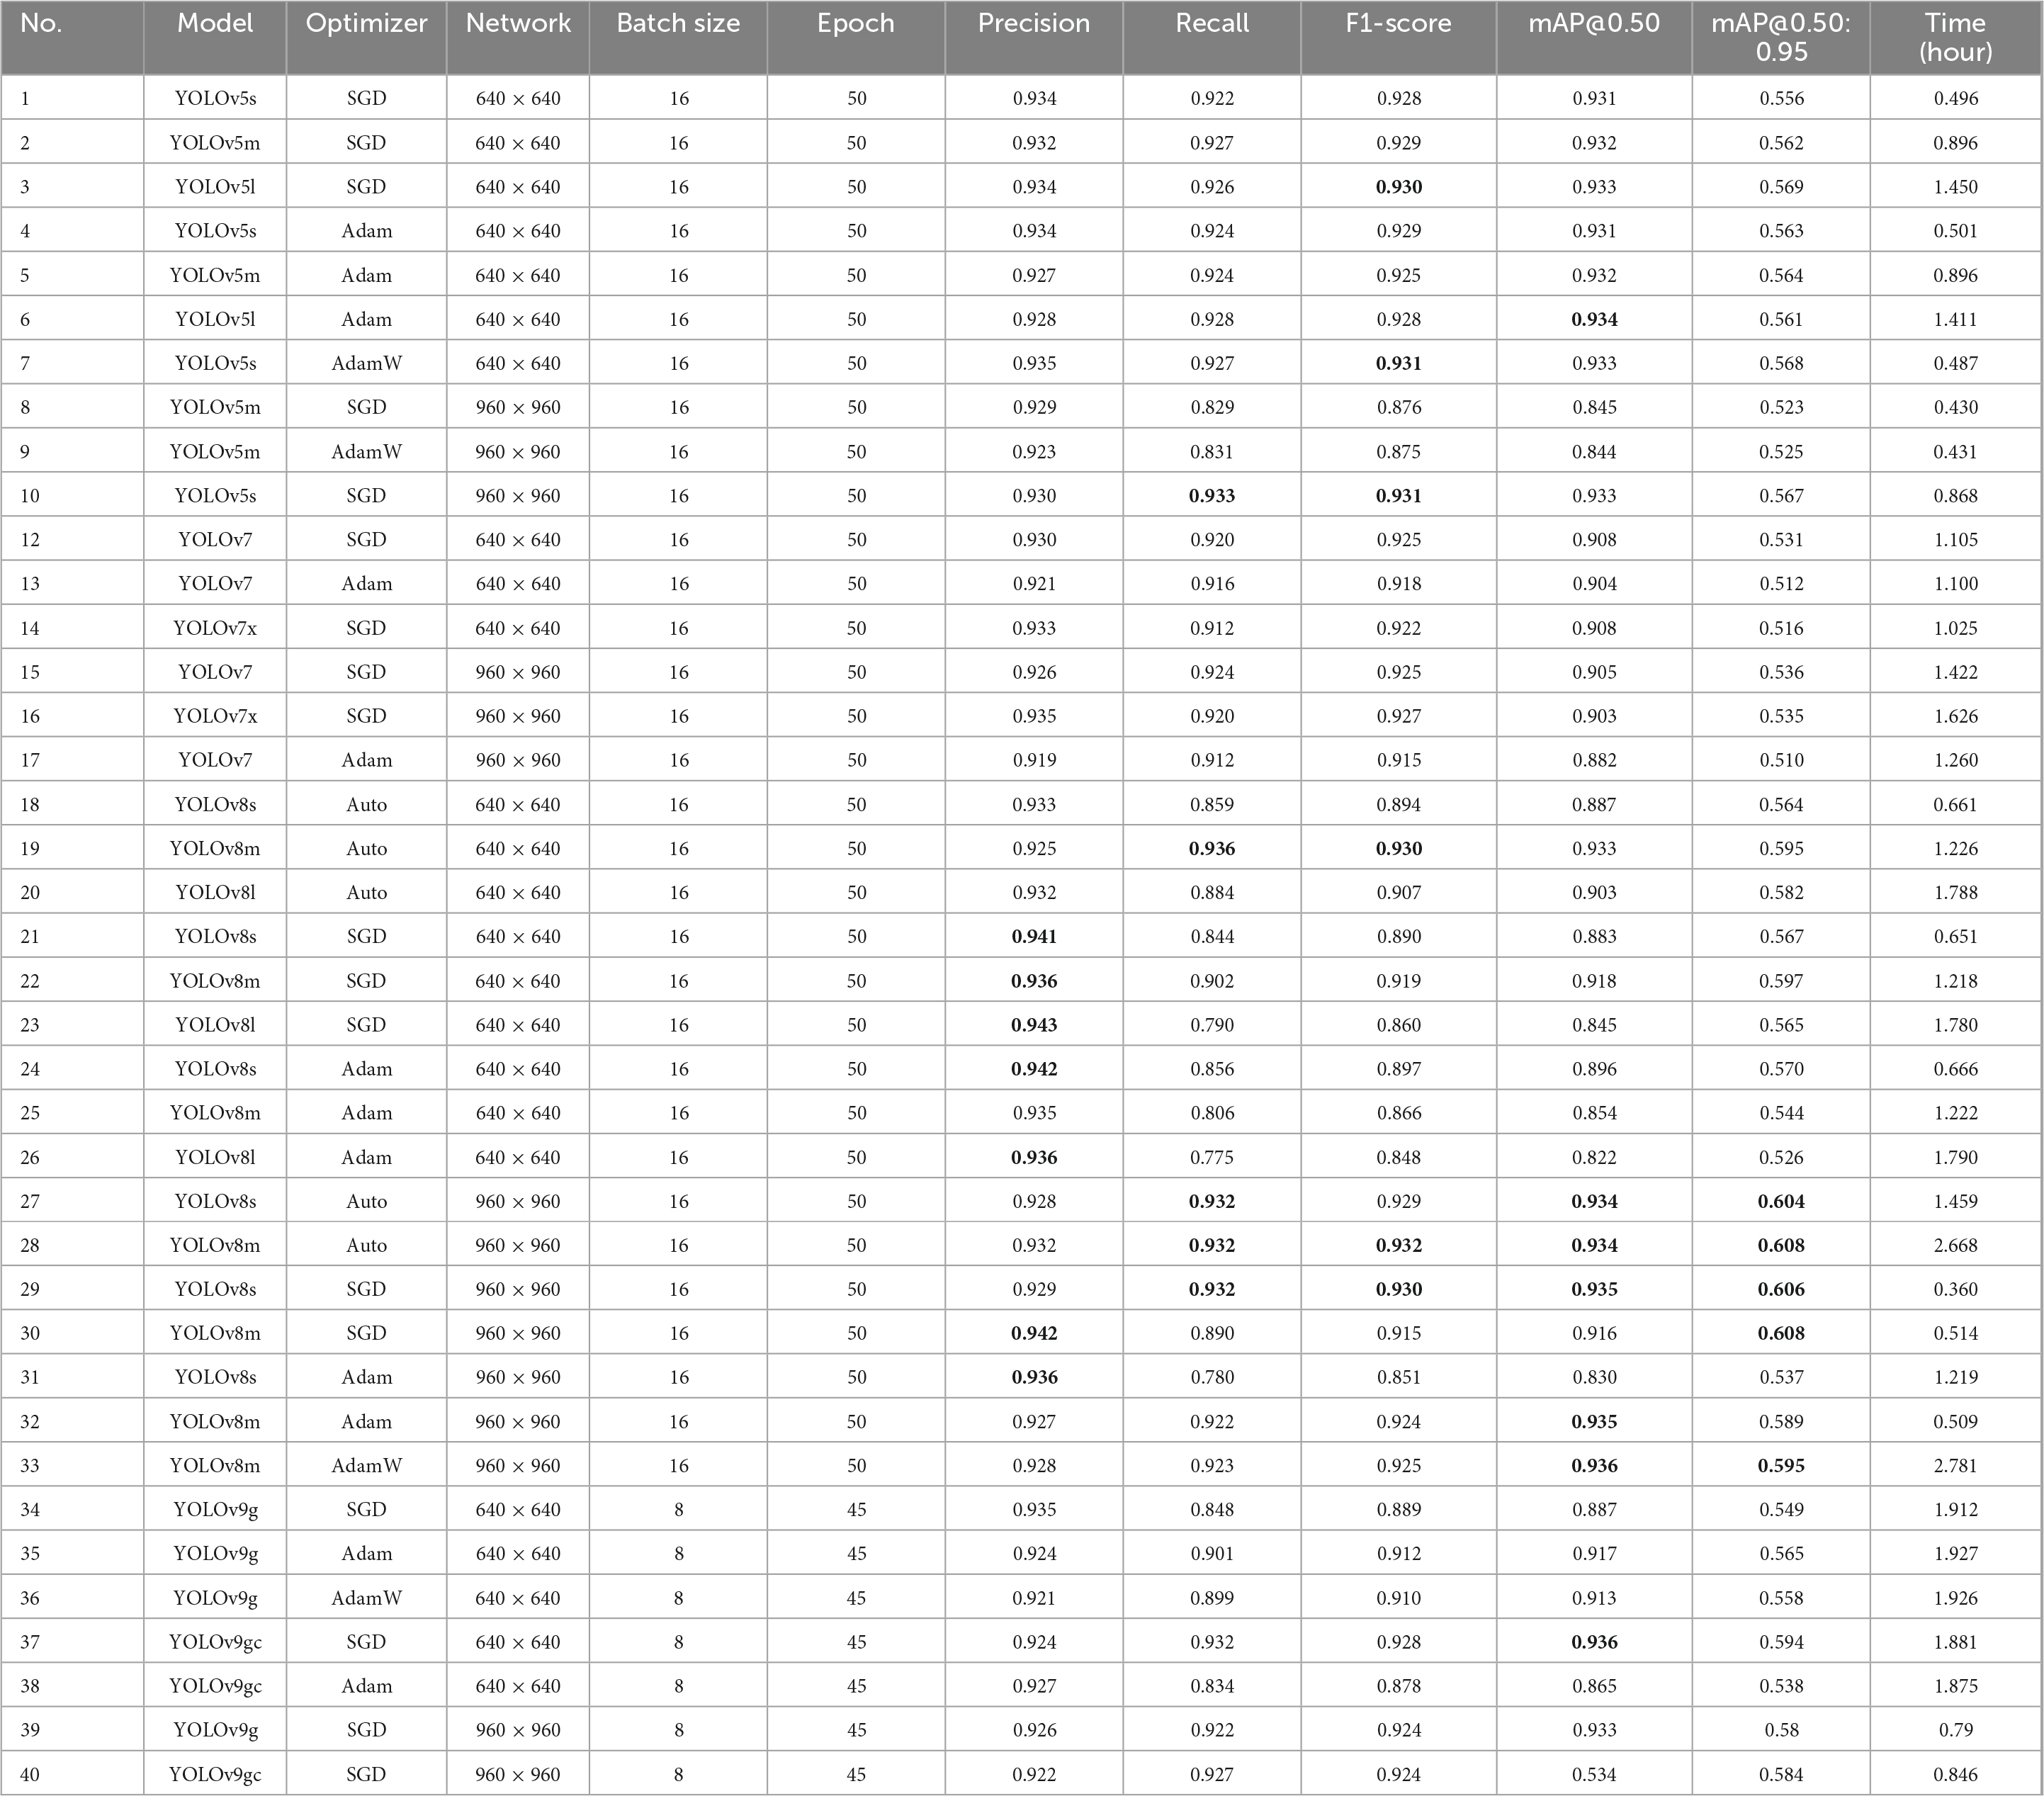
Table 5. Experiment results with augmentation using random horizontal flip, 15° rotation, and mosaic augmentation (top five results are shown in bold).
The experimental results demonstrated that the network size is a critical factor influencing model performance. Models trained with a network size of 960 × 960 generally exhibit higher performance metrics compared to those trained with a network size of 640 × 640. For example, the YOLOv8m model optimized with Auto achieved the highest F1-score of 0.932 and the highest mAP@0.50 of 0.934 with augmentation (Table 5, no. 28). Furthermore, the consistency in high Precision and Recall values across the 960 × 960 network size models is noteworthy. As an illustration, the YOLOv8s model, when optimized with stochastic gradient descent (SGD), exhibits high Precision (0.929) and Recall (0.932), resulting in a high mAP@0.50 IoU of 0.935 (Table 5, no. 29). In contrast, the 640 × 640 network size models, while exhibiting reduced accuracy in certain metrics, nevertheless demonstrate commendable results. The YOLOv8m model with SGD optimization achieves a high F1-score of 0.916 and a mAP@0.50 of 0.923 in the absence of augmentation (Table 4, no. 23). The YOLOv9-GELAN (YOLOv9g) and YOLOv9-GELAN-C (YOLOv9gc) models also demonstrate satisfactory performance, with YOLOv9gc achieving an F1-score of 0.928 and mAP@0.50 of 0.936 (Table 5, no. 37). These findings suggest that, while larger network sizes tend to result in superior overall performance, smaller network sizes can also be highly effective, particularly when optimized correctly.
The selection of an optimizer can have a substantial impact on the performance of a given model. SGD consistently demonstrates superior performance across both network sizes, particularly in the context of YOLOv8 models. The YOLOv8s (640 × 640) and YOLOv8m (960 × 960) models demonstrate high F1-score and mAP values, which serve to reinforce the efficacy of SGD in training these models. Furthermore, YOLOv9gc models optimized with SGD demonstrate comparable performance, as evidenced by the YOLOv9gc (640 × 640) model, which achieved an F1-score of 0.924 and a mAP@0.50 of 0.934 (Table 4, no. 38). The YOLOv9g models with Adam optimizer, however, generally show lower F1-score and mAP values compared to SGD, indicating that Adam may be less optimal for this configuration. Models optimized with Auto and AdamW also show strong results in both network sizes. The YOLOv8m (960 × 960) with Auto achieves high scores across all metrics, while AdamW performs well with YOLOv5 models.
The batch size and the number of epochs are also critical factors. The YOLOv8m (960 × 960) with a batch size of 16 achieves an F1-score of 0.932 and mAP@0.50 of 0.934 (Table 5, no. 28). Increasing the batch size generally improves model performance, but the difference is not substantial beyond batch size 16 for most models. Similarly, models trained for 50 epochs generally perform better compared to those trained for 45 epochs. For example, the YOLOv8m (960 × 960) trained for 50 epochs achieves higher mAP@0.50 (0.934) compared to similar models trained for fewer epochs. This indicates that longer training times can lead to better model performance, although the improvement may plateau beyond a certain point.
In the experiments conducted with the VHRTrees dataset, the accuracy evaluations for each YOLO model across five regions, were analyzed in detail to assess how various terrain and climatic conditions impact model performance. In the Karacabey region, all models consistently achieved precision (P) and recall (R) values above 0.97. YOLOv8 demonstrated the highest mAP@50 (0.992) and mAP@50:95 (0.624), indicating its strong adaptability to the relatively uniform terrain of this region. In contrast, model performance in the Dikili region was significantly lower, likely due to complex terrain or mixed vegetation cover. YOLOv8 outperformed the others in this region, achieving mAP@50 of 0.818 and a mAP@50:95 of 0.535. The challenging environmental conditions in Dikili highlight areas where model optimization or dataset augmentation could improve performance. In the Aliağa region, performance metrics were higher than in Dikili but still demonstrated variability. YOLOv8 showed resilience under moderately challenging conditions, achieving the highest mAP@50 (0.976) and mAP@50:95 (0.73). In Seferihisar, models exhibited stable performance, with precision exceeding 0.93 and recall above 0.94 across all models. However, in the Selçuk region, the metrics resembled those of Dikili, with significant drops in performance. YOLOv5 and YOLOv7 recorded the lowest mAP@50:95 scores (0.471 and 0.502, respectively), while YOLOv8 performed slightly better, achieving a mAP@50:95 of 0.521.
In conclusion, the results of the experiments demonstrate that larger network sizes (960 × 960) generally provide better performance metrics, in some cases the difference is marginal. SGD remains the most consistent optimizer, delivering high Precision, Recall, and mAP values across various models. YOLOv8 models have been observed to exhibit superior performance, when utilizing the 960 × 960 network size and SGD optimization. Nevertheless, the more recent YOLOv9g models demonstrate considerable promise, particularly when optimized with SGD. The optimal configuration for achieving high performance across different models and network sizes appears to be a batch size of 16 and 50 epochs.
In order to facilitate a comparison of the visual performance, consideration was given to the experiment, which represented the highest level of performance for each of the four different YOLO models. Accordingly, our investigation concentrated on four experiments designated as 9 (YOLOv5) and 15 (YOLOv7) in Table 4, and 30 (YOLOv8) and 37 (YOLOv9) in Table 5. Figure 3 illustrates the optimal tree detection results for each the four models. Green boxes represent YOLOv5, purple boxes represent YOLOv7, red boxes represent YOLOv8, and blue boxes represent YOLOv9. Karacabey (A1–A4) is a region with regular and densely spaced trees. This may present a challenge for the models in terms of prediction, but there are certain distinguishing factors present in each image patch (e.g., shadow effect, contrast difference at the borders). Therefore, all four models correctly identified all labeled trees.
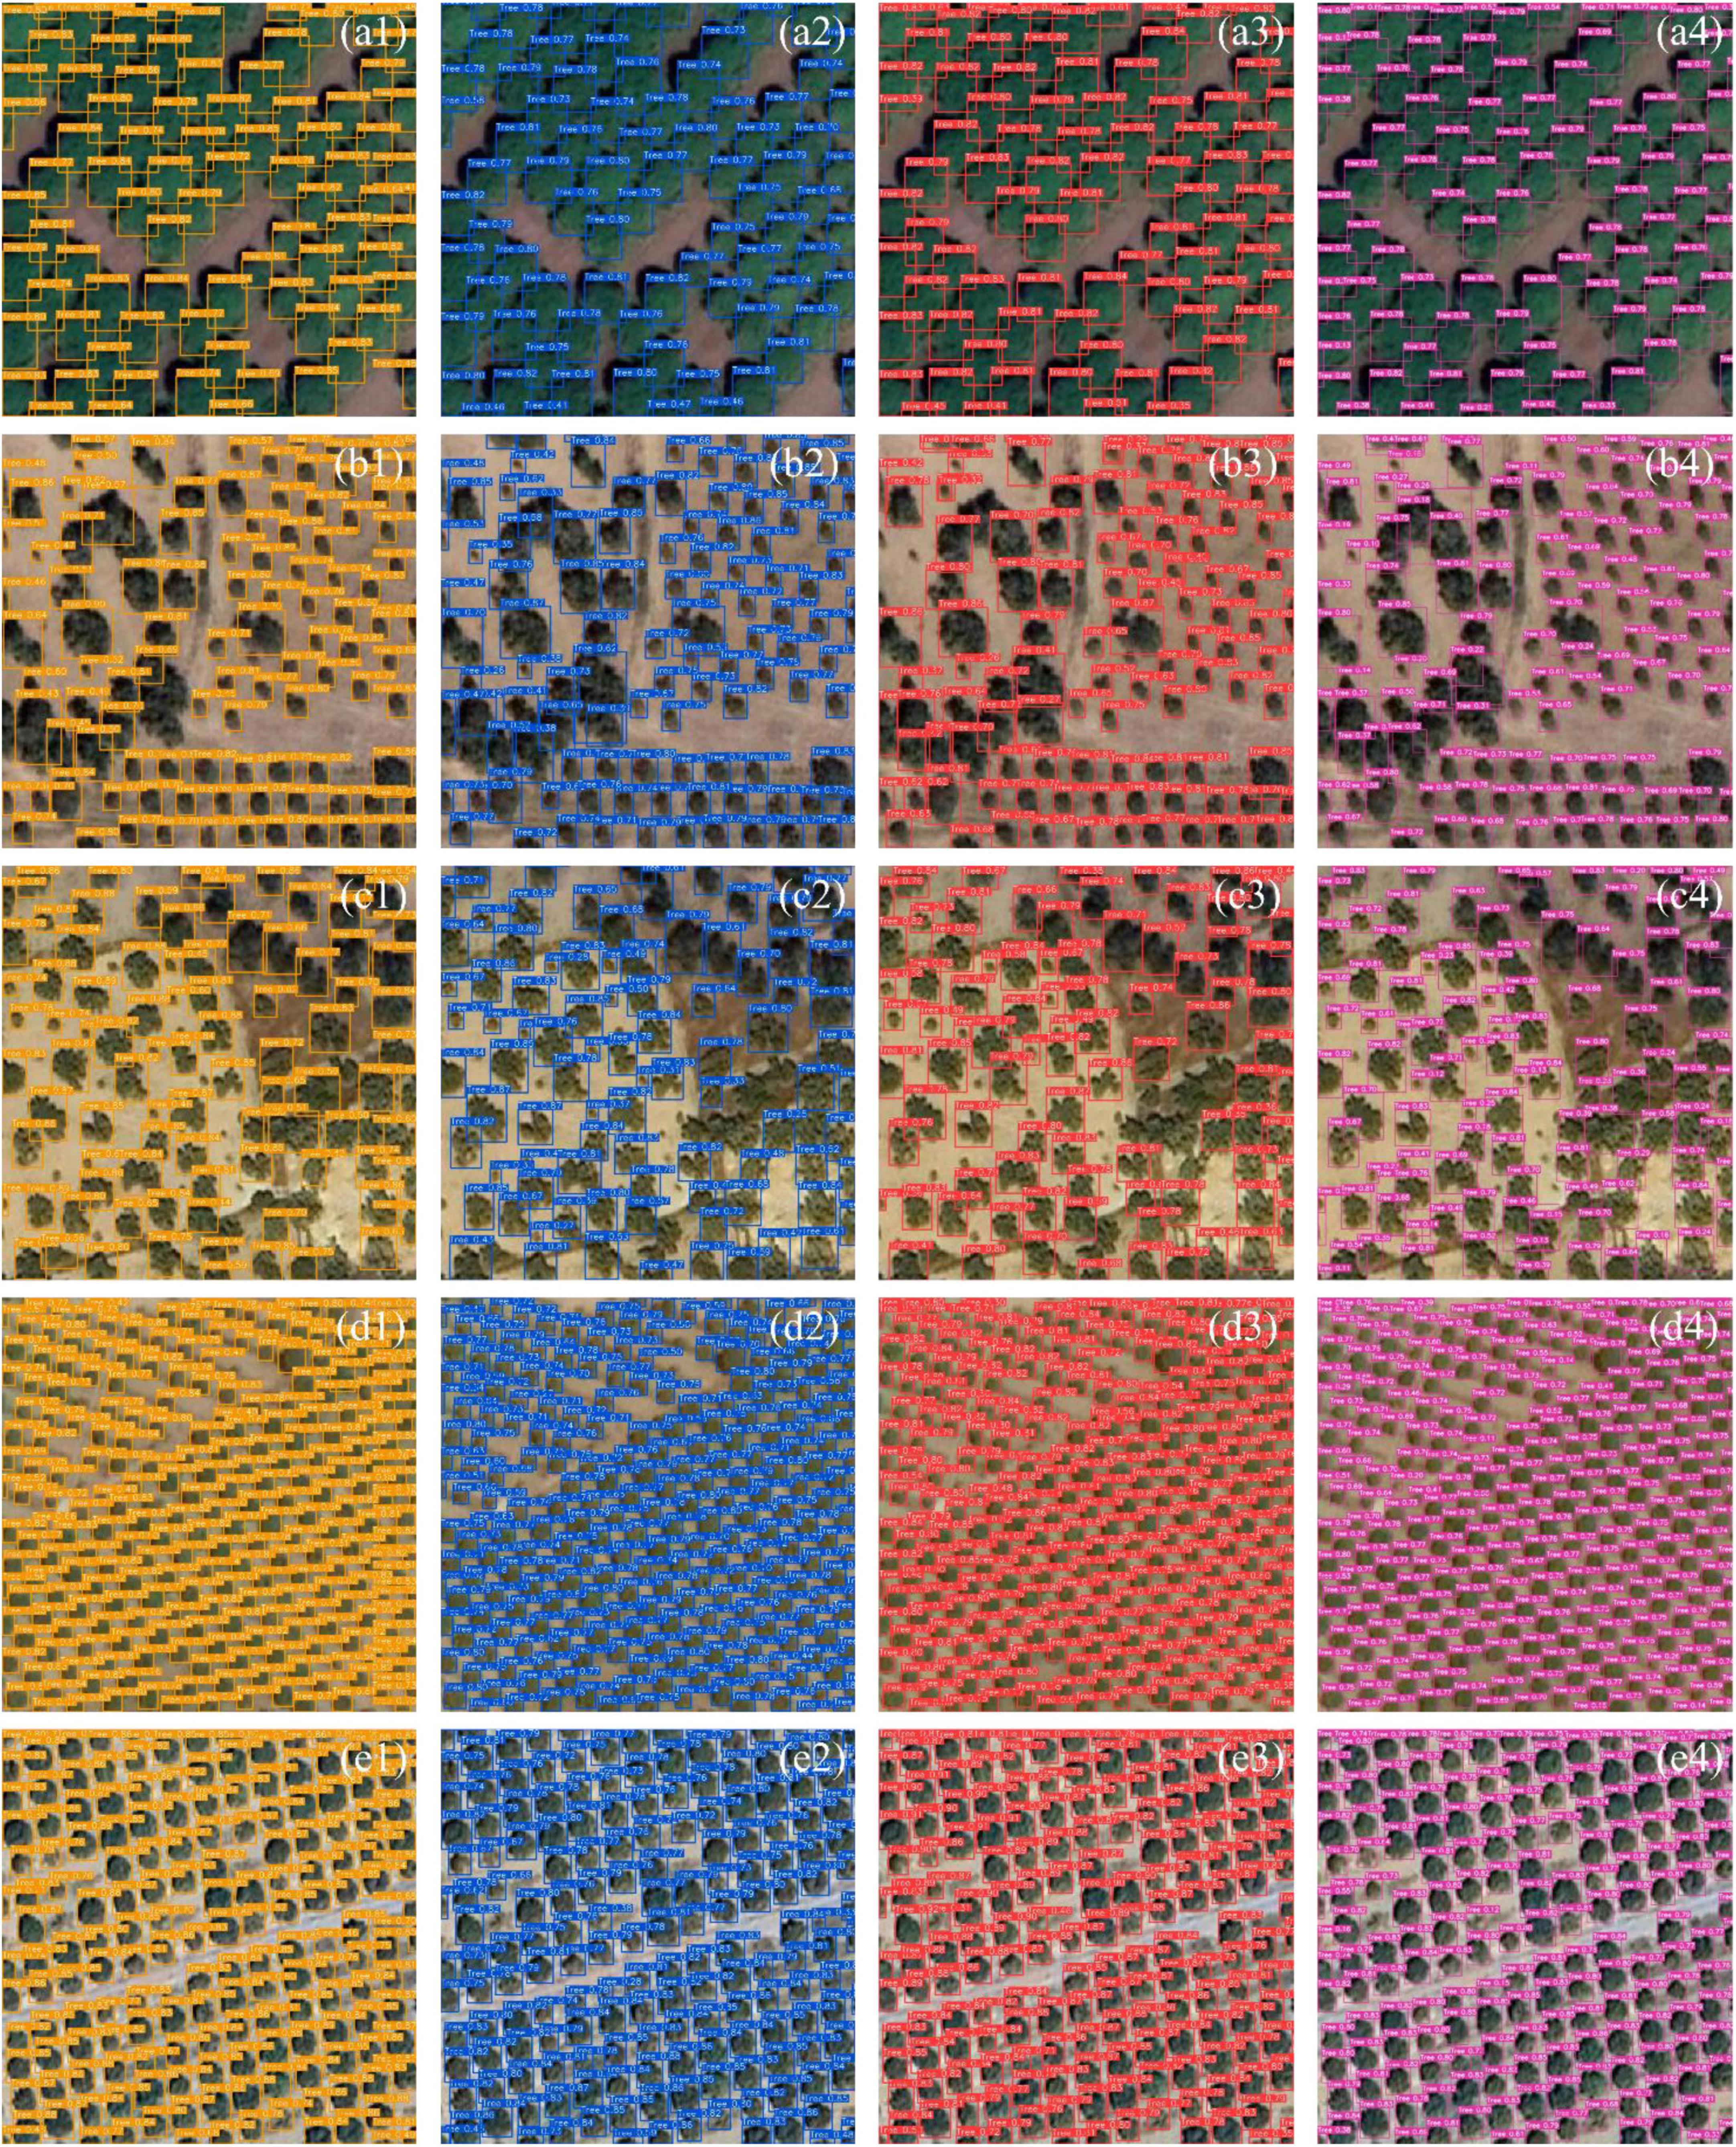
Figure 3. Visual results of Karacabey (A1–A4), Dikili (B1–B4), Aliağa (C1–C4), Seferihisar (D1–D4), and Selçuk (E1–E4) with the four best YOLO results; YOLOv5 (orange), YOLOv7 (blue), YOLOv8 (red), and YOLOv9 (pink).
YOLOv8 provided the highest overall accuracy, followed by YOLOv9, YOLOv7, and YOLOv5, respectively. In Dikili (B1–B4), trees have a somewhat regular and sparse distribution, but this region also contains complex tree clusters. While YOLOv5 and YOLOv8 tend to overlook intermediate trees within complex tree groups, YOLOv7, which has the lowest accuracy compared to the other three models, provided relatively better results by accurately predicting these boundaries. YOLOv9, on the other hand, achieved high accuracy by not ignoring any small trees or complex tree groups. A similar situation is observed in Aliağa (C1–C4). Although the trees here are rarely found in groups, the models yield similar results as in the case with complex tree clusters. Seferihisar (D1–D4) and Selçuk (E1–E4) regions can be evaluated together due to their similar characteristics, i.e., the trees are small, uniform in size, and distributed densely and regularly. However, in Selçuk, the trees are more distinct compared to Seferihisar, which allows the model to achieve higher accuracy in its predictions. In the first example of complex tree community shown in Figures 4A, D, G, I, YOLOv8 demonstrated the best performance by providing generally accurate tree detection with higher precision values. Here, while YOLOv9 labeled every detail as a tree, its accuracy was lower compared to YOLOv7. YOLOv5, on the other hand, missed some trees. In the second example (B, E, H, K), neither YOLOv5 nor YOLOv8 were able to detect the combined trees in the yellow-marked box at the top left, whereas YOLOv7 identified the entire cluster as an individual tree. YOLOv9 managed to separately detect one of the trees. In the same example, in the other yellow-marked box, all models except YOLOv8 identified the paired trees as individual trees, but nevertheless YOLOv8 achieved the highest accuracy among the four models. In the third and final example, although YOLOv8 generally exhibited higher accuracy than the other models, it failed to detect some small trees and, as illustrated here, also misidentified certain small trees.
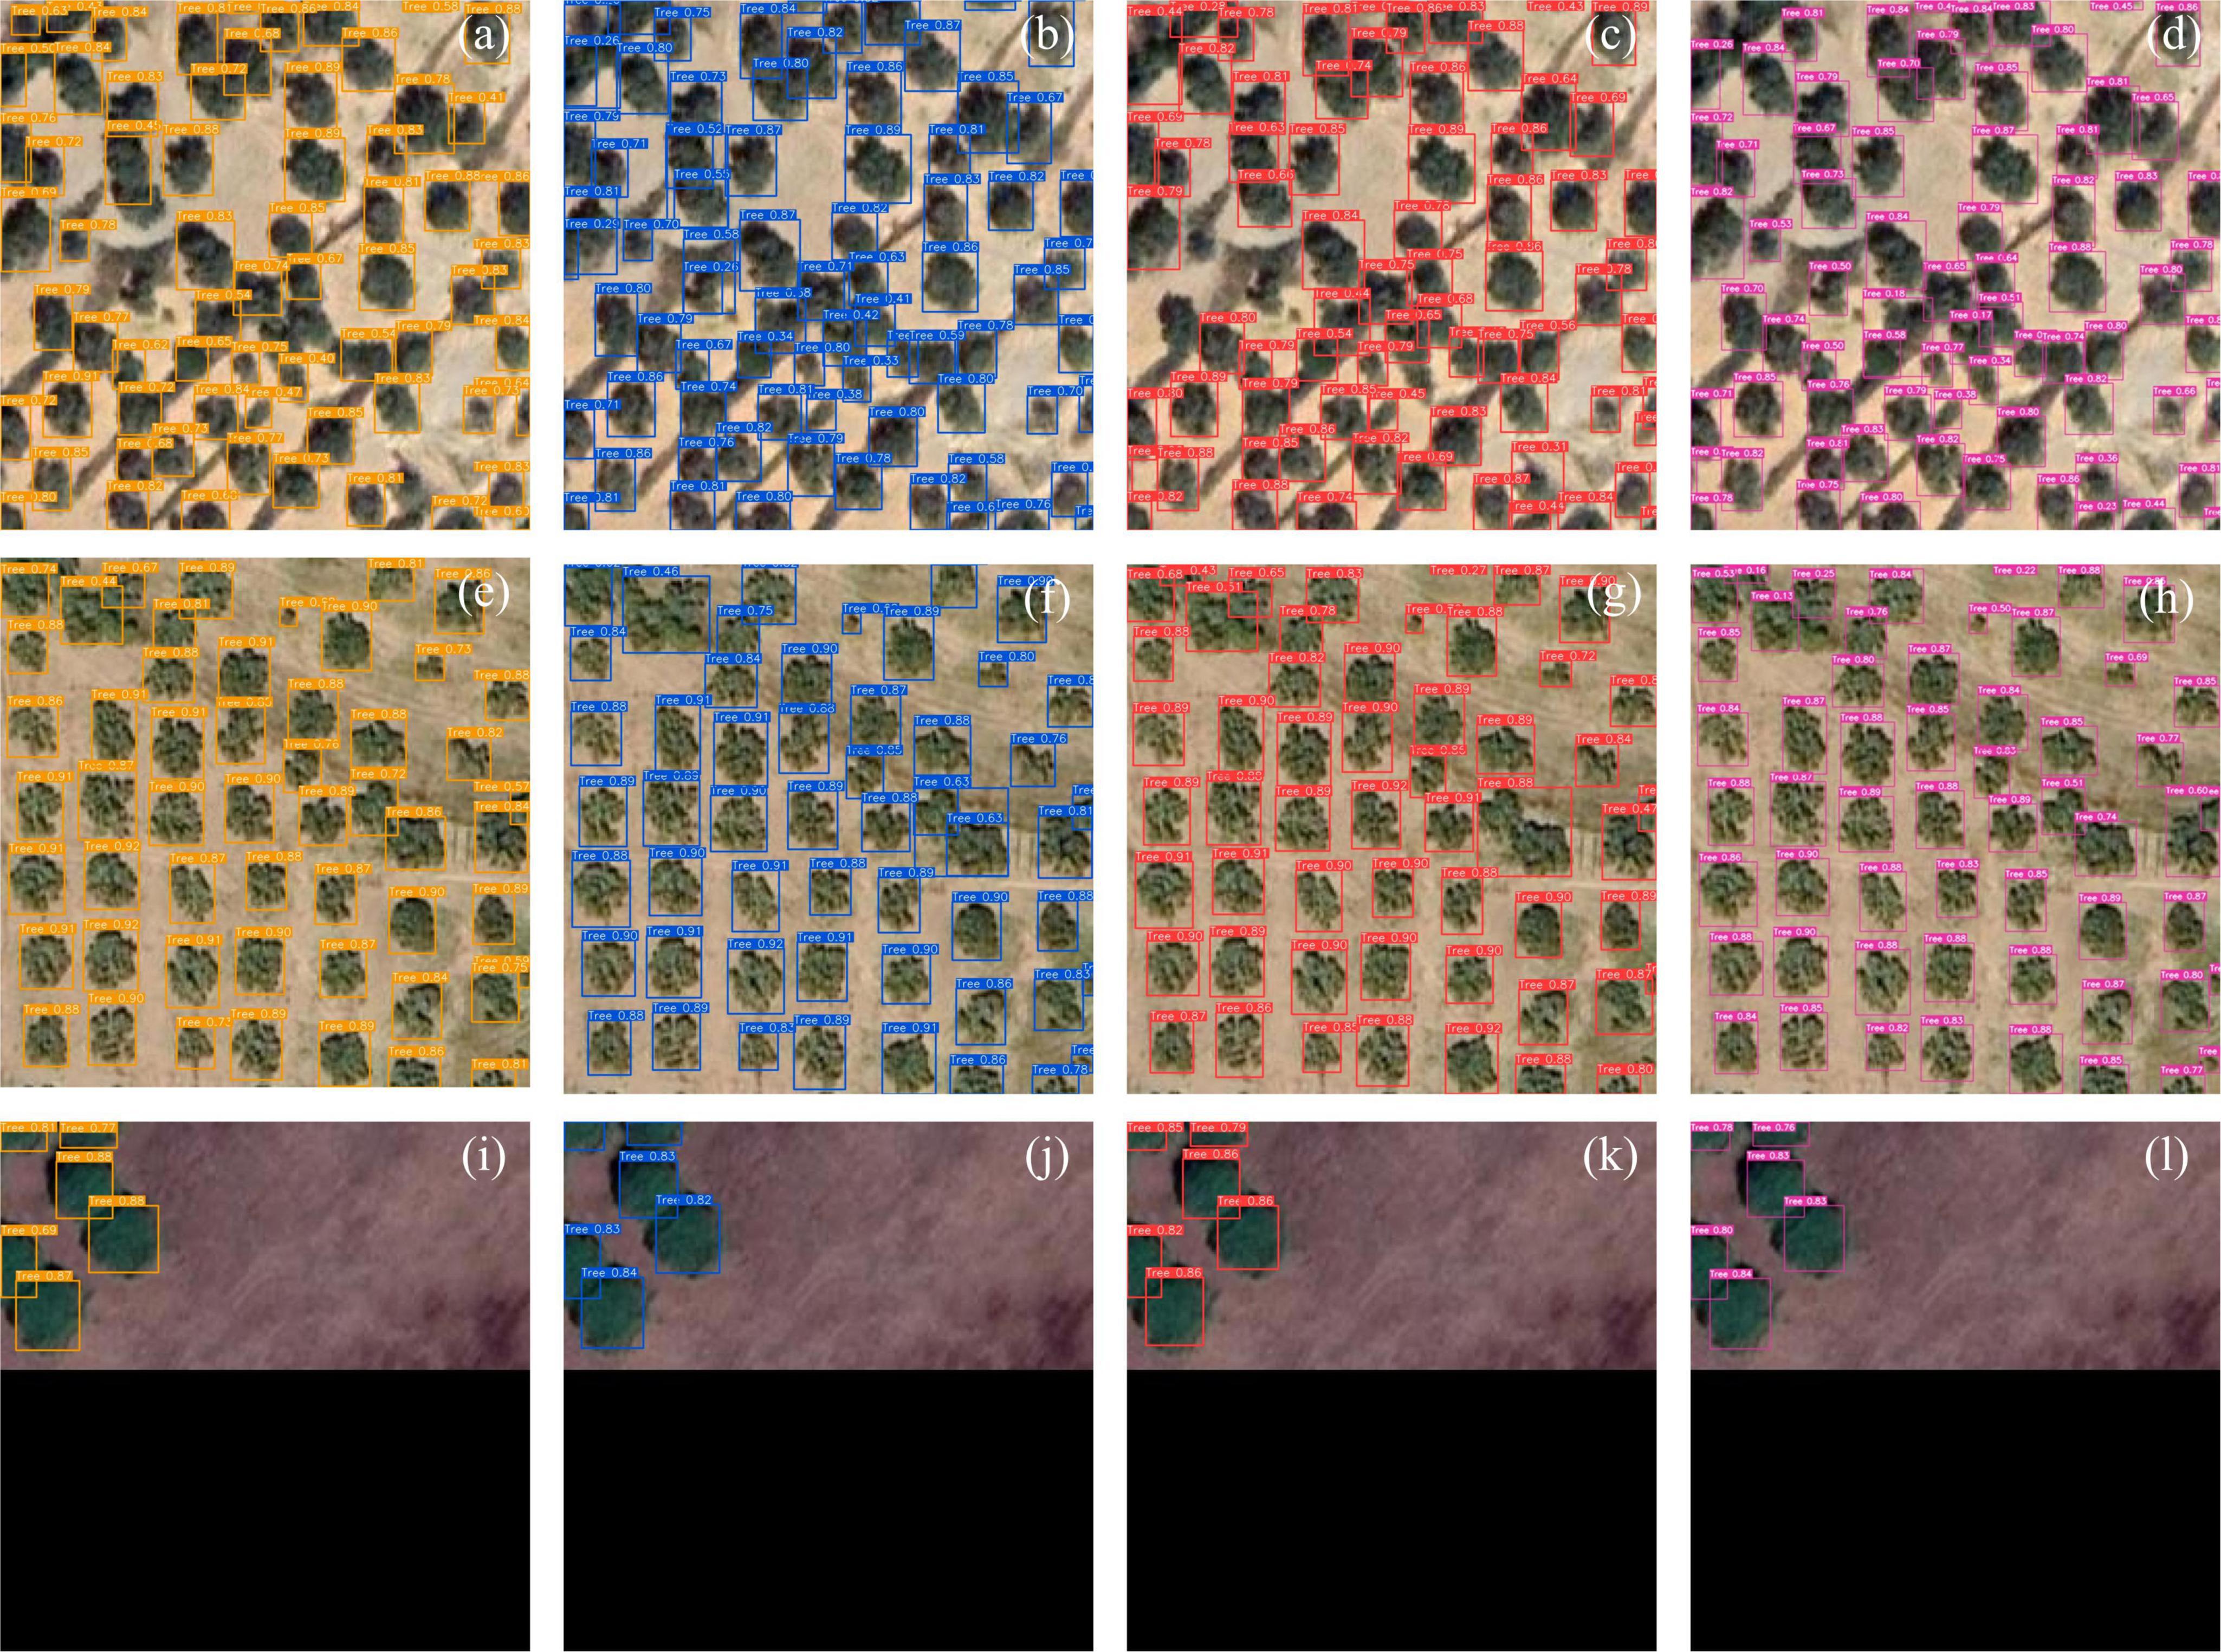
Figure 4. Visual results of Dikili (A–D), Aliağa (E–H), and Karacabey (I–L) regions.
The comparative analysis of YOLOv5, YOLOv7, YOLOv8, and YOLOv9 models for tree detection in Table 6 provides detailed insights into their respective strengths and limitations. For instance, in the (A1–A4) region, characterized by high tree density and large trees, YOLOv8 and YOLO v7 achieved the best balance between precision (0.96) and recall (0.94), demonstrating their capability to accurately detect individual trees while minimizing false positives and false negatives. Similarly, YOLOv5 performed strongly in this region, achieving a comparable precision of 0.95, though its slightly lower recall (0.93) suggests it missed a few tree detections. In the sparsely populated (B1–B4) region, YOLOv7 and YOLOv9 stood out with the highest recall (0.96), effectively capturing most trees despite the dispersed distribution. However, YOLOv9 has lower precision (0.78) indicating an increased number of false positives, which could lead to over-detection in such scenarios. YOLOv5 and YOLOv7 both maintained a better balance, with precision and recall values of around 0.83–0.84 and 0.91–0.96, making them more suitable for areas with sparse vegetation. The (C1–C4) region, with moderate tree density, revealed notable variations. YOLOv7 continued to perform consistently, with precision and recall values of 0.81 and 0.89, respectively. Meanwhile, YOLOv9 showed a significant improvement in recall (0.96), surpassing the other models, but this came at the cost of lower precision (0.74). YOLOv5 and YOLOv8 achieved comparable results, but both exhibited slightly reduced recall, reflecting challenges in detecting certain tree instances in moderately dense environments. Finally, in the uniformly distributed and small trees (D1–D4) region, all models performed exceptionally well, with YOLOv5 and YOLOv7 achieving precision values of 0.96 and 0.95, respectively. YOLOv9 achieved perfect recall (1.00), indicating it successfully detected all trees in this area. However, its precision (0.93) was slightly lower than YOLOv5, reflecting a small number of false positives.
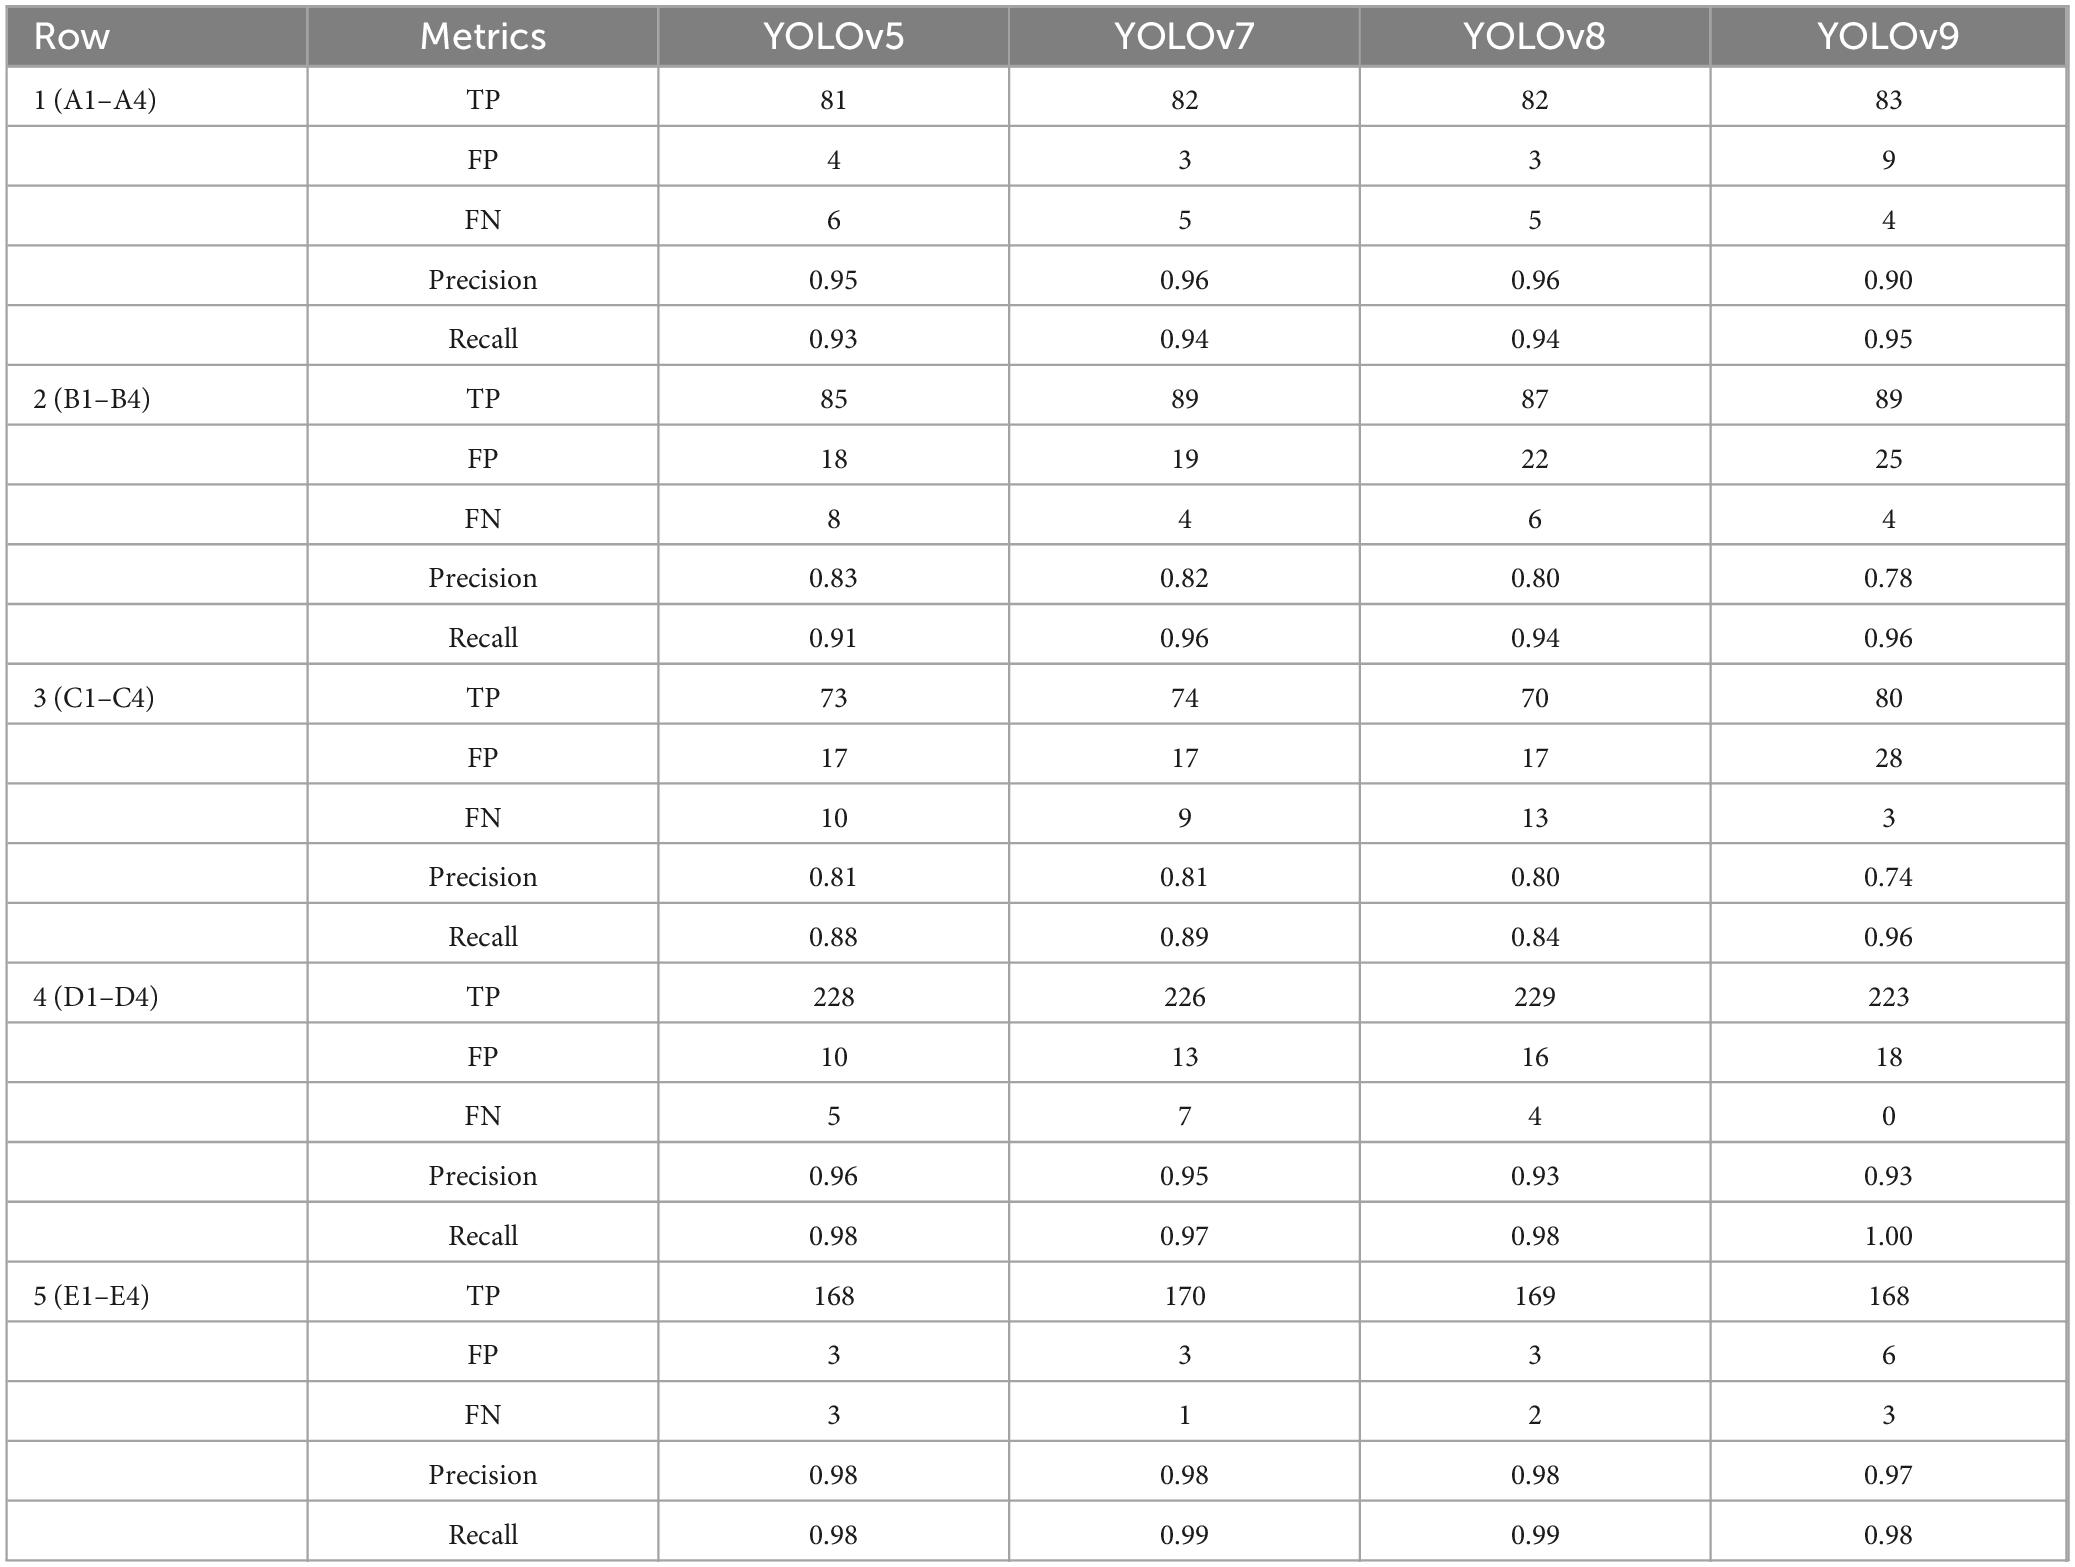
Table 6. Statistical evaluation for different regions.
Overall, the results indicate that YOLOv7 consistently performs well across various scenarios, making it the most versatile choice for tree detection tasks. YOLOv5 offers similar reliability, particularly in uniformly distributed or densely vegetated regions. YOLOv9, with its outstanding recall in most cases, may be better suited for tasks requiring exhaustive detection, although its precision may need refinement to reduce over-detection.
In this study, various YOLO models with different hyperparameter combinations were applied to the newly created VHRTrees dataset to identify the best-performing designs for tree detection. A total of 81 experiments were conducted using the YOLOv5 and YOLOv7–YOLOv9 models with different sizes, network configurations, and optimizers. The experimental results were evaluated using Precision, Recall, F1-Score, mAP@0.50, and mAP@0.50:0.95 metrics. The top five results, shown in Table 5, are from experiments 27, 28, 29, 30, and 37. These results predominantly belong to the YOLOv8 model. To facilitate visual comparison and evaluate performance across different models, the best visual results for each model are shown in Figures 3, 4.
The experimental results highlight the significant impact of data augmentation on the performance of various YOLO models. Augmentation consistently improved Precision, Recall, F1-score, and mAP values across different models and optimizer configurations. This underscores the importance of incorporating data augmentation into the training pipeline to enhance model robustness and accuracy. Different optimization techniques also played a crucial role in model performance. This indicates that the choice of optimizer, along with augmentation strategies, can significantly influence model outcomes. Models with larger network sizes, such as 960 × 960, generally resulted in higher accuracy, but at the cost of increased inference time. This trade-off must be carefully considered, especially in applications requiring real-time processing. However, the substantial improvements in detection metrics with larger networks suggest that the increased computational demand may be justified for applications where accuracy is paramount. Moreover, the results from the YOLOv9gc model with the SGD optimizer and data augmentation demonstrate the model’s adaptability and better performance, achieving the highest F1-score and mAP@0.50:0.95 scores in its series. This finding highlights the potential of the YOLOv9 series in complex detection tasks where augmented data can provide significant performance benefits.
In the literature, numerous tree detection datasets have been documented. These datasets are typically evaluated based on UAV usage, resolution, number of images or patches, and number of trees covering a specific area, as detailed in Table 1. In addition to Table 1 datasets, case studies can be also found in the literature. For example, Liu et al. (2024) is focused on tree detection with species classification using the YOLOv7 model. In terms of mAP@0.50:0.95, they get 0.781. In another example, Durgut and Ünsalan (2024) focused on improving YOLO by using a transformer architecture. They improved the results by 13.1% and got a 0.854 mAP:0.50 score. However, our dataset stands out not only from the documented datasets by also from case studies by incorporating images from different regions with diverse topographic and climatic characteristics and comprises a substantial total of 25,966 tree samples. This extensive variety and volume make our dataset significantly distinct from others. The YOLOv5, YOLOv7, YOLOv8, and YOLOv9 models and their variants with different dimensions were successfully applied to these datasets, achieving a highest mAP@0.50 value of 93.8% (Table 4, no. 30). This dataset enhances detection performance in regions with diverse topographic and climatic characteristics by balancing resolution, image volume, and methodological diversity. The comparison of these datasets reveals several advantages offered by VHRTrees. Firstly, the integration of multiple YOLO versions (YOLOv5, YOLOv7, YOLOv8, and YOLOv9) provides a robust detection framework that can adapt to various detection scenarios and improve overall accuracy. This multi-method approach aligns with the findings in the paper by Casas et al. (2023), which suggest that combining multiple detection algorithms can significantly enhance detection robustness in complex environments. Additionally, the use of high-resolution GE imagery in the VHRTrees dataset allows for more precise detection of diverse tree structures.
In summary, the VHRTrees dataset offers a comprehensive and effective approach to individual tree detection in orchard environments. Its very high resolution, extensive image volume, and integration of multiple sophisticated detection methods make it a superior choice compared to existing datasets. The balanced approach of the VHRTrees dataset not only enhances detection accuracy, but also ensures its applicability across varied orchard environments, making it a valuable resource for precise and reliable tree detection tasks.
This study has demonstrated the efficacy of the YOLOv5, YOLOv7, YOLOv8, and YOLOv9 architectures in markedly enhancing the accuracy of tree detection in diverse environmental contexts, including varying topographic and climatic conditions. Through rigorous experimentation on the VHRTrees dataset, the importance of meticulous model selection and optimization strategies, such as varying network configurations and advanced optimizers like SGD, has been underscored for achieving superior performance metrics. The application of robust data augmentation techniques consistently resulted in improved model robustness and enhanced key detection metrics, thereby underscoring their pivotal role in optimizing overall accuracy. Moreover, the incorporation of high-resolution imagery from a multitude of topographically and climatically diverse regions within the VHRTrees dataset, comprising 25,966 annotated tree samples, constituted a robust platform for the evaluation of multiple YOLO architectures and the assessment of their adaptability across a spectrum of environmental conditions. This dataset not only facilitated insights into the scalability and transferability of these models, but also advanced AI-driven tree detection, species identification, and broader applications in forest management. The incorporation of deep learning methodologies with remote sensing data has illustrated considerable potential across a range of applications. For example, the application of basic RGB digital imagery using advanced deep learning techniques represents a cost-effective solution for the efficient mapping and monitoring of tree and tree species. In the future, research should focus on investigating the scalability and transferability of these models across different geographical regions and diverse datasets. The incorporation of data from additional geographic regions and diverse tree species into existing benchmark datasets would enhance the generalizability of findings and facilitate the development of universally applicable tree detection frameworks.
This study makes a significant contribution to the advancement of AI-driven forest monitoring and management, emphasizing the potential for enhancing environmental sustainability and conservation efforts through innovative technological applications.
The datasets presented in this study can be found in online repositories. The names of the repository/repositories and accession number(s) can be found below: https://github.com/RSandAI/VHRTrees.
ŞT: Conceptualization, Data curation, Formal analysis, Investigation, Methodology, Software, Validation, Visualization, Writing – original draft, Writing – review & editing. ES: Conceptualization, Investigation, Methodology, Project administration, Resources, Supervision, Validation, Writing – original draft, Writing – review & editing. SA: Data curation, Formal analysis, Investigation, Visualization, Writing – original draft, Writing – review & editing. CÜ: Conceptualization, Funding acquisition, Project administration, Resources, Writing – original draft, Writing – review & editing. JF: Conceptualization, Funding acquisition, Project administration, Resources, Writing – original draft, Writing – review & editing.
The author(s) declare financial support was received for the research, authorship, and/or publication of this article. Project ForestMap is supported under the umbrella of ERANET Cofund ForestValue by Swedish Governmental Agency for Innovation Systems, Swedish Energy Agency, The Swedish Research Council for Environment, Agricultural Sciences and Spatial Planning, Academy of Finland, and The Scientific and Technological Research Council of Türkiye (TÜBİTAK). ForestValue has received funding from the European Union’s Horizon 2020 Research and Innovation program under grant agreement No. 773324 and from TÜBİTAK Project No. 221N393.
We would like to thank Istanbul Technical University, Scientific Research Unit (ITU-BAP) for supporting Elif Sertel with the project ID of “FHD-2023-44797.” We acknowledge the assistance of ChatGPT (OpenAI, GPT-4) in proofreading and improving the clarity of this manuscript.
The authors declare that the research was conducted in the absence of any commercial or financial relationships that could be construed as a potential conflict of interest.
All claims expressed in this article are solely those of the authors and do not necessarily represent those of their affiliated organizations, or those of the publisher, the editors and the reviewers. Any product that may be evaluated in this article, or claim that may be made by its manufacturer, is not guaranteed or endorsed by the publisher.
Ahlswede, S., Schulz, C., Gava, C., Helber, P., Bischke, B., Förster, M., et al. (2023). TreeSatAI benchmark archive: A multi-sensor, multi-label dataset for tree species classification in remote sensing. Earth Syst. Sci. Data 15, 681–695. doi: 10.5194/essd-15-681-2023
Aksoy, S., Hasan Al Shwayyat, S. Z., Nur Topgül, Ş, Sertel, E., Ünsalan, C., Salo, J., et al. (2023). “Forest biophysical parameter estimation via machine learning and neural network approaches,” in Proceedings of the IGARSS 2023 - 2023 IEEE International Geoscience and Remote Sensing Symposium, Pasadena, CA, 2661–2664. doi: 10.1109/IGARSS52108.2023.10282899
Bakırman, T., and Sertel, E. (2023). A benchmark dataset for deep learning-based airplane detection: HR planes. Int. J. Eng. Geosci. 8, 212–223. doi: 10.26833/ijeg.1107890
Beloiu, M., Heinzmann, L., Rehush, N., Gessler, A., and Griess, V. C. (2023). Individual tree-crown detection and species identification in heterogeneous forests using aerial RGB imagery and deep learning. Remote Sens. 15:1463. doi: 10.3390/rs15051463
Casas, E., Ramos, L., Bendek, E., and Rivas-Echeverría, F. (2023). Assessing the effectiveness of YOLO architectures for smoke and wildfire detection. IEEE Access 11, 96554–96583. doi: 10.1109/ACCESS.2023.3312217
dos Santos, A. A., Marcato Junior, J., Araújo, M. S., Di Martini, D. R., Tetila, E. C., Siqueira, H. L., et al. (2019). Assessment of CNN-based methods for individual tree detection on images captured by RGB cameras attached to UAVs. Sensors 19:3595. doi: 10.3390/s19163595
Durgut, O., and Ünsalan, C. (2024). “A Swin transformer, YOLO, and weighted boxes fusion-based approach for tree detection in satellite images,” in Proceedings of the 2024 32nd signal processing and communications applications conference (SIU), (Mersin: IEEE), 1–4. doi: 10.1109/SIU61531.2024.10601134
Estrada, J. S., Fuentes, A., Reszka, P., and Auat Cheein, F. (2023). Machine learning assisted remote forestry health assessment: A comprehensive state of the art review. Front. Plant Sci. 14:1139232. doi: 10.3389/fpls.2023.1139232
Everingham, M., Van Gool, L., Williams, C. K. I., Winn, J., and Zisserman, A. (2010). The Pascal visual object classes (VOC) challenge. Int. J. Comput. Vis. 88, 303–338. doi: 10.1007/s11263-009-0275-4
Goutte, C., and Gaussier, E. (2005). “A probabilistic interpretation of precision, recall and F-score, with implication for evaluation,” in Advances in information retrieval, eds D. E. Losada and J. M. Fernández-Luna (Heidelberg: Springer), 345–359. doi: 10.1007/978-3-540-31865-1_25
Jintasuttisak, T., Edirisinghe, E., and Elbattay, A. (2022). Deep neural network based date palm tree detection in drone imagery. Comput. Electron Agric. 192:106560. doi: 10.1016/j.compag.2021.106560
Jocher, G., Chaurasia, A., Stoken, A., Borovec, J., Kwon, Y., Michael, K., et al. (2022). ultralytics/yolov5: v7.0 - YOLOv5 SOTA Realtime Instance Segmentation (v7.0). Zenodo. doi: 10.5281/zenodo.7347926
Kızılkaya, S., Alganci, U., and Sertel, E. (2022). VHRShips: An extensive benchmark dataset for scalable deep learning-based ship detection applications. ISPRS Int. J. Geo-Inf. 11:445. doi: 10.3390/ijgi11080445
Lau, S. L., Lew, J., Ho, C. C., and Su, S. (2021). “Exploratory investigation on a naive pseudo-labelling technique for liquid droplet images detection using semi-supervised learning,” in Proceedings of the 2021 IEEE international conference on computing (ICOCO), 353–359. doi: 10.1109/ICOCO53166.2021.9673553
Li, X., Wang, W., Wu, L., Chen, S., Hu, X., Li, J., et al. (2020). Generalized focal loss: Learning qualified and distributed bounding boxes for dense object detection. Available online at: http://arxiv.org/abs/2006.04388 (accessed May 31, 2024).
Liu, Y., Zhao, Q., Wang, X., Sheng, Y., Tian, W., and Ren, Y. (2024). A tree species classification model based on improved YOLOv7 for shelterbelts. Front. Plant Sci. 14:1265025. doi: 10.3389/fpls.2023.1265025
Ocer, N. E., Kaplan, G., Erdem, F., Kucuk Matci, D., and Avdan, U. (2020). Tree Extraction from Multi-scale UAV images using mask R-CNN with FPN. Remote Sens. Lett. 11, 847–856. doi: 10.1080/2150704X.2020.1784491
Pordel, M., and Hellström, T. (2015). Semi-automatic image labelling using depth information. Computers 4, 142–154. doi: 10.3390/computers4020142
Reiersen, G., Dao, D., Lütjens, B., Klemmer, K., Amara, K., Steinegger, A., et al. (2022). ReforesTree: A dataset for estimating tropical forest carbon stock with deep learning and aerial imagery. Available online at: http://arxiv.org/abs/2201.11192 (accessed March 16, 2024).
Safonova, A., Hamad, Y., Alekhina, A., and Kaplun, D. (2022). Detection of Norway Spruce Trees (Picea Abies) infested by bark beetle in UAV images using YOLOs architectures. IEEE Access 10, 10384–10392. doi: 10.1109/ACCESS.2022.3144433
Sivanandam, P., and Lucieer, A. (2022). Tree detection and species classification in a mixed species forest using unoccupied aircraft system (UAS) RGB and multispectral imagery. Remote Sens. 14:4963. doi: 10.3390/rs14194963
Sun, C., Huang, C., Zhang, H., Chen, B., An, F., Wang, L., et al. (2022). Individual tree crown segmentation and crown width extraction from a heightmap derived from aerial laser scanning data using a deep learning framework. Front. Plant Sci. 13:914974. doi: 10.3389/fpls.2022.914974
Tan, M., and Le, Q. V. (2020). EfficientNet: Rethinking model scaling for convolutional neural networks. Available online at: http://arxiv.org/abs/1905.11946 (accessed May 31, 2024).
Temenos, A., Temenos, N., Kaselimi, M., Doulamis, A., and Doulamis, N. (2023). Interpretable deep learning framework for land use and land cover classification in remote sensing using SHAP. IEEE Geosci. Remote Sens. Lett. 20, 1–5. doi: 10.1109/LGRS.2023.3251652
Terven, J., and Cordova-Esparza, D. A. (2023). Comprehensive review of YOLO architectures in computer vision: From YOLOv1 to YOLOv8 and YOLO-NAS. Mach Learn Knowl Extr 5, 1680–1716. doi: 10.3390/make5040083
Trimble (2024). Trimble eCognition | Office Software. Available online at: https://geospatial.trimble.com/products/software/trimble-ecognition (accessed May 30, 2024).
Ultralytics (2024). ultralytics/ultralytics: NEW - YOLOv8  in PyTorch > ONNX > OpenVINO > CoreML > TFLite. GitHub. Available online at: https://github.com/ultralytics/ultralytics (accessed April 5, 2024).
Wang, C.-Y., Bochkovskiy, A., and Liao, H.-Y. M. (2021). Scaled-YOLOv4: Scaling cross stage partial network. Available online at: http://arxiv.org/abs/2011.08036 (accessed May 31, 2024).
Wang, C.-Y., Bochkovskiy, A., and Liao, H.-Y. M. (2022). YOLOv7: Trainable bag-of-freebies sets new state-of-the-art for real-time object detectors. Available online at: http://arxiv.org/abs/2207.02696 (accessed May 23, 2024).
Wang, C.-Y., Yeh, I.-H., and Liao, H.-Y. M. (2024). YOLOv9: Learning what you want to learn using programmable gradient information. Available online at: http://arxiv.org/abs/2402.13616 (accessed May 23, 2024).
Weinstein, B. G., Marconi, S., Bohlman, S., Zare, A., and White, E. (2019). Individual tree-crown detection in RGB imagery using semi-supervised deep learning neural networks. Remote Sens. 11:1309. doi: 10.3390/rs11111309
Zamboni, P., Junior, J. M., de Silva, J. A., Miyoshi, G. T., Matsubara, E. T., Nogueira, K., et al. (2021). Benchmarking anchor-based and anchor-free state-of-the-art deep learning methods for individual tree detection in RGB high-resolution images. Remote Sens. 13:2482. doi: 10.3390/rs13132482
Zhang, C., Zhou, J., Wang, H., Tan, T., Cui, M., Huang, Z., et al. (2022). Multi-species individual tree segmentation and identification based on improved mask R-CNN and UAV imagery in mixed forests. Remote Sens. 14:874. doi: 10.3390/rs14040874
Zhang, H., Cisse, M., Dauphin, Y. N., and Lopez-Paz, D. (2018). mixup: Beyond empirical risk minimization. Available online at: http://arxiv.org/abs/1710.09412 (accessed May 23, 2024).
Zhao, L., and Li, S. (2020). Object detection algorithm based on improved YOLOv3. Electronics 9:537. doi: 10.3390/electronics9030537
Zheng, Y., and Wu, G. (2022). YOLOv4-lite–based urban plantation tree detection and positioning with high-resolution remote sensing imagery. Front. Environ. Sci. 9:756227. doi: 10.3389/fenvs.2021.756227
Zheng, Z., Wang, P., Liu, W., Li, J., Ye, R., and Ren, D. (2020). Distance-IoU loss: Faster and better learning for bounding box regression. Proc. AAAI Conf. Artif. Intell. 34, 12993–13000. doi: 10.1609/aaai.v34i07.6999
Keywords: artificial intelligence, deep learning, Google Earth imagery, forest management, optical satellite data, tree detection, VHRTrees, YOLO
Citation: Topgül ŞN, Sertel E, Aksoy S, Ünsalan C and Fransson JES (2025) VHRTrees: a new benchmark dataset for tree detection in satellite imagery and performance evaluation with YOLO-based models. Front. For. Glob. Change 7:1495544. doi: 10.3389/ffgc.2024.1495544
Received: 12 September 2024; Accepted: 19 December 2024;
Published: 06 January 2025.
Edited by:
Wenjuan Shen, Nanjing Forestry University, ChinaReviewed by:
Zhenbang Hao, Zhangzhou Institute of Technology, ChinaCopyright © 2025 Topgül, Sertel, Aksoy, Ünsalan and Fransson. This is an open-access article distributed under the terms of the Creative Commons Attribution License (CC BY). The use, distribution or reproduction in other forums is permitted, provided the original author(s) and the copyright owner(s) are credited and that the original publication in this journal is cited, in accordance with accepted academic practice. No use, distribution or reproduction is permitted which does not comply with these terms.
*Correspondence: Elif Sertel, c2VydGVsZUBpdHUuZWR1LnRy; Johan E. S. Fransson, am9oYW4uZnJhbnNzb25AbG51LnNl
Disclaimer: All claims expressed in this article are solely those of the authors and do not necessarily represent those of their affiliated organizations, or those of the publisher, the editors and the reviewers. Any product that may be evaluated in this article or claim that may be made by its manufacturer is not guaranteed or endorsed by the publisher.
Research integrity at Frontiers
Learn more about the work of our research integrity team to safeguard the quality of each article we publish.