- 1Yinshanbeilu Grassland Eco-hydrology National Observation and Research Station, China institute of Water Resources and Hydropower Research, Beijing, China
- 2Institute of Water Resources for Pastoral Area, Ministry of Water Resources, Hohhot, Inner Mongolia, China
- 3School of Public Managment Inner Mongolia University, Hohhot, Inner Mongolia, China
- 4Inner Mongolia Business and Trade Vocational College, Hohhot, Inner Mongolia, China
- 5Inner Mongolia Autonomous Region Ecological and Agrometeorological Center, Hohhot, Inner Mongolia, China
Soil moisture is a critical factor for vegetation restoration in arid regions. Poorly planned artificial sand-fixing vegetation systems often exacerbate soil moisture depletion, leading to further degradation. In this study, soil moisture content at various depths was continuously monitored from June to October 2023 in four key community plots—Corethrodendron scoparium, Calligonum mongolicum, and Artemisia ordosica, and bare sand—in a 31-year-old revegetated area located on the northeastern edge of the Tengger Desert. We analyzed the distribution and dynamic changes of soil moisture across the different and evaluated its temporal stability. The representative soil moisture depth was determined by using the coefficient of determination (R2) and the Nash-Sutcliffe efficiency (NSE). The results showed significant differences in soil moisture among the four plots. The bare sand plot had the highest soil water storage in the 0-200 cm layer, at 46.37 mm. In contrast, the Corethrodendron scoparium, Calligonum mongolicum, and Artemisia ordosicaa plots had similar soil water storage values ranging from 33.50 to 33.67 mm, indicating that vegetation restoration has increased soil moisture absorption by an average of 27.4%. Analysis using relative difference and Spearman rank correlation methods revealed varying levels of temporal stability in soil moisture across different soil depths and plots. The Corethrodendron scoparium and bare sand plots showed higher temporal stability compared to the Calligonum mongolicum and Artemisia ordosica plots. The representative depths of temporal stability for the four plots were determined to be 100 cm, 150 cm, 20 cm, and 100 cm, respectively.
1 Introduction
Soil moisture is the primary water source for plants in arid regions (Yao et al., 2023) and plays a critical role in the soil-vegetation-atmosphere system, as well as in hydrological, ecological, and biological processes (Liang et al., 2022; Luca et al., 1985). It is a key limiting factor in sustaining ecosystems in arid and semi-arid regions, directly influencing the carrying capacity of artificial sand-fixing vegetation systems and shaping the composition, distribution, and dynamics of regional vegetation. However, due to the challenges and costs associated with soil moisture sampling, studying spatiotemporal changes in soil moisture—particularly in natural desert environments—is difficult. Time stability analysis (Vachaud et al., 1985) is a statistical method used to describe the persistence of spatial patterns and behaviors of soil moisture over time. Soil moisture tends to exhibit spatial stability (Zhao et al., 2020), meaning certain measurement points can reliably represent the average moisture content of a region at any given time. This concept allows researchers to assess soil moisture using fewer of observation points, reducing the time and labor required compared to random sampling across numerous points (Xu et al., 2017). The study of soil moisture temporal stability has gained significant attention, with the concept being validated across various spatial scales (e.g., slope, watershed, field, and landscape) (Edivan et al., 2011; Jia et al., 2013), land use types (pasture, grassland, farmland, shrubland, and forest) (Wang et al., 2015; Zucco et al., 2014), topographic conditions (undulating terrain, gentle slopes, and complex landscapes) (Gao et al., 2019; Sur et al., 2013; Bai et al., 2021), and climatic zones (semi-arid, semi-humid, and humid regions) (Wang et al., 2013; Zhang and Shao, 2013; Xu et al., 2021).
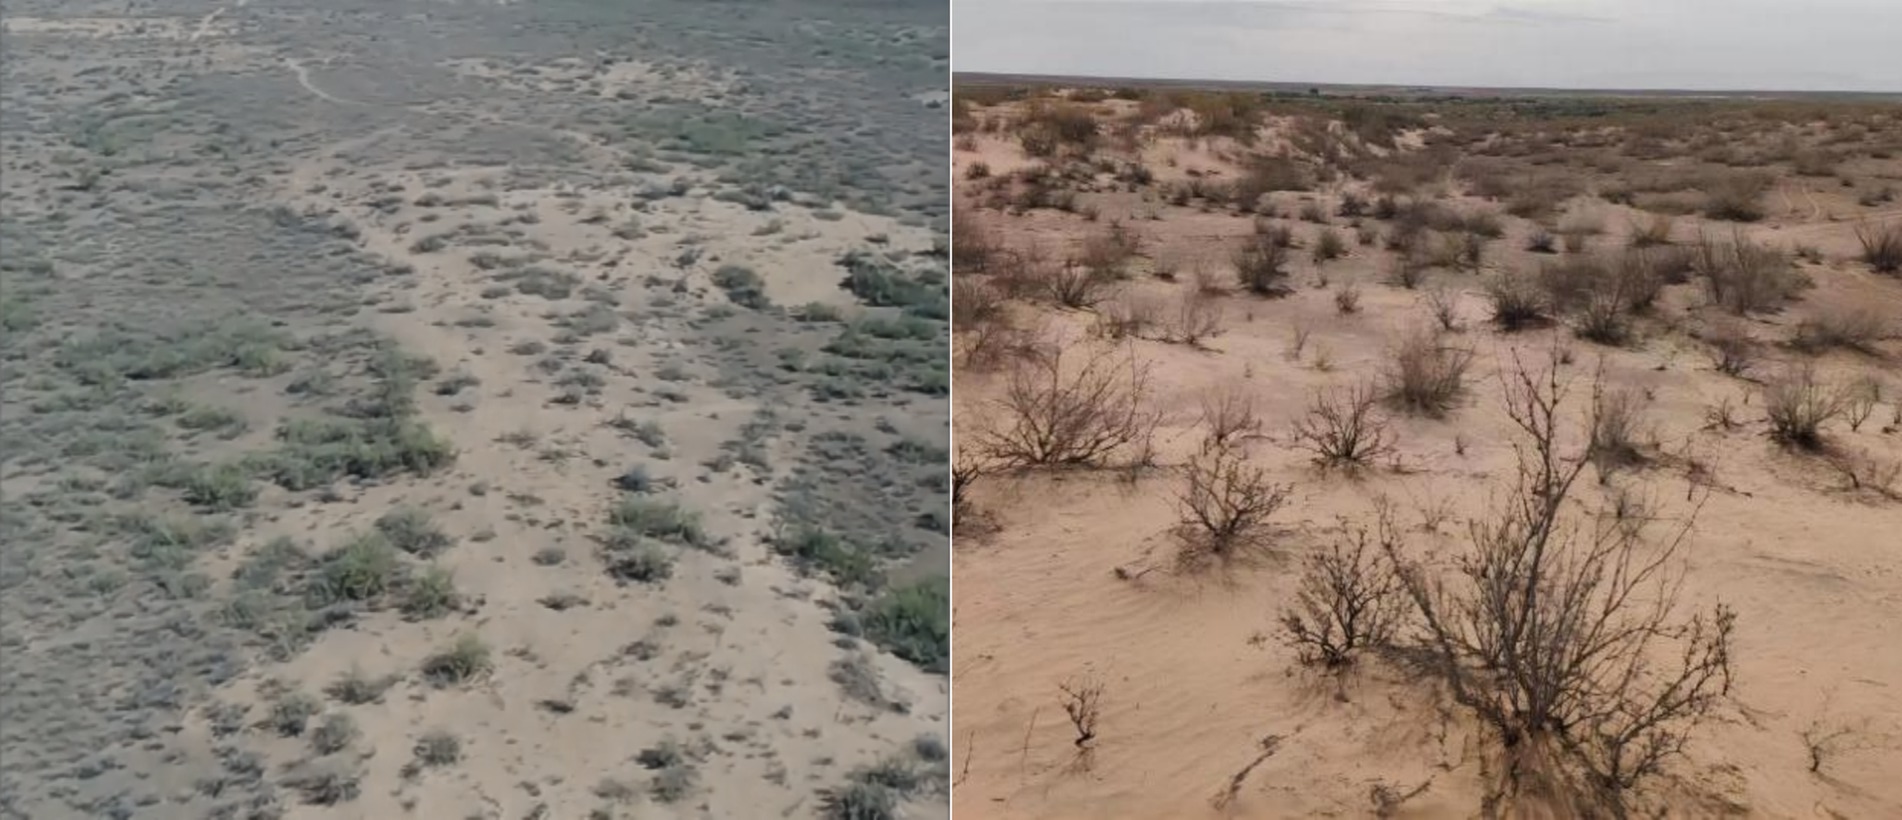
The Tengger Desert, one of China’s main dust storm source areas, is characterized by complex and variable natural conditions. The region has a dry climate, sparse vegetation, and strong wind and sand activity, making it an ecologically fragile region and a priority for wind and sand control (Gou et al., 2012). Aerial seeding afforestation, which is fast, efficient, low-cost, and covers large areas, is the most direct and effective measure for ecological restoration and vegetation reconstruction in arid desert areas with sparse populations and challenging conditions for manual afforestation (Tian et al., 2010). Since the early 1980s, large-scale aerial afforestation has been implemented on the northeastern edge of the Tengger Desert to effectively curb desert expansion. This effort has significantly increased vegetation coverage (Man et al., 2005; Qi et al., 2021). Field surveys show that after 31 years of restoration, average vegetation coverage in the aerial seeding afforestation area increased from less than 5% to over 20%. The area now features a plant community dominated by Corethrodendron scoparium, Calligonum mongolicum, and Artemisia ordosica shrubs, and the landscape has shifted from mobile dunes to fixed or semi-fixed dunes. However, the unnatural decline or even death of vegetation in some aerial seeding areas has drawn attention (Figure 1). Research indicates that in arid regions with annual rainfall between 100 and 250 mm (Tabari et al., 2012; Zhang et al., 2015), the eco-hydrological threshold for maintaining stable artificial vegetation requires sand-fixing shrub coverage between 3 and 31%. In the study area, vegetation coverage has exceeded 20%, while the average annual rainfall is only 123.33 mm. This suggests that the degradation of some vegetation could be due to insufficient soil moisture. Despite these observations, limited research has been conducted on the relationship between artificial vegetation and soil moisture in this region. Here we aim to address the following questions: What are the characteristics of soil moisture under artificial vegetation after 30 years of restoration, and how does the temporal stability of soil moisture differ between plant species? Addressing these questions is crucial for understanding soil moisture dynamics and ensuring the success of ecological restoration efforts in arid regions.
Through long-term monitoring of soil moisture content and meteorological factors within the 0–200 cm soil depth, the dynamic patterns of soil moisture in dominant shrubs were studied. This research also revealed the temporal stability of soil moisture and identified the representative depths at which this stability occurs in different plant community plots. These findings offer a comprehensive understanding of soil moisture distribution on the northeastern edge of the Tengger Desert after 30 years of vegetation restoration. Additionally, they provide a theoretical foundation for monitoring environmental factors and guiding ecological management of the region’s artificial sand-fixing vegetation systems.
2 Materials and methods
2.1 Overview of the study area
This research was conducted from June to October 2023 on the northeastern edge of the Tengger Desert, within the Alxa Left Banner. The study area, designated as an aerial-seeded shrubland, has been part of an afforestation project since 1992 (39°11′–39°18′N, 104°53′–104°57′E). It covers 4,025.33 hectares and has an average altitude of approximately 1,265 meters. The terrain slopes from southeast to northwest and is located on the edge of the Helan Mountain alluvial fan. The landscape features open terrain with interconnected sand dunes, which are subject to strong wind erosion. The predominant land types are fixed and semi-fixed sandy areas and the climate is typical of a temperate continental zone.
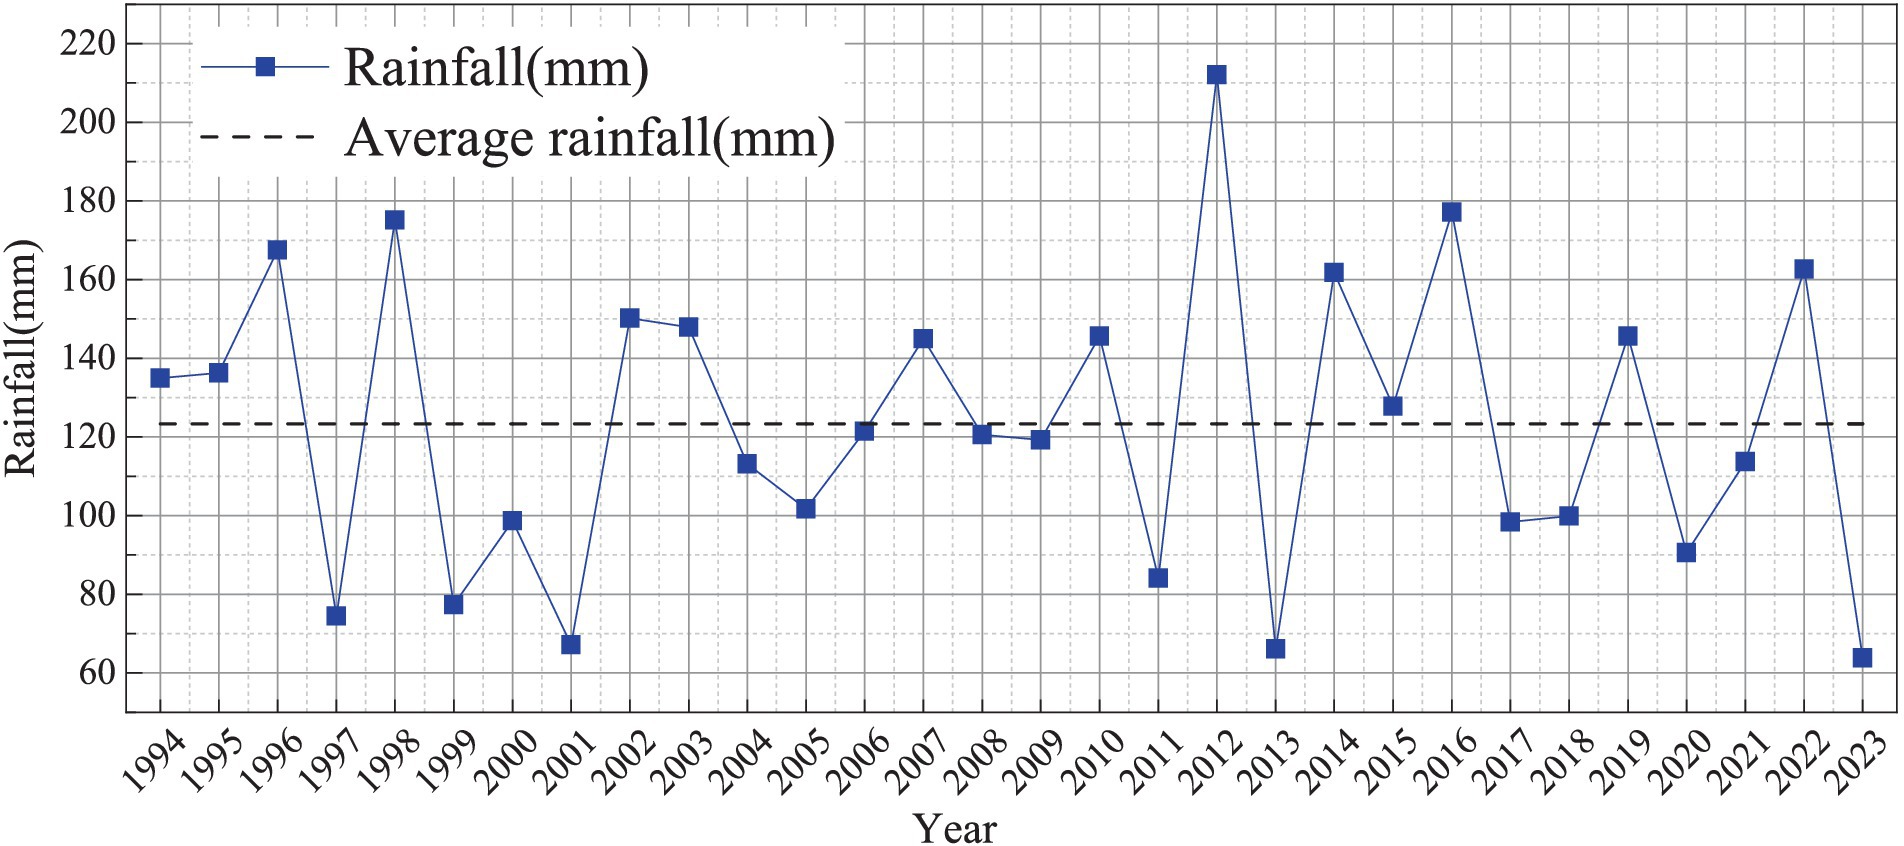
In the aerial-seeded region, the main soil types are gray desert soil and wind-blown sandy soil (Tian et al., 2010). As shown in Figure 2, the annual precipitation in the area ranged from 100 to 200 mm between 1994 and 2023, with an average of 123.33 mm. Rainfall is concentrated mainly between June and September, with over 80% of the precipitation occurring from June to October. The highest number of windy days occurs in spring and winter, with an average wind speed of 7.1 m/s and a maximum wind speed of up to 26 m/s (Zhao et al., 2022). Annual evaporation reaches 2,258.8 mm, and the frost-free period lasts 168 days per year. The region receives 3,181 h of sunshine annually, solar radiation of 150 KJ/cm2, and has an average annual temperature of 7.8°C. The vegetation communities in this area are primarily composed of aerially sown shrubs such as C. scoparium and C. mongolicum, as well as native A. ordosica communities.
2.2 Research methods
2.2.1 Plot setup and investigation
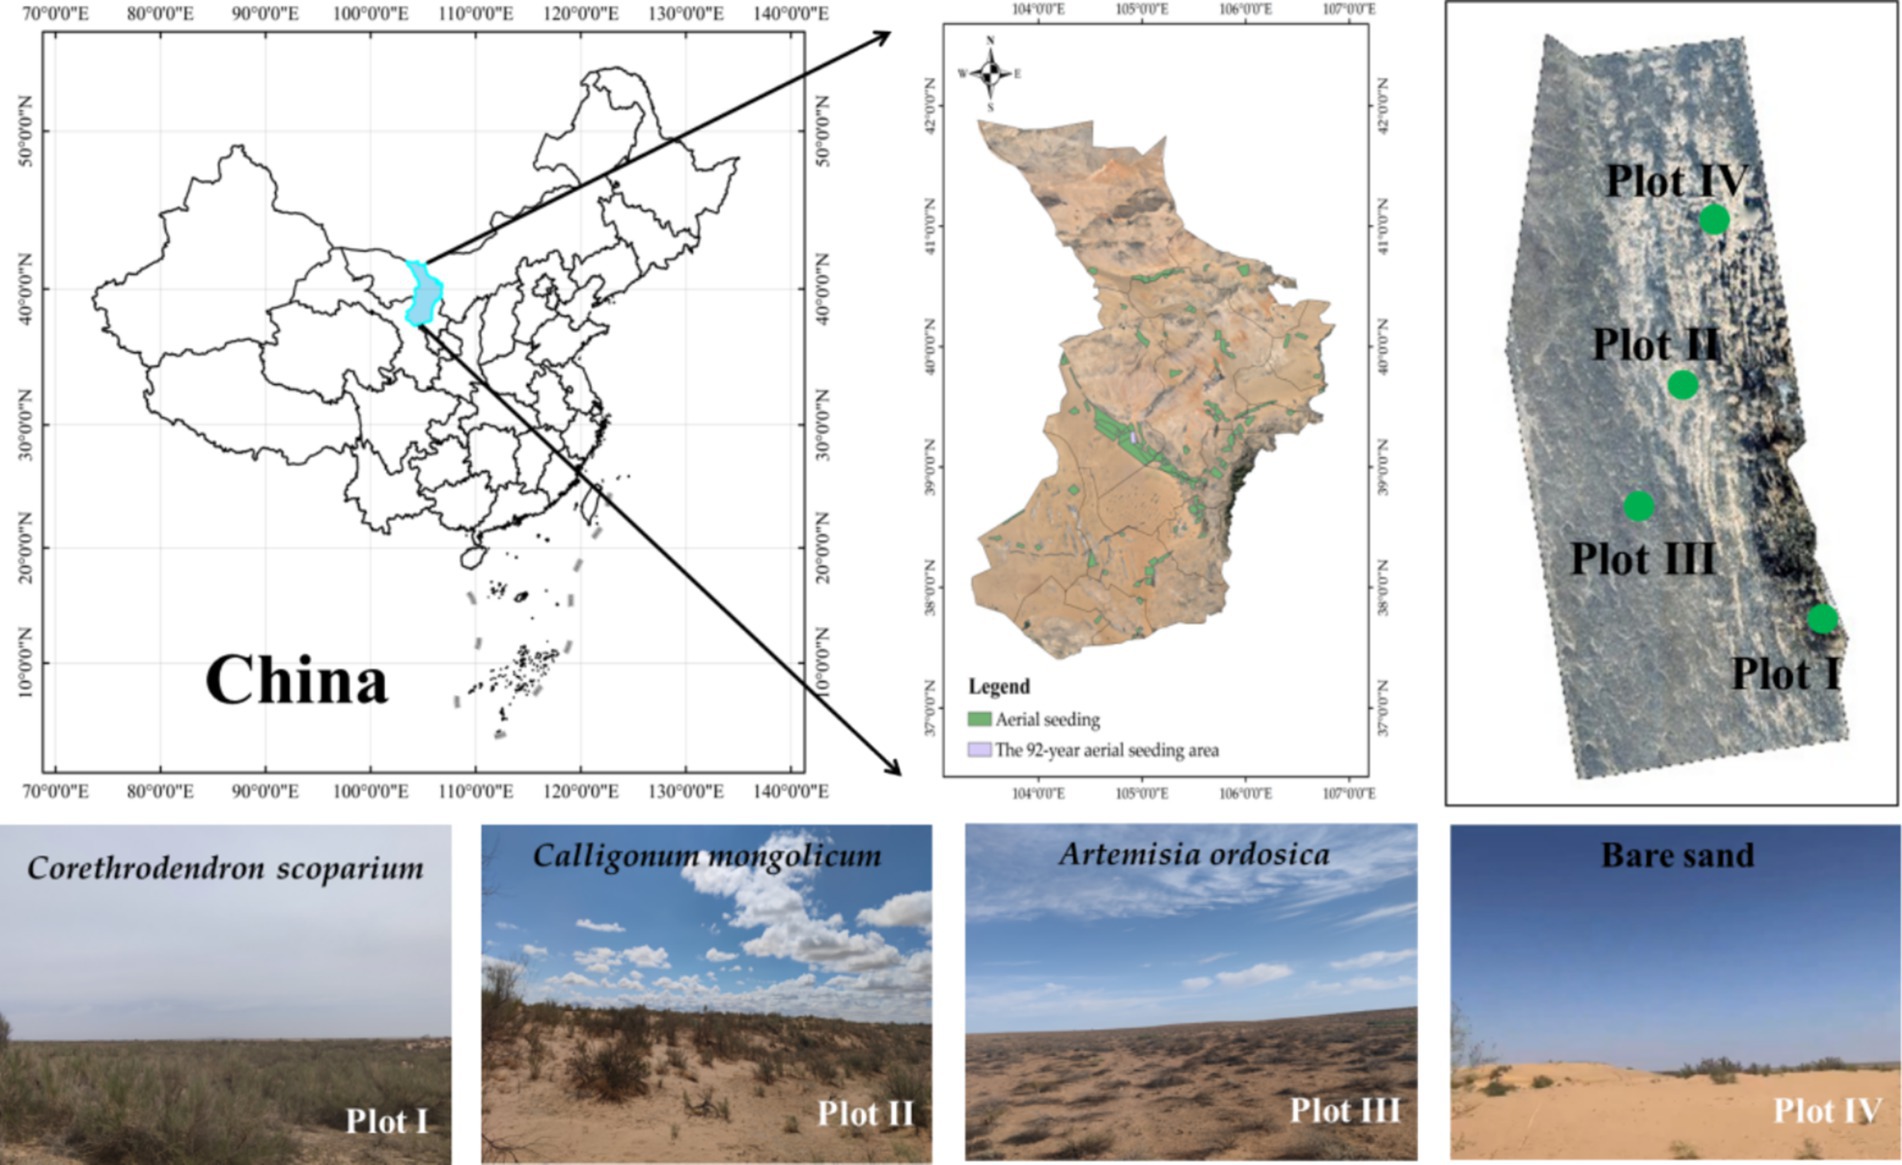
For localized soil moisture monitoring, four plots were established within the study area. In each plot, a representative vegetation community located at the windward base of a fixed sand dune was selected for this study (Table 1). In June 2023, soil moisture monitoring instruments were installed, and plot investigations were conducted simultaneously. Within each plot, five sublots, each measuring 20 m × 20 m, were designated for monitoring (Figure 3).
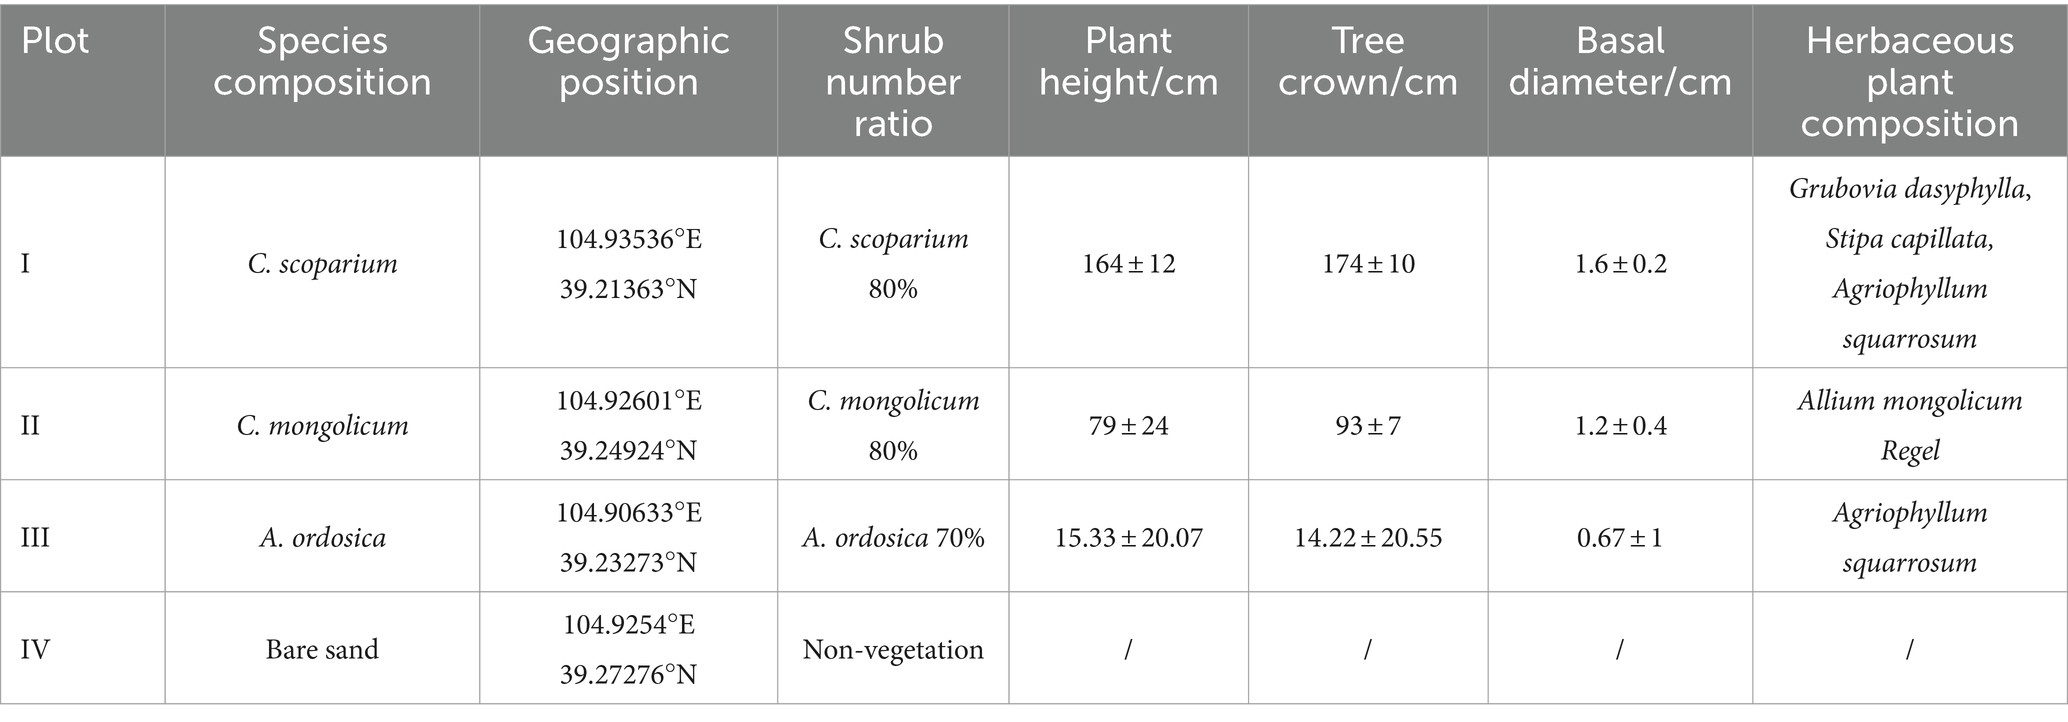
Before sampling, a preliminary investigation was conducted to gather basic information for each survey unit. This included assessing the vegetation characteristics of the aerial-seeded forestland where the survey units were located. Key factors examined were root depth, number of roots, basal diameter, biomass, and root length density, as well as shrub height, crown width, basal diameter, density, and the cover of both shrubs and grasses. Additionally, the investigation recorded the location of each experimental plot and the composition of the plant communities. The basic information for each experimental plot is provided in detailed in Tables 1, 2.
2.2.2 Sample collection and index determination
Previous studies have shown that the root systems of sand-fixing shrubs in the study area are primarily distributed within the 40–200 cm soil layer, which is the main zone for soil moisture utilization (Yang et al., 2018). Based on this, in each shrub plot, one standard shrub was selected, and a 200 cm soil profile was manually excavated beneath it. Soil moisture sensors were installed at depths of 10, 20, 30, 60, 100, 150, and 200 cm on the same side of the profile to monitor soil moisture content in real time. After installation, the pit was backfilled, ensuring that the surface layer closely matched the surrounding ground surface. Watchdog (Spectrum, United States) data loggers were used for soil moisture measurements, with readings taken every 30 s and data recorded at 15-min intervals.
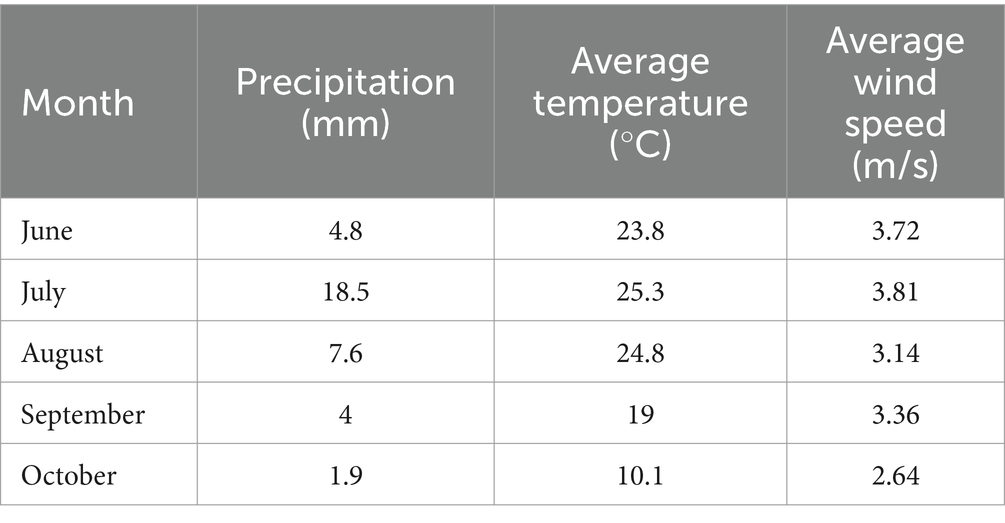
Meteorological data, including precipitation, temperature, and wind speed, were automatically recorded during the study period using a small automatic weather station. The meteorological data for the study period are provided in Table 3.
2.3 Data processing
2.3.1 Calculation of the soil water storage
Soil water storage refers to the amount of moisture held in a specific volume of soil. In this study, we estimated the soil water storage within a depth range of 0–200 cm. The calculations were based on observations from this soil depth range. The formulas used for these calculations are as follows (1) and (2):
In the formula, SWSi represents the water storage of the i-th soil layer; SVWCi denotes the soil volumetric water content, expressed in m3/m3; di is the depth of the soil layer, measured in mm; 7 is the total number of soil layers observed in this study; and is the average soil water content at time j, given in m3/m3.
2.3.2 Coefficient of variation
The coefficient of variation is used to analyze the spatial variation in soil moisture for different vegetation types. This involves the vertical coefficient of variation. In the formula, δ represents the standard deviation, and μ represents the mean. The calculation formula is as follows (3):
A coefficient of variation (CV) of less than 10% indicates weak variability, a CV between 10 and 100% suggests moderate variability, and a CV greater than or equal to 100% indicates strong variability.
2.3.3 Relative difference and temporal stability index
According to Vachaud et al., the average relative difference (RD) and standard deviation (SD) of each observation point can describe the temporal stability of soil moisture. The relative difference (RD) and standard deviation (SD) of the soil water storage (SWSij) at any observation point i at time j can be calculated using Formulas (4) and (5):
In the formulas, SVWCij represents the soil volumetric water content (SVWC) at time j at observation point i, expressed in m3/m3; SVWCj is the average SVWC at time j; and m is the number of measurements.
The average relative difference (MRDi) and its corresponding standard deviation (SDRDi) are calculated as follows (6) and (7):
According to Zhao et al. (2010), the temporal stability index (ITSDi) is used to assess the temporal stability of soil moisture across different soil depths for various aerial-seeded vegetation types. The observation point with the highest temporal stability is identified as representing the average soil moisture condition. The calculation of ITSDi is expressed in Formula (8):
2.3.4 Spearman rank correlation coefficient
The Spearman rank correlation coefficient (rs) is used to analyze the stability of ranks over time at different observation points during the 2023 growing season. It is calculated using Formula (9):
In the equation, Rij represents the rank of the soil water content at observation point i during observation time j, Ril is the rank of observation point i at time l, and n is the total number of observation points. A Spearman rank correlation coefficient (rs) closer to 1 indicates a more stable spatial pattern of soil water content over time.
2.3.5 Coefficient of determination and Nash-Sutcliffe efficiency coefficient
Linear regression was performed between the soil volumetric water content (SVWC) at a specific measurement point i and the average SVWC at different soil depths throughout the entire measurement period. The coefficient of determination (R2) was used to quantify the degree of difference between the two. Generally, a smaller (R2) indicates a closer relationship between the SVWC at measurement point i and the average SVWC in the study area, reflecting a smaller difference. Additionally, this study utilized the Nash-Sutcliffe efficiency coefficient (NSE) to evaluate whether the soil depth accurately represents the soil moisture of the stand. The formula is as follows:
In the formula, SVWCij refers to the soil volumetric water content at the time of i soil layer j (in m3/m3), SVWCR represents the soil volumetric water content representing the soil depth, and SVWCi represents the total average of the observed values. An NSE value closer to 1 indicates better representativeness and higher credibility of the results. When NSE is close to 0, the results from the representative points are similar to the average of the observed values, suggesting overall credibility but with larger errors. However, if NSE is less than 0, the results are considered unreliable.
3 Results and analysis
3.1 Changes in soil water storage characteristics
Figure 4 illustrates the variation in total soil water storage at depths of 0–200 cm during the 2023 growing season (June to October). The total soil water storage ranged from 27.81 to 47.00 mm across different plots. Specifically, the total soil water storage for was 33.64 mm for the C. scoparium plot, 33.50 mm for the C. mongolicum plot, and 33.67 mm for the A. ordosica plot, while the bare sand plot had the highest total soil water storage of 46.37 mm. During the growing season, the maximum soil water storage for the C. scoparium plot occurred in September at 37.22 mm, for the C. mongolicum plot in September at 35.76 mm, and for the A. ordosica plot in August at 35.50 mm. The bare sand plot consistently recorded higher total soil water storage compared to the other plots, reaching its maximum value in August at 49.44 mm. The soil water storage in the plots generally increased and then decreased as the months progressed. The variation in soil water storage differed among plots, as shown in the boxplots in Figure 4. The C. scoparium plot exhibited greater variation compared to the other plots, indicating moderate variability. The other plots showed weaker variation, with the A. ordosica plot having the lowest variation, though it was similar to that of the C. mongolicum plot. The variation in soil water storage was ranked as follows: C. scoparium plot > bare sand plot > C. mongolicum plot > A. ordosica plot.
Precipitation in the aerial-seeded area varied significantly from June to October 2023, as shown in Figure 4. The total rainfall during this period was 36.8 mm. The highest rainfall occurred in July at 18.5 mm, accounting for 50.27% of the total, while the lowest rainfall was in October at 1.9 mm, making up 5.16%. Rainfall in June, August, and September was 4.8 mm, 7.6 mm, and 4 mm, accounting for 13.04, 20.65, and 10.86%, respectively. July experienced the most rainfall. The variation in precipitation influenced the changes in soil water storage, with the soil water storage for the four plots showing an increasing and then decreasing trend in response to the fluctuating rainfall.
3.2 Spatiotemporal characteristics of soil moisture
Figure 5 displays the spatiotemporal characteristics of soil moisture across four plots. The soil water content in the 0–200 cm depth layer varied distinctly across different months and plots. The bare sand plot consistently had the highest average soil water content, reaching 2.13%, whereas the C. scoparium plot had the lowest average soil water content at 1.42%. The C. mongolicum plot had an average soil water content of 1.50%, and the A. ordosica plot had an average soil water content of 1.72%. Across all plots, the average soil water content increased and then decreased as the months progressed. June recorded the lowest average soil water content for all plots, with the C. scoparium plot showing the lowest value of 1.11%. The highest average soil water content of 1.66% occurred in August for the bare sand plot. During the wetter months of July and August, average soil water content increased across all plots, with the bare sand plot reaching a peak of 2.37% in August.
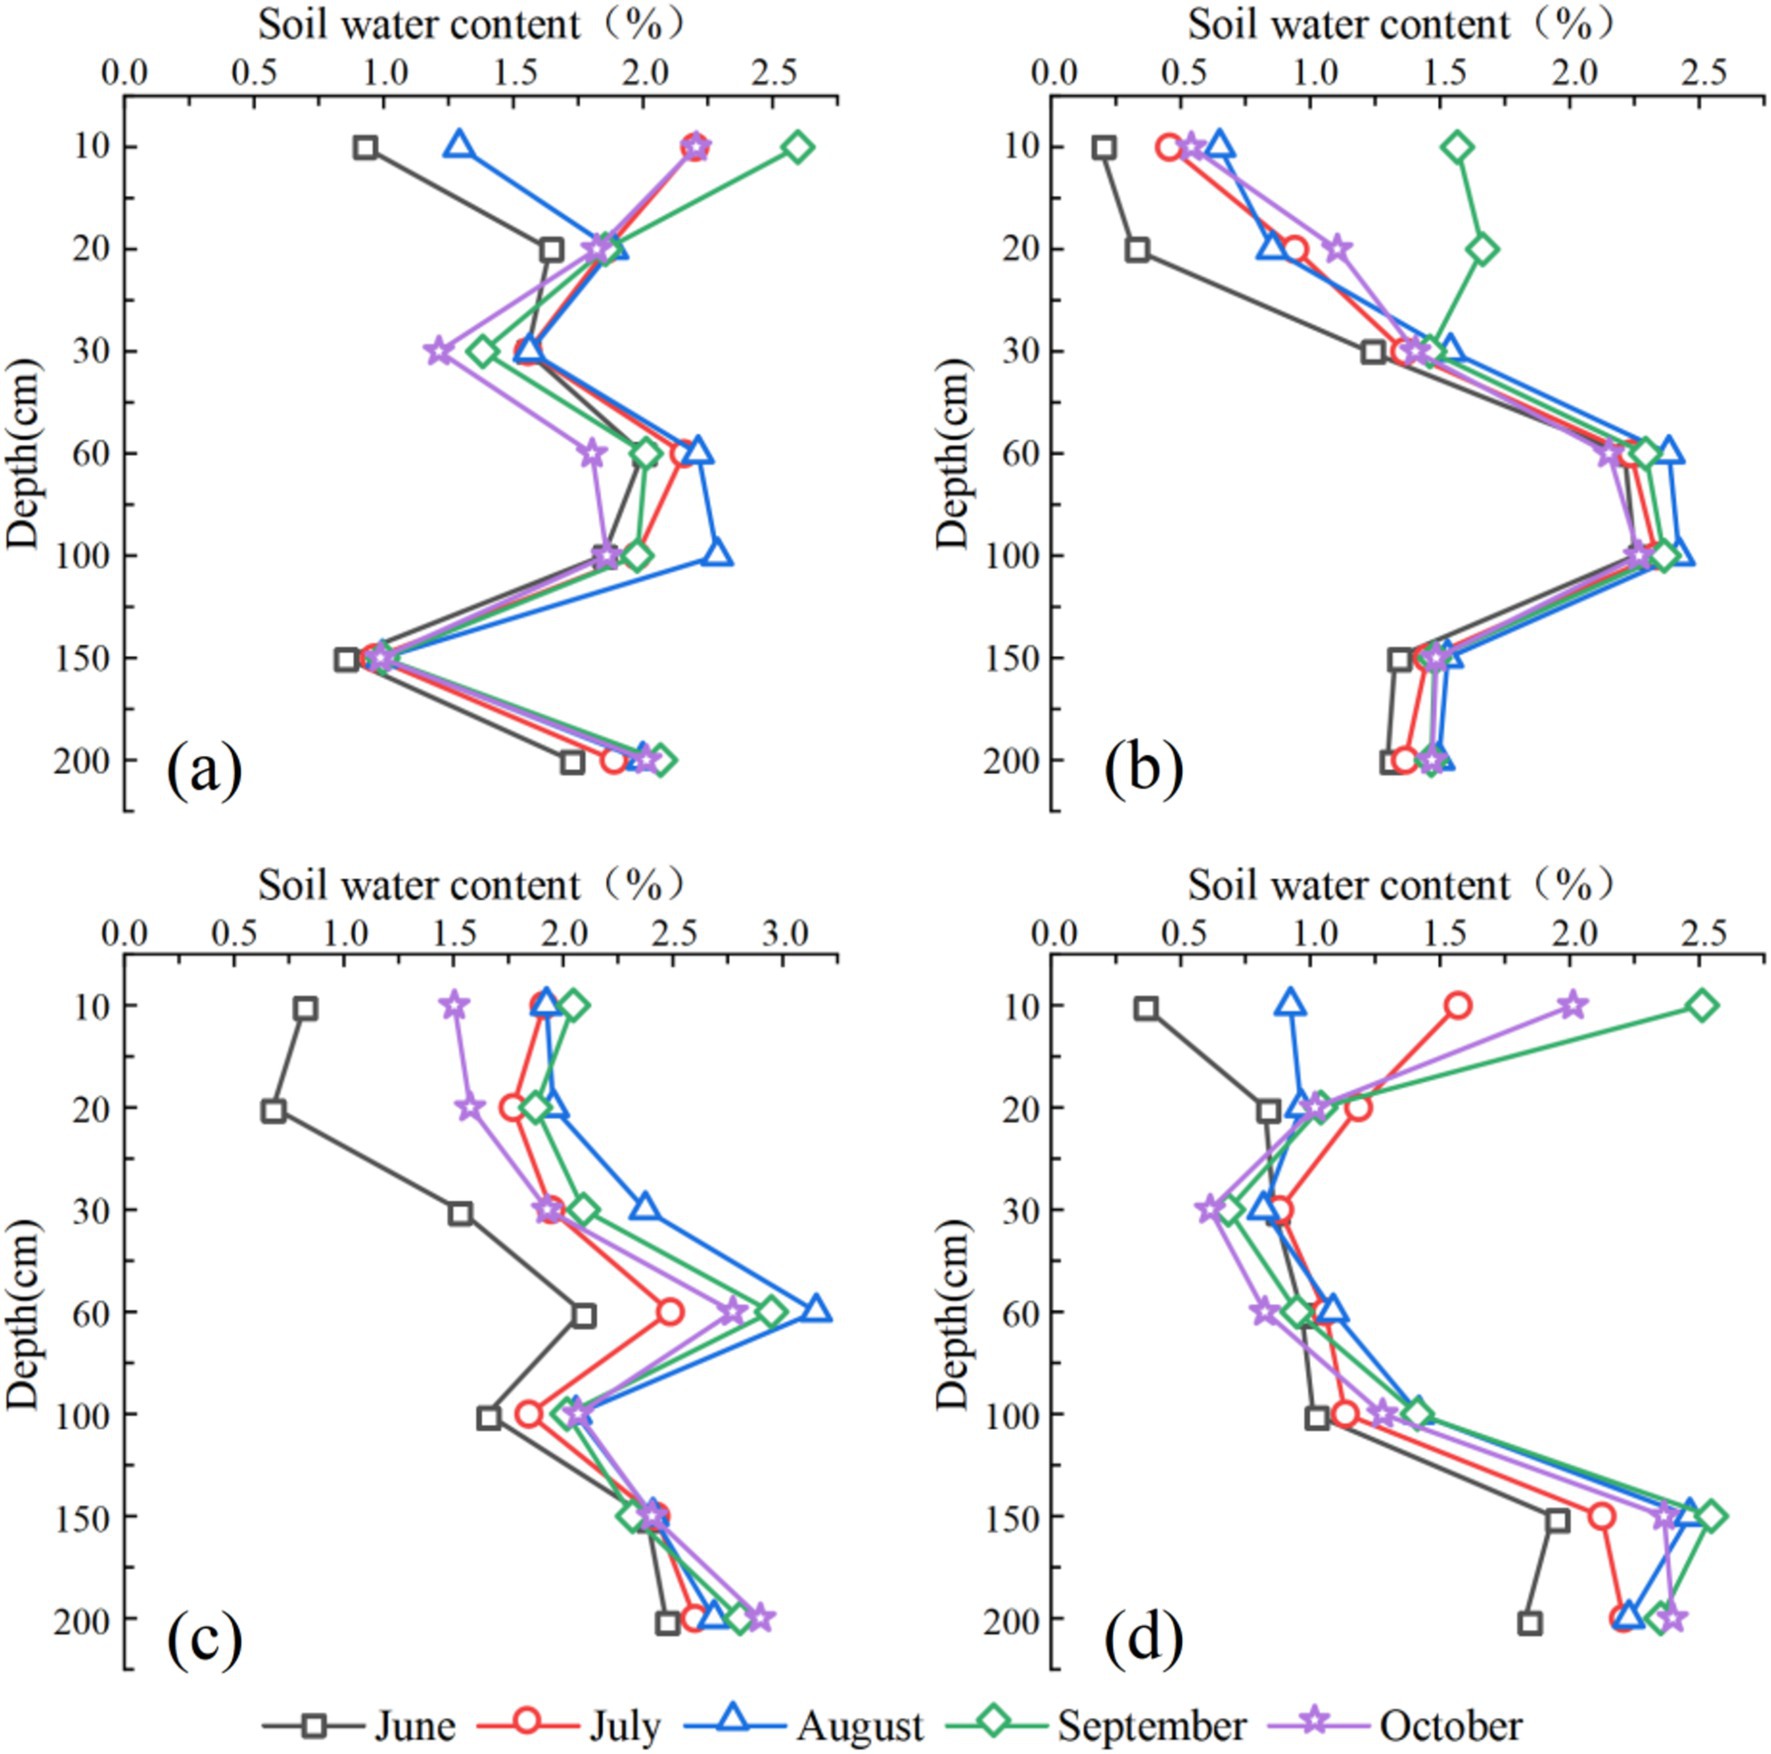
Figure 5. Spatial and temporal distributions of soil water content across the four plots. Each graph represents the following sample plots for: (a) C. scoparium; (b) C. mongolicum; (c) A. ordosica; and (d) bare sand.
The spatiotemporal patterns of soil moisture are also evident in Figure 5. In the 0–60 cm soil layer, soil water content fluctuated significantly. For the C. scoparium, C. mongolicum, and bare sand plots, there was a noticeable increasing trend, while the A. ordosica plot showed an increasing followed by a decrease. As the depth increased to 60–200 cm, all plots exhibited increased soil water content, with notable fluctuations in the C. scoparium and C. mongolicum plots. The bare sand plot had the highest average soil water content in this depth range.
Soil moisture distribution varied at different depths across the plots. At shallower depths (10 and 20 cm), A. ordosica typically had the highest moisture content, followed by bare sand, C. scoparium, and C. mongolicum. As depth increased to 30 cm and 60 cm, bare sand consistently exhibited the highest moisture content, with C. mongolicum and A. ordosica showing varying levels, and C. scoparium generally having the lowest. At deeper levels (100, 150, and 200 cm), moisture content patterns became more variable, with C. mongolicum and bare sand showing higher moisture content compared to the other plots. The C. scoparium plot had higher soil water content at 150 and 200 cm depths, while the C. mongolicum and A. ordosica plots showed higher soil water content at depths of 60 and 100 cm. The bare sand plot had greater soil water content at 60 and 200 cm depths. This analysis highlights that while trends in soil moisture changes were relatively consistent within the same soil layer, significant differences existed in moisture content and variation amplitude across different soil layers and plots.
Each graph represents the following sample plots for: (a) C. scoparium; (b) C. mongolicum; (c) A. ordosica; and (d) bare sand.
3.3 Soil moisture variability distribution characteristics
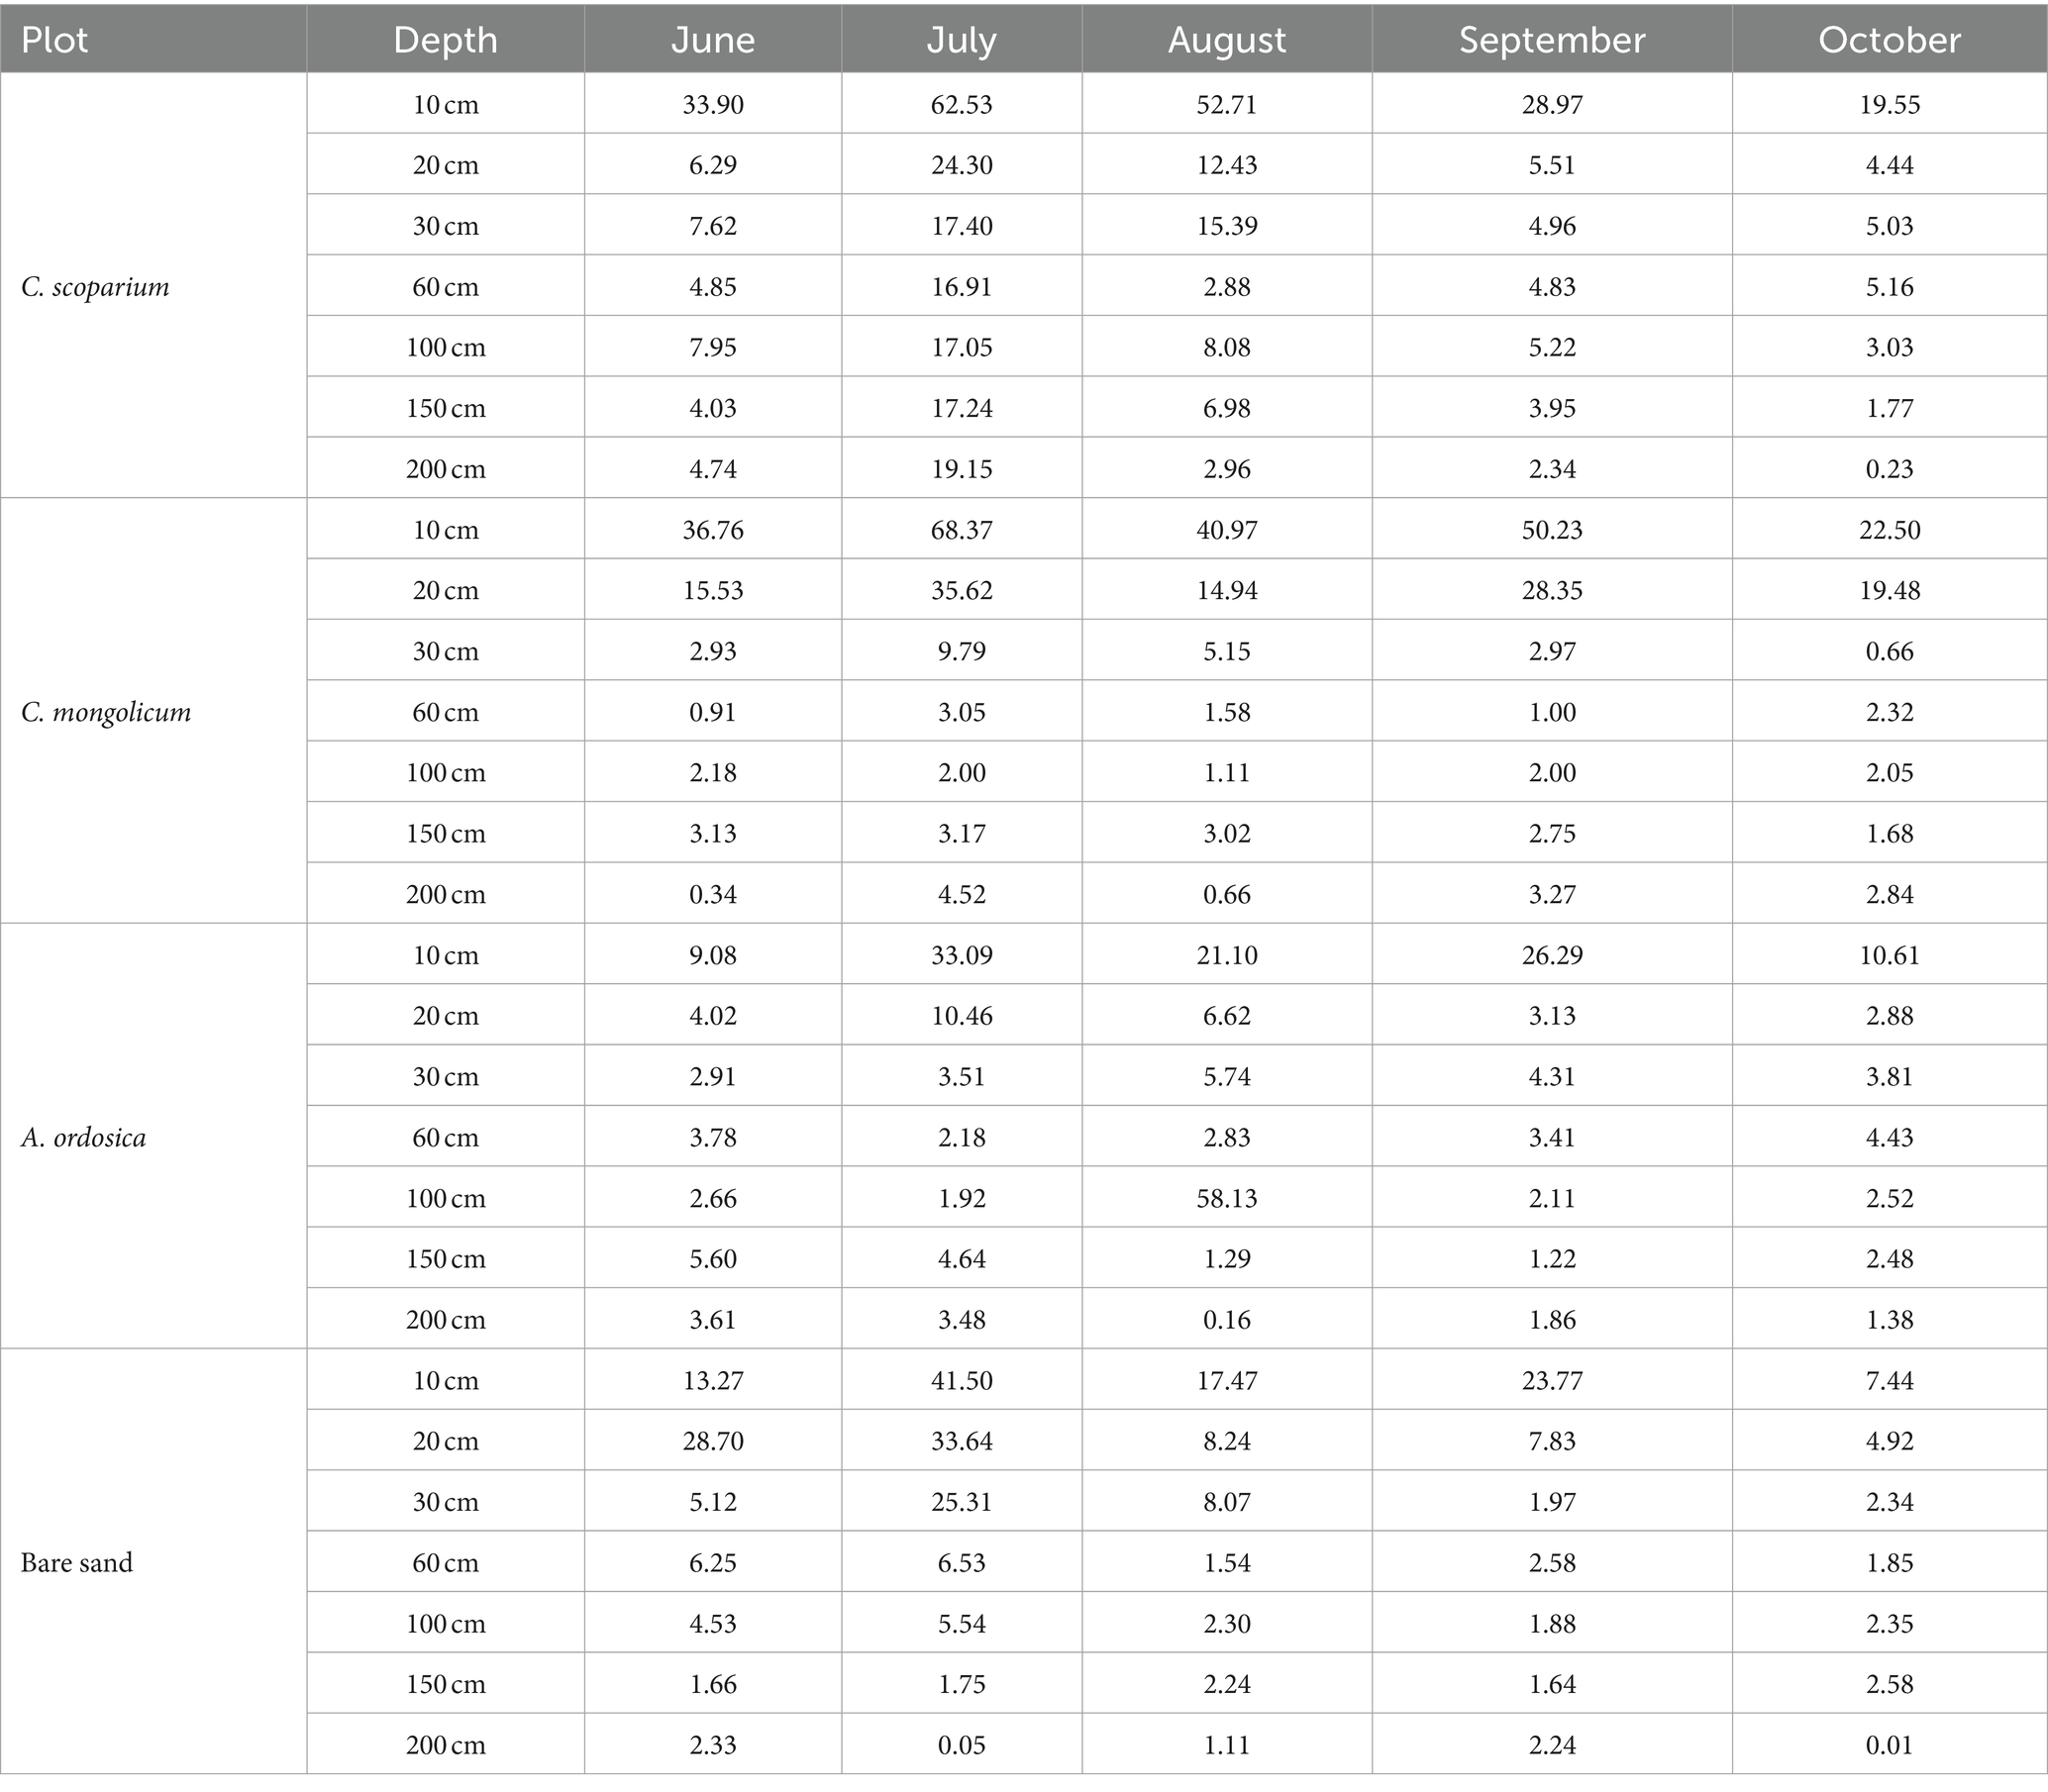
According to the monitoring data, the coefficients of variation (CVs) for temporal changes in soil moisture at different depths across the four sites were calculated (Table 4). The CV values varied with soil depth and followed a pattern similar to changes in soil moisture content. At all four sites, the variability decreased with increasing soil depth. In the 100–200 cm soil layer, the variation was minimal C. scoparium site, while at the C. mongolicum site, it was low in the 30–200 cm soil layer. The A. ordosica site exhibited low variability in the 20–200 cm layer, and the bare sand site showed low variability in the 30–200 cm layer. The variability coefficients for soil moisture at all four sites were highest in the 0–30 cm layer. As the months progressed, the variability coefficients initially increased before showing a subsequent decrease in the 0–30 cm layer. However, the variability coefficients for soil moisture in the 0–30 cm layer were greater than those in the 30–200 cm layer, indicating that soil moisture variability decreased with increasing soil depth.
The monthly mean coefficients of variation for soil moisture at different depths (0–200 cm) across the four sites were all below 100%, indicating moderate variability (10% < CV < 100%). This suggests that no strong variability in soil moisture was present. Weak variability (CV < 10%) was primarily observed in the 30–200 cm soil layer. The temporal and spatial patterns of soil moisture variability were fairly consistent among the four sites. In general, the soil moisture variability was weak below 60 cm, while moderate variability (10% < CV < 100%) occurred in the 10 cm and 20 cm layers. The coefficients of variation were highest in July and August across all four sites, with the maximum values in July, as follows: C. mongolicum (68.37%), C. scoparium (62.53%), Bare sand (41.50%), and A. ordosica (33.09%). The variability coefficients in July for the 0–200 cm soil layer was higher than in other months for all four sites. The lowest variability values for soil moisture at all four sites were less than 1%. For C. scoparium and bare sand, the lowest values occurred at a depth of 200 cm, with values of 0.23 and 0.01%, respectively. For C. mongolicum, the lowest value occurred in June at a depth of 200 cm (0.34%), and for A. ordosica, it occurred in August at a depth of 200 cm (0.16%). Overall, the 100–200 cm layer demonstrated greater stability compared to other soil layers. The spatiotemporal distribution of soil moisture variability further highlighted that stability increased with greater soil depth.
3.4 Temporal stability analysis and representative depth
In this study, two methods—the relative difference (RD) and Spearman rank correlation coefficient—were used to analyze the temporal stability of soil moisture. By calculating the mean relative difference (MRD) at different soil depths and the temporal stability index (ITSDi) for each depth, the soil layer with the lowest ITSDi was identified as the most temporally stable layer (Figure 6). Distinct characteristics of temporal stability were observed at each site. The MRD values for different soil depths ranged from −13% to −63, −3% to −69, −43 to 20%, and − 8 to 28%, respectively, across the four sites. Meanwhile, the temporal stability index values varied from 20 to 113%, 6 to 81%, 12 to 78%, and 12 to 44%, respectively.
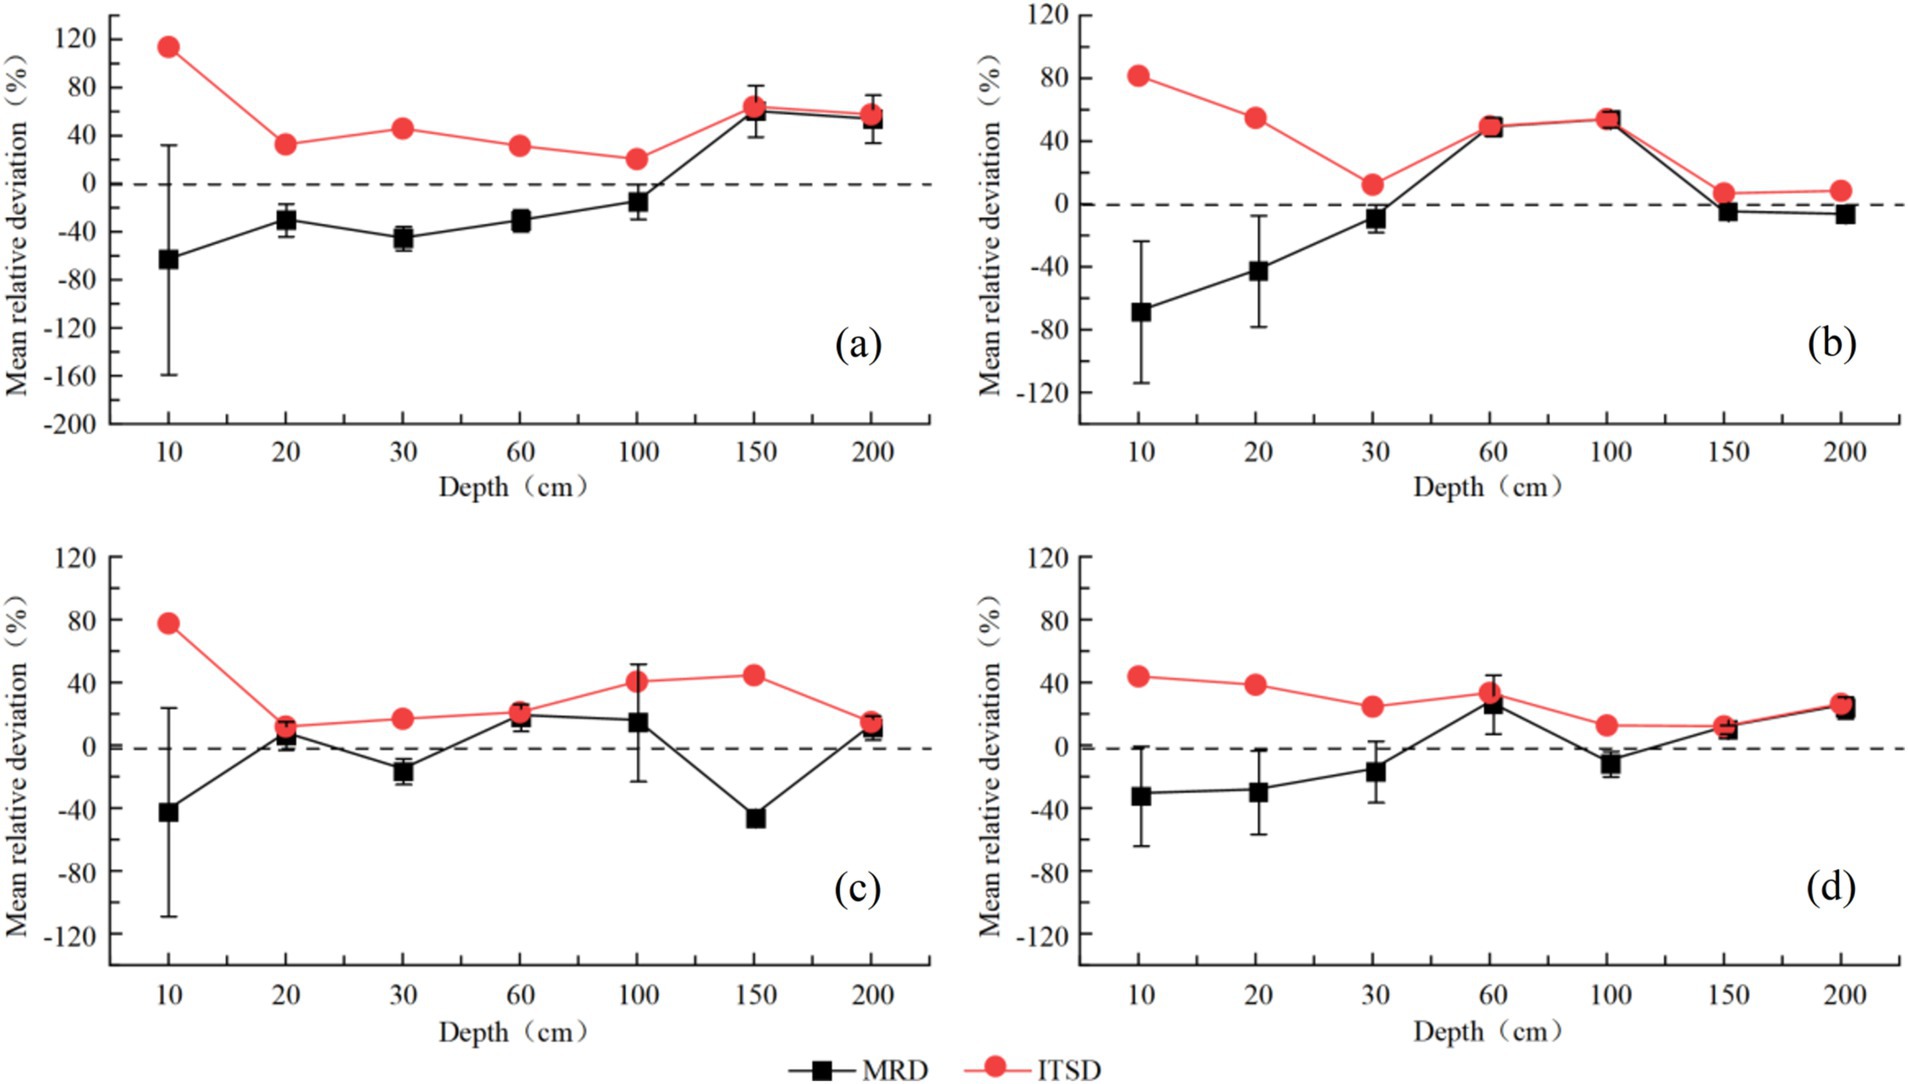
Figure 6. Temporal stability of soil moisture in the four plots. Each graph represents the following sample plots for: (a) C. scoparium; (b) C. mongolicum; (c) A. ordosica; and (d) bare sand.
Among the four sites, the variations in the mean relative difference (MRD) for soil moisture were smaller at the C. scoparium and bare sand sites compared to the C. mongolicum and A. ordosica sites, indicating greater temporal stability at the former locations. Based on the principle that the average relative difference is close to 0 and the standard deviation is small, the representative soil depths for average soil moisture content were determined to be 100, 150, 20, and 100 cm for the C. scoparium, bare sand, C. mongolicum, and A. ordosica sites, respectively. The C. mongolicum site had the greatest representative depth, reaching up to 150 cm.
Additionally, following the principle that a relative difference with a standard deviation less than 5% indicates strong spatiotemporal stability, the soil layers with this high level of stability were primarily concentrated in the 100–200 cm range across all sites. This finding suggests that most soil layers exhibited weak temporal stability for soil moisture across different depths. Overall, the results indicated that the deeper soil moisture (100–200 cm) generally exhibited greater temporal stability than the shallower layers (0–60 cm). These temporal stability characteristics of soil moisture were strongly dependent on soil depth.
The figure depicts the variations in MRD and the corresponding temporal stability index at different soil depths for the four study sites including: (a) C. scoparium; (b) C. mongolicum; (c) A. ordosica; and (d) Bare sand. The vertical error bars represent the standard deviation of the relative differences at each soil depth.
Table 5 presents the Spearman rank correlation coefficients of soil moisture at different soil depths at the four study sites. Overall, there were no significant differences in the Spearman rank correlation coefficients between the different soil depths across the sites. At the C. scoparium site, significant correlations were observed at soil depths between 100 and 200 cm (with rs values ranging from 0.189–0.824), while weaker correlations were noted in the 60–150 cm (with rs values between 0.128–0.156). At the C. mongolicum site, strong correlations were detected at soil depths of 0–60 cm (with rs values ranging from 0.383–0.811), as well as in the lower layers (100–200 cm), where correlations ranged from 0.385 to 0.838. However, weaker correlations were found between the upper and lower soil layers (0.068–0.128). For the A. ordosica site, significant correlations were present through the 0–200 cm depth (with rs values from 0.234 to 0.811). The bare sand site exhibited highly significant correlations in the upper layers (0–100 cm) with rs values ranging from 0.533 to 0.911, and in the lower layers (150–200 cm), where rs values ranged from 0.412–0.788. However, weak or negative correlations were observed between the upper and lower layers (with rs values ranging from −0.122 to 0.13). Although the range of Spearman rank correlation coefficients fluctuated across monitoring periods, there were highly significant correlations (p < 0.01) between different soil layers overall. This further suggests that the temporal stability of soil moisture differs between the upper and lower soil layers.
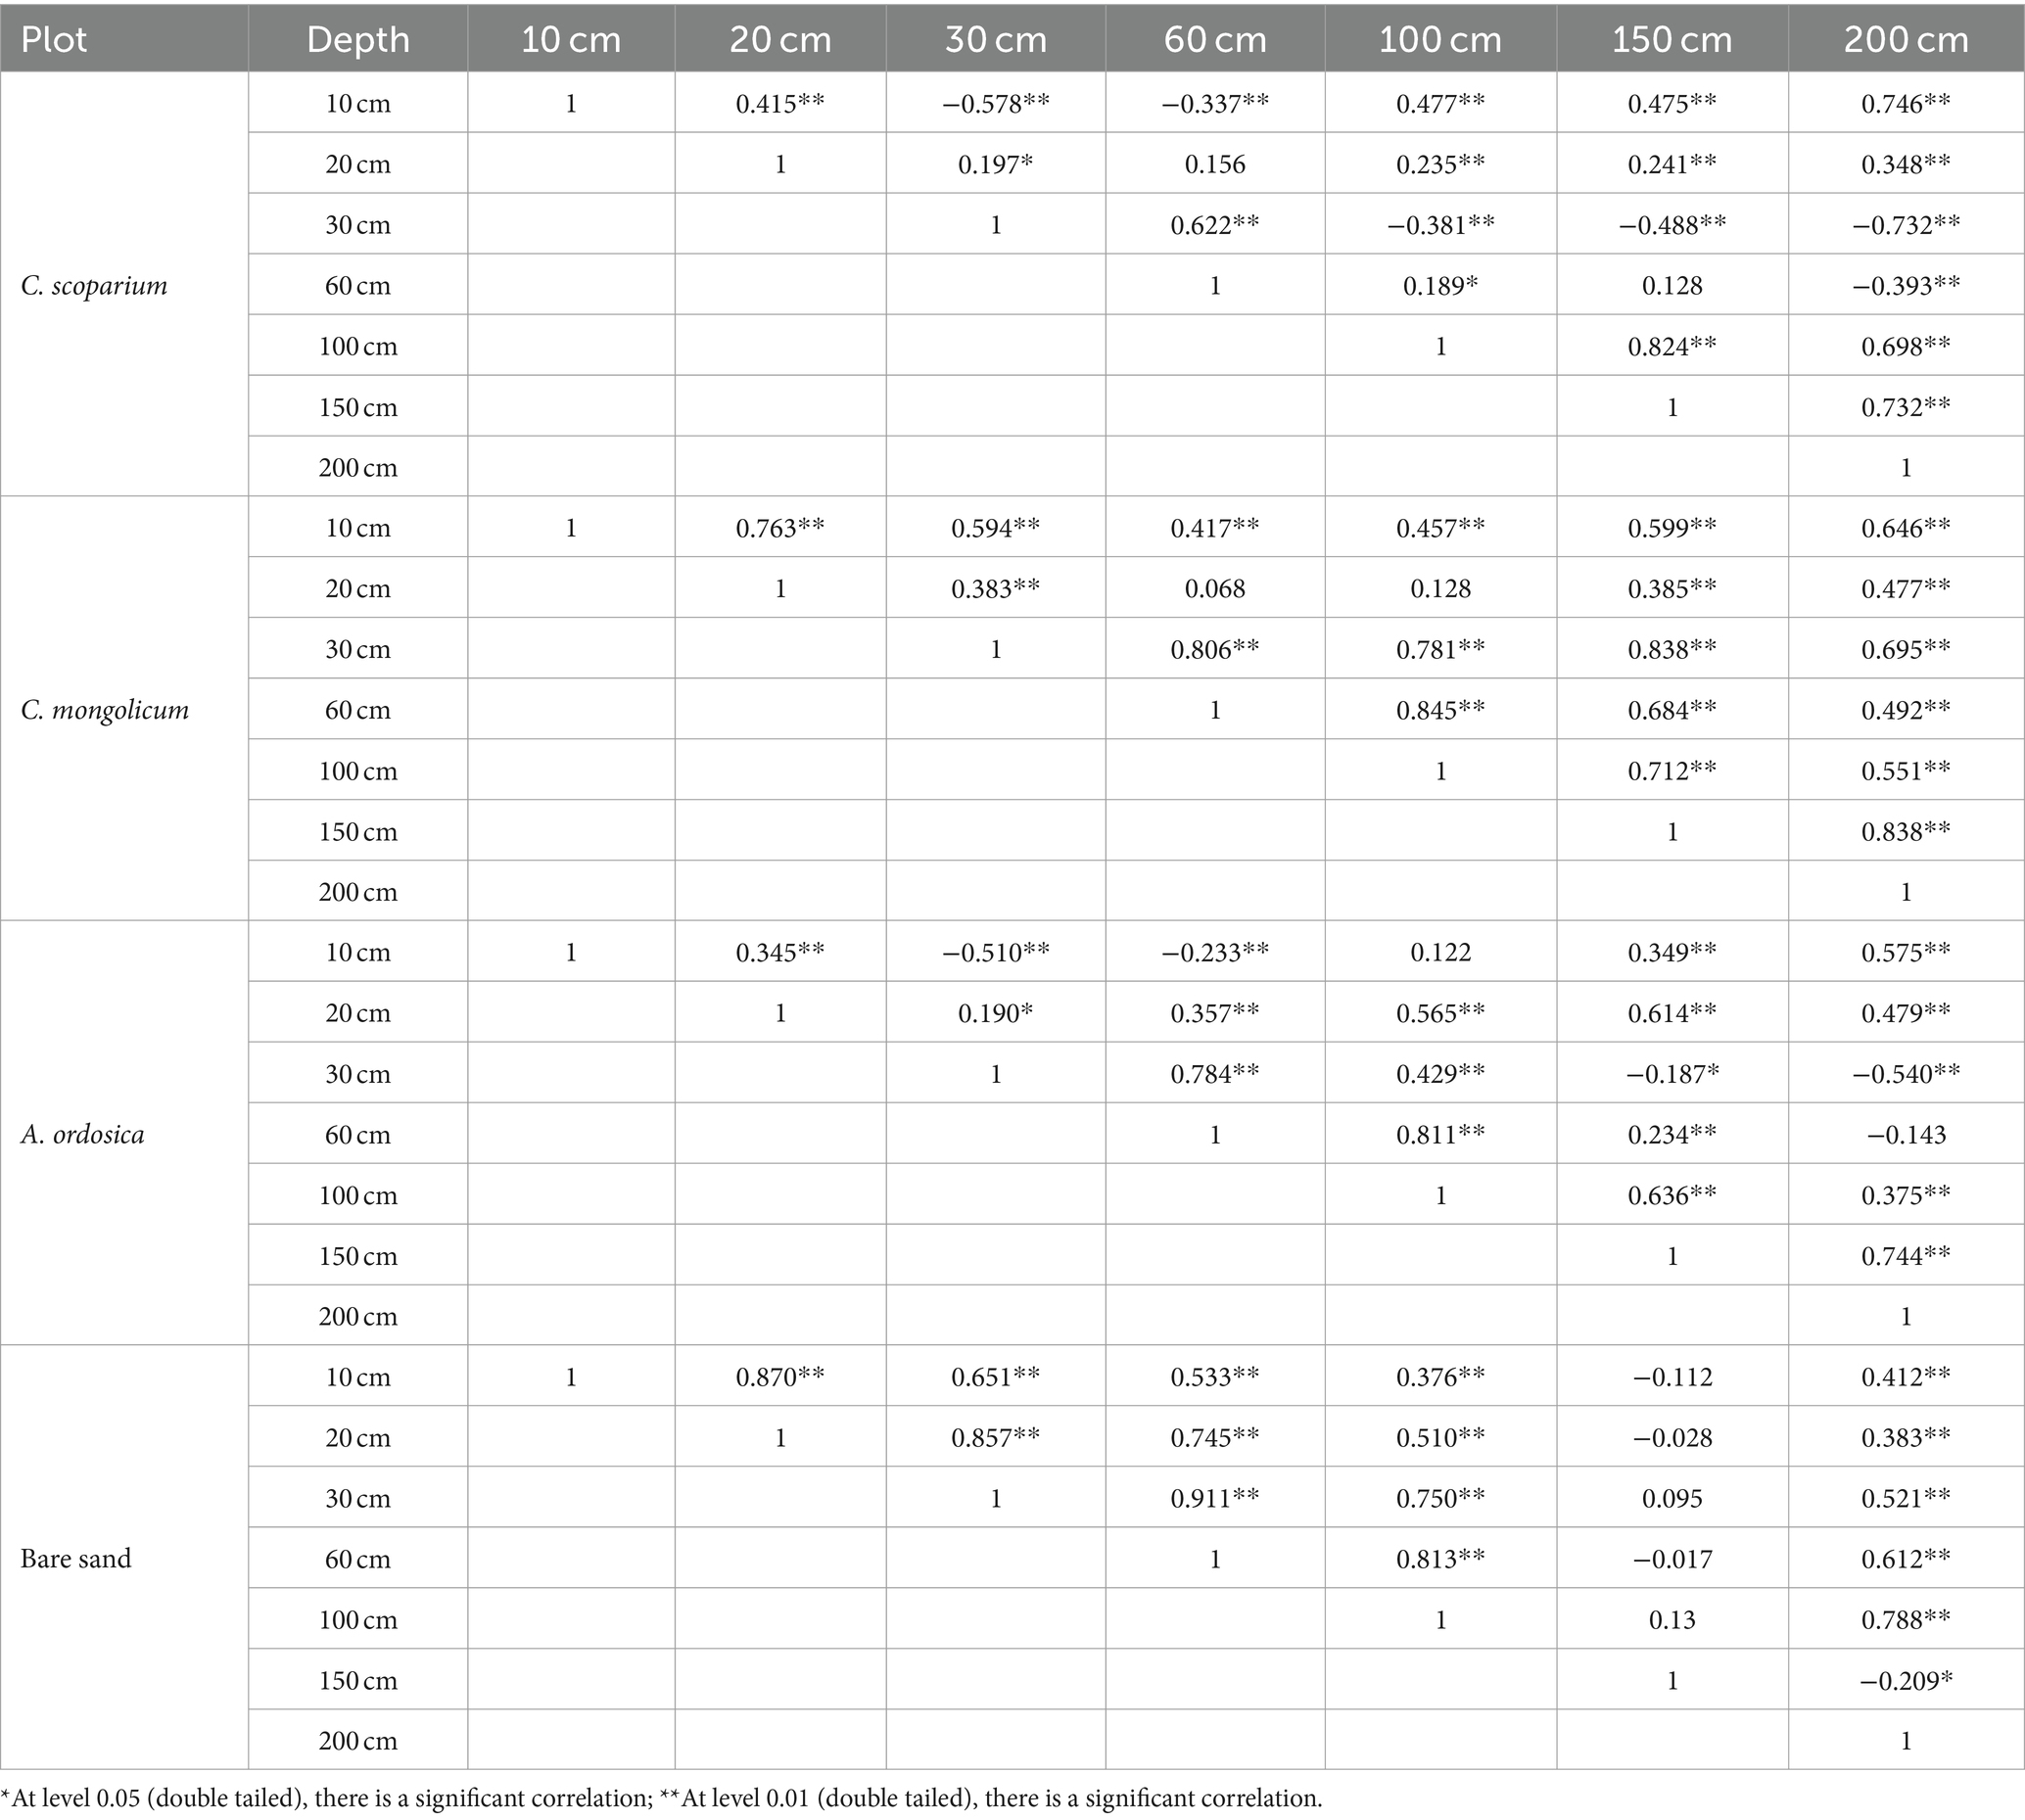
Table 5. Pearman rank correlation coefficient matrix for soil moisture at different soil depths across the four study sites.
3.5 Evaluation of the representative depth results of soil moisture
The temporal stability analysis identified representative soil depths for each site, and the results were evaluated using the coefficient of determination (R2) and Nash-Sutcliffe efficiency (NSE) (Figure 7). The figure illustrates the linear relationship between soil moisture content at representative soil depths and the average soil moisture content across the sites. The C. scoparium site had the highest R2 values at 0.56, indicating a moderate linear correlation. In contrast, the R2 values for the other three sites were below 0.5, ranging from 0.05 to 0.48. By calculating the NSE between the soil moisture at representative soil depths and the monthly average soil moisture at each site, the results showed NSE values ranging from −0.38 to 0.005 (Figure 6). The C. mongolicum site had the highest NSE value at 0.005, indicating that its representative result was the most reliable. The other three sites showed NSE values close to the overall average suggesting that while the results are credible, they contain some error. These variations in representative results between the sites indicate differences in their temporal stability. Nonetheless, the linear regression coefficients and NSE values suggest that the representative results for all four sites are acceptable.
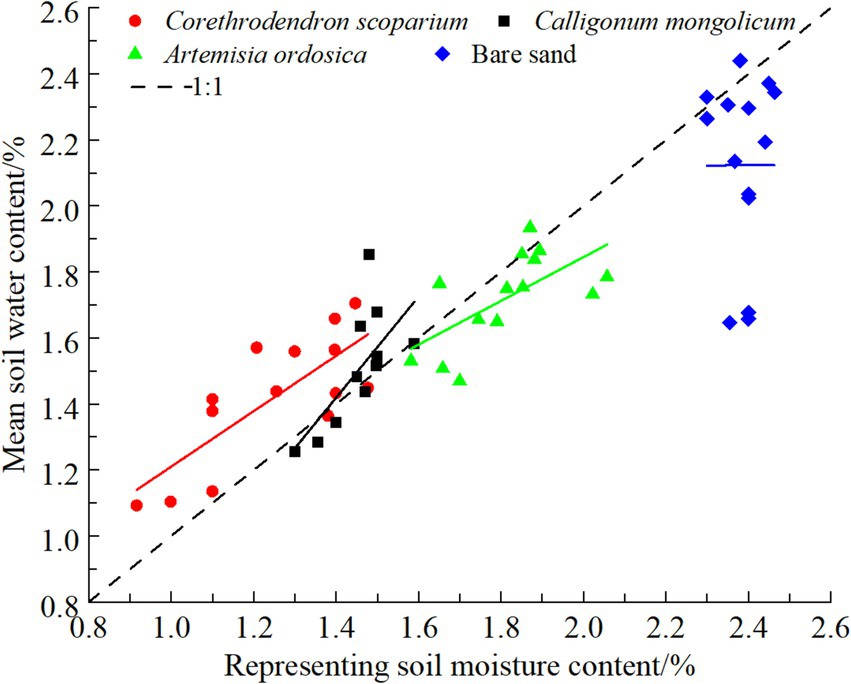
Figure 7. Comparison of soil depth, soil water content, average soil water content, and Nash coefficient (NSE) among the four plots.
4 Discussion
4.1 Spatiotemporal dynamics of soil moisture at the four sites
Precipitation is a critical source of water for soil moisture in the study area. In semiarid regions, the shallow soil layer serves as a key interface for moisture exchange with the atmosphere, experiencing significant fluctuations due to the alternating effects of irregular precipitation and soil evaporation (Feng et al., 2014). Seasonal variation in soil moisture is closely linked to precipitation, as it is the primary influencer for soil moisture replenishment. In this study, soil moisture trends at the different sites were generally consistent with the changes in precipitation, exhibiting an initial increase followed by a decrease during the growing season.
Soil moisture in the 0–60 cm layer at the C. scoparium, C. mongolicum, and A. ordosica sites was greater than at the other sites and exhibited more pronounced fluctuations. In the 100–200 cm layer, soil moisture gradually decreased, likely due to the densely distributed upper roots inhibiting moisture infiltration, as well as water uptake by shrub roots in this zone. Zhang et al. (2012) observed similar patterns in shrublands within the erosion–wind erosion transitional zone, where lower soil layers (below 100 cm) receive limited long-term precipitation replenishment. Prolonged root water absorption in these deeper layers further reduces soil moisture content. Additionally, the poor development of capillary pores and the weak water-holding capacity of sandy soil contribute to the formation of dry soil layers, mirroring the lower moisture content observed in the 100–200 cm layer across all sites in this study.
Precipitation during the monitoring period was primarily concentrated between July and September, with its uneven distribution causing significant temporal fluctuations in soil moisture. An analysis of the coefficient of variation for soil moisture across different vegetation types revealed greater variability in the 0–60 cm soil layer, while the 150–200 cm soil layer showed less variability. This discrepancy likely stems from the shallow soil layer’s greater exposure to moisture dynamics, being closer to the atmospheric–soil interface. In contrast, deeper soil layers are more insulated from external influences due to the protective overlying soil. Moreover, precipitation in the study area often occurs in a pulse-like manner, with random intensity and duration, leading to discontinuous fluctuations in shallow soil moisture. Therefore, the unpredictable nature of precipitation is the primary factor behind the intense variations in shallow soil moisture.
4.2 Temporal stability in soil moisture at the four sites
Previous studies have demonstrated that the temporal stability of soil moisture is influenced by multiple factors, including topography (Percy et al., 2020; Biswas and Si, 2011), soil texture (Gao and Shao, 2012), climate conditions (Penna et al., 2013), and vegetation growth (Zhang et al., 2016). Vegetation succession significantly alters soil properties, such as soil microbes and nutrients, which in turn impacts the relationship between vegetation and soil moisture (Jia et al., 2005). Temporal stability of soil moisture is primarily reflected through Spearman’s rank correlation coefficient and relative soil moisture differences.
The results of this study indicate that the relative soil moisture differences decrease with increasing soil depth, suggesting an increase in the temporal stability with soil depth. This finding is consistent with previous research (Xiang, 2019; Han et al., 2017; Jia, 2015). The greater temporal stability of deep soil moisture can be attributed to the reduced influence of external factors like climate, soil evaporation, vegetation, local site conditions, and human activities such as crop grading and grazing (Han et al., 2017; Liang et al., 2019), compared to shallow soil layers. On the Loess Plateau, the infiltration of precipitation is primarily concentrated in the upper soil layers (100–200 cm) leading to less variability in deeper soil moisture over time (Liu and Shao, 2014). This further highlights the increased stability of deep soil compared to shallow layers (Liu and Shao, 2014; Yang et al., 2015).
By definition, the temporal stability of soil moisture means that moisture at a given location tends to remain consistent over time, which allows for the prediction of field-average soil moisture through representative locations (Xiang, 2019; Liang et al., 2019). The analysis of temporal stability also helps determine the representative soil depth for sampling, which can optimize field sampling efforts and reduce labor. However, due to variability in soil texture and sampling periods, future studies should incorporate more extensive experimental data to further validate these findings.
5 Conclusion
In this study, long-term sequential observations were conducted in afforested areas on the northeast edge of the Tengger Desert to analyze the spatiotemporal dynamics and stability of soil moisture at four sample sites. The findings revealed significant differences in soil moisture among the four sites, with the total soil water storage ranked as follows: bare sand site (46.37 mm) > A. ordosica site (33.67 mm) > C. scoparium site (33.64 mm) > C. mongolicum site (33.50 mm). Soil moisture variability decreased with increasing depth, primarily influenced by precipitation and vegetation demand, while soil moisture stability increased with depth. Analysis using the relative difference and Spearman rank correlation coefficient methods indicated variations in temporal stability of soil moisture across different plots and soil depths. The mean relative difference (MRD) for C. scoparium and bare sand plots showed minimal variation, with short vertical error bars, suggesting higher temporal stability compared to the C. mongolicum and A. ordosica plots. The temporal stability of soil moisture was evaluated, and the representative depth was determined using both the coefficient of determination (R2) and the Nash-Sutcliffe efficiency coefficient (NSE). The representative depths for each plot were established as follows: 100 cm for C. scoparium, 150 cm for bare sand, 20 cm for A. ordosica, and 100 cm C. mongolicum. The results indicated that the C. scoparium site had the most reliable representative depth based on the determination coefficients (R2) and Nash-Sutcliffe efficiency (NSE).
Data availability statement
The raw data supporting the conclusions of this article will be made available by the authors, without undue reservation.
Author contributions
GT: Data curation, Investigation, Methodology, Software, Writing – review & editing. ZZ: Data curation, Investigation, Methodology, Software, Visualization, Writing – original draft. XJ: Conceptualization, Supervision, Writing – original draft, Writing – review & editing. HW: Data curation, Investigation, Methodology, Writing – review & editing. JL: Data curation, Investigation, Methodology, Writing – review & editing.
Funding
The author(s) declare that financial support was received for the research, authorship, and/or publication of this article. This research was funded by IWHR Research&Development Support Program (MK2021J12), the Inner Mongolia Autonomous Region Science and Technology Plan Project “Research on New Format Technology for Efficient Utilization of Water Resources in Aerial Seeding Afforestation Area of Tengger Desert in Yellow River Basin” (2022YFHH0096) and the Project of Creating Ordos National Sustainable Development Agenda Innovation Demonstration Zone (2022EEDSKJXM005).
Acknowledgments
The authors are very grateful to your participation in the research platform provided by the Pastoral Water Conservancy Science Institute of the Ministry of Water Resources, for the support provided by all the projects, and for the joint efforts of all the authors to complete this article. The authors thanks the reviewers for their help and advice, which helps us improve the quality of the manuscript.
Conflict of interest
The authors declare that the research was conducted in the absence of any commercial or financial relationships that could be construed as a potential conflict of interest.
Publisher’s note
All claims expressed in this article are solely those of the authors and do not necessarily represent those of their affiliated organizations, or those of the publisher, the editors and the reviewers. Any product that may be evaluated in this article, or claim that may be made by its manufacturer, is not guaranteed or endorsed by the publisher.
References
Bai, Y. S., Liu, M. X., Yi, J., and Zhang, H. L. (2021). Temporal stability analysis of soil moisture along a coniferous forest hillslope with subtropical monsoon climate in Southwest China. J. Mt. Sci. 18, 2900–2914. doi: 10.1007/s11629-021-6679-5
Biswas, A., and Si, B. C. (2011). Scales and locations of time stability of soil water storage in a hummocky landscape. J. Hydrol. 408, 100–112. doi: 10.1016/j.jhydrol.2011.07.027
Edivan, R. D. S., Abelardo, A. D. A. M., Suzana, M. G. M., and José, D. A. D. M. (2011). Temporal stability of soil moisture in irrigated carrot crops in Northeast Brazil. Agric. Water Manag. 99, 26–32. doi: 10.1016/j.agwat.2011.08.002
Feng, W., Yang, W. B., Li, W., Dang, H. Z., and Liang, H. R. (2014). Response of soil moisture on rainfall in the Salix psammophila fixed dunes of mu us sand land. J. Soil Water Conserv. 28, 95–99. doi: 10.13870/j.cnki.stbcxb.2014.05.017 (In Chinnese)
Gao, L., Peng, X. H., and Asim, B. (2019). Temporal instability of soil moisture at a hillslope scale under subtropical hydroclimatic conditions. Catena 187:104362. doi: 10.1016/j.catena.2019.104362
Gao, L., and Shao, M. A. (2012). Temporal stability of soil water storage in diverse soil layers. Catena 95, 24–32. doi: 10.1016/j.catena.2012.02.020
Gou, Q. Q., Han, Z. W., Du, H. Q., Sun, J. H., and Wang, G. H. (2012). Review on sandstorm sources and lts control measures in China. J. Desert Res. 32, 1559–1564.
Han, X. Y., Liu, W. Z., and Cheng, L. P. (2017). Vertical distribution characteristics and temporal stability of soil water in deep profile on the loess tableland, Northwest China. Chin. J. Appl. Ecol 28, 430–438. doi: 10.13287/j.1001-9332.201702.011
Jia, X. X. (2015). Distribution of soil water and its effect on carbon process in grassland ecosystems on the typical loess plateau. Ph. D. Thesis. Xianyang, China: Northwest A&FUniversity.
Jia, G. M., Cao, J., Wang, C. W., and Wang, G. (2005). Microbial biomass and nutrients in soil at the different stages of secondary forest succession in Ziwulin, Northwest China. For. Ecol. Manag. 217, 117–125. doi: 10.1016/j.foreco.2005.05.055
Jia, Y. H., Shao, M. A., and Jia, X. X. (2013). Spatial pattern of soil moisture and its temporal stability within profiles on a loessial slope in northwestern China. J. Hydrol. 495, 150–161. doi: 10.1016/j.jhydrol.2013.05.001
Liang, H. B., Xue, Y. Y., Li, Z. S., Gao, G., and Liu, G. H. (2022). Afforestation may accelerate the depletion of deep soil moisture on the loess plateau: evidence from a meta-analysis. Land Degrad. Dev. 33, 3829–3840. doi: 10.1002/ldr.4426
Liang, H. B., Xue, Y. Y., Shi, J. W., Li, Z. S., Liu, G. H., and Fu, B. J. (2019). Soil moisture dynamics under Caragana korshinskii shrubs of different ages in Wuzhai County on the loess plateau, China. Earth environ. Sci. Trans. R. Soc. Edinburgh 109, 387–396. doi: 10.1017/S1755691018000622
Liu, B. X., and Shao, M. A. (2014). Estimation of soil water storage using temporal stability in four land uses over 10 years on the loess plateau, China. J. Hydrol. 517, 974–984. doi: 10.1016/j.jhydrol.2014.06.003
Luca, B., Luca, C., Christian, M., Stefania, C., and Angelica, T. (1985). Soil moisture for hydrological applications: open questions and new opportunities. Water 9:140. doi: 10.3390/w9020140
Man, D. Q., Wu, C. R., Xu, X. Y., Yang, Z. H., Ding, F., and Wei, H. D. (2005). Monthly Changing Characteristics on Desert Vegetation Coverage and Eco-restoration in Southeast Fringe Area of Tengger Desert. J. Desert Res., 25, 140–144. doi: 10.1360/aps040074
Penna, D., Brocca, L., Borga, M., and Fontana, G. D. (2013). Soil moisture temporal stability at different depths on two alpine hillslopes during wet and dry periods. J. Hydrol. 477, 55–71. doi: 10.1016/j.jhydrol.2012.10.052
Percy, M. S., Riveros-Iregui, D. A., Mirus, B. B., and Benninger, L. K. (2020). Temporal and spatial variability of shallow soil moisture across four planar hillslopes on a tropical ocean island, San Cristóbal, Galápagos. J. Hydrol. 30:100692. doi: 10.1016/j.ejrh.2020.100692
Qi, J., Jiao, L., Chen, K., Qi, C. L., and Xue, R. H. (2021). Drought-wet variation of Changling Mountain in southeast of Tengger Desert since 1872. Arid Zone Res. 38, 1318–1326. doi: 10.13866/j.azr.2021.05.13 (In Chinnese)
Sur, C., Jung, Y., and Choi, M. (2013). Temporal stability and variability of field scale soil moisture on mountainous hillslopes in Northeast Asia-science direct. Geoderma 207-208, 234–243. doi: 10.1016/j.geoderma.2013.05.007
Tabari, H., Abghari, H., and Talaee, P. H. (2012). Temporal trends and spatial characteristics of drought and rainfall in arid and semiarid regions of Iran. Hydrol. Process. 26, 3351–3361. doi: 10.1002/hyp.8460
Tian, Y. J., Si, J. H., Cheng, Y. S., Pang, D. S., and Xie, Z. C. (2010). Study on the experiment of aerial sowing afforestation in sandy area of Alxa. J. Arid Land Resour. Environ. 24, 149–153. doi: 10.13448/j.cnki.jalre.2010.07.019
Vachaud, G. P., Passerat de Silans, A., Balabanis, P., and Vauclin, M. (1985). Temporal stability of spatially measured soil water probability density function. Soil Sci. Soc. Am. J. 49, 822–828. doi: 10.2136/sssaj1985.03615995004900040006x
Wang, T. J., David, A. W., Trenton, E. F., and Jeremy, H. (2015). Effect of vegetation on the temporal stability of soil moisture in grass-stabilized semi-arid sand dunes. J. Hydrol. 521, 447–459. doi: 10.1016/j.jhydrol.2014.12.037
Wang, X. P. P., Pan, Y. X., Zhang, Y. F., Dou, D., Hu, R., and Zhang, H. (2013). Temporal stability analysis of surface and subsurface soil moisture for a transect in artificial revegetation desert area, China. J. Hydrol. 507, 100–109. doi: 10.1016/j.jhydrol.2013.10.021H
Xiang, D. L. (2019). Spatial-temporal variability of soil moisture and influencing factors in northwest arid area of China Ph. D. Thesis: University of Chinese Academy of Sciences, Beijing, China.
Xu, M., Xu, G., Cheng, Y., Min, Z., Li, P., Zhao, B., et al. (2021). Soil moisture estimation and its influencing factors based on temporal stability on a semiarid sloped forestland. Front. Earth Sci. 9:629826. doi: 10.3389/feart.2021.629826L.
Xu, G. C., Zhang, T. G., Li, Z. B., Li, P., Cheng, Y. T., and Cheng, S. D. (2017). Temporal and spatial characteristics of soil water content in diverse soil layers on land terraces of the loess plateau, China. Catena 158, 20–29. doi: 10.1016/j.catena.2017.06.015
Yang, L., Chen, L. D., and Wei, W. (2015). Effects of vegetation restoration on the spatial distribution of soil moisture at the hillslope scale in semi-arid regions. Catena 124, 138–146. doi: 10.1016/j.catena.2014.09.014
Yang, T. T., Musa, A., Zhang, Y. S., Wu, J. B., Wang, A. Z., and Guan, D. X. (2018). Characteristics of soil moisture under different vegetation coverage in Horqin Sandy land, northern China. PLoS One 13:e0198805. doi: 10.1371/journal.pone.0198805
Yao, Y. L., Liu, Y., Zhou, S., Song, J., and Fu, B. (2023). Soil moisture determines the recovery time of ecosystems from drought. Glob. Chang. Biol. 29, 3562–3574. doi: 10.1111/gcb.16620 J. X Fu, B.J
Zhang, Y. W., Deng, L., Yan, W. M., and Shangguan, Z. P. (2016). Interaction of soil water storage dynamics and long-term natural vegetation succession on the loess plateau, China. Catena 137, 52–60. doi: 10.1016/j.catena.2015.08.016
Zhang, Q., Qi, T., Singh, V. P., Chen, Y. D., and Xiao, M. (2015). Regional frequency analysis of droughts in China: a multivariate perspective. Water Resour. Manag. 29, 1767–1787. doi: 10.1007/s11269-014-0910-x
Zhang, P. P., and Shao, M. A. (2013). Temporal stability of surface soil moisture in a desert area of northwestern China. J. Hydrol. 505, 91–101. doi: 10.1016/j.jhydrol.2013.08.045
Zhang, C. C., Shao, M. A., and Wang, Y. Q. (2012). Spatial distribution of dried soil layers under different vegetation types at slope scale in loess region. Chin. Soc. Agric. Eng. 28:102-108+8. doi: 10.3969/j.issn.1002-6819.2012.17.015
Zhao, C. G., Li, H. Y., Yu, T. F., Chen, W. Y., Xie, Z. C., Zhang, B. W., et al. (2022). Effects of artificial vegetation construction on soil physical properties in the northeastern edge of Tengger Desert. Arid Zone Res. 39, 1112–1121. doi: 10.13866/j.azr.2022.04.12 (In Chinnese)
Zhao, Y., Peth, S., Wang, X. Y., Lin, H., and Horn, R. (2010). Controls of surface soil moisture spatial patterns and their temporal stability in a semi-arid steppe. Hydrol. Process. 24, 2507–2519. doi: 10.1002/hyp.7665
Zhao, Z. M., Shen, Y. X., Wang, Q. H., and Jiang, R. H. (2020). The temporal stability of soil moisture spatial pattern and its influencing factors in rocky environments. Catena 187:104418. doi: 10.1016/j.catena.2019.104418
Keywords: flying shrubs, artificial forests, soil moisture, temporal stability, depth representativenes
Citation: Tang G, Zhao Z, Jin X, Wu H and Li J (2024) Soil moisture content and its temporal stability in an arid aerial seeding afforestation area after 30 years vegetation restoration in China. Front. For. Glob. Change. 7:1452760. doi: 10.3389/ffgc.2024.1452760
Edited by:
Yang Yu, Beijing Forestry University, ChinaReviewed by:
Chenfeng Wang, Chinese Academy of Sciences (CAS), ChinaShaokun Wang, Chinese Academy of Sciences (CAS), China
Copyright © 2024 Tang, Zhao, Jin, Wu and Li. This is an open-access article distributed under the terms of the Creative Commons Attribution License (CC BY). The use, distribution or reproduction in other forums is permitted, provided the original author(s) and the copyright owner(s) are credited and that the original publication in this journal is cited, in accordance with accepted academic practice. No use, distribution or reproduction is permitted which does not comply with these terms.
*Correspondence: Xiaolin Jin, MjIwMTAwMDNAbWFpbC5pbXUuZWR1LmNu
 Guodong Tang
 Zhenyu Zhao
 Xiaolin Jin3,4*
 Hao Wu
 Jinrong Li