 Tereza Hüttnerová
 Peter Surový
- Faculty of Forestry and Wood Sciences, Czech University of Life Sciences Prague, Prague, Czechia
Forest ecosystems are long-term exposed to dry periods in Europe, which leads to a significant loss of vitality and higher mortality, especially in coniferous forests. Identifying stress in the early stages when measures can be taken to protect the forest and living trees is crucial. Current detection methods are based on field surveys by forest workers or remote sensing methods to cover larger areas, which use changes in spectral reflectance of the forest canopy. In some cases, the attacked trees do not change their appearance, and based on calculations of vegetation indices from remote sensing data, the attack cannot be mapped. We present an innovative methodology based on non-optical analysis, namely identifying a group of volatile compounds and microclimate signs in forest stands that indicate stress factors in forest stands. An attacked tree by a bark beetle produces increased amounts of biogenic volatile organic compounds associated with defense, and the microclimate changes due to interrupted transpiration. In addition, the bark beetle uses the aggregation pheromone to attract more individuals and to attack the tree massively. In this study, we tested three electronic noses (Miniature Bosch sensor device with 25,419 samples, Sensory device for environmental applications with 193 samples, Handheld VOC Detector Tiger with 170 samples) in a freshly infested spruce stand. The measurement was conducted at ground level with the help of a human operator and was repeated six times to verify the detection capability of the electronic noses. To verify the capability of electronic noses to predict tree infestation, we used machine learning Random Forest. The results demonstrated that electronic noses can detect bark beetle infestation start (within 1 week of the first attack). The Miniature Bosch sensor device achieved the highest accuracy with a value of 95%, in distinguishing forest sections that are healthy and infested; the second most accurate electronic nose is the Sensory device for environmental applications, with an accuracy of 89%. Our proposed methodology could be used to detect bark beetle presence.
1 Introduction
Coniferous forest stands have been grappling with intense stress recently, including fires, drought, windstorms, and insect pests. The leading causes of damage are biotic disturbances, especially insect infestation. The resistance of the forest stand to stress is directly related to its vitality and the level of insect attack. Among the most significant pests are insects that feed on the bast fibers of living trees, such as the Eurasian spruce bark beetle (Ips typographus (L.)) (Hais et al., 2016; Fernandez-Carrillo et al., 2020; Bárta et al., 2021). The emergence of bark beetles is often associated with increased temperature and drought, and the intensity of infestation depends on the complex interaction between the bark beetle, climatic conditions, forest conditions, and extreme natural events such as storms and fires (Schelhaas et al., 2003; Jönsson et al., 2012; Marini et al., 2017; Hlásny et al., 2019; Patacca et al., 2023; Netherer et al., 2024).
Stressed trees under bark beetle attack secrete several times more biogenic volatile organic substances (mostly α-pinene, camphene, myrcene) than under resting conditions (Ghimire et al., 2016; Jaakkola et al., 2022; Hakola et al., 2023; Lehmanski et al., 2023; Netherer et al., 2024). In the event of an attack by the Eurasian spruce bark beetle, as part of the chemical communication between these individuals, an aggregation pheromone is secreted, composed of 2-methyl-3-buten-2-ol and cis-verbenol (Birgersson et al., 1984; Netherer et al., 2021; Moliterno et al., 2023). In addition to chemical changes, tree damage by bark beetles brings other non-optical symptoms, such as a change in the microclimate. Forest understories locally influence the microclimate, and compared to open areas, provide lower average temperatures and higher air humidity (Geiger et al., 1995; Morecroft et al., 1998; Aussenac, 2000; Kašpar et al., 2021). A healthy tree has transpiration 200–300 liters of water per day; in case of damage, the ability to transpire is impaired or completely stopped. In the case of reduced transpiration capacity of damaged trees, the temperature buffering decreases, and thus, leads to a higher temperature and lower air humidity (Kopáček et al., 2020).
Monitoring natural disturbances in a forest ecosystem is a key element for forest management and in forest-protected areas like national parks for taking precautionary measures (tourism safety, fire, etc.). Early identification of stress conditions of forest stands can prevent significant economic and ecological damage. A very accurate but time-consuming method is a field inspection by forest experts; during a field visit, each tree can be carefully mapped, and it is also possible to record the initial state of infestation based on observing the first beetle entrance holes, boring dust on the trunk, and resin flows (Birgersson et al., 1984; Abdullah et al., 2019a; Bárta et al., 2022; Bozzini et al., 2024). This technique cannot be used to check extensive forest stands or hard-to-reach locations and requires a very close visual examination of each tree to identify symptoms of infestation. For larger areas, remote sensing methods are used, and a suitable carrier (satellite, aircraft, drone) is chosen according to the required resolution and characteristics of the study area. Health status can be observed based on the different spectral reflectance of vegetation, for example, Piecewise index PI B(710 + 738–522), Greenness GI, NDVI GREEN/NIR, Normalized difference photochemical reflectance index PRI, and ANCB index (Gitelson and Merzlyak, 1997; Zarco-Tejada et al., 2001; Le Maire et al., 2004; Zhang et al., 2018; Bárta et al., 2022). Canopy change methods monitoring deviations in spectral reflectance cannot identify early attacks; approximately only 40% of attacked trees change their spectral expression in the crown, and if a change occurs after 6–10 weeks, the red or gray attack is not timely enough (Kautz et al., 2023; Bozzini et al., 2024). True early methods deal with bark beetle pheromone detection based on a specially trained dog, which can upwind orientation to the pheromone plume from single trees under attack up to 150 m (Johansson et al., 2019) and, compared to visual human detection, achieves significantly better results in identifying an early attack (Vošvrdová et al., 2023).
Non-optical mapping, namely the monitoring of a group of volatile compounds and microclimate cues, appears to be a promising method. New sensors utilizing microchip architecture and electronic nose technology have recently emerged. These sensors can convert the concentration of chemical substances into electrical signals, which are then transformed into digital numbers. Over the past decade, there has been a significant increase of interest for using electronic sensors across various applications (food product quality control, air quality monitoring, disease diagnosis, and environmental monitoring). This trend reflects the growing awareness of the possibilities electronic sensors offer in ensuring accurate, reliable, and efficient data collection, which significantly benefits research, industry, and public health (Pobkrut et al., 2016; Cellini et al., 2017; Xing et al., 2019; Tiele et al., 2020; Fuentes et al., 2021). Due to continuous technological advances, weight reduction, and better integration with other devices, electronic sensors are becoming capable of greater detection accuracy. Electronic sensors are evaluated based on sensitivity given in units of ppb (parts per billion). These criteria are key in assessing the ability of sensors to provide reliable and accurate measurements in various environments and applications (Deshmukh et al., 2015; Ye et al., 2021).
In this research, we followed up on our previous study (Hüttnerová et al., 2023), where we demonstrated the detectability of a substance indicating the presence or proximity of infested and dead trees with an electronic nose Sniffer4D. Data collection occurred on three different height levels (ground, 60 m, 80 m); the best results were achieved by a wide-range Hydrogen Chloride (HCL) Sensing Module at ground level. No correlation between stress compounds and distance from infested trees was recorded above the forest canopy, which can be caused by higher airflow divergence in the area above the forest canopy. The study by Vošvrdová et al. (2023), which focuses on identifying synthetic semiochemicals in the forest by a specially trained dog, confirms the possibility of ground detectability. In this study, we focus on ground-taken data for benchmarking several sensor responses to the presence of attacked trees.
We hypothesized that specific chemical compounds present in the forest stand during a stress event (bark beetle attack) would be detectable by electronic nose. We assumed that trees that are infested by bark beetles would produce more volatile organic compounds, and the stress of trees would lead to a change in their temperature and humidity profile. At the same time, aggregation pheromones, which bark beetles use to communicate, will be present in the forest. In the case of the ability of electronic noses to detect an increased amount of volatile organic substances or the presence of an aggregation pheromone or changes in the temperature or humidity profile, we will be able to identify an attack in the early stage of infestation and thus prevent enormous economic and ecological losses. The main goals of this research were (1) to evaluate the ability of electronic sensors to detect bark beetle infestation (2) to determine which factors influenced the most often measured increased values near attacked trees. We assessed the measured values with electronic noses in a spruce stand attacked by the Eurasian spruce bark beetle and in a healthy stand using a machine learning algorithm.
Following our previous study and the ever-expanding insect pests destroying valuable forest ecosystems, we asked the following specific research questions:
1. Can the tested electronic sensors capture specific substances that identify stress in the forest ecosystem?
2. Which electronic nose achieved the most accurate results based on the machine learning evaluation?
3. What model variables were the most significant predictors for stress detection in the forest stand?
2 Materials and methods
2.1 Study area
The study area of 1.42 ha was located 35 km south-east of Prague; the forest stands to fall into category 32d – Forests with aiming forestry research and forestry education; the area was represented by monoculture Norway spruce [Picea abies (L.) Karst.] in age class 5 (81–100 years). Data collection took place on September 4th, 2023 (11:10 a.m. – 1:10 p.m.); the outside temperature was around 19°C, and humidity 46%. The mean annual temperature of the study area in 2023 was 10.4°C; the long-term average temperatures in the Central Bohemian Region and Prague is 9.3°C. The maximum temperature, 19.0°C, was recorded in July, and the minimum temperature, −0.6°C, was recorded in January. The mean annual precipitation in 2023 was 607 mm, whereas the long-term average in the region is 583 mm (Czech Hydrometeorological Institute, 2023).
Data collection was performed six times, and the measurement trajectory was kept identical for a possible evaluation of the sensitivity of the sensors (Figure 1). The trajectory was chosen in the shape of figure eight to evaluate the sensors’ response to the occurrence of stress factors in the forest ecosystem. The research area was one with a size of 1.42 ha; the invaded area was approximately 80 × 50 m. Each collection took approximately 15–20 min (6 repetitions) when the operator slowly walked through the study area and simultaneously collected data by all electronic sensors at ground level. Our approach is not based on detecting individual trees but on detecting an area (area-based method).
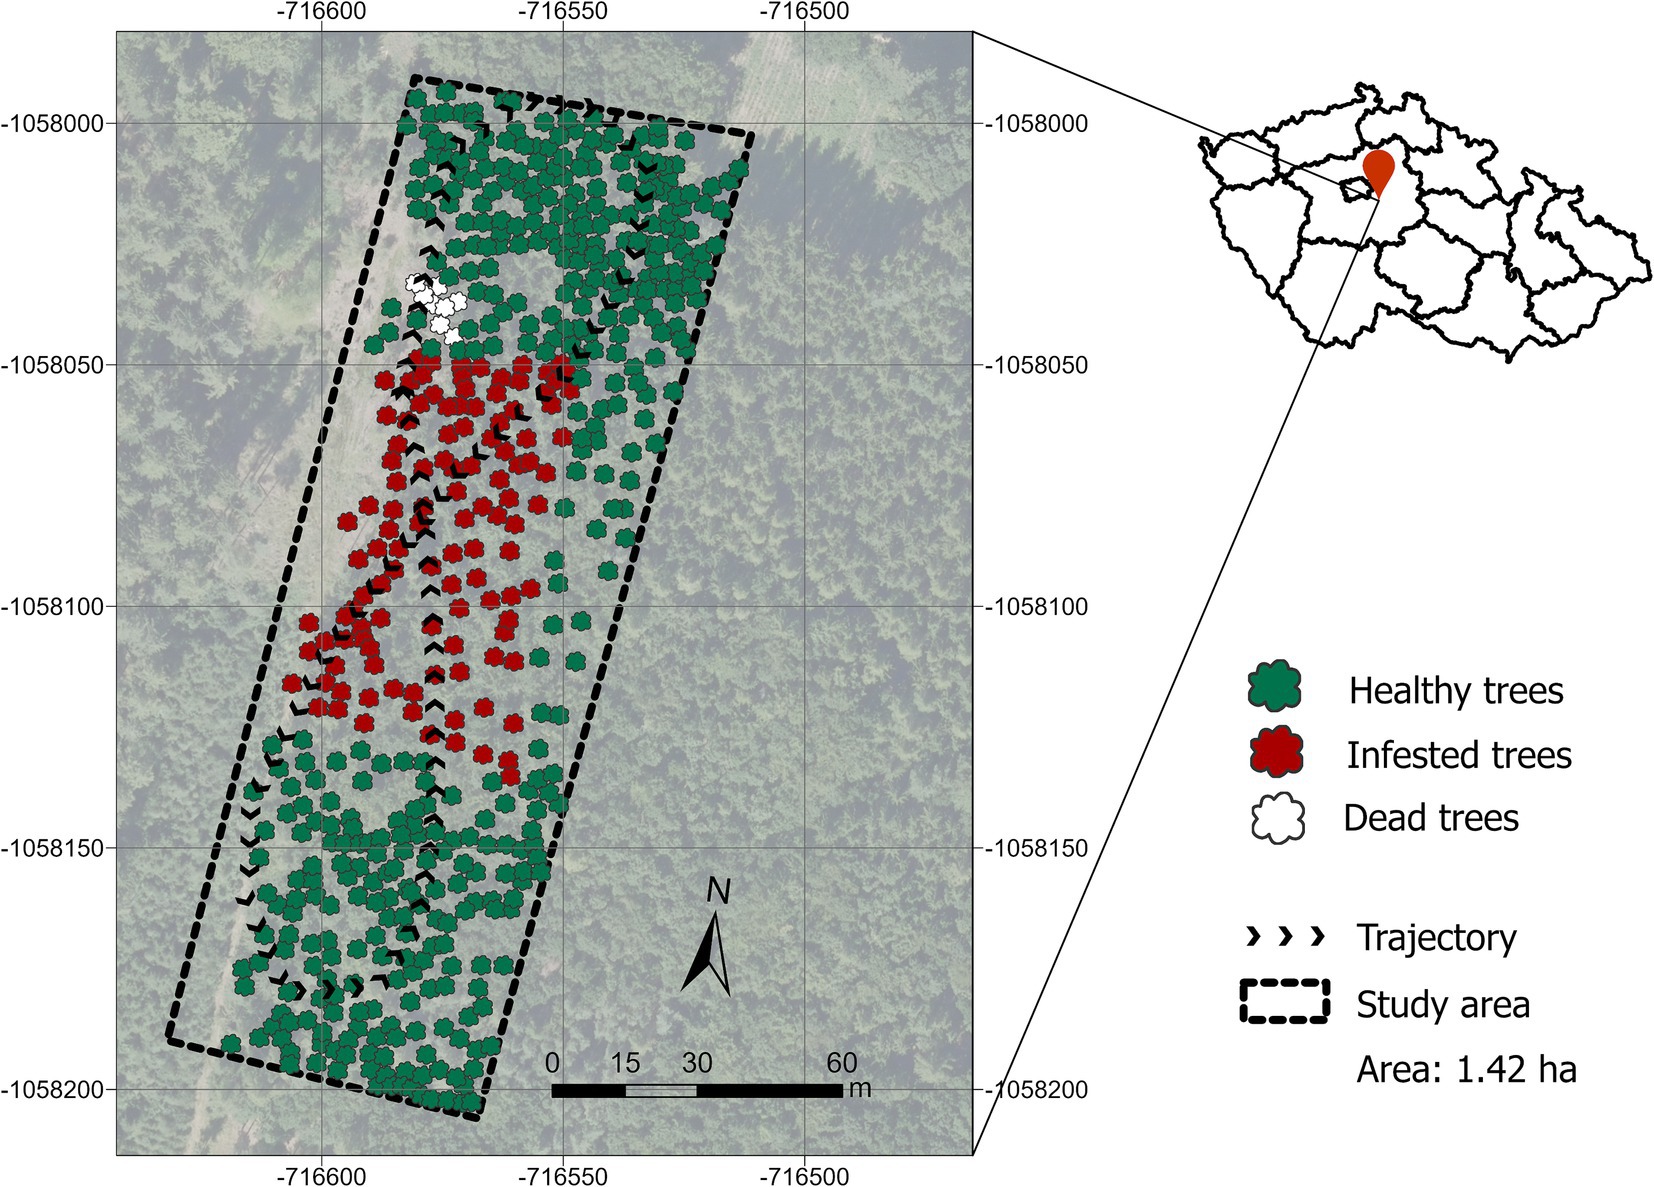
Figure 1. The study area 35 km away from Prague (Prague West district, Czechia) displays a forest stand, which was heavily infested by bark beetles (infested trees are marked red, healthy ones in green, and dead trees in white). Black arrows mark the trajectory of data collection.
2.2 Materials
Three electronic noses were used as part of data collection to verify their suitability for stress mapping in forest ecosystems. Two sensors are commercially available on the regular market, and one sensor was specifically designed for environmental measurements. Therefore, it is described in detail below.
2.2.1 Miniature Bosch sensor device © Bosch Sensortec GmbH 2023 (Bosch)
This sensor was the BME688 AI miniature environmental sensing device, which can detect volatile organic compounds, volatile sulfur compounds and other gases like carbon monoxide and hydrogen in the ppb resolution. The sensor includes a unit for measuring temperature in the range of −40-85°C with sensitivity ±1°C, a humidity sensor in the range of 0–100% with sensitivity ±3%, a unit for measuring pressure in the range of 300–1,100 hPa with sensitivity ±1 hPa, and a Metal-Oxide Semiconductor (MOX) gas sensor. The manufacturer does not directly state the range and sensitivity of the MOX sensor unit but based on the general characteristics of MOX sensors and the focus on the Air Quality Index (AQI), which Bosch company describes in the datasheet, it can be estimated that the sensor can detect VOCs in the tens of ppb.
2.2.2 Sensory device for environmental applications (SDEA)
The next device for monitoring the bark beetle is designed as a mobile unit powered by an accumulator and containing two basic parts—a source part that is fixed in the lower part of the carrier and a sensor part located on a support rod at a height of about 60 cm above the head of the experimenter (Figure 2).
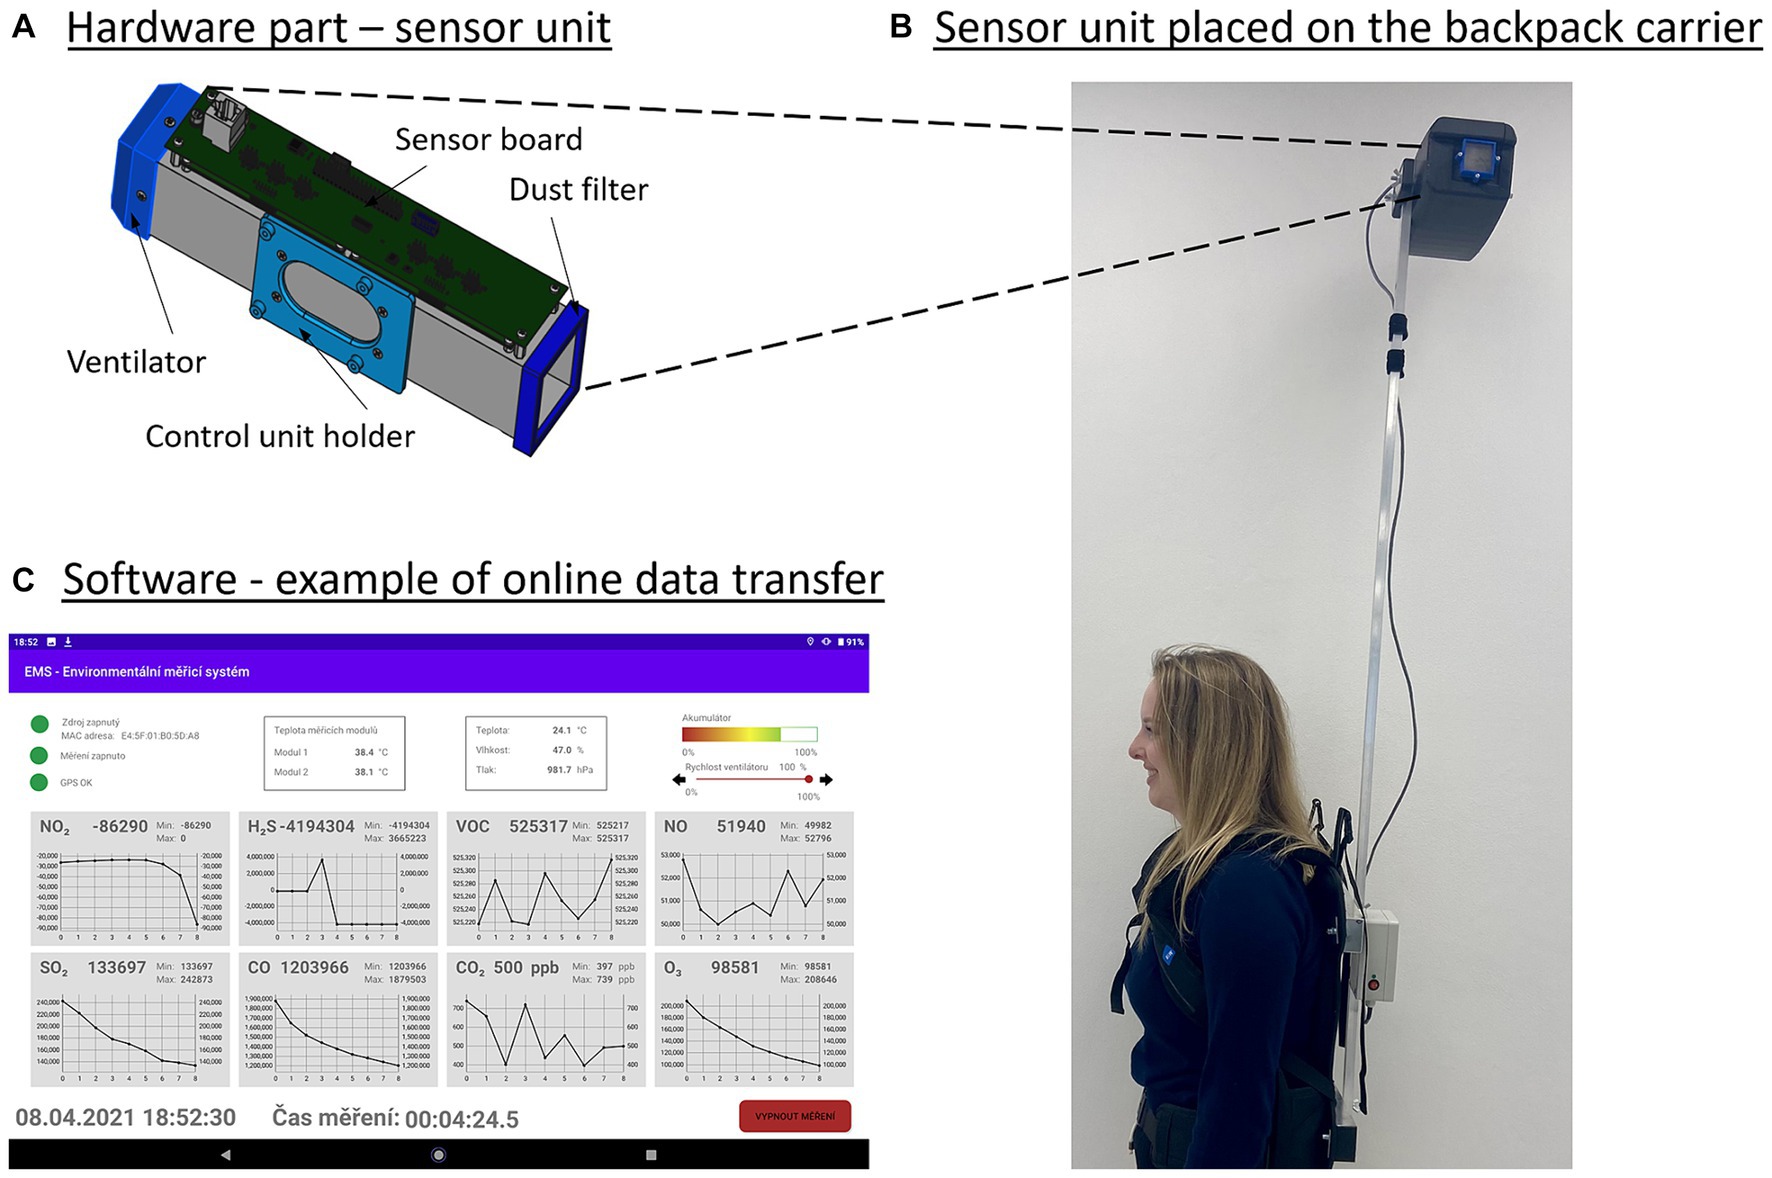
Figure 2. Comprehensive overview of the Sensory device for environmental applications: (A) sensor unit assembly consisting of the ventilator, control unit holder, dust filter, and sensor board; (B) the main sensory part is located 60 cm above the operator’s head; (C) software part: layout of data on the notepad screen. The notepad screen is divided into four parts: an informative part at the top left (three items marked with status—source, measurement, and GPS), measured values at the top of the screen + fan speed, a part containing eight graphs for estimated quantities, and a status line at the bottom of the screen.
The source unit and the sensor part are connected to each other by a cable, enabling both power supply to the sensor part and communication between the two units. The source unit contains the accumulator, the circuits for charging the accumulator, and the circuits for monitoring the status of the source unit. The sensor unit is in a removable cover and contains sensors in a tunnel formed by an aluminum profile. Air enters the tunnel through a dust filter and is extracted by a fan on the opposite side of the aluminum profile. Holes are made in the profile, in which sensors for individual types of gas are stored, and their outputs are processed by the control unit located on the handle on the side of the profile.
Individual sensors include:
• NO2 electrochemical sensor, range 20 ppm, sensitivity in the order of ppb
• H2S electrochemical sensor, range 400 ppm, sensitivity in the order of ppb
• VOC photoionization sensor, range 40 ppm, sensitivity in the order of ppb (isobutylene)
• NO electrochemical sensor, range 20 ppm, sensitivity in the order of ppb
• SO2 electrochemical sensor, range 50 ppm, sensitivity in the order of ppb
• CO electrochemical sensor, range 500 ppm, sensitivity in the order of ppb
• CO2 IR/thermopile sensor, range 5,000 ppm, sensitivity 1 ppm
• O3 electrochemical sensor, range 20 ppm, sensitivity in the order of ppb
The sensors, together with the electronics, are placed on the sensor board and their measuring part extends into the space of the measuring tunnel. The exception is the temperature and humidity sensor, which is located on the side (against the control unit holder, not visible in the picture). The entire sensor unit is controlled by a Raspberry microcomputer, which takes analog values from individual sensors, converts them into numerical data, and converts these data according to set conversion coefficients and data in measurable units, namely ppb or ppm. At the same time, it controls the work of the sensors, because some sensors have time delays between individual measurements, or it is necessary to turn them on and off to save batteries.
The last part of the system is a regular notepad, which communicates with the Raspberry control unit using the Bluetooth interface and is used to control the sensor unit, display, and save the measured values. The statuses of the individual processes are displayed in the informative section at the top left. As long as the source is turned off or the measuring application is not running, which means that Bluetooth communication is not turned on, the status of the source is red and cannot be measured. After establishing a connection with the measuring device, the status wheel turns green, which means measuring is possible. The correct GPS function is indicated separately, as the location data is part of the recording.
Furthermore, the upper part contains environmental data on the state of the air in the measured location (temperature, humidity, and pressure) and the state of the measuring device, especially the temperature of the individual measuring modules. These are important for correcting the measured values of electrochemical sensors, as they are highly temperature dependent. Battery status and airflow rate in the measuring unit are on the far right of the display.
The last icon on the display is a green button that sets one of three values:
• Measurement initialization (from the measurement status off),
• Turn on the measurement (from the measurement initialization state),
• Turn off the measurement (from the measurement status on).
Simultaneously with online measurement, a set of measured data is written at regular intervals, which has the following structure (in.csv format separated by semi-colons):
<Date and Time>; <GPS: number of satellites>; <GPS: accuracy [m]>; <Latitude [°]>; <Longitude [°]>; <Fan speed [%]>; <NO2 [ppb]>; <H2S [ppb]>; <VOC [ppb]>; <NO [ppb]>; <SO2 [ppb]>; <CO [ppb]>; <CO2 [ppb]>; <O3 [ppb]>; <Temperature of module 1 [°]>; <Temperature of module 2 [°]>; <Battery status [%]>; <Outside temperature [°]>; <Pressure [hPa]>; <Relative Humidity [%]>.
2.2.3 Handheld VOC Detector Tiger © 2024 Ion Science UK. Ion Science is registered trademark on Ion Science Ltd. (Tiger)
Detector Tiger has photoionization technology (PID) for detecting volatile organic compounds. The detector can display measured values very quickly and accurately. It is suitable for screening and locating, for example, leaking dangerous gases. The sensor system has a response time of 2 s and can detect up to 750 volatile organic substances. The range of the sensor is 0–20,000 ppm with sensitivity 1 ppb. Figure 3 shows the Miniature Bosch sensor device and Handheld VOC Detector Tiger.
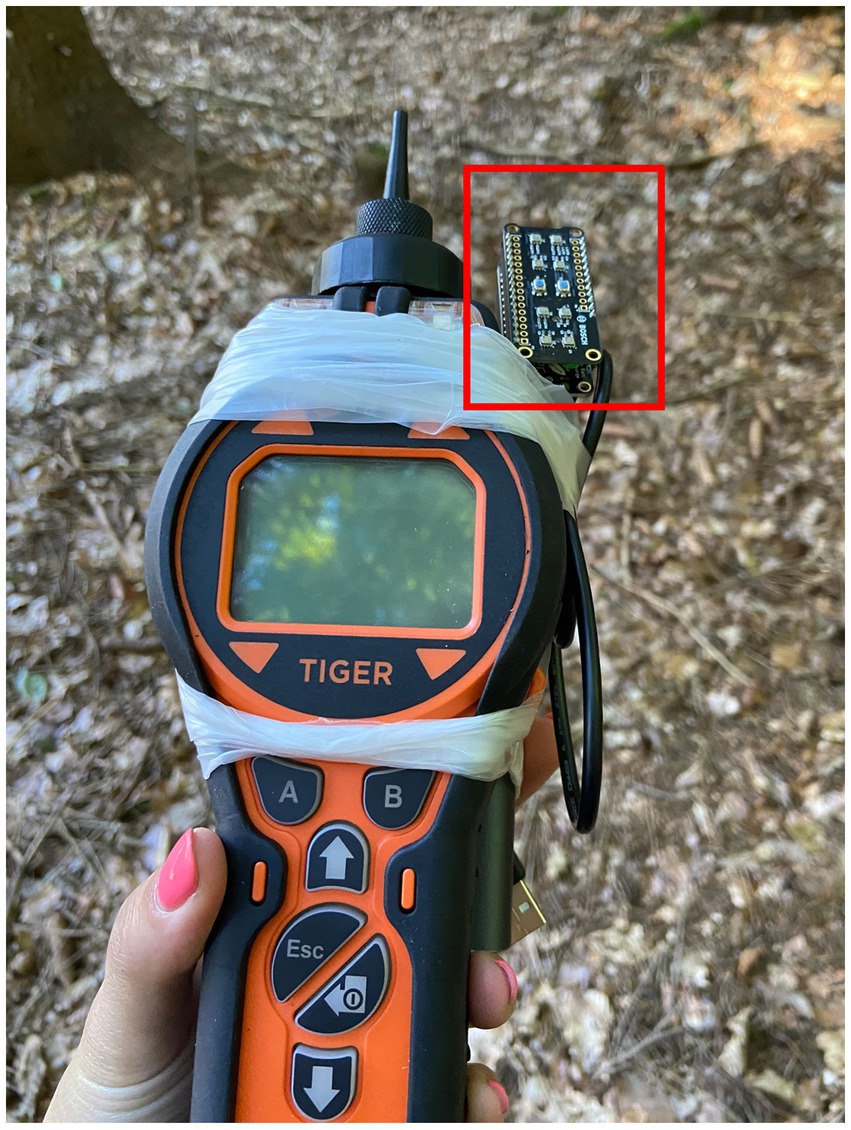
Figure 3. On the left side is Handheld VOC Detector Tiger, in the upper right in the red rectangle is Miniature Bosch sensor device.
2.3 Data processing
First, we evaluated the health status of the trees in the study area; the trees were classified into three categories (dead, infested, and healthy). The assessment was carried out in two ways; first, based on a field investigation, the bark of the trees was inspected with a focus on locating the bark beetle entrance holes, boring dust on the trunk, and resin flows. Natural infestation (without chemical baiting) of coniferous trees was within a week of the first attack by the bark beetle, and the study area was selected based on consultation with Field technician, who performs regular checks of the status of trees. The second method for determining the state of health was based on optical data obtained from a UAV; the area was captured with a DJI Phantom4 Pro multirotor with an RGB camera at the height of 90 m, and the images were processed using the Structure from Motion method. We visually evaluated the spectral characteristics of the tree canopy from the orthophoto mosaic (Figure 4). Spruce trees in the study area were categorized [healthy, attacked, dead] and stored as a point layer.

Figure 4. An example of the health status of the trees on the orthomosaic: (A) dead trees, (B) infested trees, (C) healthy trees.
The measurement results from the sensors were exported in.csv format, we used the R Studio and ArcGIS Pro software’s for all data analysis. Each electronic nose measurement dataset was annotated by two labels (infested forest, healthy forest). These labels were assigned based on the position of the measurement within the forest. Using the Select by Location functionality, measurement positions in the attacked stand were selected and assigned the “Infested” attribute. The procedure was repeated for measurement positions in the healthy part of the forest, and the “Healthy” attribute was assigned. Due to the low number of dead trees, they were not considered in the machine learning models.
We train machine learning algorithm Random Forest (Breiman, 2001), which is widely used for classification tasks in environmental studies. The input data for the model does not have to be standardized, which ensures a more straightforward interpretation of the results (Müller et al., 2022). We used the R package randomForest (Liaw and Wiener, 2002), caret (Kuhn, 2008), kernlab (Karatzoglou et al., 2004), and boot (Davison and Hinkley, 1997) to create three binary classifications for each dataset measured by the electronic nose (Sensory device for environmental applications, Handheld VOC Detector Tiger, Miniature Bosch sensor device). The dataset was split 80:20 into training and validation sets. We used the resampling method repeatedcv., which is used to set K-fold cross-validation, and for the repeats argument, we chose the value three, and this argument controls the number of repetitions; the K parameter is regulated by the number argument, which we chose 20 (Kuhn, 2008). The goal was to find out which electronic nose has the most sensitive predictive ability and what variables affect the values of electronic nose sensors. We selected the explanatory variables based on the technical equipment of the sensor. The machine learning model was based on 25,419 samples for the Miniature Bosch sensor device, 193 samples for the Sensory device for environmental applications, and 170 samples for the Handheld VOC Detector Tiger. The number of samples varied depending on the time resolution of the electronic nose for recording values; data collection was carried out simultaneously by all three electronic sensors along the same trajectory.
2.3.1 Miniature Bosch sensor device
We used input explanatory variables of outside temperature (Temperature), pressure (Pressure), relative humidity (Humidity), and data collection number (Data_col). The Bosch device provides one information about chemical measurement, and that is Resistance. Gassenzor (Gas), which we used for the dependent variable in the model. We used the following model formula:
2.3.2 Sensory device for environmental applications
For Sensory devices for environmental applications, we used input explanatory variables such as outside temperature (Outside_tem), temperature of module 1 (TEM_mod1), temperature of module 2 (TEM_mod2), pressure (Pressure), relative humidity (Humidity), and data collection number (Data_col). This electronic nose is equipped with several cross-sensitive sensors which can record values for all sensors simultaneously, so the explanatory variables of the gases were NO2, H2S, VOC, NO, SO2, CO, CO2, O3. We used the following model formula:
2.3.3 Handheld VOC Detector Tiger
This sensor device is not equipped with a temperature, humidity, and pressure monitoring unit. The Tiger detector contains a gas library primarily focused on safety monitoring; within the software settings, measuring and recording information on one compound at a time is possible. We collected data for pinene in the first and second measurements, methyl-butanol in the third, camphene in the fourth measurement, carene in the fifth, and pinene again in the sixth measurement. For evaluation we used explanatory variables of gas response (Gas), and data collection number (Data_col). We used the following model formula:
3 Results
First, the results achieved for individual electronic noses will be described from the highest predictive ability of the models to the lowest. Then, the importance of the variables will be presented.
3.1 Miniature Bosch sensor device
The best model is selected automatically by the random forest algorithm, based on the highest accuracy, the outputs also provide set of best solutions based on the amount of variables included in the model (mtry), and kappa accuracy which is another way of measuring the performance especially in imbalanced datasets (Cohen, 1960). The results show the same accuracy for all the combinations of variables, mean the simpler model (the one with two variables) might be easier for future practical applicability (Table 1).
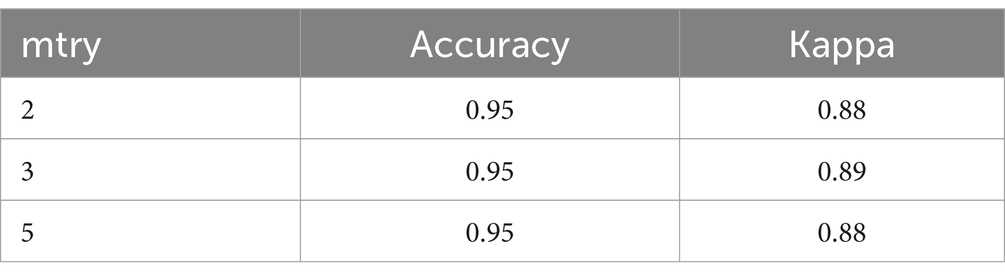
Table 1. Results for different amount of random variables for the Miniature Bosch sensor device.
The Confusion Matrix is used to evaluate the performance of the classification model; it shows how often the actual classes were confused with the predicted ones. In the prediction part of the testing, accuracy 0.95 was achieved with a Kappa value 0.89. The sensitivity (true positive rate) was 0.97, and the specificity (true negative rate) was 0.91. The Confusion Matrix is used to evaluate the performance of the classification model; it shows how often the actual classes were confused with the predicted ones (Table 2).
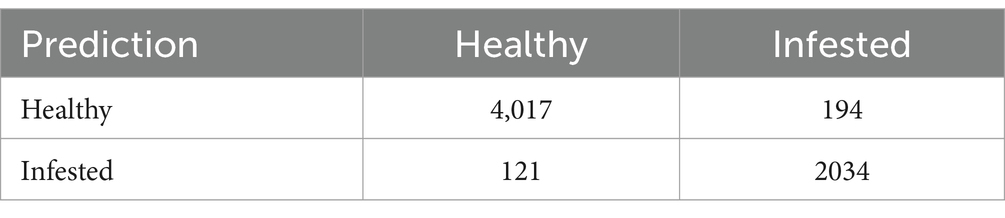
Table 2. Confusion matrix values for the Miniature Bosch sensor device.
3.2 Sensory device for environmental applications
The best model is selected automatically by the random forest algorithm, based on the highest accuracy. The results in Table 3 show the highest accuracy (0.89) for the combination with eight variables (mtry).
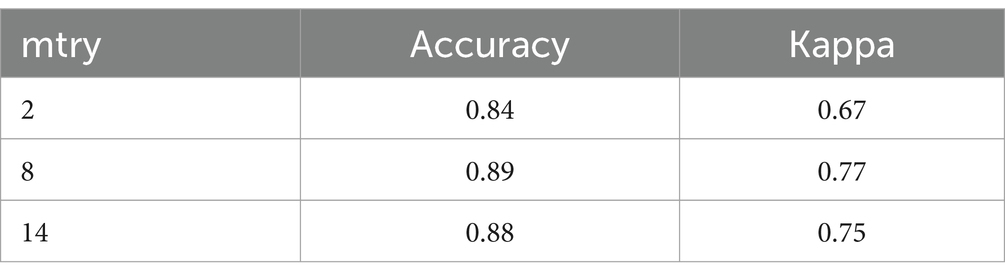
Table 3. Results for different amount of random variables for the Sensory device for environmental applications.
In the prediction part of the testing, accuracy 0.93 was achieved with a Kappa value 0.84. The sensitivity (true positive rate) was 1.00, and the specificity (true negative rate) was 0.81. Detailed confusion matrix values for the Sensory device for environmental applications are shown in Table 4.
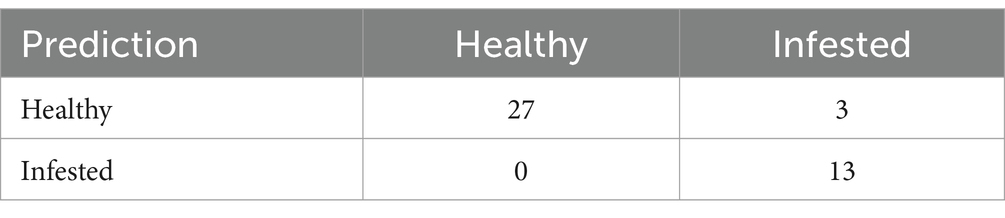
Table 4. Confusion matrix values for the Sensory device for environmental applications.
3.3 Handheld VOC Detector Tiger
The tuning parameter “mtry” was held constant at a value of 2 (Table 5). The third of the sensors Handheld VOC Detector Tiger, received Kappa 0.16, and its predictive ability for forest stress detection was the lowest.

Table 5. Results for the Handheld VOC Detector Tiger.
In the prediction part of the testing, accuracy 0.65 was achieved with a Kappa value 0.21. The sensitivity (true positive rate) was 0.85, and the specificity (true negative rate) was 0.35. Detailed confusion matrix values for the Handheld VOC Detector Tiger are shown in Table 6.
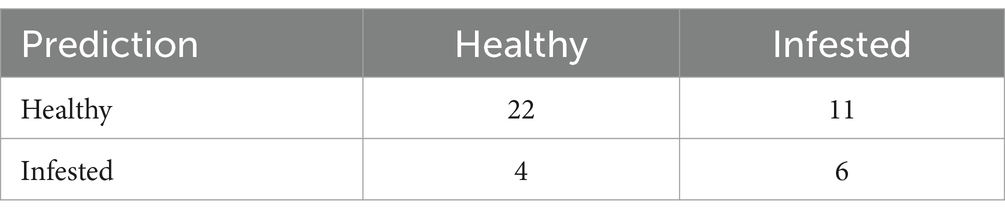
Table 6. Confusion matrix values for the Handheld VOC Detector Tiger.
The importance of the variables for all tested electronic noses is shown in Figure 5. It was determined by the varImp function from the R software caret package, which provides information about the importance of variables for machine learning algorithms. The importance score of 100 indicates that the variable affects the model predictions most, while the variable with an importance score of 0 is irrelevant to the model’s predictive ability, i.e., the least.
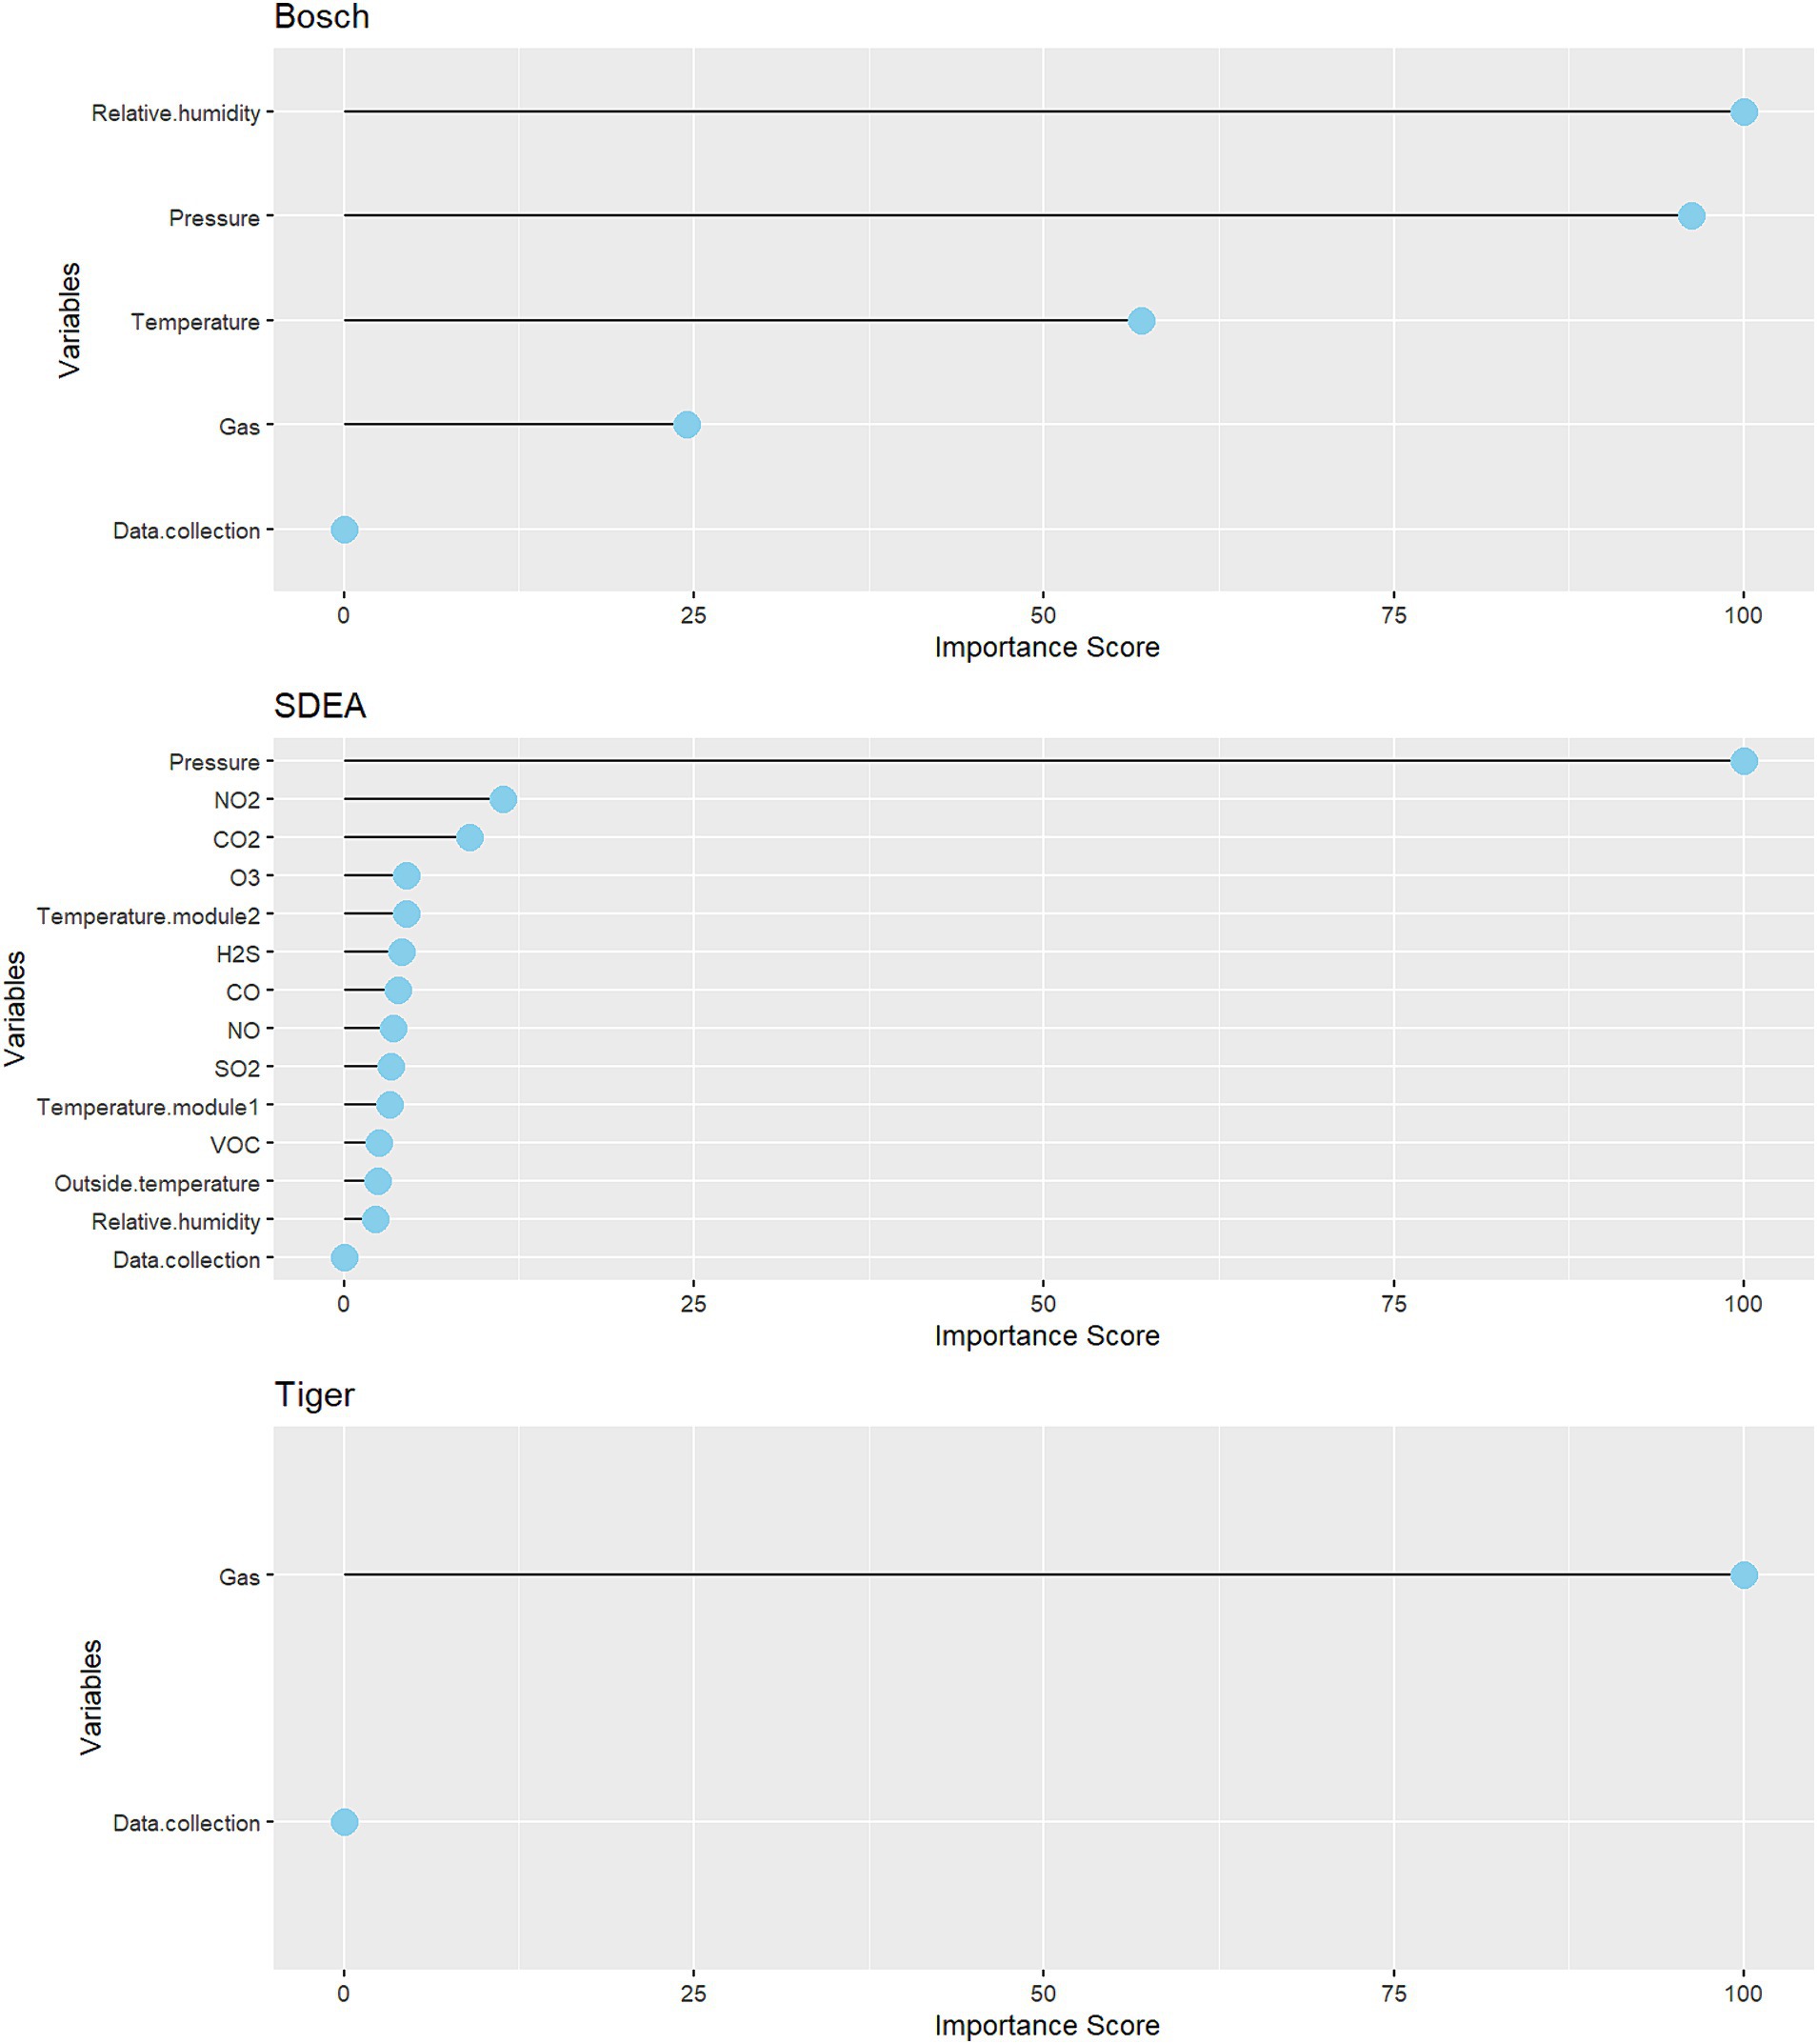
Figure 5. Overview of the importance of variables for sensor the Miniature Bosch sensor device, the Sensory device for environmental applications, the Handheld VOC Detector Tiger. The importance score of 100 indicates that the variable affects the model predictions most, while the variable with an importance score of 0 is irrelevant to the model’s predictive ability, i.e., the least.
For the Miniature Bosch sensor device, the relative humidity sensor (100.00) had the most important influence on the predictive ability to detect infestation or healthy forest, followed by the pressure sensor (98.12) and temperature sensor (57.97). In the case of infested trees, it reduces the transpiration flow in the tree; with less water capacity, the trees cannot regulate the temperature profile and thus can lead to overheats. The reduction of transpiration close to the tree affects the air humidity and the pressure in the environment (slight increase); dry air is denser than humid air. A sensor unit measuring gases had a moderate effect on the model, and by 22.86. The variable “Data collection” did not affect the model (0.00), which means that the model performed very well for all data collections. The SDEA, which also achieved a very high predictive ability, had the most significant variable, the pressure-sensitive sensor (100.00), followed by the chemical sensor cross-sensitive to NO2 gas (11.17). The cross-sensitive sensor to CO2 gas had an effect of 9.92 on the model, and the sensor sensitive to H2S (5.34). The outdoor temperature slightly affected the predictive ability, namely 3.73 and the humidity sensor (1.75). Measurement time (Data Collection variable) also did not affect the model, and predictive ability was achieved for the entire measurement. The Handheld VOC Detector Tiger did not achieve a good prediction ability for identifying stress in the forest ecosystem; based on the comparison of the importance of the variables, the gas sensor achieved 100.00, and the variable “Data collection” was also 0.00. The complete variable importance results for all three electronic noses are shown in Appendix.
4 Discussion
Based on our research findings, we can answer the scientific questions posed. We conclude that electronic noses can detect changes in volatile compounds and microclimate cues after bark beetle infestation. The Miniature Bosch sensor device achieved the highest accuracy in distinguishing forest sections that are healthy and infested (more addressed in Section 4.2 Electronic noses), and a more significant indicator of infestation was relative humidity, temperature, and pressure sensors (more discussed in Section 4.3 Influence of variables from statistical evaluation).
The presented methodology is a potential solution for the early identification of stress in forest stands, focusing on fresh attacks till 1 week old caused by bark beetle infestation. Early detection is essential for minimizing the spread of bark beetles to surrounding trees and thus reducing ecological and economic loss. In the case of late detection of the infestation, the bark beetle will spread to other trees, and from the point of view of safety and preventing further spread, the best solution is to cut down the trees and take them safely away from the forest stands. The financial costs must be allocated to the cutting and restoring forest stands. On small-scale clearings created because of natural disturbances, it is possible to reforest by natural regeneration if there are mature forest stands in the surrounding stands; in the case of large-scale sites, the natural distribution of sowing may be insufficient, and it is necessary to use artificial afforestation.
4.1 Detection methods
Conventional methods of infestation detection are field visits by forest experts and marking infested trees based on visual inspection; this method is very time and physically demanding (Stadelmann et al., 2013; Leverkus et al., 2021; Bárta et al., 2022). Remote Sensing methods can detect the deteriorated condition of the stand based on the change in the spectral reflectance of tree needles. Still, it is not possible to detect early infestation with this method. In the case of an attacked tree, the spectral reflectance of the canopy will be changed after 6–10 weeks, and only approximately 40% of the attacked trees show crown degradation; these findings do not confirm the potential of satellite or aerial detection systems (Kautz et al., 2023). Stress detection based on the analysis of crowns from a remote sensing image is challenging; the most accurate results are achieved at the end of the growing season (Latifi et al., 2018; Bárta et al., 2021; Huo et al., 2021). When using single spectral channels, the quality is insufficient; better results are achieved when using several spectral channels and calculating the vegetation index (Kautz et al., 2024). The authors of several studies argue about the importance of using the red-edge and NIR band (Abdullah et al., 2019a,b; Minařík et al., 2020; Hellwig et al., 2021; Trubin et al., 2023).
The scientific community has been mainly concerned with mapping and analyzing the healthy status of forests in the optical and near-infrared bands in the last decade. Analysis of chemical substances can bring new information about natural disturbances and help with early detection. In the case of monitoring bark beetle infestation of spruce stands, it is possible to focus on odor mapping; on the one hand, the bark beetle uses an aggregation pheromone to communicate with its individuals; still, the presence of pheromones in the forest is below the mark of the sensitivity and selectivity of electronic sensors; on the other hand it is possible to map biogenic volatile organic substances, which are secreted from the bark of trees; in the case of stress events, these substances are secreted in several times larger quantities. Therefore, chemical mapping could provide a very effective source of information about the attack, even at an early stage. We proved the detection ability of early infestation by electronic noses up to 1 week from the first attack. Early attack can be detected using specially trained snifferdogs, which can detect synthetic semiochemicals (identical to the species-specific major pheromone components of Eurasian spruce bark beetle) (Johansson et al., 2019; Vošvrdová et al., 2023). Chemical mapping is already conventionally used in security and industry, e.g., for detecting the leakage of dangerous gases or mapping air quality in cities, and several studies have already appeared in agriculture that intend to detect crop pests (Zhou and Wang, 2011; Abdullah et al., 2018; Arroyo et al., 2020; Rahman et al., 2020; Fuentes et al., 2021; Sudama et al., 2022).
4.2 Electronic noses
Of the tested electronic noses, the Miniature Bosch sensor device achieved the best capabilities, followed by a Sensory device for environmental applications. The Miniature Bosch sensor device, with a very favorable price, could be used to create a more comprehensive network of stationary measurements in spruce stands for early identification of stress factors. So, it would perform a function like the detection sensors for triggering the smoke detection alarm. The sensors could send the values to the cloud in real-time and display them on the map portal. We recommend and will further use a Sensory device for environmental applications to map local areas with a risk of a bark beetle outbreak due to its software equipment, which can show measurement results in real-time and has GPS. A possible interaction here for both mentioned electronic noses is with a drone platform, where a larger area of the forest ecosystem could be explored; the detection capability above the forest canopy has not yet been proven, and a potential solution appears to be collecting data under the forest canopy with manual flight mode.
Paczkowski et al. (2021) research focused on testing the applicability of sensors GGS1330, GGS2330, and GGS5330 to detect aggregation pheromone and biogenic volatile organic compounds; the results show the potential use of this device to verify the detectability of alpha-pinene, which is the main component of biogenic volatile organic compounds from spruce stands when their sensor was able to capture different concentrations. The detection capability of elevated concentrations has not been demonstrated by UAV data collection above canopies. Similar results were also obtained by Hüttnerová et al. (2023), where the electronic nose Sniffer4D with DJI Matrice 600 Pro was verified for early detection of bark beetles; the ability of the electronic nose to detect increased concentrations of chemical substances was also not confirmed, but the detection ability of the electronic nose was demonstrated under the crowns when they were data collected on the ground and the research find out that wide-range Hydrogen Chloride (HCL) sensor performed most reliably. The results of this study and the conclusions published by Paczkowski et al. (2021) and Hüttnerová et al. (2023) demonstrate the ability of electronic noses to detect specific substances present in forest stands when attacked by bark beetles.
4.3 Influence of variables from statistical evaluation
Our research proved the influence of variables that represented non-optical measurement. The relative humidity, temperature, and pressure sensors were a more significant indicator of infestation. Bark beetle is associated with symbiotic ophiostomatoid fungi that degrade spruce toxins, help to exhaust tree defenses, and thus lead to impaired conductive tissues and reduce transpiration (Netherer et al., 2021, 2024). Transpiration has a cooling effect on trees and an effect on air humidity; reduced transpiration leads to changes in local humidity, and this can increase air pressure. Differences in humidity are logical, but identifying differences between infected and healthy forests on rainy or cold cloudy days will not work because healthy trees do not transpire under these conditions.
In the case of infested trees, the transpiration flow is reduced in the tree; with less water capacity, the trees cannot regulate the temperature profile and thus can lead to overheats. The reduction of transpiration close to the tree affects the air humidity and the pressure in the environment (slight increase); dry air is denser than humid air. Another factor that can cause an increase in air temperature is canopy loss due to bark degradation (Anderegg et al., 2013; Wehner and Stednick, 2017).
Long-term microclimate changes were demonstrated in study Kopáček et al. (2020), and the changes were attributed to reducing or stopping tree transpiration of trees; there was an increase in daily mean air temperature (2 m above ground) of 1.6 and 0.5°C per year, and relative humidity was on the disturbed plots of land on average 4% lower. In our research, we noted much faster changes in microclimate clues, which suggests that the changes will manifest themselves significantly faster.
4.4 Limitations and future challenges
The presented methodology offers the possibility of early detection of bark beetle infestation based on identifying volatile compounds and microclimate cues found in the forest environment during bark beetle attack. With this methodology, it is not necessary to rely only on the spectral changes of the tree canopy to identify infestations. The limitation of this methodology is currently the size range of the area we can analyze. A time-efficient innovative method is the use of snifferdogs, which are twice as fast in detecting bark beetle infestation as human experts; the searching abilities of a dog are four times higher than human experts in the case of randomized plots because the dog can smell the pheromone at a greater distance (Vošvrdová et al., 2023).
For the possibilities of a large-scale detection system, it would be advisable to use the UAV platform and first try to verify the detection above the tree canopy, which has not been confirmed for the time being, or to test the possibilities of flying under the tree canopy. The battery capacity limits the data collection by the drone; the average flight time is about 30 min, depending on its load. A potential solution would also be creating a warning mapping system, where each electronic nose would be connected to a cloud system and send the currently measured values from the forest area in real-time. The system could serve as a suitable screening method of a preventive nature; for this purpose, the use of the Miniature Bosch sensor device would be appropriate in terms of its dimensions and financial availability.
In the case of global use, it would be necessary to recalibrate our model to local conditions; for example, a different climate can be predicted in Northern Europe than in the tested conditions in Czechia. However, we know from research which variables are significant for tested electronic noses and identify early bark beetle infestation.
5 Conclusion
In this study, we focused on evaluating three electronic noses for stress detection in forest stands, which were heavily attacked by bark beetles. This research aims at early detection of bark beetle infestation by novel technology of odor mapping as a more viable alternative to optical detection, which may be unreliable if the trees do not demonstrate signs of beetle attack. The possibility of detecting beetles by odor signals was clearly proven to be possible using dogs (Johansson et al., 2019; Vošvrdová et al., 2023). The predictive ability of electronic noses was evaluated based on machine learning model with two classes (“Healthy”, “Infested”), we found that electronic noses can obtain sensitive information about stressors in forest ecosystems and thus help detect problematic areas for further analysis or action. The Miniature Bosch sensor device achieved the highest values for the ability to predict the infested trees, followed by Sensory devices for environmental applications. The presented methodology provides a very effective and fast solution for stress monitoring in forest stands, mainly for detecting bark beetle outbreaks. This monitoring could contribute to more effective mapping and prediction of the spread of infestations in forest ecosystems, thus radically minimizing the ecological and economic damages caused by insect pests.
Data availability statement
The raw data supporting the conclusions of this article will be made available by the authors, without undue reservation.
Ethics statement
Written informed consent was obtained from the individual(s) for the publication of any identifiable images or data included in this article.
Author contributions
TH: Conceptualization, Data curation, Formal analysis, Funding acquisition, Investigation, Methodology, Project administration, Resources, Software, Visualization, Writing – original draft. PS: Conceptualization, Formal analysis, Investigation, Methodology, Software, Supervision, Writing – review & editing, Funding acquisition.
Funding
The author(s) declare financial support was received for the research, authorship, and/or publication of this article. This research was funded by Czech University of Life Sciences, Faculty of Forestry and Wood Sciences IGA/A_26_23 and by the Technological Agency of the Czech Republic through program CHIST-ERA, grant number TH74010001.
Conflict of interest
The authors declare that the research was conducted in the absence of any commercial or financial relationships that could be construed as a potential conflict of interest.
Publisher’s note
All claims expressed in this article are solely those of the authors and do not necessarily represent those of their affiliated organizations, or those of the publisher, the editors and the reviewers. Any product that may be evaluated in this article, or claim that may be made by its manufacturer, is not guaranteed or endorsed by the publisher.
References
Abdullah, H., Skidmore, A. K., Darvishzadeh, R., and Heurich, M. (2019a). Sentinel-2 accurately maps green-attack stage of European spruce bark beetle (Ips typographus, L.) compared with Landsat-8. Remote Sens. Ecol. Conserv. 5, 87–106. doi: 10.1002/rse2.93
Abdullah, H., Skidmore, A. K., Darvishzadeh, R., and Heurich, M. (2019b). Timing of red-edge and shortwave infrared reflectance critical for early stress detection induced by bark beetle (Ips typographus, L.) attack. Int. J. Appl. Earth Obs. Geoinf. 82:101900. doi: 10.1016/j.jag.2019.101900
Abdullah, A. H., Sudin, S., Mat Ajit, M. I., Ahmad Saad, F. S., Kamaruddin, K., Ghazali, F., et al. (2018). Development of ESP32-based Wi-Fi electronic nose system for monitoring LPG leakage at gas cylinder refurbish plant. In 2018 International Conference on Computational Approach in Smart Systems Design and Applications (ICASSDA), Kuching: IEEE, 1–5. doi: 10.1109/ICASSDA.2018.8477594
Anderegg, W. R. L., Kane, J. M., and Anderegg, L. D. L. (2013). Consequences of widespread tree mortality triggered by drought and temperature stress. Nat. Clim. Change 3, 30–36. doi: 10.1038/nclimate1635
Arroyo, P., Meléndez, F., Suárez, J. I., Herrero, J. L., Rodríguez, S., and Lozano, J. (2020). Electronic nose with digital gas sensors connected via Bluetooth to a smartphone for air quality measurements. Sensors 20:786. doi: 10.3390/s20030786
Aussenac, G. (2000). Interactions between forest stands and microclimate: ecophysiological aspects and consequences for silviculture. Ann. For. Sci. 57, 287–301. doi: 10.1051/forest:2000119
Bárta, V., Hanuš, J., Dobrovolný, L., and Homolová, L. (2022). Comparison of field survey and remote sensing techniques for detection of bark beetle-infested trees. For. Ecol. Manag. 506:119984. doi: 10.1016/j.foreco.2021.119984
Bárta, V., Lukeš, P., and Homolová, L. (2021). Early detection of bark beetle infestation in Norway spruce forests of Central Europe using Sentinel-2. Int. J. Appl. Earth Obs. Geoinf. 100:102335. doi: 10.1016/j.jag.2021.102335
Birgersson, G., Schlyter, F., Löfqvist, J., and Bergström, G. (1984). Quantitative variation of pheromone components in the spruce bark beetleIps typographus from different attack phases. J. Chem. Ecol. 10, 1029–1055. doi: 10.1007/BF00987511
Bozzini, A., Brugnaro, S., Morgante, G., Santoiemma, G., Deganutti, L., Finozzi, V., et al. (2024). Drone-based early detection of bark beetle infested spruce trees differs in endemic and epidemic populations. Front. For. Glob. Change 7:1385687. doi: 10.3389/ffgc.2024.1385687
Cellini, A., Blasioli, S., Biondi, E., Bertaccini, A., Braschi, I., and Spinelli, F. (2017). Potential applications and limitations of electronic nose devices for plant disease diagnosis. Sensors 17:2596. doi: 10.3390/s17112596
Cohen, J. (1960). A coefficient of agreement for nominal scales. Educ. Psychol. Meas. 20, 37–46. doi: 10.1177/001316446002000104
Czech Hydrometeorological Institute (2023). Historical data: weather: maps of climate characteristics. Czech Hydrometeorological Institute. Available at: https://www.chmi.cz/historicka-data/pocasi/uzemni-teploty (accessed May 16, 2024).
Davison, A. C., and Hinkley, D. V. (1997). Bootstrap methods and their application. 1st Edn. Cambridge: Cambridge University Press.
Deshmukh, S., Bandyopadhyay, R., Bhattacharyya, N., Pandey, R. A., and Jana, A. (2015). Application of electronic nose for industrial odors and gaseous emissions measurement and monitoring – an overview. Talanta 144, 329–340. doi: 10.1016/j.talanta.2015.06.050
Fernandez-Carrillo, A., Patočka, Z., Dobrovolný, L., Franco-Nieto, A., and Revilla-Romero, B. (2020). Monitoring bark beetle Forest damage in Central Europe. A remote sensing approach validated with field data. Remote Sens. 12:3634. doi: 10.3390/rs12213634
Fuentes, S., Tongson, E., Unnithan, R. R., and Gonzalez Viejo, C. (2021). Early detection of aphid infestation and insect-plant interaction assessment in wheat using a low-cost electronic nose (E-nose), near-infrared spectroscopy and machine learning modeling. Sensors 21:5948. doi: 10.3390/s21175948
Geiger, R., Aron, R. H., and Todhunter, P. (1995). The climate near the ground. Wiesbaden: Vieweg+Teubner Verlag.
Ghimire, R. P., Kivimäenpää, M., Blomqvist, M., Holopainen, T., Lyytikäinen-Saarenmaa, P., and Holopainen, J. K. (2016). Effect of bark beetle (Ips typographus L.) attack on bark VOC emissions of Norway spruce (Picea abies karst.) trees. Atmos. Environ. 126, 145–152. doi: 10.1016/j.atmosenv.2015.11.049
Gitelson, A. A., and Merzlyak, M. N. (1997). Remote estimation of chlorophyll content in higher plant leaves. Int. J. Remote Sens. 18, 2691–2697. doi: 10.1080/014311697217558
Hais, M., Wild, J., Berec, L., Brůna, J., Kennedy, R., Braaten, J., et al. (2016). Landsat imagery spectral trajectories—important variables for spatially predicting the risks of bark beetle disturbance. Remote Sens. 8:687. doi: 10.3390/rs8080687
Hakola, H., Taipale, D., Praplan, A., Schallhart, S., Thomas, S., Tykkä, T., et al. (2023). Emissions of volatile organic compounds from Norway spruce and potential atmospheric impacts. Front. For. Glob. Change 6:1116414. doi: 10.3389/ffgc.2023.1116414
Hellwig, F. M., Stelmaszczuk-Górska, M. A., Dubois, C., Wolsza, M., Truckenbrodt, S. C., Sagichewski, H., et al. (2021). Mapping European spruce bark beetle infestation at its early phase using gyrocopter-mounted hyperspectral data and field measurements. Remote Sens. 13:4659. doi: 10.3390/rs13224659
Hlásny, T., Krokene, P., Liebhold, A., Montagné-Huck, C., Müller, J., Qin, H., et al. (2019). Living with bark beetles: impacts, outlook and management options. European Forest Institute. Available at: https://doi.org/10.36333/fs08
Huo, L., Persson, H. J., and Lindberg, E. (2021). Early detection of forest stress from European spruce bark beetle attack, and a new vegetation index: normalized distance red & SWIR (NDRS). Remote Sens. Environ. 255:112240. doi: 10.1016/j.rse.2020.112240
Hüttnerová, T., Paczkowski, S., Neubert, T., Jirošová, A., and Surový, P. (2023). Comparison of individual sensors in the electronic nose for stress detection in Forest stands. Sensors 23:2001. doi: 10.3390/s23042001
Jaakkola, E., Gärtner, A., Jönsson, A. M., Ljung, K., Olsson, P.-O., and Holst, T. (2022). Spruce bark beetle (Ips typographus) infestation cause up to 700 times higher bark BVOC emission rates from Norway spruce (Picea abies). Biogeosciences 20, 803–826. doi: 10.5194/bg-2022-125
Johansson, A., Birgersson, G., and Schlyter, F. (2019). Using synthetic semiochemicals to train canines to detect bark beetle–infested trees. Ann. For. Sci. 76:58. doi: 10.1007/s13595-019-0841-z
Jönsson, A. M., Schroeder, L. M., Lagergren, F., Anderbrant, O., and Smith, B. (2012). Guess the impact of Ips typographus—an ecosystem modelling approach for simulating spruce bark beetle outbreaks. Agric. For. Meteorol. 166–167, 188–200. doi: 10.1016/j.agrformet.2012.07.012
Karatzoglou, A., Smola, A., Hornik, K., and Zeileis, A. (2004). Kernlab – an S4 package for kernel methods in R. J. Stat. Soft. 11, 1–20. doi: 10.18637/jss.v011.i09
Kašpar, V., Hederová, L., Macek, M., Müllerová, J., Prošek, J., Surový, P., et al. (2021). Temperature buffering in temperate forests: comparing microclimate models based on ground measurements with active and passive remote sensing. Remote Sens. Environ. 263:112522. doi: 10.1016/j.rse.2021.112522
Kautz, M., Feurer, J., and Adler, P. (2024). Early detection of bark beetle (Ips typographus) infestations by remote sensing – a critical review of recent research. For. Ecol. Manag. 556:121595. doi: 10.1016/j.foreco.2023.121595
Kautz, M., Peter, F. J., Harms, L., Kammen, S., and Delb, H. (2023). Patterns, drivers and detectability of infestation symptoms following attacks by the European spruce bark beetle. J. Pest. Sci. 96, 403–414. doi: 10.1007/s10340-022-01490-8
Kopáček, J., Bače, R., Hejzlar, J., Kaňa, J., Kučera, T., Matějka, K., et al. (2020). Changes in microclimate and hydrology in an unmanaged mountain forest catchment after insect-induced tree dieback. Sci. Total Environ. 720:137518. doi: 10.1016/j.scitotenv.2020.137518
Kuhn, M. (2008). Building predictive models in R using the caret package. J. Stat. Soft. 28, 1–26. doi: 10.18637/jss.v028.i05
Latifi, H., Dahms, T., Beudert, B., Heurich, M., Kübert, C., and Dech, S. (2018). Synthetic RapidEye data used for the detection of area-based spruce tree mortality induced by bark beetles. Gisci. Remote Sens. 55, 839–859. doi: 10.1080/15481603.2018.1458463
Le Maire, G., François, C., and Dufrêne, E. (2004). Towards universal broad leaf chlorophyll indices using PROSPECT simulated database and hyperspectral reflectance measurements. Remote Sens. Environ. 89, 1–28. doi: 10.1016/j.rse.2003.09.004
Lehmanski, L. M. A., Kandasamy, D., Andersson, M. N., Netherer, S., Alves, E. G., Huang, J., et al. (2023). Addressing a century-old hypothesis – do pioneer beetles of Ips typographus use volatile cues to find suitable host trees? New Phytol. 238, 1762–1770. doi: 10.1111/nph.18865
Leverkus, A. B., Buma, B., Wagenbrenner, J., Burton, P. J., Lingua, E., Marzano, R., et al. (2021). Tamm review: does salvage logging mitigate subsequent forest disturbances? For. Ecol. Manag. 481:118721. doi: 10.1016/j.foreco.2020.118721
Liaw, A., and Wiener, M. (2002). Classification and regression by randomForest. Available at: https://cran.r-project.org/doc/Rnews/ (Accessed April 10, 2024).
Marini, L., Økland, B., Jönsson, A. M., Bentz, B., Carroll, A., Forster, B., et al. (2017). Climate drivers of bark beetle outbreak dynamics in Norway spruce forests. Ecography 40, 1426–1435. doi: 10.1111/ecog.02769
Minařík, R., Langhammer, J., and Lendzioch, T. (2020). Automatic tree crown extraction from UAS multispectral imagery for the detection of bark beetle disturbance in mixed forests. Remote Sens. 12:4081. doi: 10.3390/rs12244081
Moliterno, A. A. C., Jakuš, R., Modlinger, R., Unelius, C. R., Schlyter, F., and Jirošová, A. (2023). Field effects of oxygenated monoterpenes and estragole combined with pheromone on attraction of Ips typographus and its natural enemies. Front. For. Glob. Change 6:1292581. doi: 10.3389/ffgc.2023.1292581
Morecroft, M. D., Taylor, M. E., and Oliver, H. R. (1998). Air and soil microclimates of deciduous woodland compared to an open site. Agric. For. Meteorol. 90, 141–156. doi: 10.1016/S0168-1923(97)00070-1
Müller, M., Olsson, P.-O., Eklundh, L., Jamali, S., and Ardö, J. (2022). Features predisposing forest to bark beetle outbreaks and their dynamics during drought. For. Ecol. Manag. 523:120480. doi: 10.1016/j.foreco.2022.120480
Netherer, S., Kandasamy, D., Jirosová, A., Kalinová, B., Schebeck, M., and Schlyter, F. (2021). Interactions among Norway spruce, the bark beetle Ips typographus and its fungal symbionts in times of drought. J. Pest. Sci. 94, 591–614. doi: 10.1007/s10340-021-01341-y
Netherer, S., Lehmanski, L., Bachlehner, A., Rosner, S., Savi, T., Schmidt, A., et al. (2024). Drought increases Norway spruce susceptibility to the Eurasian spruce bark beetle and its associated fungi. New Phytol. 242, 1000–1017. doi: 10.1111/nph.19635
Paczkowski, S., Datta, P., Irion, H., Paczkowska, M., Habert, T., Pelz, S., et al. (2021). Evaluation of early bark beetle infestation localization by drone-based monoterpene detection. Forests 12:228. doi: 10.3390/f12020228
Patacca, M., Lindner, M., Lucas-Borja, M. E., Cordonnier, T., Fidej, G., Gardiner, B., et al. (2023). Significant increase in natural disturbance impacts on European forests since 1950. Glob. Chang. Biol. 29, 1359–1376. doi: 10.1111/gcb.16531
Pobkrut, T., Eamsa-ard, T., and Kerdcharoen, T. (2016). Sensor drone for aerial odor mapping for agriculture and security services. In 2016 13th International Conference on Electrical Engineering/Electronics, Computer, Telecommunications and Information Technology (ECTI-CON), Chiang Mai, Thailand: IEEE, 1–5. doi: 10.1109/ECTICon.2016.7561340
Rahman, S., Alwadie, A. S., Irfan, M., Nawaz, R., Raza, M., Javed, E., et al. (2020). Wireless E-nose sensors to detect volatile organic gases through multivariate analysis. Micromachines 11:597. doi: 10.3390/mi11060597
Schelhaas, M., Nabuurs, G., and Schuck, A. (2003). Natural disturbances in the European forests in the 19th and 20th centuries. Glob. Chang. Biol. 9, 1620–1633. doi: 10.1046/j.1365-2486.2003.00684.x
Stadelmann, G., Bugmann, H., Meier, F., Wermelinger, B., and Bigler, C. (2013). Effects of salvage logging and sanitation felling on bark beetle (Ips typographus L.) infestations. For. Ecol. Manag. 305, 273–281. doi: 10.1016/j.foreco.2013.06.003
Sudama, K. A., Rivai, M., Aulia, D., and Mujiono, T. (2022). Electronic nose based on gas sensor Array and neural network for indoor hydrogen gas control system. In 2022 1st International Conference on Information System & Information Technology (ICISIT), Yogyakarta, Indonesia: IEEE, 187–192. doi: 10.1109/ICISIT54091.2022.9872796
Tiele, A., Wicaksono, A., Ayyala, S. K., and Covington, J. A. (2020). Development of a compact, IoT-enabled electronic nose for breath analysis. Electronics 9:84. doi: 10.3390/electronics9010084
Trubin, A., Kozhoridze, G., Zabihi, K., Modlinger, R., Singh, V. V., Surový, P., et al. (2023). Detection of susceptible Norway spruce to bark beetle attack using planet scope multispectral imagery. Front. For. Glob. Change 6:1130721. doi: 10.3389/ffgc.2023.1130721
Vošvrdová, N., Johansson, A., Turčáni, M., Jakuš, R., Tyšer, D., Schlyter, F., et al. (2023). Dogs trained to recognise a bark beetle pheromone locate recently attacked spruces better than human experts. For. Ecol. Manag. 528:120626. doi: 10.1016/j.foreco.2022.120626
Wehner, C. E., and Stednick, J. D. (2017). Effects of mountain pine beetle-killed forests on source water contributions to streamflow in headwater streams of the Colorado Rocky Mountains. Front. Earth Sci. 11, 496–504. doi: 10.1007/s11707-017-0660-1
Xing, Y., Vincent, T., Cole, M., and Gardner, J. (2019). Real-time thermal modulation of high bandwidth MOX gas sensors for mobile robot applications. Sensors 19:1180. doi: 10.3390/s19051180
Ye, Z., Liu, Y., and Li, Q. (2021). Recent progress in smart electronic nose technologies enabled with machine learning methods. Sensors 21:7620. doi: 10.3390/s21227620
Zarco-Tejada, P. J., Miller, J. R., Noland, T. L., Mohammed, G. H., and Sampson, P. H. (2001). Scaling-up and model inversion methods with narrowband optical indices for chlorophyll content estimation in closed forest canopies with hyperspectral data. IEEE Trans. Geosci. Remote Sens. 39, 1491–1507. doi: 10.1109/36.934080
Zhang, N., Zhang, X., Yang, G., Zhu, C., Huo, L., and Feng, H. (2018). Assessment of defoliation during the Dendrolimus tabulaeformis Tsai et Liu disaster outbreak using UAV-based hyperspectral images. Remote Sens. Environ. 217, 323–339. doi: 10.1016/j.rse.2018.08.024
Zhou, B., and Wang, J. (2011). Use of electronic nose technology for identifying rice infestation by Nilaparvata lugens. Sensors Actuators B Chem. 160, 15–21. doi: 10.1016/j.snb.2011.07.002
Appendix
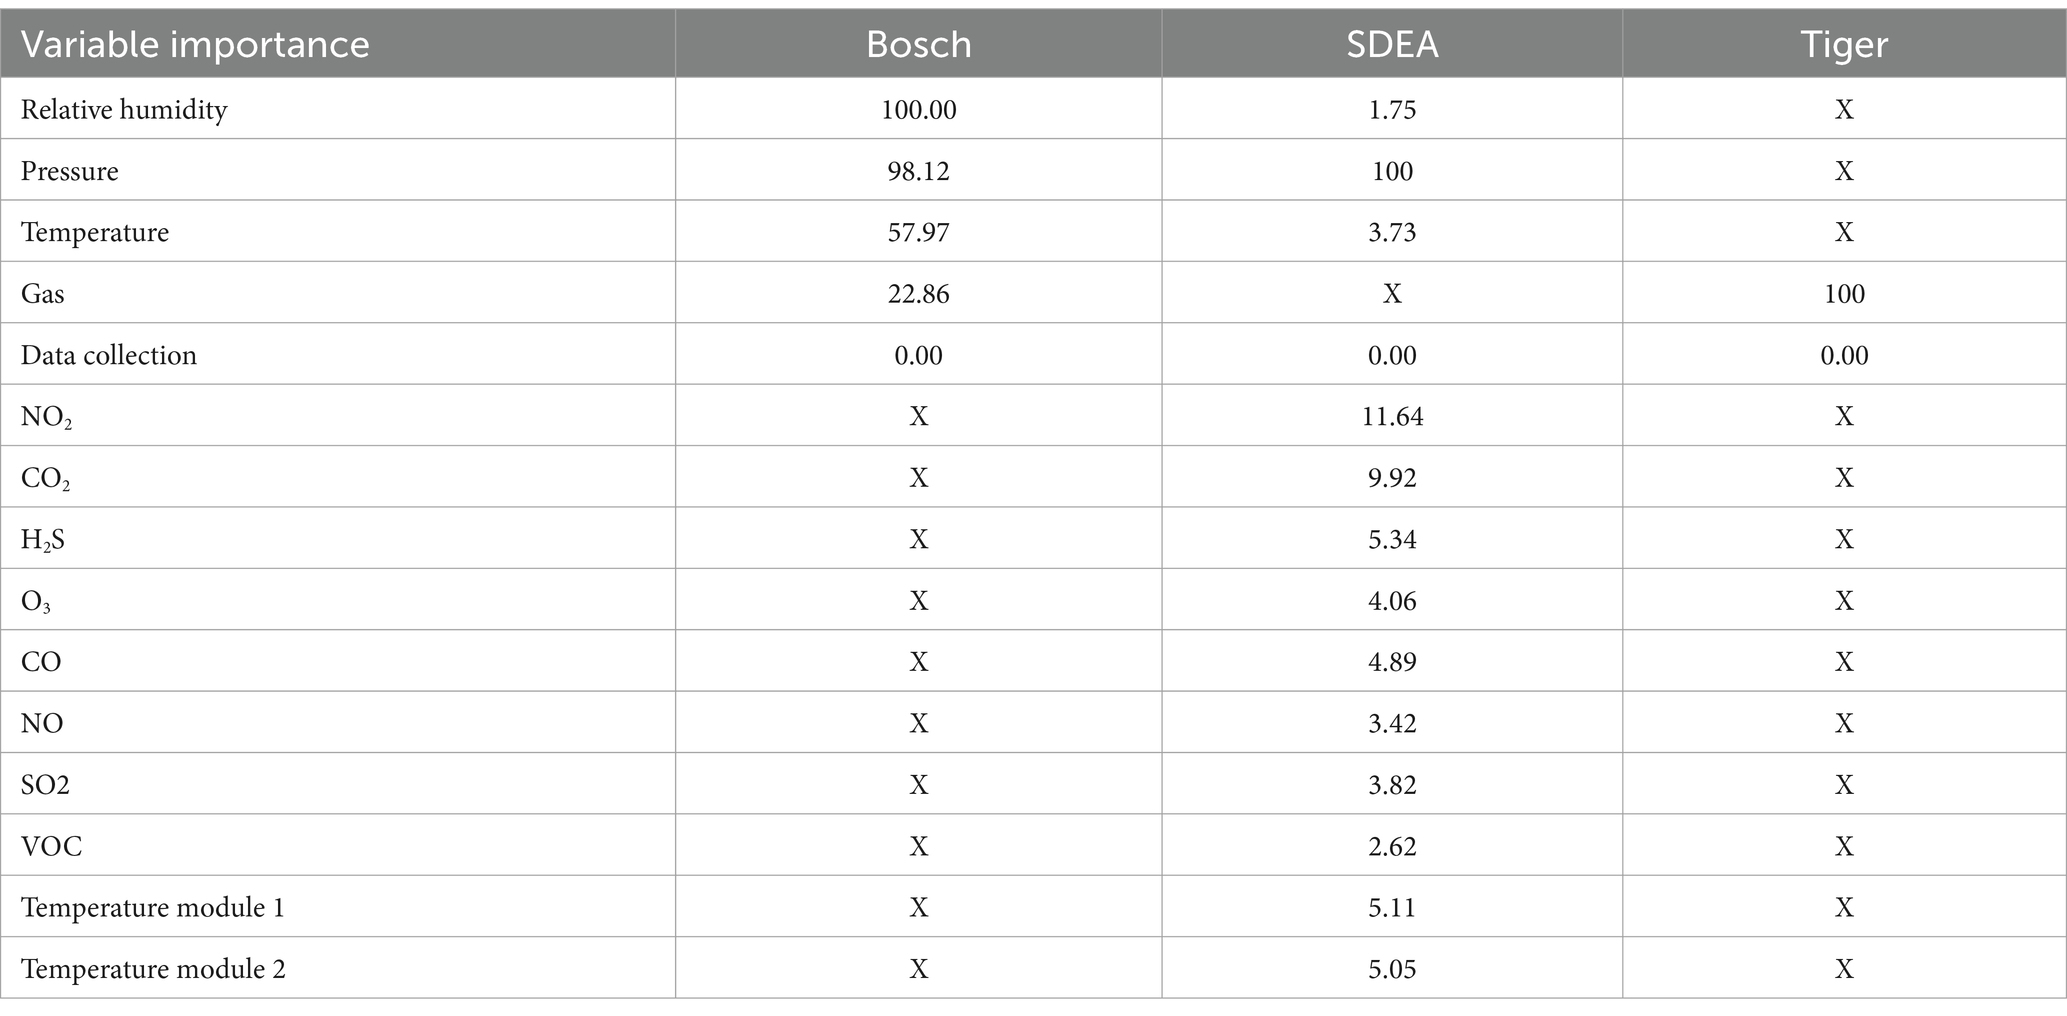
Table A1. Output data from the Random Forest machine learning model used for evaluation of variables importance.
Keywords: electronic noses, forest disturbances, odor mapping, stress detection, bark beetle, early detection
Citation: Hüttnerová T and Surový P (2024) Bark beetle detection method using electronic nose sensors. A possible improvement of early forest disturbance detection? Front. For. Glob. Change. 7:1445094. doi: 10.3389/ffgc.2024.1445094
Edited by:
Milica Zlatkovic, University of Novi Sad, SerbiaReviewed by:
Fredrik Schlyter, Czech University of Life Sciences Prague, CzechiaManuela Branco, University of Lisbon, Portugal
Copyright © 2024 Hüttnerová and Surový. This is an open-access article distributed under the terms of the Creative Commons Attribution License (CC BY). The use, distribution or reproduction in other forums is permitted, provided the original author(s) and the copyright owner(s) are credited and that the original publication in this journal is cited, in accordance with accepted academic practice. No use, distribution or reproduction is permitted which does not comply with these terms.
*Correspondence: Tereza Hüttnerová, aHV0dG5lcm92YXRAZmxkLmN6dS5jeg==